ANALYSIS AND DESIGN OF POWER CONDITIONING SYSTEMS FOR FUEL CELL POWERED SYSTEMS A Dissertation by MAJA HARFMAN TODOROVIC Submitted to the Office of Graduate Studies of Texas A&M University in partial fulfillment of the requirements for the degree of DOCTOR OF PHILOSOPHY May 2008 Major Subject: Electrical Engineering

Welcome message from author
This document is posted to help you gain knowledge. Please leave a comment to let me know what you think about it! Share it to your friends and learn new things together.
Transcript

ANALYSIS AND DESIGN OF POWER CONDITIONING SYSTEMS
FOR FUEL CELL POWERED SYSTEMS
A Dissertation
by
MAJA HARFMAN TODOROVIC
Submitted to the Office of Graduate Studies of Texas A&M University
in partial fulfillment of the requirements for the degree of
DOCTOR OF PHILOSOPHY
May 2008
Major Subject: Electrical Engineering
ANALYSIS AND DESIGN OF POWER CONDITIONING SYSTEMS
FOR FUEL CELL POWERED SYSTEMS
A Dissertation
by
MAJA HARFMAN TODOROVIC
Submitted to the Office of Graduate Studies of Texas A&M University
in partial fulfillment of the requirements for the degree of
DOCTOR OF PHILOSOPHY
Approved by:
Chair of Committee, Prasad Enjeti Committee Members, Hamid Toliyat Aniruddha Datta Anthony J. Appleby Head of Department, Costas Georghiades
May 2008
Major Subject: Electrical Engineering

iii
ABSTRACT
Analysis and Design of Power Conditioning Systems for Fuel Cell Powered Systems.
(May 2008)
Maja Harfman Todorovic, B.S., University of Belgrade;
M.S., Texas A&M University
Chair of Advisory Committee: Dr. Prasad Enjeti
A combination of high prices of fossil fuels and the increased awareness of their
negative environmental impact has influenced the development of new cleaner energy
sources. Among various viable technologies, fuel cells have emerged as one of the most
promising sources for both portable and stationary applications.
Fuel cell stacks produce DC voltage with a 2:1 variation in output voltage from no
load to full load conditions. Hence, to increase the utilization efficiency and system
stability, a power conditioner consisting of DC-DC and DC-AC converters is required
for load interface. The design of power conditioners is driven by the application. This
dissertation presents several different solutions for applications ranging from low-power
portable sources for small electronics and laptop computers to megawatt-power
applications for fuel cell power plants. The design and analysis for each power
conditioner is presented in detail and the performance is verified using simulations and
prototypes.

iv
Special consideration is given to the role of supercapacitors who act as the additional
energy storage elements. It is shown that the supercapacitor connected at the terminals of
a fuel cell can contribute to increased steady state stability when powering constant
power loads, improved transient stability against load transients, and increased fuel
efficiency (i.e. reduced hydrogen consumption).

v
ACKNOWLEDGEMENTS
I would like to express my gratitude to my advisor, Dr. Prasad Enjeti, for his
technical and theoretical support, guidance and encouragement throughout my graduate
studies. I would like to thank all my committee members, Dr. Toliyat, Dr. Datta and Dr.
Appleby, for their help, time and concern. Also, I would like to thank all my fellow
students working in the power electronics and power quality laboratory at Texas A&M
University, especially Leonardo Palma, and Mirunalini Chellappan for their help and
guidance.
Most of all, I am grateful to my parents Radmila and Vitomir Harfman, my husband
Milos, and our daughter Ema for their love, support and encouragement.

vi
TABLE OF CONTENTS
Page
ABSTRACT .............................................................................................................. iii
ACKNOWLEDGEMENTS ...................................................................................... v
TABLE OF CONTENTS .......................................................................................... vi
LIST OF FIGURES................................................................................................... ix
LIST OF TABLES .................................................................................................... xiv
CHAPTER I INTRODUCTION................................................................................ 1
1.1 Introduction .................................................................................... 1 1.2 Fuel cell technology ....................................................................... 3 1.3 Fuel cell promise ............................................................................ 6 1.4 Designing a hybrid source.............................................................. 9 1.5 Distribution architecture for laptop computers .............................. 12 1.6 Fuel cell powered UPS................................................................... 15 1.7 High megawatt converter topologies for fuel cell based power
plants .............................................................................................. 16 1.8 Previous work................................................................................. 18 1.9 Research objective ......................................................................... 21 1.10 Dissertation outline ...................................................................... 23
II THE ROLE OF SUPERCAPACITORS IN DESIGNING FUEL CELL
POWERED PORTABLE APPLICATIONS ....................................... 26
2.1 Introduction .................................................................................... 26 2.1 Fuel cell equivalent circuit ............................................................. 27 2.2 Nonlinear model of supercapacitor ................................................ 31 2.3 Power conditioner for portable fuel cell system ............................ 34 2.4 Fuel cell and DC-DC converter interaction ................................... 36
2.4.1 Steady state stability.............................................................. 36 2.4.2 Transient stability.................................................................. 39 2.4.3 Experimental results.............................................................. 46

vii
CHAPTER Page
2.5 Influence of supercapacitor on hydrogen fuel consumption .......... 48 2.6 Conclusion...................................................................................... 50
III A HYBRID DC-DC CONVERTER FOR FUEL CELL POWERED
LAPTOP COMPUTERS...................................................................... 52
3.1 Introduction .................................................................................... 52 3.2 The power consumption of a laptop computer............................... 55 3.3 Conventional power distribution architecture of a laptop
computer......................................................................................... 56 3.4 Power distribution architectures for laptop computers powered
by a fuel cell ................................................................................... 57 3.4.1 Proposed power distribution architecture # 1........................ 58 3.4.2 Proposed power distribution architecture # 2........................ 61 3.4.3 Proposed power distribution architecture # 3........................ 63 3.4.4 Proposed power distribution architecture # 4........................ 65
3.5 Design example for proposed power distribution architecture # 2 66 3.6 Experimental results for proposed power distribution architecture
# 2 ................................................................................................... 72 3.7 Conclusion...................................................................................... 75
IV DESIGN CONSIDERATIONS FOR FUEL CELL POWERED UPS 77
4.1 Introduction .................................................................................... 77 4.2 Classification of UPS systems ....................................................... 79
4.2.1 Offline UPS topology............................................................ 79 4.2.2 Online UPS topology ............................................................ 80 4.2.3 Line interactive UPS topology .............................................. 81
4.3 Proposed fuel cell powered UPS system architecture.................... 82 4.4 Full bridge two-inductor rectifier................................................... 87 4.5 Fuel cell equivalent circuit ............................................................. 88 4.6 Steady state stability....................................................................... 90 4.7 Transient stability........................................................................... 92 4.8 Design example .............................................................................. 97
4.8.1 Specifications of the proposed fuel cell powered UPS ......... 97 4.8.2 Fuel capacity ......................................................................... 99 4.8.3 Supercapacitor sizing ............................................................ 101 4.8.4 Full bridge converter design.................................................. 102 4.8.5 Inverter output filter design considerations........................... 104
4.9 Conclusion...................................................................................... 108

viii
CHAPTER Page
V HIGH MEGAWATT CONVERTER TOPOLOGIES FOR FUEL
CELL BASED POWER PLANTS....................................................... 110
5.1 Introduction .................................................................................... 110 5.2 Conventional approach................................................................... 111 5.3 Novel high mega watt topologies................................................... 115
5.3.1 Topology #1 .......................................................................... 115 5.3.2 Topology #2 .......................................................................... 116 5.3.3 Topology #3 .......................................................................... 117 5.3.4 Topology #4 .......................................................................... 118 5.3.5 Topology #5 .......................................................................... 119
5.4 Comparison .................................................................................... 120 5.5 Common mode analysis ................................................................. 123
5.5.1 Topology #1 .......................................................................... 125 5.5.2 Topologies #2 and #3 ............................................................ 130 5.5.3 Topology #4 .......................................................................... 133 5.5.4 Topology #5 .......................................................................... 136 5.5.5 Reduction of common mode current..................................... 140
5.6 Conclusion...................................................................................... 145 VI CONCLUSIONS.................................................................................. 147
REFERENCES.......................................................................................................... 151
VITA…………. ........................................................................................................ 159

ix
LIST OF FIGURES
Page
Fig. 1. Fuel cell diagram.................................................................................. 5
Fig. 2. Block diagram of a fuel cell power system.......................................... 6
Fig. 3. Fuel cell and battery energy density vs. specific energy...................... 7
Fig. 4. Small signal representation of portable system powered by hybrid
source ................................................................................................... 11
Fig. 5. Fuel cell with supercapacitors powering the laptop computer............. 13
Fig. 6. Conventional laptop power management architecture ......................... 14
Fig. 7. Circuit topology of the proposed fuel cell powered UPS system ........ 16
Fig. 8. Equivalent circuit for a PEM fuel cell.................................................. 28
Fig. 9. Test setup for measuring the frequency respond of the PEM fuel cell 29
Fig. 10. Nyquist plot for a 30W fuel cell stack ................................................. 30
Fig. 11. Nyquist plot for a Maxwell PC10 supercapacitor ................................ 32
Fig. 12. Equivalent circuit for a PC10 supercapacitor....................................... 33
Fig. 13. Fuel cell powered portable system....................................................... 35
Fig. 14. Fuel cell V-I characteristic and load constant power locus.................. 37
Fig. 15. Fuel cell voltage during the purging interval for a 30W stack
supplying 1.73A ................................................................................... 38
Fig. 16. Fuel cell DC-DC converter system ...................................................... 40
Fig. 17. Modeling of the fuel cell impedance effect.......................................... 40

x
Page
Fig. 18. a) Small-signal models for boost converter. b) When connected to a
fuel cell ................................................................................................. 42
Fig. 19. Impedances for fuel cell boost converter system ................................. 43
Fig. 20. Small signal representation of portable system powered by hybrid
source ................................................................................................... 45
Fig. 21. Effect of forming the hybrid source ..................................................... 46
Fig. 22. Dynamic behavior of a) Stand-alone fuel cell system b) Hybrid
source system ....................................................................................... 47
Fig. 23. Hydrogen flow for the a) 20W and b) 30W fuel cells as function of
load current ripple frequency with hybrid configuration or working
alone 49
Fig. 24. Toshiba’s DMFC for a laptop .............................................................. 53
Fig. 25. Measured load on a Toshiba laptop computer [32].............................. 56
Fig. 26. Conventional laptop power management architecture ......................... 57
Fig. 27. Power distribution architecture #1with an external fuel cell................ 59
Fig. 28. Synchronous boost converter for fuel cell ........................................... 59
Fig. 29. Proposed power distribution architecture # 2....................................... 62
Fig. 30. Topology of the hybrid DC-DC converter block shown in Fig. 29 ..... 62
Fig. 31. Power distribution architecture #3 ....................................................... 64
Fig. 32. Power distribution architecture # 4 ...................................................... 65
Fig. 33. Simulation results................................................................................. 69

xi
Page
Fig. 34. Load current of Dell Latitude C600 during the saving of a MS Word
document .............................................................................................. 70
Fig. 35. Load current of Dell Latitude C600 during normal use ....................... 71
Fig. 36. DC bus voltage and bi-directional inductor current with the fuel cell
connected.............................................................................................. 74
Fig. 37. DC bus voltage and fuel cell current during load switching................ 74
Fig. 38. Offline UPS configuration ................................................................... 80
Fig. 39. Online UPS configuration .................................................................... 81
Fig. 40. Line interactive UPS topology ............................................................. 81
Fig. 41. Proposed fuel cell powered passive stand-by UPS system .................. 83
Fig. 42. Circuit topology of the proposed fuel cell powered UPS system ........ 85
Fig. 43. Nyquist plot for a 1200W fuel cell stack ............................................. 89
Fig. 44. Fuel cell polarization curve and load constant power locus ................ 91
Fig. 45. Fuel cell DC-DC converter system ...................................................... 92
Fig. 46. Modeling of the fuel cell impedance effect.......................................... 93
Fig. 47. a) Small-signal models for full bridge converter; b) When connected to
a fuel cell .............................................................................................. 94
Fig. 48. Impedances for fuel cell full bridge converter system ......................... 95
Fig. 49. Control-to-output characteristic for DC-DC converter stage supplied
from ideal source and fuel cell ............................................................. 96
xii
Page
Fig. 50. Impedances for fuel cell full bridge converter with supercapacitor..... 97
Fig. 51. Ballard Nexa fuel cell........................................................................... 99
Fig. 52. Topology of a DC-AC output filter...................................................... 104
Fig. 53. Equivalent circuit for a non-linear load ............................................... 106
Fig. 54. Conventional multi stack fuel cell system with line-frequency
transformer ........................................................................................... 112
Fig. 55. Conventional multi stack fuel cell system without line-frequency
transformer ........................................................................................... 113
Fig. 56. Single-stage power conversion topology ............................................. 114
Fig. 57. Medium voltage topology #1 ............................................................... 116
Fig. 58. Medium voltage topology #2 ............................................................... 117
Fig. 59. Medium voltage topology #3 ............................................................... 117
Fig. 60. Cascaded multilevel inverter topology................................................. 118
Fig. 61. Hybrid multilevel inverter topology..................................................... 119
Fig. 62. Effect of common mode dV/dt in stray capacitances........................... 124
Fig. 63. Common mode equivalent circuit for medium voltage topology #1 a)
Detailed equivalent b) Simplified equivalent....................................... 126
Fig. 64. Circuit schematic of medium voltage topology #1 with IGCT devices 127
Fig. 65. Simulation result of medium voltage topology #1 with IGCT devices 128
Fig. 66. Circuit schematic of medium voltage topology #1 with IGBT devices 129
Fig. 67. Simulation result of medium voltage topology #1 with IGBT devices 130

xiii
Page
Fig. 68. Common mode equivalent circuit for topology #2 .............................. 131
Fig. 69. Circuit schematic of medium voltage topology #2 .............................. 131
Fig. 70 Simulation result of medium voltage topology #2............................... 132
Fig. 71. Common mode equivalent circuit for topology #4 .............................. 134
Fig. 72. Circuit schematic of medium voltage topology #4 .............................. 135
Fig. 73. Simulation result of medium voltage topology #4............................... 136
Fig. 74. Common mode equivalent circuit for topology #5 .............................. 137
Fig. 75. Circuit schematic of medium voltage topology #5 .............................. 138
Fig. 76. Simulation results of medium voltage topology #5 ............................. 139
Fig. 77. Conventional and shielded transformer ............................................... 141
Fig. 78. Simulation result of medium voltage topology #1 with shielded
transformer a) IGCT devices b) IGBT devices .................................... 142
Fig. 79. Simulation result of medium voltage topology #2 with shielded
transformer ........................................................................................... 143
Fig. 80. Simulation result of cascaded multilevel topology #4 with shielded
transformer ........................................................................................... 144
Fig. 81. Simulation result of hybrid multilevel topology #5 with shielded
transformer ........................................................................................... 145

xiv
LIST OF TABLES
TABLE Page
I Currently Developed Types of Fuel Cells and Their Characteristics and
Applications ..................................................................................................... 4
II Cost of Generating 1 kW of Energy................................................................. 9
III Short and Long-term Reserve Energy Sources for Backup Power .................. 10
IV Fuel Cell Equivalent Circuit Parameters .......................................................... 31
V Supercapacitor Equivalent Circuit Parameters................................................. 34
VI Laptop Power Consumption............................................................................. 55
VI BCS PEM Fuel Cell Specifications.................................................................. 71
VIII Characteristics of the Designed System ........................................................... 72
IX Equivalent Circuit Parameters.......................................................................... 90
X Specification of Proposed Fuel Cell Powered UPS ......................................... 98
XI Specifications of the Ballard-Nexa Fuel Cell Stack......................................... 98
XII Specification of Supercapacitor, BCAP0650 P270 (Maxwell Technologies) . 102
XIII Mega Watt Topologies Summary .................................................................... 121
XIV Mega Watt Power Topology Comparison........................................................ 122

1
CHAPTER I
INTRODUCTION
1.1 Introduction
Most of the present electric power demand in the world is met by fossil and nuclear
power plants. In recent years, we have witnessed a steadily growing interest in
ecologically clean and renewable energy technologies, such as the fuel cells, wind and
solar power plants. The United States Department of Energy (DOE) has identified the
fuel cell as a distributed energy technology that will soon be participating in the energy
market in wide variety of applications including portable power, central, auxiliary, and
transportation systems, stationary power for buildings and other distributed generation
applications.
A fuel cell is an electrochemical device that produces a DC voltage from the
hydrogen-rich fuel gas and air that flow over two cell electrodes. It is similar to
conventional battery in that both produce a direct current by using an electrochemical
process, and to combustion engine in that both will work continuously as long as the fuel
(reactants) are supplied. The main difference between the fuel cell and a battery is that
the fuel cell is not the energy storage element that needs energy from an external source
for recharging purposes.
Portable electronic technologies such as PDAs, notebook computers, and cell phones
have fueled a need for new, high-energy, small volume power supplies for both military
____________ This dissertation follows the style of IEEE Transactions on Industry Applications.

2
and commercial markets. Several of these devices are currently limited to battery
technologies, which, despite recent advances, are insufficient to provide long-term
power. In a fuel cell, power is continuous as long as the fuel and oxygen are supplied,
similar to the gasoline/engine system which is used to power a car. The engine is
purchased once (with the car) and gasoline is replenished as needed for continuous
operation. The same is true in small fuel cell systems, which are expected to someday
help power portable electronic products such as notebook computers. Fuel capsules can
be exchanged out quickly without the need to wait for recharging. Users could carry
spare fuel cartridges, not extra batteries to extend operation and enhance convenience.
Fuel cells, especially low-temperature types such as DMFC and PEMFC, are potentially
good candidates to replace batteries as power sources for the next generation of portable
applications thanks to the high energy content of their fuels.
Another very attractive application of fuel cells is uninterruptible power supply
(UPS) systems, which can help fuel cell technology to become a commercial solution. A
fuel cell’s end of life can be extended by intermittent operation of UPS systems and the
per kilowatt price associated with UPS operation, although currently one of the highest
on the market, can be driven down in the long run by fuel cell technology [1]. It is
important for the UPS system to be able to immediately take over the full load at the
inception of the power outage or out-of-tolerance situation to avoid any data or
production loss, uncontrolled system shutdown or malfunctioning of the devices.
However, fuel processors have a delay as long as several tens of seconds, and the fuel
cell cannot take over the full load if its membrane is not properly humidified [2]. For this

3
reason, a supercapacitor module is employed to compensate for these response delays by
supplying the required instantaneous energy, which is stored during the normal
operation.
In order to properly design a fuel cell’s power conditioning systems, an in-depth
analysis of fuel cell behavior is needed. Furthermore, the role of a supercapacitor in the
design of fuel cell powered systems needs to be investigated fully. The additional energy
storage provided by the supercapacitor connected at the terminals of a fuel cell
influences steady state as well as transient stability and changes the fuel efficiency.
1.2 Fuel cell technology
Fuel cells are electrochemical devices that convert hydrogen rich fuels into electric
energy directly with a high overall efficiency. Since the process of producing electric
energy avoids the intermediate steps of producing heat and mechanical work, common in
most conventional methods, fuel cells are not limited by thermal limitations such as the
Carnot efficiency. Likewise, since the process does not involve any kind of combustion,
fuel cells produce power with a minimal amount of pollutant gases.
Different types of fuel cells can be characterized by the electrolyte used. They are
listed in Table I with their main features. All of these fuel cells function in the same
basic way. A schematic representation of the fuel cell functionality is shown in Fig. 1.
At the anode, a fuel (usually hydrogen) is oxidized into electrons and protons, and at
the cathode, oxygen is reduced to oxide species. Depending on the electrolyte, either
protons or oxide ions are transported through the ion-conducting, but electronically

4
insulating, electrolyte to combine with oxide ions or protons, respectively, to generate
water and electric power.
TABLE I CURRENTLY DEVELOPED TYPES OF FUEL CELLS AND THEIR CHARACTERISTICS AND
APPLICATIONS
Fuel Cell Type
Proton exchange
membrane FC PEMFC
Alkaline FC AFC
Phosphoric acid FC PAFC
Molten carbonate FC
MCFC
Solid oxide FC SOFC
Electrolyte Solid polymer
(such as Nafion)
KOH Phosphoric acid
Lithium and potassium carbonate
Solid oxide electrolyte
(yttria, zirconia)Charge carrier H + OH − H +
23CO − 2O −
Fuel Pure H2
(tolerates CO2)
Pure H2
Pure H2 (tolerates
CO2, approx. 1% CO)
H2, CO, CH4, other
hydrocarbons (tolerates CO2)
H2, CO, CH4, other
hydrocarbons (tolerates CO2)
Catalyst Platinum Platinum Platinum Nickel Perovskites Operation
temperature 50–100°C 60–120°C ~220°C ~650°C ~1000°C
External reformer for
CH4 Yes Yes Yes No No
Product water
management Evaporative Evaporative Evaporative Gaseous
Product Gaseous Product
Product heat
management
Process Gas + Independent
Cooling Medium
Process Gas + Electrolyte Circulation
Process Gas + Independent
Cooling Medium
Internal Reforming + Process Gas
Internal Reforming + Process Gas
Electric efficiency 35–45% 35–55% 38%-45% 50%-60% 40%-55%
Power range /Application
Automotive, CHP (5–250kW), portable
<5 kW, military,
space
CHP (200 kW)
200 kW–MW range, CHP and
standalone
2 kW–MW range, CHP and
standalone

5
Fig. 1. Fuel cell diagram
Fuel cells produce DC power, water and heat from the combination of hydrogen
produced from the fuel and oxygen from the air. In procedures where H2O and CH4 react
in the cell to produce hydrogen, CO2 is also a co-product. Reactions in fuel cells depend
substantially on the temperature and pressure inside the cell. A system must be built
around the fuel cell to supply air and clean fuel, convert the energy to a more usable
form such as grid quality AC power, and remove the depleted reactants and heat that are
produced by the reactions in the cells [3]. Figure 2 shows the basic structure of a fuel
cell power plant.
2e -Load
Fuel in Oxidant in
Depleted oxidant and product gases out
Depleted fuel and product gases out
H2O
H2 Positive ion
or Negative ion
H2
1/2O2
Anod CathodElectrolyte
(Ion conductor)

6
Fig. 2. Block diagram of a fuel cell power system
First stage of a fuel cell power system plant is a fuel processing unit where a
conventional fuel (natural gas, methanol, coil, naphtha, or other gaseous hydrocarbon) is
purified into a gas containing hydrogen. The following stage converts chemical energy
to DC electricity using the stacks of individual fuel cells. The number of stacks used in
the power producing section unit depends on the specific power application. Finally, a
power conditioner converts DC power generated by the fuel cell stacks into the regulated
AC or DC power suitable for customer usage.
1.3 Fuel cell promise
As mentioned before, fuel cells can be classified based on the type of electrolyte.
Although the electrolyte is the primary mean of characterizing the cell, the operating
temperature also plays an important role. There are low-temperature operating fuel cells
(PEMFC, AFC, PAFC) and high-temperature operating fuel cells (MCFC, SOFC); in

7
latter type the temperature is high enough so that the reforming processing of fuel, such
as natural gas, occurs within the cell.
Among them the proton exchange membrane fuel cell (PEMFC) has gained a wide
acceptance due to several advantages, such as compact design, long operating life, quick
start-up times, and high efficiency. A PEMFC generates electricity directly from
hydrogen fuel through two electrochemical reactions which take place at the proton
exchange membrane/catalyst interface at low temperatures (<80° C). Chemical reactions
that take place inside a PEMFC fuel cell are presented in the following:
Anode: 22 4 4H H e+ −→ +
Cathode: 2 24 4 2O H e H O+ −+ + → (1)
Net reaction: 2 2 22 2H O H O+ = .
Fig. 3. Fuel cell and battery energy density vs. specific energy

8
The PEMFC is attractive for transportation applications, and portable power, and are
a major competitor for stationary power applications less than 100 kW, particularly in
combined heat and power (CHP) generation.
Since the introduction of portable electronics in the mid 1950’s batteries have been
their de facto source of energy. However the amount of energy that can be stored in
batteries is limited and their improvement does not keep up with the energy requirements
of modern devices. In contrast the energy density of fuel cells is up to 4 times higher
than energy density of currently available batteries. This can be observed from Fig. 3.
Furthermore, fuel cells offer an energy density even higher that the theoretical limit of
their closes competitor (Li-Ion).
Another strong point of fuel cells emerges when the cost of producing 1 kW of
energy is compared against batteries. As can be observed from Table II the total cost of
generating 1 kW of energy using a fuel cell is up to 5.8 times lower than using existing
reusable battery technologies.
Also the life span of fuel cells is up to four times longer than popular battery
technologies such as Li-Ion and Ni-MH. For these reasons fuel cells are a very
promising candidate for replacing batteries in portable devices in the coming years.
However there are still issues that have to be resolved in order to make fuel cells popular
in the marketplace.

9
TABLE II COST OF GENERATING 1 KW OF ENERGY
Power source
Investment of equipment to
generate 1 kW
Lifespan of equipment before major overhaul or replacement
Cost of fuel per kWh
Total cost per kWh, including
maintenance and equipment
replacement
Ni-MH
$9400 Based on 7.5 V,
1000 mAh at $70/pack
500h based on 1 C
discharge
$0.15 for electricity $18.50
Li-Ion
$12000 Based on 7.2 V,
1200 mAh at $100/pack
500h based on 1 C
discharge
$0.15 for electricity $24.00
Rechargeable Alkaline
$1000 Based on 7.2 V,
1400 mAh at $6/pack
10h based on 1 C
discharge
$0.15 for electricity $95.00
Ni-Cd
$7000 Based on 7.2 V,
1000 mAh at $50/pack
1500h based on 1 C
discharge
$0.15 for electricity $7.50
Fuel Cell $3000-7500 2000h $0.35 $1.85-4.10
1.4 Designing a hybrid source
One of the key disadvantages of the fuel cell is the long start-up time and slow
dynamic response. Due to the nature of power demand in portable electronics
supercapacitors seem to be very attractive for applications that require immediate power
or a peak (burst) delivery of power [4].

10
TABLE III SHORT AND LONG-TERM RESERVE ENERGY SOURCES FOR BACKUP POWER
Characteristic Fuel cell with fuel Supercapacitor Lead-acid battery
Energy storage
Very good, depends on fuel available, fuel cells
use stored energy (hydrogen)
Poor, limited to seconds of use; not a candidate
for energy storage greater than 1 minute
Good, requires linear scaling; thus, large
banks for large energy storage
Power delivery and acceptance/ power density
Can not accept regenerative current;
provides rated power at about 50% efficiency
Very good and highly efficient; can discharge and accept high current
Reasonable power delivery; recharging is
slower and must be managed
Electrical behavior Generates energy electrochemically
Generates energy by dropping voltage and
ramping current and is highly predictable
Generates energy at constant voltage and
variable current
Life and maintenance
Expected life is good and steadily improving;
“hot-swappable” cartridges can eliminate
downtime
Very good, has many years of useful life, health monitoring simple and non-
destructive
Limited life requires destructive health monitoring and
maintenance over the life of the application
Operating temperature range
0o to 50oC; limited by cold weather below 0oC -40oC to +65oC -20oC to +55oC
Cost-effectiveness for stationary and portable power
High value proposition in applications requiring
system reliability
Cost competitive with batteries, especially where portability or reliability is required
Low initial cost, but has high maintenance cost and low reliability for critical applications
Footprint
Highly scalable from small (cell phones) to mid-sized generation
plants (250kW); runtime is a function of
incremental fuel storage
Highly scalable, lightweight power; very
high power density; small combined with
fuel cell or other energy source
Heavy weight and size; requires one-to-one
scaling for more runtime; can provide
power and energy
Integration potential
Can be optimized for most economical design
at rated power with power buffer included
Lasts the life of application so can be intergraded into the solution; suitable
partner with energy generator
Requires maintenance and replacement not
fully integrated into the solution
Efficiency
50% fuel-efficient at rated power; at reduced load, efficiency varies
up to 100%
Highly efficient at high loads charging or
discharging-about 95%
Highly efficient at low loads-about 90%; low efficiency at high-rate charging-about 50%
Their main attribute is high power capability and long life. Supercapacitors are suited
for short-term power backup requirements in the range from seconds to a few minutes,

11
while the primary source device provides continuous power for a longer time. Taking
this into consideration the supercapacitor is an ideal device to connect in parallel with
the fuel cell to form a hybrid source as shown in Fig. 4, capable of satisfying both
steady-state and peak power demand [5]. They are environmentally benign and can
provide a reliable source of backup power demanded by a wide variety of applications as
shown in Table III.
Fig. 4. Small signal representation of portable system powered by hybrid source
In-depth analysis of the benefits of combining supercapacitor and fuel cell
technologies in portable electronics applications need to be investigated. The additional
energy storage provided by the supercapacitor connected at the terminals of a fuel cell
can contribute to: (a) increased steady state stability when powering constant power
loads, (b) improved transient stability against load transients, and (c) increased fuel
efficiency (i.e. reduced hydrogen consumption).
In order to design the optimum combination and realize the advantages listed above,
detailed performance information in the form of a comprehensive electric circuit model
is needed for each component. This information is usually unavailable from product data
sheets for fuel cells as well as supercapacitors and has to be experimentally determined.
12
1.5 Distribution architecture for laptop computers
As mentioned in the literature [6], the "power gap" is simply the difference between
the ever-increasing power demands of mobile electronics, such as notebook PCs, PDAs,
and portable DVD players, and the amount of power available in today's battery
technologies. The "power gap" is driven by three main trends:
1) Mobile electronics are more fully-featured than ever before, demanding more
power;
2) Users are increasingly dependant on these mobile devices and are spending ever-
longer periods of time without access to ac energy sources; and
3) Improvements in today's battery technology have leveled out and are unlikely to
meet the ever-increasing power needs in the future.
This could be surmounted by using the low-temperature fuel cells instead the
batteries. One example of a PEM fuel cell powering the laptop computer in the Power
Electronics and Fuel Cell Power Systems Laboratory at Texas A&M University is
shown in Fig. 5.

13
Fig. 5. Fuel cell with supercapacitors powering the laptop computer
Conventional power distribution systems in laptop computers (Fig. 6) have variable
voltage levels which depend on whether the wall adapter is connected or not. Normally
the bus voltage of the distribution system varies between 19.5 V when the wall adapter is
connected and 14.8 V when the laptop is running from the four-cell Li-Ion battery [7].
This power distribution architecture poses a problem from the voltage regulator module
(VRM) point of view. The operating voltage of these devices is normally in the range of
0.6 V to 3.3 V to increase the speed of the computer, thus a large voltage reduction is
needed and therefore the power conversion efficiency is reduced. The most common
method for stepping the high DC bus distribution system voltage to lower levels is by
employing a non-isolated buck converter, which in this type of configuration have low
efficiency and limited high switching frequency operation.

14
4 Li-IonCells
BatteryCharger
DC/DC
DC/DC
DC/DC
3.3V
1.XV
5V
AC/DC
Inside laptop
Power transferswitches
19.5V
10.8 to 19.5V
Universal InputSupply
90 - 240 Vac
Fig. 6. Conventional laptop power management architecture
For this reason, four new power distribution architectures for fuel cell powered laptop
computers are investigated in this dissertation and for each architecture,
advantages/disadvantages are highlighted. Power consumption of two different laptop
computers is measured for different types of loads to determine transient and steady state
needs of the system. Furthermore, a hybrid multi-input bi-directional DC-DC converter for
applications in fuel cell powered laptop computers has been proposed. The purpose of this
multi-input converter is to suitably control the energy flow from multiple energy sources to
enable all day computing. The AC-DC adapter and the fuel cell and its components are
integrated with the converter in an external unit while the conventional Li-Ion battery is
placed within the laptop casing.
The advantages of this architecture are:
• The Li-Ion battery charging function is transferred to the AC-DC adapter and
hybrid DC-DC converter external to the laptop, thereby reducing the heat

15
dissipation and saving space inside the laptop. This reduction in heat dissipation
and space can now accommodate more complex features and/or additional
memory functions.
• Changes to AC-DC adapter are minor and do not contribute to higher cost.
• Minimized fan power and noise requirements within the laptop.
• Better overall efficiency and power savings.
1.6 Fuel cell powered UPS
As previously stated, UPS provide electric power for critical applications when the
quality of the energy source, i.e. utility power, is not adequate or when it fails entirely.
Conventional UPS employ batteries and/or engine generators as their main power
sources. However, batteries contain toxic heavy metals such as cadmium, mercury, and
lead and may cause serious environmental problems if they are discarded without special
care; furthermore, these batteries suffer from life expectancy, footprint and weight issues.
Similarly, engine generators have issues with startup, maintenance, noise and emission.
Recently other methods of energy storage such as fuel cells, flywheels, supercapacitors
and combinations of the above have come into use.
Among various kinds of fuel cells, PEM fuel cells are compact and lightweight,
provide a high output power density at room temperature, as well as ease of start-up and
shut down operations [8]. Additionally, fuel cells can continuously provide power as long
as the reactants are supplied, which is especially useful when the duration of the power
outage is uncertain.

16
Forming a hybrid source with supercapacitor is also very beneficial in this kind of
application to compensate for fuel cells response delays and to handle overload
conditions.
Fig. 7. Circuit topology of the proposed fuel cell powered UPS system
Motivated by the situation described above, this dissertation investigates the design
considerations for a 1.5 kVA single–phase fuel cell powered passive stand-by UPS
system shown in Fig. 7, with one hour of backup power employing modular (fuel cell
and power converter) blocks. Interactions between the internal impedance of the fuel cell
and steady state and transient stability are also considered.
1.7 High megawatt converter topologies for fuel cell based power plants
High temperature fuel cells have sufficient potential in terms of overall system
efficiency and operation costs to compete with conventional power plants in the mega
watt (MW) power range. Typical efficiency of conventional power plants ranges from
38% to 40%, whereas the efficiency of these fuel cells is in the range of 55-60%;
consequently, fuel cell based plants have efficiency around 20% higher that conventional

17
systems. On the other hand the cost of generating power in a fuel cell based plant is
slightly higher than in conventional systems (0.12 $/kWh) [9].
The fuel cell stack is interfaced with the AC grid, usually at the medium voltage
distribution level, via a converter transformer unit [10]. Since each individual cell
produces only 0.6 V, there is a maximum number of the cells that one can stack before
thermal/water management issues arise. Additionally, electrostatic potential to ground
within the fuel cell stack needs to be limited for safe operation. Considering the above
limitations, the maximum voltage that a fuel cell stack can safely produce is around 350
V [11].
The power converter is usually constructed using a two stage approach having a DC-
DC converter connected in series with a DC-AC inverter. A conventional approach is to
have each fuel cell stack connected to a dedicated power electronic converter (DC-DC
and DC-AC) interfaced to electric utility. There are other possible power electronics
topology configurations that will be presented in this Dissertation.
The switching mode nature of the power converters generates common mode voltage
with respect to ground. The presence of high frequency common mode voltage
contributes to circulating ground currents which can interfere with ground fault
protection system and also contribute to neutral shift and electro magnetic interference
(EMI). In order to properly design the converter it is necessary to analyze common mode
voltage in the converter topologies and implement one of several possible mitigation
methods.

18
1.8 Previous work
The concept of hybrid sources is not new. There are several studies that show the
applicability of such sources in high power applications such as electric vehicles and
residential power generation [4, 5, 12]. Although these studies cover the complexity of
fuel cell/supercapacitor integration the electric equivalent circuit models of those
elements used in analysis are too simplified. There are also papers that suggest the use of
hybrid sources in portable applications but no deeper analysis related to system
integration and behavior is given [13-14].
Over the years many equivalent circuit models have been proposed [15-17], which
vary in complexity and accuracy. Using one of these equivalent circuit models the effect
of the load current in the performance of the fuel cell has been studied by Choi and
Enjeti, but their work focused only on the effect of low frequency ripple.
A number of supercapacitor equivalent circuit models [18-20] have been presented.
Among them the equivalent circuit model proposed in [20] is one of the few that uses the
voltage dependent capacitor. However, this model is obtained using the constant current
test and is not suited for transient behavior analysis. Nyquist plots for various charge
states are shifted in both Re and Im directions, which implies that at least one resistance
and capacitance in the model need to be charge dependent. Also the effects of
capacitances increase with the increase in voltage across the supercapacitor terminals has
not been analyzed.
The effect on the dynamics of the DC-DC converter due to the internal impedance of
the fuel cell has not been studied so far. However analytical tools exist that can facilitate

19
this analysis [21]. The use of a fuel cell as a power source for DC-DC converters can be
treated in a similar fashion to when a filter is connected between the power source and a
DC-DC converter. An approach to analyze this problem is presented by Erickson and
Maksimović in [21], and it is shown that for the case of using a filter the stability and
dynamics of the system may be compromised.
One way to efficiently facilitate the use of fuel cells in portable electronics is to
connect them via bi-directional DC-DC converter. The purpose of this multi-input
converter is to suitably control the energy flow from multiple energy sources to enable
all day operation. An example of such bi-directional converter is given in [22]. This
topology reduces the number of components and simplifies the power management and
the use of a microcontroller and high-speed analog PWM enhances the laptop power
management system. Coremans suggested the use of fuel cells to power laptop
computers and investigated the fuel cell sizing issues [23], but has not provided an in-
depth analysis of the interaction between the fuel cell and the computer’s power
distribution system. The work presented here builds on the above concepts and
introduces four distinct power distribution architectures for laptop computers powered
by fuel cells.
Several approaches have been suggested for the design of the fuel cell powered UPS
system [2, 24-25]. While references [2, 24, 25] mainly discuss the conceptual design,
reference [26] shows the design and the actual implementation of system where the
power supplied from the utility is transferred to the load via UPS. When the power
outage occurs, energy stored in the battery is used to support the load. As the power

20
outage continues and voltage becomes lower than the pre-determined value, the signal-
output unit outputs an operation signal to start the fuel cell system. The fuel cell system
begins to warm up and incorporated inverter starts to generate the 100V AC power.
Power transfer is performed by the synchronization-switch system. However, since this
system requires a power conditioning stage for both batteries and fuel cell, the system is
expensive. Further, it is disadvantageous in terms of efficiency because the power is
always processed by the UPS.
The UPS system topology suggested in [24] uses a bi-directional DC-DC converter
with a battery module as an active filter to compensate for the power mismatch between
the fuel cell and load. However, this approach also employs the problematic batteries in
the system and thus the system is not environmentally clean.
UPS system topology presented in [8] uses complicated system of two fuel cells and
supercapacitor bank which are connected by three separated DC-DC converters to
common isolated DC-DC converter and finally DC-AC inverter. Therefore this system
suffers from limited efficiency and very complex control algorithm.
The fuel cell stack is interfaced with the AC grid, usually at the medium voltage
distribution level, via a converter transformer unit [10]. Multilevel converters have been
used previously to integrate several fuel cell modules for high power applications [11].
Low voltage fuel cell multi input systems were investigated in [27]. Different
approaches for integrating numerous fuel cells modules for residential use and their
evaluation and comparison in terms of cost, control complexity, ease of modularity and
fault tolerance was given in [28]. The investigation of common mode noise in adjustable

21
speed drives has been carried out in the past. These systems are normally composed of a
three phase rectifier cascaded with a three phase inverter. Most of the previous work
focuses on reducing the common mode noise by placing passive filters at the output of
the inverter [29-31] or by modifying the switching patterns in order to cancel out most of
the common mode voltage [32-35]. However, little attention has been given to the
common mode problem in systems used for co-generation, such as utility connected fuel
cell systems. These systems are normally composed of a DC-DC converter cascaded
with a DC-AC inverter; thus, there are two potential common mode sources in such
systems. Therefore analysis of the common mode issue is required.
1.9 Research objective
The objective of this dissertation is to analyze and design power conditioning
systems for fuel cell applications. The starting point in the analysis is to obtain an
adequate equivalent circuit for the fuel cell and the supercapacitor. For this, the
frequency spectroscopy method is used to acquire and systemize the element values in
the equivalent circuit. This equivalent circuit is then used to analyze the effects of
combining the fuel cell with supercapacitor in parallel in order to form the hybrid source.
This is done both analytically and experimentally and the main focus is on determining
static and dynamic stability conditions as well as hydrogen fuel consumption.
The interaction between the DC-DC converter and the fuel cell stack is studied. The
benefits obtained in steady state stability of the power conditioner when powered by the
hybrid source are analyzed to investigate if such configuration possesses any advantages

22
from the energy management point of view. For transient stability analysis, the effect of
fuel cell internal impedance (extra element) along with the impedance of the
supercapacitor (nonlinear) on the transfer function of the DC-DC converter is analyzed.
Also, the effect on the operation of the DC-DC converter produced by the periodical
release of by-products by the fuel cell was studied. The outcome of this should be design
criteria for optimizing the operation of the power converter.
The design of the hybrid source and its interaction with the portable electronics is
analyzed in detail with the four proposed power distribution architectures for fuel cell
powered laptop computers. For each architecture advantages/disadvantages will be
highlighted. Power consumption of two different laptop computers will be measured for
different types of loads to determine transient and steady state needs of the system. As a
result of this comparison, an optimal DC-DC converter for applications in fuel cell
powered laptop computers will be proposed. The purpose of this converter is to suitably
control the energy flow from multiple energy sources to enable all day computing. A
design example highlighting the parameters of the fuel cell stack, Li-Ion battery, and
supercapacitor modules appropriately sized for a typical load on a laptop computer will
be shown. Simulation and experimental results will be used to verify the performance of
the system under various input and output power conditions.
Subsequently, a fuel cell powered single-phase UPS system will be evaluated in
detail. The proposed topology will provide stable power to the load when the utility is
interrupted. A mathematical approach to analyze the interactions between the internal
impedance of the fuel cell and the DC-DC converter closed loop control to verify steady

23
state and transient stability will be presented. A method to size the supercapacitor
module will be incorporated to overcome the load transients such as instantaneous power
fluctuations, slow dynamics of the fuel preprocessor and overload conditions.
Converting DC power produced by fuel cell to AC power suitable for utility interface
can be accomplished by a variety of converter topologies and their interconnections. It is
beneficial to study the various possibilities and compare them with respect to
performance, component count, cost, usage of magnetics, etc. The switching mode
nature of the power converters generates common mode voltage with respect to ground.
The presence of high frequency common mode voltage contributes to circulating ground
current which can interfere with ground fault protection system and also contribute to
neutral shift and electro magnetic interference (EMI). The existence of the analysis of
common mode voltages in the converter topologies is necessary for developing possible
mitigation methods.
1.10 Dissertation outline
Chapter I of this dissertation presents the reasons behind the increased interest in fuel
cells as an alternative power source for residential, transportation and portable
applications. The basic operation principle of the fuel cell is described as well as its most
relevant characteristics. Also this chapter compares fuel cells with batteries in terms of
energy densities and cost. It is shown that in both aspects the fuel cell appears as a good
alternative for powering portable devices and UPS systems. The characteristics of
forming the hybrid source from fuel cell and supercapacitor are discussed and the

24
benefits are presented. More efficient distributed architecture for laptop computers is
presented. In addition a fuel cell powered single-phase UPS system is discussed. Finally
the research objective of this work is presented.
Chapter II focuses on the modeling of the fuel cell and supercapacitor in order to
obtain an electrical equivalent circuit, and a method to extract the parameters of the
equivalent circuit is presented. This chapter provides an in depth analysis of the benefits
of combining supercapacitor and fuel cell technologies in portable electronics
applications. This additional energy storage provided by the supercapacitor connected at
the terminals of a fuel cell can contribute to: (a) increased steady state stability when
powering constant power loads, (b) improved transient stability against load transients,
and (c) increased fuel efficiency (i.e. reduced hydrogen consumption). Chapter II also
deals with the effect of the internal impedance of the fuel cell on the dynamic
characteristics of the DC-DC converter. For this the output impedance and input
impedance of the fuel cell and DC-DC converter along with the transfer function of the
converter are derived and analyzed. In addition this Chapter discusses the effect of the
purge of the fuel cell’s by products on the stability of the system.
Chapter III investigates four power distribution architectures for fuel cell powered
laptop computers. As a result of the comparison, an optimal DC-DC converter for
applications in fuel cell powered laptop computers is proposed. The purpose of this
converter is to suitably control the energy flow from multiple energy sources to enable
all day computing. A design example highlighting the parameters of the fuel cell stack,
Li-Ion battery, and supercapacitor modules appropriately sized for a typical load of a

25
laptop computer is shown. Simulation and experimental results are used to verify the
performance of the system under various input and output power conditions.
Chapter IV presents the fuel cell powered single-phase UPS system. The proposed
topology is providing stable power to the load when the utility is interrupted. A
mathematical approach to analyze the interactions between the internal impedance of the
fuel cell and the DC-DC converter closed loop control to verify steady state and transient
stability is presented. A method to size the supercapacitor module to overcome the load
transients such as instantaneous power fluctuations, slow dynamics of the fuel
preprocessor and overload conditions is incorporated.
Chapter V deals with the high power co-generation systems based on fuel cells and
various power conditioning topologies used to interface such systems with utility.
Different topologies are compared with respect to the number of components, cost,
usage of magnetics, etc. In addition, the problem of common-mode noise in fuel cell
systems connected to the utility is investigated. The presence of common-mode voltages
and currents produces conducted electromagnetic interference that may have harmful
effects on the operation of neighboring equipment as well as on the converter itself and
the fuel cell. Analysis of the problem for different system configurations is done and
possible solutions are presented.
Finally Chapter VI presents the general conclusions and remarks obtained from this
work.

26
CHAPTER II
THE ROLE OF SUPERCAPACITORS IN DESIGNING FUEL CELL
POWERED PORTABLE APPLICATIONS
2.1 Introduction
Due to the nature of power demand in portable electronics, supercapacitors seem to
be very attractive for applications that require immediate power or a peak (burst)
delivery of power [4]. Their main attribute is high power capability and long life.
Supercapacitors are suited for short-term power backup requirements in the range from
seconds to a few minutes, while the primary source device provides continuous power
for a longer time. In this chapter primary source is a fuel cell, which is a promising
energy source increasingly used in portable applications due to its environmental
friendliness and high efficiency. One of the key disadvantages of the fuel cell is the long
start-up time and slow dynamic response. Taking this into consideration the
supercapacitor is an ideal device to connect in parallel with the fuel cell to form a hybrid
source capable of satisfying both steady-state and peak power demand.
The concept of hybrid sources is not new. There are several studies that show the
applicability of such sources in high power applications, such as electric vehicles and
residential power generation [4, 5, 12]. Although these studies cover the complexity of
fuel cell/supercapacitor integration, the electric equivalent circuit models of those
elements used in analysis are too simplified. There are also papers that suggest the use of

27
hybrid sources in portable applications, but no deeper analysis related to system
integration and behavior is given [13-14].
This chapter provides and in-depth analysis of the benefits of combining
supercapacitor and fuel cell technologies in portable electronics applications. It is shown
that the additional energy storage provided by the supercapacitor connected at the
terminals of a fuel cell can contribute to: (a) increased steady state stability when
powering constant power loads, (b) improved transient stability against load transients,
and (c) increased fuel efficiency (i.e. reduced hydrogen consumption).
In order to design the optimum combination and realize the advantages listed above,
detailed performance information in the form of a comprehensive electric circuit model
is needed for each component. This information is usually unavailable from product data
sheets for fuel cells as well as supercapacitors, and has to be experimentally determined.
2.1 Fuel cell equivalent circuit
The starting point to analyze the dynamic behavior of the fuel cell stack is to obtain an
electrical equivalent circuit model. This model has to provide an accurate response for
steady state as well as transients. Over the years many equivalent circuit models have
been proposed [15-17], which vary in complexity and accuracy. Among them the
equivalent circuit model proposed in [17] is one of the few that link the chemical
reactions taking place in the fuel cell and measurable electric parameters. The chemical
reactions that occur in the anode and cathode of the fuel cell are given by:
−+ +→ e2H2H 2 (2)

28
OH2e4H4O 22 →++ −+ (3)
From these equations the equivalent circuit shown in Fig. 8 can be derived and the
parameters can be obtained from the redox reactions that occur in both electrodes.
Fig. 8. Equivalent circuit for a PEM fuel cell
This equivalent circuit consists of the resistance of the membrane Rm, which is
related to the electrolyte resistance. Also the model contains two parallel R-C blocks,
Rp1-C1 and Rp2-C2, which are related to the time constant of each electrode. Specifically
these time constants are related to the electron transport phenomena in the anode and
cathode. These parameters can be calculated in terms of the fuel cell chemical
parameters, but this information is rarely available to the power electronics designer. A
straightforward method of obtaining these parameters is through frequency spectroscopy
using a frequency response analyzer. The test setup for frequency spectroscopy using a
frequency response analyzer is shown in Fig. 9. This method consists in drawing a DC
current with a superimposed AC component from the fuel cell stack, and measuring the
voltage ripple that appears in the output voltage of the stack.

29
Fig. 9. Test setup for measuring the frequency respond of the PEM fuel cell
This is repeated for a wide frequency range in order to obtain the frequency response
of the fuel cell. Fig. 10 shows a Nyquist plot of a 30 W fuel cell for different load
conditions obtained experimentally by using this method. This figure shows the
resistance and reactance of the fuel cell stack for three different load conditions and for
frequencies ranging from 0.1 Hz to 10 kHz.

30
Fig. 10. Nyquist plot for a 30W fuel cell stack
From this plot it is simple to identify the main elements of the equivalent circuit
model and to synthesize the parameters of the circuit model if the chemical data are not
known. Each semicircle in the graph corresponds to one R-C time constant and its
diameter is proportional to its resistive value while the vertex corresponds to its
characteristic frequency. The value of the membrane resistance can be obtained from the
graph at the point were the reactance becomes zero. The equivalent circuit parameters of
the fuel cell whose response is shown in Fig. 10 are listed in Table IV.
It can be observed from Table IV and from the Nyquist plot from Fig. 10 that the
fuel cell equivalent circuit parameters are a function of the output load.
0 0 .5 1 1 .5 2 2 .5 3 3 .5 4-1 .2
-1
-0 .8
-0 .6
-0 .4
-0 .2
0
0 .2
0 .4
R e s is ta n c e [O h m ]
Rea
ctan
ce [O
hm]
0.1 Hz 10 kHz

31
TABLE IV FUEL CELL EQUIVALENT CIRCUIT PARAMETERS
Load
Condition Rm[mΩ] Rp1[mΩ] C1[mF] Rp2[mΩ] C2[mF]
Light Load 100 684 0.622 1126 8.19
Half Load 100 620 0.987 1460 13.77
Full Load 100 615 1.277 1805 15.10
2.2 Nonlinear model of supercapacitor
A supercapacitor is characterized by the capacitive properties of the interface
between an electronic (the electrode) and an ionic (the electrolyte) conductor, and its
impedance depends on many parameters such as voltage, electrolyte concentration and
temperature. Because of the porous nature of the electrodes, the capacitive interface is
not localized in a plane but it spreads to the inside of the different pores [18]. As a result
of this complexity a single resistor and capacitor are insufficient to model the
supercapacitor. Hence, the theoretical model has to be composed of many nonlinear
resistors and capacitors, leading to different time constants. A theoretical model of a
supercapacitor is important for understanding the basic physical phenomena, but due to
its complexity and the abundance of parameters to be identified is not very practical. For
this reason, simple models are used to simplify the analysis. There are many equivalent
circuit models [18-20], which vary in complexity and accuracy. Among them the
equivalent circuit model proposed in [20] is one of the few that uses the voltage

32
dependent capacitor. However, this model is obtained using a constant current test and is
not suited for transient behavior analysis.
In this chapter supercapacitor equivalent model was obtained in the same way as the
fuel cell equivalent using a frequency response analyzer between 0.1 Hz to 100 kHz in
order to obtain the accurate frequency response of the supercapacitor. Fig. 11 shows the
impedance Nyquist plot for a 10 F/2.5 V supercapacitor (Maxwell PC-10) for different
charge conditions.
Fig. 11. Nyquist plot for a Maxwell PC10 supercapacitor
From Fig. 11 we can observe a vertical asymptote which appears at low frequency
illustrating a purely capacitive behavior combined with an equivalent serial resistor. This
resistance approaches its maximum value (ESR DC) at low frequencies and corresponds
to the electric resistance of the terminals, electrodes, and electrolyte. For higher
frequencies an oblique asymptote is found describing distributed impedance [19]. The
0.1 Hz
100 kHz

33
serial resistance decreases with the increased frequency and asymptotically reaches its
minimum at high frequency (ESR HF). Finally, for frequencies higher than the
resonance frequency the supercapacitor’s behavior becomes inductive and can be
expressed by a serial resistor ESR_HF in series with a low serial inductor. This behavior
is due to the very porous nature of the electrodes and to the manufacturing process when
using wound technology. Fig. 11 shows that the ESR DC and ESR for 1 kHz are in
agreement with values found in manufacturer’s datasheet.
Fig. 12. Equivalent circuit for a PC10 supercapacitor
To fit the frequency response of the equivalent circuit to the experimental data a
ladder R-C equivalent model was investigated and a multitude of different parameters
combinations were examined. The proposed electric equivalent circuit is given in Fig.
12. The model is composed of a serial inductor and a network of four R-C branches. The
unit-weighting fitting method was used to identify the combinations of parameters which
most accurately fit the curves obtained from Nyquist plot.

34
TABLE V SUPERCAPACITOR EQUIVALENT CIRCUIT PARAMETERS
U[V] Lsc[nH] R1[mΩ] C1[µF] R2[mΩ] C2[mF] R3[mΩ] C3[F] R4[mΩ] C4[F] 0.0 17.9 75.9 358 45.9 42.2 20.9 1.64 83.5 4.50 0.5 18.3 75.7 334 47.0 37.4 20.9 1.67 84.0 4.55 1.0 19.8 72.6 347 46.3 41.7 20.2 1.78 82.0 4.94 1.5 21.2 70.1 359 45.2 45.3 19.5 2.02 78.5 5.82 2.0 22.4 67.9 379 44.1 52.0 19.6 2.27 78.0 6.53 2.5 24.3 65.1 414 43.0 65.6 20.0 2.56 80.5 6.90
Table V shows the supercapacitor equivalent circuit parameters as a function of the
charge state. It can be seen that the R-C values depend on the charge state. Nyquist plots
for various charge states are shifted in both Re and Im directions, which implies that at
least one resistance and capacitance in the model need to be charge dependent
(capacitance C4 and resistance R4 in Fig.12). The other parameters can have fixed
values. Another trend shown in Table V is that capacitances increase with the increase in
voltage across the supercapacitor terminals. This is beneficial for parallel connection
with the fuel cell because it enhances the transient response of the hybrid source.
2.3 Power conditioner for portable fuel cell system
It is clear from earlier chapters of this thesis, that a fuel cell is a soft voltage source,
due to the load dependent nature of its output voltage. A typical fuel cell stack output
voltage experiences a 2 to 1 variation from no load to full load. Also, since each cell in a
fuel cell stack has a low output voltage (0.6 V at full load), it is necessary to stack many
in series to obtain a reasonable output voltage. Stacking many cells in series adds to the

35
complexity of the systems in terms of complicated plumbing to properly distribute the
fuel and water/thermal management.
Fig. 13. Fuel cell powered portable system
Complexities arise when many cells are connected in series. Due to these limitations,
a lower output voltage (3 V to 12 V) fuel cell (with fewer cells stacked in series) becomes
the optimum configuration for fuel cells under 20 W. Attributable to the available lower
output voltage, coupled with no-load to full-load variation of the fuel cell terminal
voltage a DC-DC boost converter becomes necessary (Fig. 13). DC-DC converters can be
operated either in continuous conduction mode or in discontinuous conduction mode. In
the continuous conduction mode, the peak currents are lower, however, the inductor size
is larger and the effect of diode reverse recovery contributes to additional switching
losses. On the other hand the discontinuous conduction operation results in large peak
currents, lower inductor size, zero current turn-on and the absence of reverse recovery
phenomenon. In both cases the current supplied by the fuel cell contains high frequency
ripple. The ripple current has an effect on the performance of the fuel cell that can be
measured in terms of the temperature rise and hydrogen fuel consumption. An important

36
point when designing the DC-DC converter is to know the amount of ripple current that
can be injected into the fuel cell without degrading its performance. From the converter
point of view at light loads, it may be more efficient to operate in discontinuous
conduction mode.
2.4 Fuel cell and DC-DC converter interaction
2.4.1 Steady state stability
In most practical portable applications, due to the low voltage of the fuel cell, the use
of a boost type DC-DC converter is required as discussed previously. In general for a
fuel cell powered DC-DC converter system to be stable in steady state the V-I
characteristic of the fuel cell and the constant power locus of the DC-DC converter have
to intersect at one point, which sets the operating condition of the system. If the two
curves do not intersect the source is not able to meet the power demanded by the load.
Fig. 14 shows the V-I characteristic (normal V-I) of the 30 W fuel cell whose parameters
where obtained in section 2.1. This figure also shows the constant power locus of a 30 W
boost converter for full and half load. As can be observed from Fig. 14 the constant
power locus intersects the V-I of the fuel cell, and therefore the power requirements of
the load are met.

37
Fig. 14. Fuel cell V-I characteristic and load constant power locus
For low power applications, 150 W and below, dead ended PEM fuel cells are
normally used. In this particular kind of fuel cell, hydrogen enters the stack at the anode,
and there is a solenoid valve located at the cathode which opens at regular intervals to
release the products of the chemical reaction. The opening of the valve is referred to as
purging. During the purging interval the voltage produced by the fuel cell drops due to
the reduction in internal pressure. The magnitude of this voltage drop is a characteristic
of the fuel cell, and it is a function of the load current, fuel cell parameters, and the
duration of the purging period. Figure 15 shows the voltage profile of the 30 W stack
during a purge.
0
0.5
1
1.5
2
2.5
0 0.2 0.4 0.6 0.8 1 1.2 1.4
Load Current [A]
Fuel
Cel
l Vol
tage
[V]
Full Load – Constant power locus
Half Load – Constant power locus
Normal V-I
V-I during Purging ∆V

38
Fig. 15. Fuel cell voltage during the purging interval for a 30W stack supplying 1.73A
It can be seen from Fig. 15 that for this particular fuel cell the duration of the purging
interval is 2.5 s and the voltage drops by 2.24 V for a load current of 1.73 A. Figure 14
shows the V-I characteristic measured for the 30 W fuel cell during the purge interval.
As can be observed from Fig. 14 during the purge the fuel cell voltage drops by a
quantity ∆V. In order to maintain the output power constant the DC-DC converter will
require a higher current, which will produce an additional voltage drop at the fuel cell
terminals. This in turn will produce an additional increase in the converter current. In
other words a positive feedback takes place, which finally results in instability.
To avoid this problem, two approaches can be taken. One of them is to control the
boost converter in order to limit its output load during the purging interval. But this
approach has the disadvantage of degrading the total output power of the system. An
alternative approach it to supply the power difference produced during the purge by
using a supercapacitor. The size of the capacitor in our experimental setup was

39
calculated in terms of the energy that the capacitor has to supply during the duration of
the purge, and can be calculated from:
2
po
V
tP2C
∆
∆= , (4)
where ∆Po is the difference between the power that the fuel cell can supply during the
purge and the power required by the load, tp is the duration of the purge and ∆V is the
voltage drop in the capacitor. In the case of the 30 W fuel cell under study the duration of
the purge is 2.5 seconds, and the voltage drops to 0.75 p.u at full load. In this case the
supercapacitor needs to supply 25% of the output load during 2.5 seconds. If a maximum
voltage drop of 2 V is allowed during the purge from (4) the required capacitance is 10
F.
2.4.2 Transient stability
The interaction of the DC-DC converter with the stand-alone fuel cell as well as with
the hybrid source has been analyzed in order to investigate dynamic response as well as
the stability of the overall system. The power converter controller is generally designed
to provide appropriate amount of phase and magnitude margins in order to meet the
stability criteria. But once the fuel cell is connected to the input terminals of the power
converter, as shown in Fig. 16 the output impedance of the fuel cell alters system
behavior.

40
Fig. 16. Fuel cell DC-DC converter system
If the internal impedance of the fuel cell is considered, Middlebrook’s extra element
theorem [21] can be used to analyze the effect of the fuel cell onto the dynamics of the
converter. Application of the theorem results in the system shown in Fig. 17, where the
fuel cell output impedance is modeled as an extra element in the system.
Fig. 17. Modeling of the fuel cell impedance effect
It can be found that the control to output transfer function of the converter when the
fuel cell is considered is given by (4)

41
)s(Z)s(Z
1
)s(Z)s(Z
1)s(G)s(G
D
o
N
o
0Zvdvd o+
+
⎟⎠⎞⎜
⎝⎛= =
(5)
Where 0Zvd o)s(G = is the converter transfer function when the supply is an ideal
voltage source, ZN(s) is the input impedance of the converter under the condition that the
feedback controller operates ideally, ZD(s) is the input impedance of the converter under
the assumption that 0)s(d = , and Zo(s) is the output impedance of the fuel cell. It is
obvious that the transfer function of the converter is modified by the output impedance
of the fuel cell. Moreover, it can be shown that by connecting the fuel cell to the DC-DC
converter all the transfer functions are modified including the control-to-output and the
line-to-output, and the converter output impedance. In order to minimize the effect in the
dynamics of the converter it has been shown [21] that the following impedance
inequalities have to be met.
No ZZ << (6)
Do ZZ << (7)
Similarly the converter output impedance of the converter is not affected if
eo ZZ << (8)
Do ZZ << (9)
where Ze is the converter input impedance when its output is shorted. A typical fuel cell
power converter system is shown in Fig.13. Due to the low output voltage of the fuel cell
the converter of choice for this kind of applications is a boost converter. The small signal

42
model for a boost converter is shown in Fig. 18a. If the fuel cell equivalent circuit model
is added to the circuit the small signal equivalent shown in Fig. 18b is obtained. From
Fig. 18a the converter transfer function when the supply is an ideal voltage source
Gvd(s), and input impedances of the system, ZN(s) and ZD(s) are given by:
LCD1,
L)D1(R
LC)D1(RQ,
D1V
G
sQ
s1
s1G)s(G
oz
odo
2o
2
o
zdovd
−=
−=
−=−
=
++
−=
ωω
ωω
ω
(10)
)R)D1(
sL1(R)D1()s(Z 22
N−
−−−= (11)
sRC1
)D1(LCs
R)D1(Ls1
R)D1()s(Z2
22
2D +
−+
−+
−= (12)
where Vo is nominal output voltage, D is the converter duty cycle, L and C are the
inductor and capacitor of the converter, and R is a load resistance.
Fig. 18. a) Small-signal models for boost converter. b) When connected to a fuel cell

43
From the fuel cell equivalent circuit discussed in Section 2.1 its output impedance is
given by (13).
1)CRCR(s)CCRR(s
RRR))CC(RR)CRCR(R(s)CCRRR(sZ
22p11p212p1p2
2p1pm212p1p22p11pm212p1pm2
o+++
+++++++= (13)
By plotting the magnitudes of the converter input impedances and fuel cell output
impedance (11-13) for the fuel cell parameters shown in Table IV and for a 30 W boost
converter designed to operate in continuous conduction with a 250 µH inductance and
250 µF output capacitance, the graph in Fig. 19 is obtained.
Fig. 19. Impedances for fuel cell boost converter system
It can be seen from Fig. 19 that the magnitudes of the converter input impedance and
the fuel cell output impedance are of comparable magnitudes. From (6) in order to
minimize the effect of the fuel cell on the dynamics of the system the impedance

44
inequalities (6)-(7) have to be met. Normally the “much greater than” condition (<<) can
be considered to be true if there exist at least 6 dB of difference between the magnitude
of the converter and fuel cell impedances. As can be seen from Fig. 19 the inequalities
may not be satisfied for low frequencies and at the resonant frequency of the boost
inductor and output capacitor. Therefore it is important to verify the stability of the
system as part of the system design. At low frequencies the inequalities (6)-(7) are met
as long as the DC-DC converter input power is less or equal to the rated power of the
fuel cell. On the other hand to meet the design criteria at the resonant frequency of the
input impedance of the boost converter either the converter or the fuel cell impedances
have to be modified.
A method of modifying the output impedance of the fuel cell is by connecting a
supercapacitor in parallel to form a hybrid source. A small signal equivalent model of
the portable system powered by hybrid source is formed by combining the equivalent
model of the fuel cell and equivalent model of the supercapacitor derived in Section 2.2,
and is shown in Fig. 20. The effect of the parallel capacitor is displacement of the output
impedance of the fuel cell to the left as shown in Fig. 21, which increases the distance
between the output impedance of the fuel cell and the input impedance of the boost
converter. This helps satisfying the impedance inequalities. The modified output
impedance of the hybrid source system Zo_HS can be calculated by solving ladder R-C
form:

45
osc11
22
33
44
HS_o
ZsLR1sC
1R
1sC
1R
1sC
1R
1sC
1Z
+++
++
++
++
= (14)
where C1-C4, R1-R4 and Lsc are parameters of the supercapacitor and Zo is the output
impedance of the fuel cell (13).
Fig. 20. Small signal representation of portable system powered by hybrid source
Figure 21 shows the fuel cell output impedance for the full load condition (13), and
DC-DC input impedance frequency responses for six PC-10 supercapacitors connected in
series in order to match fuel cell operating voltage range. The supercapacitor charge state
is calculated assuming that the nominal fuel cell voltage (full load condition) is divided
equally between the supercapacitors, and the parameters are given in Table V. As can be
observed from this figure the capacitance needed to modify the output impedance of the
fuel cell in order to satisfy (6)-(9) is relatively small. In general the amount of

46
capacitance calculated to compensate for the voltage drop during the purging period is
sufficient to ensure that the impedance inequalities are met.
Fig. 21. Effect of forming the hybrid source
2.4.3 Experimental results
In order to verify the theoretical analysis experimental measurements were made.
Figure 22a shows the response of the system for the load step from zero to full load
when the fuel cell alone is used, while Fig. 22b shows the response of the system once
the 10F supercapacitor bank is connected across the terminals of the fuel cell. The output
voltage of the fuel cell varies from 16 V for no load to 10 V for full load and the boost
converter is designed to maintain a 19.5 V output voltage and it is rated for 30 W, which
is suitable for powering a laptop computer. The internal parameters of the fuel cell are
shown in Table IV, while parameters for supercapacitor are shown in Table V. As can be

47
seen from Fig. 22a both input and output voltages oscillate widely until the load is
removed, while Fig. 22b shows no oscillation in either input or output voltage.
a
b
Fig. 22. Dynamic behavior of a) Stand-alone fuel cell system b) Hybrid source system
Output Voltage
Fuel Cell Voltage
Output Voltage
Fuel Cell Voltage

48
Also in Fig. 22b, the input voltage decreases slowly until the new steady state is
reached. A conclusion can be drawn that the experimental comparison between the
system with the stand-alone fuel cell and the system with the hybrid source showed that
the latter had superior performance.
2.5 Influence of supercapacitor on hydrogen fuel consumption
In order to further investigate the benefits of using the hybrid source with the
supercapacitor in parallel with the fuel cell hydrogen flow of two PEM fuel cells was
measured. It is well known that current ripple injected from the DC-DC converter into the
fuel cell has a degrading effect on its performance. In order to investigate the possible benefit
of inclusion of the supercapacitor experimental measurements on the 20 W and 30 W fuel
cell stacks were made with high frequency ripple currents. The measurements consisted of
loading the stand-alone fuel cell and hybrid source with a square wave load current with 50%
duty cycle. The peak value of the load currents was set to two times the nominal currents of
the fuel cell stacks so that their mean values equaled their nominal values. The frequency of
the load currents was varied from 10 Hz to 200 kHz, and the hydrogen consumption of the
stacks was recorded.

49
1
1.01
1.02
1.03
1.04
1.05
1.06
1.07
1 10 100 1000 10000 100000 1000000
frequency [Hz]
flow
[pu]
FC Hybrid
a
0.991
1.011.021.031.041.051.061.071.08
10 100 1000 10000 100000 1000000
frequency [Hz]
flow
[pu]
FC Hybrid
b
Fig. 23. Hydrogen flow for the a) 20W and b) 30W fuel cells as function of load current ripple frequency with hybrid configuration or working alone

50
Figure 23a and Fig. 23b, show the hydrogen consumption as a function of the load
current frequencies measured from the 20 W and 30 W PEM fuel cells and the hybrid
sources constructed with them. The hybrid sources for 20 W and 30 W fuel cells were made
using the seven PC-10 and six PC-10 supercapacitors connected in series in order to match
the open circuit voltage of 17 V and 16 V respectfully. It can be observed from Fig. 23 that
the hydrogen consumption decreases for of the hybrid configuration. The magnitude of the
decrease in the hydrogen consumption is a function of the frequency of the ripple current.
The fuel cell voltage does not experience wide variation due to the high frequency ripple
current in hybrid configuration, which directly transfers to the smaller demand on hydrogen
flow. This proves that fuel cells in hybrid configuration can work longer with the same the
amount of hydrogen then the fuel cells operating alone.
2.6 Conclusion
In this chapter, the role of a supercapacitor in the design of fuel cell powered systems
is discussed. It is shown that the additional energy storage provided by the
supercapacitor connected at the terminals of a fuel cell can contribute to: (a) increased
steady state stability when powering constant power loads, (b) improved transient
stability against load transients, and (c) increased fuel efficiency (i.e. reduced hydrogen
consumption). Further, it is shown that the electric equivalent circuit of a fuel cell is
essential to establishing a design procedure to size the required supercapacitor. The
development of the equivalent circuit model for fuel cells and supercapacitors using
frequency analysis is presented and results discussed. Additionally, the benefits obtained

51
in steady state stability of the power conditioner when powered by the hybrid source are
analyzed and it is shown that such configuration possesses several advantages from the
energy management point of view. For transient stability analysis, the effect of fuel cell
internal impedance (extra element) along with the impedance of the supercapacitor
(nonlinear) on the transfer function of the DC-DC converter is analyzed. Finally,
experimental evaluation and comparison of fuel consumption in the conventional and
hybrid systems is performed, showing that the hybrid source has improved fuel
utilization.
From these results it is shown that the proposed approach permits the optimization of
energy management and improvement of the dynamic performance of the power
conditioner. Experimental results obtained on 20 W and 30 W PEM fuel cell/boost
converter systems demonstrate the validity of the proposed approach.

52
CHAPTER III
A HYBRID DC-DC CONVERTER FOR FUEL CELL POWERED
LAPTOP COMPUTERS
3.1 Introduction
Portable electronic technologies such as PDAs, notebook computers, and cell phones
have fueled a need for new, high-energy, small volume power supplies for both military
and commercial markets. Several of these devices are currently limited to battery
technologies, which, despite recent advances, are insufficient to provide the long-term
power. The resulting "power gap" [6] is simply the difference between the ever-
increasing power demands of mobile electronics and the amount of power available in
today's battery technologies. The "power gap" is driven by three main trends:
1. Mobile electronics are more fully-featured than ever before, demanding more
power.
2. Users are increasingly dependant on these mobile devices and are spending longer
periods of time without access to AC energy sources.
3. Improvements in today's battery technology have leveled out and are unlikely to
meet the increasing power needs in the future.
The fuel cells are potentially good candidates to replace batteries as power sources for
the next generation of laptop computers thanks to the high energy content of their fuels.
Two types of low-temperature fuel cells are primary candidates for portable applications:
Direct Methanol Fuel Cell (DMFC) and the Proton Exchange Membrane Fuel Cell

53
(PEMFC). In a fuel cell, power is continuous while fuel and oxygen are supplied, similar
to the gasoline/engine system which is used to power a car. The engine is purchased once
(with the car) and gasoline is replenished as needed for continuous operation. The same is
true in small fuel cell systems, which are expected to someday help power portable
electronic products such as notebook computers. Fuel capsules can be exchanged out
quickly without the need to wait for recharging. Users could carry spare fuel cartridges,
not extra batteries, to extend operation and enhance convenience. Fuel cells, especially
low-temperature types such as DMFC and PEMFC, are potentially good candidates to
replace batteries as power sources for the next generation of portable applications thanks
to the high energy content of their fuels. An example, Toshiba Corporation’s prototype of
a small form factor DMFC for portable PCs [7] is shown in Fig. 24.
Fig. 24. Toshiba’s DMFC for a laptop
The DMFC is a fuel cell which uses methanol as a fuel. Methanol is a particularly
economical, commercially available, source of energy for small fuel cells. It comes in
liquid form, can be easily transported and stored, and has a high energy density.
However, there are some problems associated with this type of fuel cell. First of all, it

54
requires a lot of expensive platinum catalyst material (5 to 20 times more expensive than
for the PEMFC) to ensure reaction, and secondly, its power density (i.e. the power
achieved per unit membrane surface) is relatively low compared to PEM systems that use
hydrogen. The DMFC is not as efficient as the PEM-cell (only 25% compared to 50%).
In addition, methanol needs to be diluted with water into 3% solution to avoid so called
crossover losses. This, however, presents a disadvantage in that it reduces the fuel cell
energy density and requires additional and unnecessary water ballast to be carried around
with the system. Some types of DMFCs get around this problem by using water
generated by the chemical reaction in the cell to dilute the methanol.
The PEM fuel cell is fuelled by pure hydrogen. Hydrogen reacts with oxygen taken
from the air or oxygen tank, producing electricity, heat and water. The PEM
configuration combines good efficiency (in the order of 50%) and excellent weight
characteristics of the fuel (hydrogen has a very high specific energy: 120 MJ/kg in
comparison with e.g. gasoline: 50 MJ/kg). Most problematic task associated with PEMs
is to store sufficient quantities of hydrogen into small volumes, due to their low energy
per-volume (10.8 kJ/m3). To minimize the volume, hydrogen can be stored in pressure
vessels or metal-hydrate cartridges. A trade-off is that this reduces the weight advantages
because of the relatively high weight of the storage medium (steel, or aluminum, or
composites).
Several electronics manufacturers are now seeking to combine the advantages of
methanol as a fuel with the high power density of PEM fuel cells by employing systems
equipped with micro-reformers that create hydrogen from methanol [36]. The problem is

55
that developers are facing challenges yet to be solved with regard to the miniaturization
of a complete system consisting of a reformer that produces hydrogen and the fuel cell
itself, coupled with the challenge of ensuring reliable operation over long periods of time.
3.2 The power consumption of a laptop computer
The power consumption of a laptop computer typically ranges between 25 W and 50
W depending on its performance. Table VI shows the variation of power consumption for
various tasks. Fig. 25 shows the time domain variation of power consumption when idle
and while saving a Microsoft (MS) Word document. In general batteries for laptops have
a voltage of 14.8 V and have a capacity ranging from 3000 mAh to 4000 mAh depending
on device performance and functionality. All-day computing for an ultra-light notebook
PC, typically requires about 120 Watt-hours (Wh) of energy for 8 hours of operation. A
fuel cell system designed for this application needs to be flexible and able to work with
the onboard battery and AC wall adapter unit.
TABLE VI LAPTOP POWER CONSUMPTION
Task Power Consumption [W]
0% CPU Bandwidth (backlight off) 8.23 0% CPU Bandwidth (backlight on) 13.13 100% CPU Bandwidth 30.01 Write to Hard Drive 18.2 Read from Hard Drive 18.4 Memory Read/Write 21.4 CD Playback 19.2

56
Fig. 25. Measured load on a Toshiba laptop computer [23]
3.3 Conventional power distribution architecture of a laptop computer
Conventional power distribution systems in laptop computers (Fig. 26) have a
variable voltage level which depends on whether the wall adaptor is connected or not
[22]. Normally the bus voltage of the distribution system varies between 19.5 V when the
wall adaptor is connected and 14.8 V when the laptop is running from the four-cell Li-Ion
battery. The voltage of a single battery itself is not constant, and varies from 2.7 V
minimum to 4.2 V maximum. This creates the battery bank voltage range from 10.8 V to
16.8 V if four cells are used. This power distribution architecture poses a problem from
the voltage regulator module (VRM) point of view. VRMs are connected to the
distribution bus and step down the voltage to supply different devices such as the
processor, memory, etc. The operating voltage of these devices is normally in the range
of 0.6 to 3.3 V to increase the speed of the computer, thus a large voltage reduction is
needed and therefore the power conversion efficiency is reduced. The most common
method for stepping the high DC bus distribution system voltage to lower levels is by
employing a non-isolated buck converter. In this type of configuration, the buck

57
converter’s duty cycle is very small, which compromises the efficiency and high
frequency operation.
Fig. 26. Conventional laptop power management architecture
In the existing laptop power system architecture shown in Fig. 26 multiple power path
switches are used to select the input source. When AC input is available, the horizontal
switches are on, connecting the AC-DC converter with internal DC-DC power supplies.
When the AC input is lost, vertical switches connect the battery bank with DC bus
distribution system and the energy from the battery is used for operation of the laptop.
3.4 Power distribution architectures for laptop computers powered by a fuel cell
No matter what kind of fuel cell is used, in the proposed distribution systems for
portable PCs inclusion of the fuel cell as an added energy source increases the run time of
the laptop and can potentially decrease the size of the on-board Li-Ion battery. In
conventional systems, multiple series-connected Li-Ion cells are used to provide efficient

58
energy storage. Using fewer batteries in series may reduce the voltage of the battery
bank, but it increases the current requirements of the Li-Ion batteries. This higher current
decreases the efficiency of energy conversion during charging and, more importantly,
discharging (as a result of internal battery and contact resistance). In our system, the fuel
cell as an additional power source decreases the power requirement on the battery bank,
so the size of the battery can be reduced without above mentioned consequences.
Four possible power distribution system architectures are discussed in this chapter.
The first three of the approaches discuss variations of a hybrid system consisting of an
AC-DC adapter, fuel cell and Li-Ion battery. In these systems the fuel cell is rated to
power the normal functions of the laptop and the AC-DC adapter is sized to power the
laptop and simultaneously charge the battery. In the fourth proposal, the Li-Ion battery is
eliminated and the AC-DC adapter and the fuel cell form one unit.
3.4.1 Proposed power distribution architecture # 1
This power distribution architecture shown in Fig. 27 is almost identical to the
conventional system (Fig. 26) with an added difference of an AC-DC/fuel cell hybrid
external adapter. When AC power is available, the DC bus distribution system is
regulated at 19.5 V and power is supplied to the laptop. In addition, the AC-DC adapter
has sufficient VA rating to also simultaneously charge the battery as well. However,
when AC power is unavailable/disconnected, fuel cell operation is enabled and the DC
bus distribution system is regulated at 19.5 V. The fuel cell is rated to supply the laptop
power and is interfaced to the DC bus distribution system using the synchronous boost

59
converter (Fig. 28) to regulate the output voltage to 19.5 V. This is necessary because of
the fluctuating output voltage of the fuel cell. This converter converts energy only in one
direction, from the fuel cell to the DC bus distribution system. The fuel cell stack can be
combined with a parallel connected supercapacitor module to improve its dynamic
response in the event of sudden load current changes. From the aspect of control, battery
charger operates as a voltage controlled current source. After the battery bank voltage
matches the reference voltage, the controller maintains the voltage constant and decreases
the current toward zero.
Fig. 27. Power distribution architecture #1with an external fuel cell
Fig. 28. Synchronous boost converter for fuel cell

60
The advantages of this power distribution architecture are as follows:
1) Utilizes the conventional variable DC bus distribution system (10.8 V to 19.5 V),
hence reduces cost of development and time to market.
2) The fuel cell and AC adapter can be integrated into one external package.
3) The fuel cell, along with the synchronous boost converter is electrically interfaced
to the AC adapter output.
4) In the absence of AC power, the fuel cell together with the on board Li-Ion
battery can cater to all-day computing.
5) In the event the external AC adapter and the fuel cell are disconnected then the on
board Li-Ion battery is capable of powering the laptop.
The disadvantages of this power distribution architecture are all inherited from the
conventional power distribution system and they are listed below.
1) Additional weight, volume of the fuel cell/AC-adapter is an issue.
2) Wide voltage variation in the DC bus distribution system (10.8 V to 19.5 V)
supplied to laptop’s DC-DC converters. Power conversion cost, size and
efficiency are all impacted by the range of input voltage.
3) The on-board battery charger contributes to power loss and adds to the complexity
of thermal management and noise management.
4) Even if the power transfer switches are low in on-resistance, there is an inevitable
voltage drop which further reduces efficiency.

61
3.4.2 Proposed power distribution architecture # 2
The architecture # 1 described in the previous section is identical to the conventional
system built for Li-Ion batteries and external adapters. The main aim of the architecture #
2 shown in Fig. 29 is to transfer the battery charging function external to the laptop. This
is accomplished by an external unit which consists of an AC adapter, fuel cell and a
hybrid DC-DC converter (Fig. 30). This system requires the connection between the
external unit and the laptop to have three wires (see Fig. 29). Fig. 30 shows the topology
of the hybrid DC-DC converter block which resides in the external unit in proximity of
the AC adapter and the fuel cell unit. The three wire connection (a, b, and g wires)
between the external unit and the laptop. “g” denotes ground and “a” and “b” are positive
(+) and negative (-) terminals. The power MOSFETs S3 and S4 constitute a DC-DC boost
converter and regulate the fuel cell terminal voltage to an acceptable level for the laptop
power distribution bus. The function of the MOSFET switches S1 and S2 in a bi-
directional buck-boost converter is to accomplish both the battery charging (boost mode)
and battery discharging function (buck mode). This configuration assumes that the
voltage produced by the AC adapter (a-b terminals) is lower than the on board battery
voltage. In the event the external unit (AC adapter and fuel cell) is disconnected from the
laptop, the MOSFET switch S5 internal to the laptop is controlled to turn on. This will
now enable the laptop to function only on Li-Ion battery power. Therefore the
architecture # 2 shown in Figs. 29 and 30 is highly versatile and employs hybrid power
sources to power the laptop.

62
Fig. 29. Proposed power distribution architecture # 2
Fig. 30. Topology of the hybrid DC-DC converter block shown in Fig. 29
The advantages of this architecture are summarized as follows:
1) The Li-Ion battery charging function is transferred to the AC-DC adapter and
hybrid DC-DC converter external to the laptop, thereby reducing the heat
dissipation and saving space inside the laptop. This reduction in heat dissipation
and space can now accommodate more complex features and/or additional
memory functions.
2) Changes to AC-DC adapter are minor and do not contribute to higher cost.
3) Minimized fan power and noise requirements within the laptop.

63
4) Better overall efficiency and power savings.
3.4.3 Proposed power distribution architecture # 3
Another possible power distribution architecture is shown in Fig. 31. The proposed
system employs lower DC voltages. This type of system is particularly suitable for AC-
adapters and fuel cell systems that are mounted external to the laptop in close proximity
(Fig. 24). In other words, there are no long wires connecting the external AC adapter to
the laptop; safety standards limit the current carrying capacity of such long connecting
wires to 5 A maximum. The architecture showed in Fig. 31 employs lower distribution
voltages (9 V to 10 V) which improves the power conversion efficiencies of several
onboard point of load DC-DC converters powering several loads. In order to employ a
variable voltage Li-Ion battery, a bi-directional DC-DC converter is necessary to be
installed inside the laptop (see Fig. 31).
When AC power is available, the DC distribution system bus is regulated at 10 V.
When the fuel cell is operational the DC bus distribution system is regulated at 9 V. The
bus voltage is reduced to enable the use of efficient, high frequency, low-voltage VRM
converters placed at the points of load [22]. This results in smaller and more efficient
computers and contributes to drastic reduction of generated heat.

64
Fig. 31. Power distribution architecture #3
The onboard Li-Ion batteries are charged only when the AC-DC converter is
connected to the DC bus distribution system. The bi-directional converter boosts the DC
bus distribution system voltage to charge the battery bank. Without the AC-DC/fuel cell
external adapter, the bi-directional converter steps down the battery bank voltage to
provide the low DC bus voltage (9 V). The advantages of the power distribution
architecture # 3 are as follows:
1) Single power train for battery charger (boost) and battery DC-DC converter
(buck). This reduces the number of necessary power switches and switching
regulators.
2) Provides the regulated low voltage input to laptop DC-DC converters. Power
conversion cost and size are reduced while efficiency is increased as a
consequence of the low input voltage.
3) Eliminates the need for power transfer switches.

65
4) Boosting the low voltage DC input to charge the battery minimizes the chopped
input current typical of buck converters lowering the electromagnetic
interference.
The associated disadvantages include:
1) Bi-directional DC-DC converter is placed inside the laptop where it dissipates the
heat while charging or discharging the DC bus distribution system.
2) Bi-directional DC-DC converter also occupies a large area of motherboard PCB.
3) Large component count increases the cost of this topology.
3.4.4 Proposed power distribution architecture # 4
The power distribution architecture #4 is shown in Fig. 32. In this system the Li-Ion
battery is eliminated and the AC-DC adapter and the fuel cell form one unit. When AC power
is available DC bus distribution system is regulated at 7 V while when the fuel cell is
operational the DC bus distribution system is regulated at 6 V.
Fig. 32. Power distribution architecture # 4

66
The advantages of this architecture are as follows:
1) No Li-Ion battery; additional battery space can be used for other functions.
2) Lower AC-DC component ratings and drastic increase in operating efficiency due
to low voltage (6-7 V) distribution bus.
3) Fuel cell is rated to supply the entire load.
4) Constantly controlled DC bus distribution system; therefore, easier design of the
laptop DC-DC converters, which could be smaller and more efficient.
5) Simpler control without the battery managing function.
6) No need for additional hardware (charger/discharger).
7) Smaller size of the laptop providing more room for the fuel cell system.
The disadvantages of this power distribution architecture are as follows.
1) Due to the absence of Li-Ion battery, the fuel cell has to supply both constant and
transient power needed, hence requiring a larger fuel cartridge.
2) In the absence of Li-Ion battery laptop cannot be operated without the fuel cell
and/or the AC adapter unit.
3) Changes in the existing system, high cost of development.
3.5 Design example for proposed power distribution architecture # 2
The key point in implementing the proposed power distribution system # 2 is the
design of a multi-input bi-directional DC-DC converter, shown in Fig. 30, to suitably
interface the different energy sources (wall adapter, fuel cell, battery) to the loads. The
integrated subsystem encompassing the AC-DC inverter, the fuel cell stack, the

67
supercapacitor and the proposed hybrid converter is placed outside the laptop casing as
indicated in Figs. 29 and 30. The fuel cell is interfaced to the DC link using the
synchronous boost converter to regulate the output voltage to 9 V. This is necessary
because of the fluctuating output voltage of the fuel cell. This converter, together with S3
and S4 MOSFETs, converts the energy only in one direction from the fuel cell to the DC
link; the S4 MOSFET is gated while the S3 acts as a diode preventing the energy from
flowing in opposite direction. The fuel cell has a parallel-connected supercapacitor to
improve the dynamic response during sudden load changes [37].
The battery bank is connected through the bi-directional buck/boost converter to the
DC link. The bi-directional converter boosts the DC link voltage by gating the S2
MOSFET to charge the battery bank. In case of the discharging, the bi-directional
converter steps down the battery bank voltage by gating the S1 MOSFET to provide the
low 8 V DC bus voltage. The AC-DC converter regulates the voltage at its output to 10 V
using conventional architecture.
The control function is realized using the Texas Instruments (TI) DSP 2407 and the
battery manager system. The battery manager system consists of a set of sensors which
collects precise battery data (temperature, voltage, charge and discharge currents). The
DSP processes the battery manager’s data and computes the charge time and the
charging current. While charging, the bi-directional DC-DC converter operates as a
voltage controlled current source. After the battery bank voltage matches the reference
voltage, the controller maintains the voltage constant and decreases the current toward
zero. Once the battery is fully charged the controller keeps the bi-directional converter

68
active by switching it between the buck and boost mode. This is necessary to maintain
the average battery current zero while waiting for the possible loss of AC and fuel cell
power.
Two loops are used to control the hybrid DC-DC converter. While operating in buck
mode both loops are working simultaneously. The current control loop regulates the
battery discharging current (positive current) and the voltage loop regulates the DC link
voltage at 8 V. Operation in boost (battery charging) mode first employs just the current
control loop to regulate the constant battery charging current (negative current) and
when the battery voltage is high enough the negative current reference starts increasing
slowly towards zero current and in that period the voltage loop regulates the constant
battery voltage. A converter used to connect the fuel cell to the DC link is controlled
with another voltage control loop to keep the DC link voltage at 9 V.
In the presence of the AC power DC link is powered through the AC-DC converter
and both the fuel cell and the battery are inactive. If the DC link voltage drops below 9.8
V, the battery takes over the supply of the loads and the fuel cell gets activated but kept
off the DC link until the start-up procedure is over. Once the fuel cell voltage reaches the
nominal value, the fuel cell is connected to the DC link and the hybrid DC-DC converter
switches to boost mode and starts charging the battery. After the battery is fully charged
the fuel cell alone is supporting the DC link. This behavior is shown in simulation results
in Fig. 33. The operating scenario is as follows: the AC power is disconnected at t = 0.1
ms and the battery takes over supporting the DC link. After the fuel cell start up
procedure is completed at t = 20 ms it starts to power the DC link and charge the battery.

69
There is the change of load from half load to full load at t = 50 ms; the DC link voltage
is still regulated, although with the higher ripple. Finally, the AC power is back at t = 80
ms and the DC link is again supported through the AC-DC converter. The simulation
results confirm the feasibility of the proposed hybrid DC-DC converter configuration.
Fig. 33. Simulation results
To design the fuel cell system for an AC-DC/fuel cell external adapter, first the load
current of a Dell Latitude C600 computer was measured during the peak load (Fig. 34)
and standby operation (Fig. 35) [23].

70
The measured voltage of the AC-DC adapter was 19 V so the standby load of the
laptop is approximately 10 W and the peak loads go up to 30 W. Therefore, a 30 W fuel
cell (Model 25-10, BCS Fuel Cells, Inc.) would be sufficient to power the normal
functions of the laptop. Table VII shows the specifications of the chosen 30 W fuel cell.
Li-Ion battery is capable of operating for 2 to 4 hours so the fuel cell should provide the
remaining 20 hours to ensure all day computing.
Fig. 34. Load current of Dell Latitude C600 during the saving of a MS Word document

71
Fig. 35. Load current of Dell Latitude C600 during normal use
TABLE VII BCS PEM FUEL CELL SPECIFICATIONS
Specifications of the FC Value: Maximum power 35 W Cell voltage 0.8 V Current density 0.24 A/cm2 Nominal voltage 6 V Nominal power 30 W Electrode area 25 cm2 Operating hydrogen pressure 0-2 psi Max operating temperature 70 oC Conversion efficiency 52% [38]

72
TABLE VIII CHARACTERISTICS OF THE DESIGNED SYSTEM
Li-Ion PEMFC AC-adapter Max power main system 22 W 35 W 60 W Max added power sub system 2.5 W Voltage 14.8 V 6 V 19.0 V Total capacity 65 Wh 700 Wh Volume of energy system 210 cm3 150 cm3 102.125 cm3 Use time 3 h 20 h Energy density total system 0.31 Whcm-3 4.67 Whcm-3
The average hydrogen flow is 0.4 l/min (liter/minute), which results in needed 480 l
for 20 hours of operation. Hydrogen volume can be reduced by using a pressurized
hydrogen tank; using a 3500 lbf/in2 (psi) tank reduces the volume of the required
hydrogen tank to 2 l, which is acceptable from the laptop size point of view. Dimensions
of such hydrogen tank could be 30 cm X 5 cm X 13 cm (width X height X depth). Table
VIII shows the characteristic parameters of the designed system.
3.6 Experimental results for proposed power distribution architecture # 2
In order to verify the feasibility of the concept, the proposed hybrid multi input DC-
DC converter was built. Experiments were carried out on commercially available four
cell Li-Ion batteries, Maxwell supercapacitors and a 30 W PEM fuel cell (Model 25-10,
BCS Fuel Cells, Inc.). The synchronous boost converter connecting the fuel cell to the
DC link was designed to sustain the 9 V output voltage and it is rated for 30 W, which is
suitable to supply the laptop computer. The Maxwell supercapacitors have been parallel-
connected to the fuel cell to improve the dynamic response during sudden load changes.

73
The Li-Ion batteries were connected through the 30 W bi-directional buck/boost
converter to the DC link. Experimental waveforms are shown in Fig. 36 and Fig. 37.
Fig. 36 shows the DC bus voltage and bi-directional inductor current in a setting
when first the battery is supporting the DC link (8 V) and then after the fuel cell
completes the start-up procedure and starts to power the DC link with the increased
voltage of 9 V. While the battery is supporting the DC bus, the bi-directional converter is
working in the buck mode regulating the DC-bus voltage to 8 V, discharging the battery
with a constant positive current of 0.5 A. After the fuel cell voltage is raised over the
threshold of 8.8 V, the fuel cell is connected to the DC link. During this time interval the
controller changes the current reference slowly to its negative charging value to avoid
current overshoots. The fuel cell first charges the battery with constant (negative) current
through the bi-directional converter working in the boost mode. After charging the
battery the bi-directional converter maintains the average battery current at zero, waiting
for the possible return of AC power.

74
Fig. 36. DC bus voltage and bi-directional inductor current with the fuel cell connected
Fig. 37 shows the transient response of the synchronous boost converter connecting
the fuel cell to the DC link. While the fuel cell was supporting the DC link, the load was
changed from no load to full load and then back to no load again.
Fig. 37. DC bus voltage and fuel cell current during load switching

75
From Fig. 37 it can be seen that the DC link voltage is constant with no oscillations.
The load current is shown in the lower trace in Fig. 37 and changes between 0 A and 2.8
A.
3.7 Conclusion
This chapter discusses in detail the conceptual design behind the four proposed
power distribution architectures for fuel cell powered laptop computers. For each
architecture advantages/disadvantages are highlighted. The power consumption of two
different laptop computers is measured for different types of loads to determine transient
and steady state needs of the system.
Furthermore, a hybrid multi-input bi-directional DC-DC converter for applications in
fuel cell powered laptop computers has been proposed. The purpose of this multi-input
converter is to suitably control the energy flow from multiple energy sources to enable all
day computing. The AC-DC adapter and the fuel cell and its components are integrated
with the converter in an external unit while the conventional Li-Ion battery is placed
within the laptop casing. A design example highlighting the parameters of the fuel cell
stack, Li-Ion battery, and supercapacitor modules appropriately sized for a typical load on
a laptop computer is shown. Analysis, design and control aspects of the hybrid DC-DC
converter are presented to meet performance requirements for all day computing.
Simulation results verified the performance of the system under various input and output
power conditions. Experimental results show that the bi-directional converter is working
as expected in both operating modes, bucking the voltage down to usable levels when the

76
battery is supporting the DC link and boosting the fuel cell voltage to charge the batteries
and sustain the DC link when the fuel cell is maintaining the DC link voltage. Transient
behavior of the DC link during the sudden load change is excellent due to the presence of
supercapacitors. This topology stores and delivers energy more efficiently than
conventional systems. Therefore this proposed hybrid DC-DC converter system can also
be used for energy storage for other portable applications.

77
CHAPTER IV
DESIGN CONSIDERATIONS FOR FUEL CELL POWERED UPS
4.1 Introduction
Uninterruptible power supplies (UPS) provide electric power for critical applications
when the quality of the energy source, i.e. utility power, is not adequate or fails entirely.
Generally, there are three basic types of UPS systems – Standby UPS, Line-Interactive
UPS and Double Conversion UPS [39-40]. Regardless of the type, conventional UPS
employ batteries and/or engine generators as their main power sources. Typical UPS
systems are built around rechargeable batteries such as sealed lead-acid (SSLA) or
nickel cadmium (Ni-Cd) batteries. However, these contain toxic heavy metals such as
cadmium, mercury, and lead and may cause serious environmental problems if they are
discarded without special care; furthermore, these batteries suffer from life expectancy,
footprint and weight issues. Similarly, engine generators have issues with startup,
maintenance, noise and emission. Recently other methods of energy storage such as fuel
cells, flywheels, supercapacitors and combinations of the above have come into use.
The UPS market can help fuel cell technology to become a commercial solution. The
end of life of a fuel cell can be extended by the intermittent operation of UPS systems
and the per kilowatt price associated with UPS operation, although currently one of the
highest on the market, can be driven down in the long run by fuel cell technology [1].
Among various kinds of fuel cells, Proton Exchange Membrane Fuel Cells ( PEMFC )
are compact and lightweight, provide a high output power density at room temperature,

78
as well as ease of start-up and shut down operations [8]. Further, unlike batteries, fuel
cells can continuously provide power as long as the reactants are supplied. This feature
is especially useful when the duration of the power outage is uncertain.
It is important for the UPS system to be able to immediately take over the full load at
the inception of the power outage or out-of-tolerance situation to avoid any data or
production loss, uncontrolled system shutdown or malfunctioning of the devices. Some
critical applications do not allow even several tens of millisecond power interruption. As
is well known, fuel processors have a delay as long as several tens of seconds, and the
fuel cell cannot take over the full load if its membrane is not properly humidified [2].
For this reason, a supercapacitor module is employed to compensate for these response
delays by supplying the required instantaneous energy, which is stored during the normal
operation. This energy can be used to handle overload conditions as well.
Motivated by the situation described above, this chapter deals with the design
considerations for a 1.5 kVA single–phase fuel cell-powered passive stand-by UPS
system with one hour of backup power employing modular (fuel cell & power converter)
blocks. Interactions between the internal impedance of the fuel cell and steady state and
transient stability are investigated. A design example for the DC-DC full bridge
converter and sizing of commercially available supercapacitors as well as fuel
calculations are presented.

79
4.2 Classification of UPS systems
Static (or Solid State) UPS systems are classified into three different categories: (a)
Online UPS, (b) Offline UPS and (c) Line interactive UPS. Static UPS systems have a
broad variety of applications from low power personal computers and
telecommunication systems, to medium power medical systems, to high power utility
systems. Their main advantages are high efficiency, increased reliability and low THD.
4.2.1 Offline UPS topology
Offline UPS configuration is also known as “standby UPS”. Fig. 38 shows the
offline UPS configuration. It consists of a battery charger, a battery bank, a DC-AC
inverter, and a static transfer switch. The static transfer switch enables the load to be
connected to the input AC power supply, while the battery charger ensures the battery
bank is adequately charged. In the event of a power loss and/or a disturbance, the static
transfer switch switches to the DC-AC inverter and powers the load from the battery
bank. When the input AC power is restored, the transfer switch transfers the load back to
the AC line, typically within 1/4th of a cycle.
The main advantages of this configuration are its simple design, low cost, and small
size. On the other hand, lack of real isolation of the load from the AC line and no output
voltage/frequency regulation are the main disadvantages.

80
Fig. 38. Offline UPS Configuration
4.2.2 Online UPS topology
The online UPS configuration is also known as “double-conversion UPS”. Fig. 39
shows the block diagram of a typical online UPS. The rectifier/charger continuously
supplies the DC bus and the DC-AC inverter powers the load. The UPS system therefore
is in continuous operation and supplies the load with regulated voltage and frequency
irrespective of the condition of the input AC line. In the event that the input AC is
unavailable, the power from the battery bank is utilized. The function of the static switch
(Fig. 39) is to provide redundancy in case the UPS malfunctions and/or overload. The
main disadvantage of this configuration is its high cost and continuous operation and
system losses.

81
Fig. 39. Online UPS configuration
4.2.3 Line interactive UPS topology
A typical Line-interactive UPS system topology is shown in Fig. 40 and consist of a
static switch, a bi-directional converter, and a battery bank. A line interactive UPS can
operate either as an online UPS or as an offline UPS. When the AC line is within the
preset tolerance, it feeds the load directly.
Fig. 40. Line interactive UPS topology

82
The AC-DC converter is connected in parallel with the load and charges the battery.
It may also supply the reactive power required to keep the power factor close to unity or
to regulate the output voltage. In the event of a power loss, the DC-AC supplies the load
from the battery bank and the static switch disconnects the AC line. The main
advantages of the line interactive UPS is its simplicity in design, high reliability and
lower cost compared to an online UPS system. The main disadvantage is the lack of
effective isolation of the load from the AC line and lack of regulation of the output
frequency.
4.3 Proposed fuel cell powered UPS system architecture
Fig. 41 shows the block diagram of a proposed fuel cell powered line interactive
UPS system configuration. The approach consists of a fuel cell stack supplied by a fuel
processor and/or hydrogen storage, a supercapacitor module for energy storage, a DC-
DC converter and a DC-AC inverter along with static transfer switches. Normally, the
utility power is transferred to the load through the static switch module (SSM). The
proposed system is designed to be battery-less.

83
Fig. 41. Proposed fuel cell powered passive stand-by UPS system
At the initial start, the fuel cell charges the supercapacitor, and then supplies 10% of
the rated load along with the utility. In the event of a power outage or out-of-tolerance
situation the controller turns the SSM off, thereby the fuel cell and its power converter
module start to supply the full load alone. At the moment of the transition from the
normal mode to fuel cell powered mode, the system is not able to take over the full load
due to the slow dynamics of the fuel processor. The fuel processor is a system which
cleans and then converts conventional fuels (natural gas, other gaseous hydrocarbons,
methanol, naphtha, or coal) into a gas containing hydrogen. This proposed topology
overcomes this drawback by placing the supercapacitor in parallel with the fuel cell.
This module transfers the energy that was stored in the supercapacitor during the normal
mode operation to the load at the initial start to make up the instantaneous power
shortage. Stored energy can also be used to handle the transient power shortage due to
load step changes and/or overload conditions for a short time. When the transient

84
situation is over, the fuel cell supplies the minimum power to the load and at the same
time recharges the supercapacitor. The control circuit monitors the utility and the fuel
cells status continuously. When the system detects a utility disturbance condition, it
controls the fuel cell and power converter modules to supply more power. After the
disturbance, the controller connects the utility to the load through a synchronization
process.
The advantages of the proposed approach over conventional UPS systems are as
follows:
1) Due to the absence of batteries and an engine generator, it is environmentally
friendly, clean and quiet.
2) In the proposed fuel cell powered UPS the amount of available power is a
function of hydrogen availability. This is an advantage compared to the battery
based UPS whose state-of-charge (SOC) is not always precisely known.
3) No delay time is required to take over the full load when the power disturbance
occurs due to fast discharging characteristics of the supercapacitor.
4) The system possesses good overload handling capability due to the
supercapacitor.
5) Continuous power generation is possible as long as the reactant gases are
supplied to the fuel cell.
Fig. 42 shows the detailed circuit schematic of the proposed architecture. The DC-
DC conversion stage of this architecture consists of the parallel connection of the Ballard
Nexa fuel cell and the supercapacitor followed by the full-bridge two-inductor converter.

85
The need for a transformer with very low and controllable leakage inductance makes the
coaxial winding transformer (CWT) the preferred structure [41].
At initial startup of the system the fuel cell is used to charge the supercapacitor.
After the startup process is finished, and in order to keep the fuel cell at working
temperature, the full bridge DC-DC converter is used to supply 10% of the load rated
power. Additionally, when the load changes suddenly, the UPS system is now able to
respond promptly to the power demand change due to the supercapacitor. This UPS
topology is also useful for handling the instantaneous overload situation. If the load
demands more than the rated power momentarily, the energy stored in the supercapacitor
can be utilized to supply the load thereby preventing the fuel cell from being overloaded.
It is obvious that system delay or voltage drop is unavoidable without this auxiliary
energy storage system in the case of sudden load change and/or overload. The DC-AC
conversion stage of this architecture consists of a DC-AC IGBT inverter and produces
the high quality sinusoidal 120 V output voltage.
Fig. 42. Circuit topology of the proposed fuel cell powered UPS system

86
An important variable in the design of the fuel cell power conditioner is the amount
of current ripple that the fuel cell can withstand. Since the reactant utilization is known
to impact the mechanical nature of a fuel cell, it is suggested in [42] that the varying
reactant conditions surrounding the cell (due to current ripple) govern, at least in part,
the lifetime of the cells. Both the magnitude and the frequency of the current ripple are
important. For fuel cells powering single phase loads (60 Hz), the current ripple of
concern is twice the output frequency i.e. 120 Hz. A limit of 0.15 pu (per-unit) (i.e. 15%
of its rated current) from 10% to 100% load is specified [24]. In case of single phase
inverters with dual output voltage (120 V/240 V) there is a possibility of 60 Hz current
ripple injection into the fuel cell under unbalanced loading conditions (i.e. one output
phase loaded and the other unloaded). A limit of 0.1 pu is specified for 60 Hz current
ripple from 10% to 100% load [24]. Further, the magnitude of the low frequency current
ripple drawn from the fuel cell by the DC-DC converter is largely dependent on the
voltage loop response characteristics. Also the DC-link capacitor size determines the 120
Hz voltage ripple on DC-link, which in turn has an impact on the input current drawn
from the fuel cell. It should be noted that switching frequency components in the DC-DC
converter can be easily filtered via a small, high frequency capacitive filter. Measures
that are suggested for limiting the fuel cell current ripple are:
1) Installing an input filter to reduce the 120 Hz component of the current ripple to
0.15 pu; however, this approach contributes to additional size, weight and cost of
the unit.

87
2) Increase the size of DC-link capacitor in the DC-AC inverter. Similarly, the size,
weight, and cost are of concern.
3) Reduce the response time of the voltage loop of the DC-DC converter which will
affect the regulation of the DC-link and impact the quality of inverter AC output,
and possibly increase the size of output AC filter.
4.4 Full bridge two-inductor rectifier
At the power level of 1200 W, the preferred topology is full-bridge DC-DC
converter with isolation on the intermediate high frequency AC link. The main
advantages of this topology include constant frequency operation, which allows for
optimum design of the magnetic filter components, PWM control, minimum VA
stresses, and good control range and controllability. Major drawbacks of this topology
are high-voltage stress induced by the parasitic inductances following diode reverse
recovery and increase in device switching losses as the switching frequency is
increasing.
Various soft switching schemes (zero voltage switching (ZVS)) and (zero current
switching (ZCS)) have been proposed to improve the performance of hard switching
converters.[43-44] Most topologies are subject to diode recovery problems. A solution
for this problem is a full-bridge DC-DC converter with two-inductor rectifier shown in
Fig. 42, which was proposed in [45]. For this topology, ZVS is achieved using the
energy stored in the output filter inductors instead of the leakage inductance energy. In
fact, the transformer leakage inductance is reduced drastically to allow output diode

88
commutation prior to switching the primary voltage to the other rail. This, in turn, results
in elimination of secondary voltage spikes. The advantages of the proposed topology
include the following:
1) Fixed frequency operation with PWM control and minimum VA ratings.
2) ZVS for the main devices is achieved using the energy stored in the secondary
filter inductors.
3) Wide load range with ZVS.
4) Utilizes the low leakage inductance of a coaxial winding transformer to achieve
soft switching for the secondary diodes.
5) No lost duty cycle since the secondary diodes commutate under zero voltage.
6) No voltage spike in the secondary circuit due to the soft switching of the
secondary diodes.
7) Utilizes the circuit parasitic elements effectively.
4.5 Fuel cell equivalent circuit
Since fuel cells have internal impedance, the starting point to properly design a fuel
cell powered UPS is to obtain an equivalent electrical circuit model. Section 2.1 explains
in detail how the equivalent model of the fuel cell was obtained. That same approach
was repeated for Ballard Nexa fuel cell. The resistance and reactance of the fuel cell
stack for light load, medium load, and full load for frequencies ranging from 0.2 Hz to
20 kHz are shown in Fig. 43. The equivalent circuit parameters of the fuel cell whose
response is shown in Fig. 43 are listed in Table IX.

89
0 0.1 0.2 0.3 0.4 0.5-0.1
-0.05
0
0.05
0.1
Resistance [Ohm]
Rea
ctan
ce [O
hm]
Light load
Full loadHalf load
0.2Hz20kHz
Fig. 43. Nyquist plot for a 1200W fuel cell stack
It can be observed from Table IX and from the Nyquist plot in Fig. 43 that the fuel
cell equivalent circuit parameters are a function of the output load. Also from the
parameters in Table IX it can be calculated that the dominant time constant of the stack,
given by Rp2 and C2 is also load dependent and varies from 8.97 ms (light load) to 20.37
ms (full load).
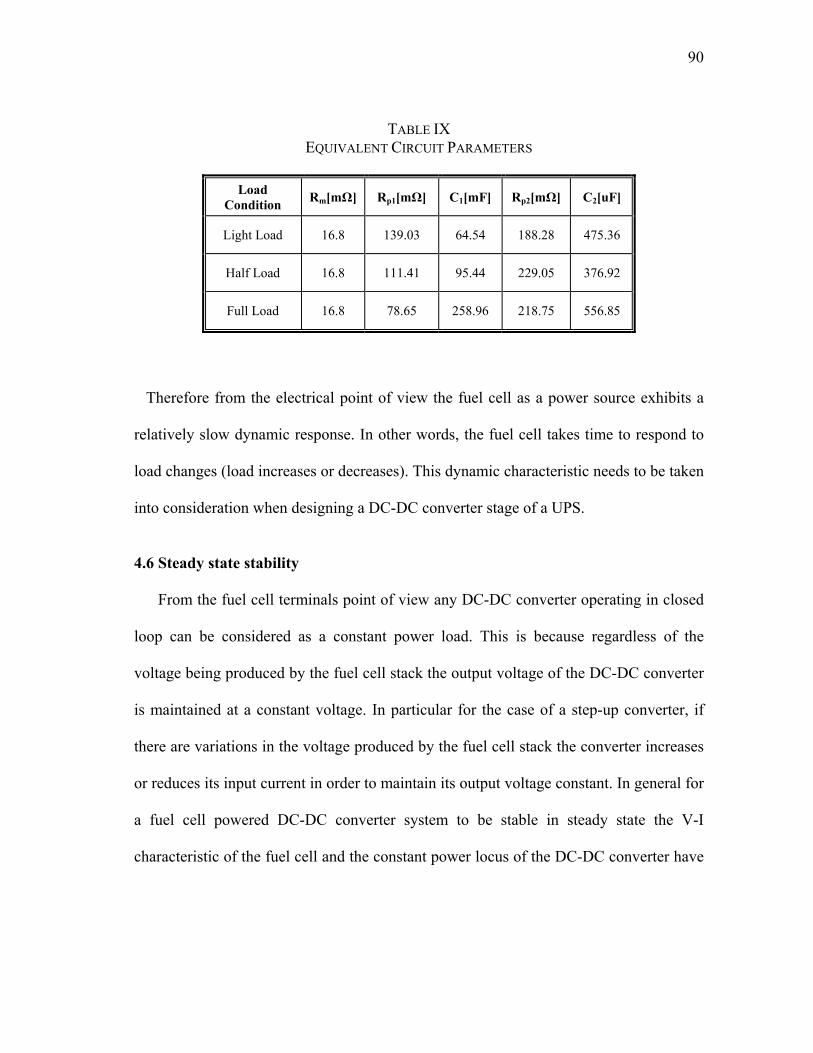
90
TABLE IX EQUIVALENT CIRCUIT PARAMETERS
Load
Condition Rm[mΩ] Rp1[mΩ] C1[mF] Rp2[mΩ] C2[uF]
Light Load 16.8 139.03 64.54 188.28 475.36
Half Load 16.8 111.41 95.44 229.05 376.92
Full Load 16.8 78.65 258.96 218.75 556.85
Therefore from the electrical point of view the fuel cell as a power source exhibits a
relatively slow dynamic response. In other words, the fuel cell takes time to respond to
load changes (load increases or decreases). This dynamic characteristic needs to be taken
into consideration when designing a DC-DC converter stage of a UPS.
4.6 Steady state stability
From the fuel cell terminals point of view any DC-DC converter operating in closed
loop can be considered as a constant power load. This is because regardless of the
voltage being produced by the fuel cell stack the output voltage of the DC-DC converter
is maintained at a constant voltage. In particular for the case of a step-up converter, if
there are variations in the voltage produced by the fuel cell stack the converter increases
or reduces its input current in order to maintain its output voltage constant. In general for
a fuel cell powered DC-DC converter system to be stable in steady state the V-I
characteristic of the fuel cell and the constant power locus of the DC-DC converter have

91
to intersect at one point, which sets the operating condition of the system. If the two
curves do not intersect the source is not able to meet the power demanded by the load.
Fig. 44. Fuel cell polarization curve and load constant power locus
Fig. 44 shows the V-I characteristic of the commercial 1200 W fuel cell whose
parameters were obtained in the previous section. This figure also shows the constant
power locus of a 1200 W DC-DC converter operating at full and half load. As can be
observed from Fig. 44 the constant power locus intersects the V-I characteristic of the
fuel cell, and therefore the power requirements of the load are met. However, if the
voltage produced by the stack experiences variations due to a reduction in its fuel
pressure the curves may not intersect, especially for loads close to full power where
voltage characteristic of the fuel cell drops quickly as the load current increases. If the
curves do not intersect there is a mismatch between the power demanded by the load and
the power that the stack can produce. Moreover, if the voltage at the input of the DC-DC
converter drops its controller will increase the input current which results in an
0 1 2 3 4 5 60
1
2
3
4
5
Fuel
Cel
l Vol
tage
[V]
Load Current [A]
Polarization curve
Middle Load-Constant Power Locus
Full Load-Constant
Power Locus

92
additional drop in the fuel cell voltage. In other words, a positive feedback takes place
which leads to system instability.
To avoid this problem an energy buffer such as a supercapacitor is required to ride
through transient voltage disruptions in the fuel cell output as explained in detail in
Chapter II.
4.7 Transient stability
The characteristics of the internal impedance of the fuel cell affect the dynamics of
the DC-DC converter, as was explained in detail in Section 2.4.2. The DC-DC converter
used for proposed UPS system is a full bridge with two-inductor converter, which is
completely different from the boost converter for portable applications. All converter
transfer functions need to be checked and the fuel cell impedance influence, which
determine the transient stability, needs to be reexamined in this case. A fuel cell
connected to the input terminals of the full bridge converter is shown in Fig. 45.
Fig. 45. Fuel cell DC-DC converter system

93
If the internal impedance of the fuel cell is considered, Middlebrook’s extra element
theorem [21] can be used to analyze the effect of the fuel cell onto the dynamics of the
converter. Application of the theorem results in the system shown in Fig. 46, where the
fuel cell output impedance is modeled as an extra element in the system.
Fig. 46. Modeling of the fuel cell impedance effect
It can be found that the control-to-output transfer function of the converter when the
fuel cell is considered is given by (5)
)s(Z)s(Z1
)s(Z)s(Z1
)s(G)s(G
D
oN
o
0Zvdvd o+
+⎟⎠⎞⎜
⎝⎛= =
(5)
where 0Zvd o)s(G = is the converter transfer function when the supply is an ideal
voltage source, ZN(s) is the input impedance of the converter under the condition that the
feedback controller operates ideally, ZD(s) is the input impedance of the converter under
the assumption that 0)s(d = , and Zo(s) is the output impedance of the fuel cell. The
small signal model for a full bridge converter is shown in Fig. 47a. If the fuel cell

94
equivalent circuit model is added to the circuit the small signal equivalent shown in Fig.
47b is obtained. From Fig. 47a the converter transfer function when the supply is an
ideal voltage source Gvd(s), and input impedances of the system, ZN(s) and ZD(s), are
given by:
ssoindo
2o
2
o
dovd
LC2RQ,
CL2,nVG
sQ
s1
1G)s(G
===
++
=
ω
ωω (15)
)sCR1(Dn2
CRLssLR2)s(Z 22
s2
sD
+
++= (16)
22N
DnR2)s(Z −= (17)
where Vin is the nominal input voltage, D is the converter duty cycle, Ls and C are the
inductor and capacitor of the converter, n is the a turns ratio of the transformer and R is a
load resistance.
a)
b)
Fig. 47. a) Small-signal models for full bridge converter; b) When connected to a fuel cell

95
From Fig. 47, the output impedance of the fuel cell equivalent circuit is given by
(13).
1)CRCR(s)CCRR(s
RRR))CC(RR)CRCR(R(s)CCRRR(sZ
22p11p212p1p2
2p1pm212p1p22p11pm212p1pm2
o+++
+++++++= (13)
By plotting the magnitudes of the converter input impedances and fuel cell output
impedance (16,17,13) for the fuel cell parameters shown in Table IX and for a 1200 W
full bridge converter designed to operate in continuous conduction mode with the 296
mH inductance and 10 mF output capacitance, the graph in Fig. 48 is obtained.
100
102
104
106
-100
-50
0
50
100
Frequency [Hz]
Mag
nitu
de [d
B]
Magnitude [dB]
ZN(s) ZD(s)
Zo light load(s)
Zo half load(s)
Zo full load(s)
[rad/s] Fig. 48. Impedances for fuel cell full bridge converter system
It was shown in Chapter II that the internal impedance of the fuel cell has an effect
on the control-to-output characteristic of the DC-DC converter stage. Because of the
internal impedance of the fuel cell the gain of the converter at low frequencies is
reduced, and the gain margin of the converter drops. This is depicted in Fig. 49 which

96
shows the open loop control-to-output characteristic of a step-up DC-DC converter
operating from an ideal source and from a Ballard Nexa fuel cell. As can be seen from
this figure, when this particular fuel cell is used as a power source there is a significant
difference in the gain margin and phase margin between two cases.
This can be also inferred from the impedance plot shown in Fig. 48, since the fuel
cell impedance and DC-DC converter impedance curves intersect. In order to meet the
design criteria (6-9) in Section 2.4.2 either the converter or the fuel cell impedance have
to be modified. A method of modifying the output impedance of the fuel cell by
connecting a supercapacitor in parallel was shown in Section 2.4. This will generate
displacement of the output impedance of the fuel cell to the left as shown in Fig. 50 and
increase the distance between the output impedance of the fuel cell and the input
impedance of the DC-DC converter.
100
102
104
106-100
0
100
200
Frequency [rad/s]
Mag
nitu
de [d
B]
Bode Diagrams
100
102
104
106-200
-100
0
100
Frequency [rad/s]
Phas
e [d
eg]
Ideal sourceFuel cell source
Ideal sourceFuel cell source
Fig. 49. Control-to-output characteristic for DC-DC converter stage supplied from ideal source and fuel
cell

97
100
102
104
106-400
-300
-200
-100
0
100
Frequency [rad/s]
Mag
nitu
de [d
B]
Bode Diagram
ZN(s)
ZD(s)
Zo sc(s)
Fig. 50. Impedances for fuel cell full bridge converter with supercapacitor
4.8 Design example
4.8.1 Specifications of the proposed fuel cell powered UPS
Table X shows a typical specification of the proposed fuel cell powered UPS system.
The fuel and emission specifications correspond to Ballad-Nexa fuel cell stack [46]
shown in Fig. 51. Table XI shows the specifications of the Ballard-Nexa fuel cell stack.
Performance ratings are largely determined by the power conditioning unit design along
with the associated size of the energy storage.

98
TABLE X SPECIFICATION OF PROPOSED FUEL CELL POWERED UPS
Performances Power Rating VA/W 1500 VA/1080 W Technology Passive stand-by Output Voltage/Frequency 120V± 3%, 50/60 Hz ± 0.5 % Overload Capacity >110% <130% : 12s then on by-pass,
>130% : 1.5s then on by-pass Current Ripple 120 Hz, 24.7% RMS 35% peak-peak Fuel Composition 99.99% dry gaseous hydrogen Consumption Rate 900 standard liters of hydrogen/kWhr Supply Pressure 75 PSIG Emissions (Water and Heat) Water Exhaust Rate 750 ml/kWhr Heat Exhaust Rate 1.5 kW/1 kW electricity produced
TABLE XI SPECIFICATIONS OF THE BALLARD-NEXA FUEL CELL STACK
Performance : Rated net power
Rated current DC voltage range Operating lifetime
1200 watts 46 Amps 26 to 50 Volts 1500 hours
Fuel : Composition Supply pressure Consumption
99.99% dry gaseous hydrogen 10 to 250 PSIG ≤ 18.5 SLPM
Operating Environment :
Ambient temperature Relative humidity Location
3°C to 30°C (37°F to 86°F) 0% to 95% Indoors and outdoors
Physical : Length x width x height Weight
56 x 25 x 33 cm (22 x 10 x 13 in) 13 kg (29 lbs)
Certification : CSA, UL Emissions : Liquid water
Noise 0.87 liters (30 fluid oz.) maximum per hour2 ≤ 72 dBA @ 1 meter
Integration : Fuel interface Electrical interface Control interface
45° flared tube fitting for 1/4" OD tubing – metallic #8 AWG electrical wire Full duplex RS 485

99
4.8.2 Fuel capacity
In this section a method to calculate the amount of hydrogen required to supply 1
kWh is shown. The [47-49] detail an approach from the chemical engineering point of
view. However, a more simplistic approach is presented here with some assumptions.
Fig. 51. Ballard Nexa fuel cell
The required output power = 1 kW
The hydrogen density is = 0.09 kg/m3
Specific heating value of hydrogen is = 120 MJ/kg
This is the energy that we can get by burning the hydrogen, which is its theoretical
maximum. Only part of this energy can be utilized to produce the electricity via fuel cell
due to other losses as explained below. A typical PEM fuel cell efficiency can be
calculated as follows:

100
100*)producedpowerTotal
producedpowerNet(*)nutilizatioFuel(*voltageoutputlTheoretica
voltageoutputcellfuelActual
efficiencyFuelcellPEM
=
=
Assuming:
The actual fuel cell voltage = 0.7 V/per-cell
Theoretical fuel cell voltage = 1.25 V/per-cell
Hydrogen fuel utilization = 95%
(i.e. 5% of hydrogen fuel is wasted during purging)
9.0producedpowerTotal
producedpowerNet=
(i.e. 10% of the energy is used to power the balancing plant)
%48100*)9.0(*)95.0(*25.17.0efficiencyFuelcellPEM ==
Since,
1 kWh = 1000 Wh = 1000*3600 Ws = 3.6 MJ (mega-joules)
Weight of the required hydrogen =
efficiencycellFuelPEM1*
hydrogenofvalueheatingSpecificMJ6.3
Kg0625.0)48.0(*)MJ120(
MJ6.3== (18)
Since 0.09 kg of hydrogen needs 1000 liters,
Now, 0.0625 kg of hydrogen needs = 1000*0.0625/0.09 = 694.5 liters at 1 bar or 14.5
lbf/in2

101
At 150 bar, the volume of hydrogen is: 694.5/150 = 4.63 liters
Therefore, 4.63 liters of hydrogen fuel at 150 bar is required for powering a 1 kWh load.
4.8.3 Supercapacitor sizing
The energy stored in a supercapacitor is given by:
2j CV
21W = (19)
Since the energy stored in the supercapacitor is directly proportional to the square of
the voltage, a drop of 30% in its voltage (1 pu to 0.7 pu) represents the release of 50% of
the stored energy. The internal losses due to the equivalent series resistance (ESR) also
need to be accounted for. Adopting this discharge strategy, the following equation can be
written as:
( )[ ] tPkV7.0CCV21
shortage22 ⋅=⋅− (20)
where, C is the required capacitance of the supercapacitor, k is the efficiency, which is
less than 1 due to ESR loss. Pshortage is the amount of power shortage in Watts due to the
system delay or overload and t is the specified duration for those events. The proposed
UPS system should be capable of supplying the 130% of the rated power for 12 s and
140% of the rated power for 1.5 s seconds. For the proposed system, more limiting
constraint is the 130% rated power for 12 s, therefore we will size the supecapacitor
according to this. Assuming that the maximum voltage that a supercapacitor needs to
sustain is 43 V, Pshortage=130% PratedW; t=12 s and k=0.9; the required capacitance value
can be calculated by substituting these values in (20).

102
F5.40439.0
1210803.14
Vk
tP4C
22shortage =
⋅
⋅⋅⋅=
⋅
⋅⋅= (21)
One way this can be achieved is by connecting sixteen of commercially available
supercapacitors (650 F, 2.7 V) in series. Detailed specification for the supercapacitor is
presented in the Table XII. The amount of capacitance calculated to provide power during
overload conditions is sufficient to ensure that the impedance inequalities (6-9) are met as
can be seen from Fig. 50.
TABLE XII SPECIFICATION OF SUPERCAPACITOR, BCAP0650 P270 (MAXWELL TECHNOLOGIES)
Capacitance 650 Farads (±20%) Maximum ESR(25°C) 0.8 mOhms Specific Power Density 5400 (W/kg) Voltage(Cont.) 2.7 V Maximum Current 3500 A Dimensions 51.5 x 60.0 mm Weight 1200 g Volume 0.211 l Temperature (Operating & Storage) -40°C to 65°C Leakage Current (12 hours, 25°C) 1.5 mA
4.8.4 Full bridge converter design
The objective of the design example is to outline step by step calculations of switch
voltage/current ratings, DC-link capacitor values, and L-C output filter values to meet
the specifications.
Fuel cell power output Pout = 1200 W. A nominal fuel cell input voltage, Vin = 26 V,
is assumed. An output voltage, Vo = 200 V is generated using the phase shift control. The

103
switching frequency is set at 50 kHz. The fuel cell current is calculated for its lowest
voltage condition (Vin = 26 V) as
A15.4626
1200Iin == (22)
The full bridge DC-DC converter shown in Fig. 39 uses four switches, Q1 to Q4. To
obtain the output voltage of 200 V for the full bridge converter, a turns ratio of n = 16 is
selected for the transformer. The duty ratio is defined as the time when the energy is
transferred from the primary to the secondary circuit, or when the pairs Q1, Q4 or Q2, Q3
are conducting. For the full loading condition duty cycle is 0.48 which causes the switch
rms current to be:
814.0Dd1d2D
andA6.3624
)d2(DnII
A6.37)d1(31
8)D21(
24)d2(D
nII
t
2t
orms4,3Q
2torms2,1Q
=++
=
=+
=
=⎥⎦⎤
⎢⎣⎡ ++
−+
+=
−
−
(23)
where d is defined as secondary current undershoot ratio [45] and is assumed to have
value of 0.3.
For the secondary diodes, the average current in each diode is equal to the half of the
output current and the maximum and the minimum values are given by:
A81.0
2dII
A21.62
dIII
omin2,1Ds
oomax2,1Ds
=−=
=+=
−
− (24)
The reverse blocking voltage is equal to the transformer secondary voltage,

104
V416nVV inreverse == (25)
Voltage and current ratings of the transformer are:
Primary voltage, V5.25D2VV inp ==
Secondary voltage V408D2nVV ins ==
Primary current, A68.54I p =
Secondary current A42.3I s =
The VA rating of the transformer is defined as the sum of the total primary and
secondary winding VA divided by two,
( ) kVA395.1ID2nVID2V21VA sinpintr =+= (26)
4.8.5 Inverter output filter design considerations
Fig. 52 below shows the topology for the inverter output filter. A transfer function is
derived using the schematic in Fig. 52. The assumptions used in the analysis are: the
output filter is lossless and the third current harmonic current is 80% of the fundamental
current rms value.
Fig. 52. Topology of a DC-AC output filter

105
The transfer function for this type of L-C filter is described by the equation:
)XXn(jZXnX
ZjXVV
HCL
2n,LCL
n,LC
n,i
n,on
−+
⋅−== , (27)
where:
nH - transfer function
n,oV - output voltage harmonic
n,iV - input voltage harmonic
CX - capacitive impedance component
LX - inductive impedance component
n,LZ - load impedance
n - harmonic
For first harmonic 1H1 → ; or CL XX << , then
1XjZ
ZjXH
C1,L
1,LC1 ≅
⋅−
⋅−≤ (28)
Also, for a no load condition, ∞→1,LZ , therefore equation (27) is:
1
XXn
1XXn
XH
C
L2CL2
Cn
−⋅=
−−= (29)
To satisfy a THD requirement of less than 5%
2C
L
C
L2 n
222.23XX
045.01
XX
n
1≥=≤
−⋅
(30)

106
An equivalent circuit model used in finding the filter characteristics for a non-linear load
is shown in Fig. 53.
Fig. 53. Equivalent circuit for a non-linear load
The transfer function for this schematic is described by equation
nL
2C
CLn I
XnXXjnXV ⋅
−
⋅= , (31)
where:
nV - equivalent output voltage at nth harmonic
n - harmonic
nI - load current at nth harmonic
CX - capacitive impedance component
LX - inductive impedance component
Equation (31) can then be shown as:
n
C
L2L
n I
XX
n1
nXV ⋅
−= . (32)
Here C
LXX is very small making 1
XX
nC
L2 <<

107
nLn InXV ⋅≤ (33)
For the third harmonic 3n = ∴
1
3L
1
3V
IX3VV ⋅
= , where THD is 03.0VV
1
3 = or %3 . Inductor impedance can be found
by:
3
1L I*3
V03.0X ⋅= (34)
Let sf be defined as the switching frequency and 1f be defined as the fundamental
frequency. Then for kHz20fs = , Hz60f1 = , and 33.333ff
n1
s == , 4
C
L 10x09.2XX −≥
the filter resonant frequency rf can be found with
Hz3.4150f
17.69222.23
nXX
ff
r
2
L
C
1
r
≈
≤≤= (35)
The 1kW inverter with V120V1 = , produces A33.8I1 = , A67.6I8.0I 13 =⋅= . Using
(34) XL is found to be 18.0X L = . Then, using
1
Lf2
XL
π= , (36)
where
L - inductance
1f - fundamental frequency
LX - inductive impedance component

108
where Hz60f1 = , the inductance will be H46.477L µ= .
To find the capacitor impedance we use (30), and get 24.861X C = , then using
C1 Xf2
1C⋅
=π
(37)
where
C - capacitance
CX - capacitive impedance component
1f - fundamental frequency
and Hz60f1 = , capacitance turns out to be F08.3C µ= .
4.9 Conclusion
In this chapter, a fuel cell powered, passive stand-by single-phase UPS system has
been discussed in detail. It has been shown that the proposed topology provides stable
power to the load when the utility is interrupted. A mathematical approach to analyze the
interactions between the internal impedance of the fuel cell and the DC/DC converter
closed loop control to verify steady state and transient stability has been presented. It has
been shown that the fuel cell’s dominant time constant is load dependent and varies from
8.97ms (light load) to 20.37ms (full load) resulting in fuel cell’s relatively slow dynamic
response. Design inequalities have been reviewed to better understand the interaction
between the DC/DC converter and fuel cell during potential instability conditions. A
method to size the supercapacitor module was incorporated to overcome the load
transients such as instantaneous power fluctuations, slow dynamics of the fuel

109
preprocessor and overload conditions. It has been shown that the supercapacitor values
calculated for overload conditions were sufficient to enhance stability and improve
dynamic response of the fuel cell. A complete design example illustrating the amount of
hydrogen storage required for 1 hour power outage and sizing of supercapacitors for
transient load demand has been presented for a 1.5kVA UPS. In conclusion, an
environmentally friendly and clean power back-up system has been proposed.

110
CHAPTER V
HIGH MEGAWATT CONVERTER TOPOLOGIES FOR FUEL
CELL BASED POWER PLANTS
5.1 Introduction
Fuel cells have been recognized as one of the most promising energy sources for
power generation in the near future. In particular, high temperature fuel cells such as
solid oxide fuel cell (SOFC) and molten carbonate fuel cell (MCFC) have sufficient
potential in terms of overall system efficiency and operation costs to compete with
conventional power plants in the mega watt (MW) power range [9]. Typical efficiency
of conventional power plants ranges from 38% to 40%, whereas the efficiency of a
SOFC is in the range of 55-60%; consequently, fuel cell based plants have efficiency
around 20% higher that conventional systems. On the other hand the cost of generating
power in a fuel cell based plant is slightly higher than in conventional systems (0.12
$/kWh) [9].
The fuel cell stack is interfaced with the AC grid, usually at the medium voltage
distribution level, via a converter transformer unit [10]. Since each individual cell
produces only 0.6 V, there is a maximum number of cells that one can stack before
thermal/water management issues arise. Additionally, electrostatic potential to ground
within the fuel cell stack needs to be limited for safe operation. Considering the above
limitations the maximum voltage that a fuel cell stack can safely produce is around 350

111
V [11]. To achieve a higher DC link voltage, two stacks can be connected in series and
their mid points tied to ground.
The power converter is usually constructed using a two stage approach (Fig. 54)
having a DC-DC converter connected in series with a DC-AC inverter. Fig. 54 and Fig.
55 show the conventional approach in which each fuel cell stack is connected to a
dedicated power electronic converter (DC-DC and DC-AC) interfaced to electric utility.
Section 5.3 shows several other possible power electronics topology configurations. The
aim of this Chapter is to study the various possible ways in which fuel cell stack and
power electronics can be interfaced with utility and ways of converting the available DC
power to AC power. The various topologies are then compared for performance,
component count, cost, usage of magnetics, etc.
The switching mode nature of the power converters generates common mode voltage
with respect to ground. The presence of high frequency common mode voltage
contributes to circulating ground currents which can interfere with ground fault
protection system and also contribute to neutral shift and electro magnetic interference
(EMI). Another aim of this chapter is to present an analysis of common mode voltage in
the converter topologies and discuss several mitigation methods.
5.2 Conventional approach
Fuel cell mega watt power systems can be configured to directly connect to the
utility to supply power as shown in Fig.54. Similar to the low-power case, fuel cell
stacks in this power range have relatively low voltage (less than 1 kV DC) and high

112
current output characteristics (around 1000 A). On the other hand, the desired output
voltage is much higher (2.3, 3.3, 4.16, 6.9 or 18 kV AC) which generates the huge gap
between these two values and makes the design of power electronics inverters, which
should have high input current and high output voltage handling capabilities, a
challenge.
Fig. 54. Conventional multi stack fuel cell system with line-frequency transformer
Fig. 54 shows the conventional multi stack fuel cell system with line-frequency
transformer and low-voltage (LV) inverters for supplying power to the utility. Each fuel
cell stack rated for 350 V, 0.35 MW is followed by a non-isolated DC-DC converter that
increases and regulates the voltage to the DC-AC inverter to 800 V level (minimum DC-
link voltage to generate 480 V AC output from a three phase inverter). Inverters with
constant DC inputs are easier to control and are not limited by the minimum voltage of
the fuel cell. Inverter uses commercially available, low cost 1200 V IGBTs as switching

113
devices which are very efficient in this voltage range and could switch at high
frequencies (tens of kHz).
Fig. 55 shows a conventional multi stack fuel cell system with the isolated DC-DC
converter which is a variation of the previous topology. The weight and size
disadvantage of the line-frequency transformer (50/60 Hz) is surpassed by using the high
frequency transformer.
Fig. 55. Conventional multi stack fuel cell system without line-frequency transformer
Inductors and capacitors are required for these inverters to stabilize the DC bus and
sink the current if diode rectifiers are used at the front [50]. Inductors and capacitors on
the DC bus not only increase the cost but, due to their relatively short life span, reduce
the system’s reliability.

114
Single-stage power conversion topology shown in Fig. 56 connects the DC-AC
inverter directly to the fuel cell without the use of DC-DC converter in front resulting in
a complex control scheme. The disadvantages of this control strategy are that the AC
output voltage is limited by the minimum voltage of the fuel cell and the inverter must
be rated for a higher power than it is intended to be used for. The advantages include the
relatively low production cost because of lower component count. For all three
conventional topologies an output filter creates a smooth sinusoidal voltage before the
output is connected to the utility. A disadvantage of the single-stage strategy is that it
requires much larger and more expensive filters than the two-stage strategies (Fig. 54
and Fig. 55). The DC-DC stage of the two-stage implementation helps to reduce the
ripple seen by the fuel cell, so less filtering is required.
Fig. 56. Single-stage power conversion topology

115
All of the above presented conventional topologies are modular systems where the
failure in power electronics and/or a fuel cell in only one unit does not affect the
performance of the entire system. Fuel cells can share a common fuel supply and heat
exchangers, which reduces the overall cost. In addition, ability to bias current of
individual stack pairs provides compensation mechanism for air and fuel flow
asymmetries.
5.3 Novel high mega watt topologies
In recent years, industry has begun to demand higher power equipment, which now
reach the mega watt levels. Fuel cell based power plants in the mega watt range could be
connected to the medium voltage network. Today, it is hard to connect a single power
semiconductor switch directly to medium voltage grids (2.3, 3.3, 4.16, or 6.9 kV). For
those reasons, a new family of multilevel inverters has emerged as the solution for
working with higher voltage levels [51–54].
5.3.1 Topology #1
Fig. 57 shows a medium voltage topology #1 where two fuel cell stack systems
followed by an isolated DC-DC converter and DC-AC inverter are connected to 2.3 KV
utility. Output of DC-DC converter is set to 3500 V as shown in Fig. 57.

116
Fig. 57. Medium voltage topology #1
A three-phase neutral-point clamped (NPC) inverter with either IGBT or IGCT
devices could be used depending on the level of the inverter (3-level NPC inverter with
IGCTs or 7-level NPC with IGBTs to match different semiconductors voltage ratings).
Low switching frequency (2 kHz) requires larger filters when IGCTs are used. One of
the advantages of using a medium voltage inverter is that the semiconductor switches in
the inverter require a lower current, therefore resulting in higher efficiencies.
5.3.2 Topology #2
The medium voltage topology #2 shown in Fig. 58 employs four fuel cell stacks with
two cascaded isolated DC-DC converters and one DC-AC inverter and is connected to
4.16 kV utility. This topology offers flexibility in control of fuel cell stack pairs.
Independent control of DC-DC converters is possible to allow each pair of fuel cell
stacks to supply different output power if needed. Higher voltage and current rating
IGCT/IGBT devices are used in this DC-AC inverter, which decreases the number of
devices used in the system.

117
Fig. 58. Medium voltage topology #2
5.3.3 Topology #3
The medium voltage topology #3 shown in Fig. 59 is a variation of the previous
topology with an 11-level NPC inverter designed with low-voltage IGBTs instead of
previous high-voltage (HV) devices. An 11-level PWM output voltage is high quality
and suitable for 4.16 kV, 60 Hz utility interface eliminating the need for output filters.
Fig. 59. Medium voltage topology #3

118
5.3.4 Topology #4
A cascaded multilevel inverter topology is shown in Fig. 60. It is based on the series
connection of single-phase inverters with separate fuel cell stack systems. Fig. 60 shows
the power circuit of a 7-level inverter with three cells (Nc=3) in each phase. The
resulting phase voltage is synthesized by the addition of the voltages generated by
different cells. Each single-phase full-bridge inverter generates three voltages at the
output: +Vdc, 0, and –Vdc. The resulting output AC voltage swings from -3Vdc to 3Vdc
with seven levels, and the staircase waveform is nearly sinusoidal, even without filtering
[54].
Fig. 60. Cascaded multilevel inverter topology
A classical SPWM with phase shifted (120o) triangular carriers using either the same
control voltage or selective harmonic elimination control produces a voltage with the
smallest distortion. Another control option could be the injection of a third harmonic in

119
each cell, which is a very common practice in industrial applications to increase the
output voltage for the multilevel inverters [55], [56]. An additional advantageous feature
of multilevel SPWM is that the effective switching frequency of the output voltage is Nc
times the switching frequency of each cell, as determined by its carrier signal. This
property allows a reduction in the switching frequency of each cell, thus reducing the
switching losses.
5.3.5 Topology #5
A hybrid multilevel inverter topology combines neutral-point clamped IGCT 3-phase
inverter with 2 kV DC-bus and neutral-point clamped IGBT 3-phase inverter with 1 kV
DC-bus to obtain higher output voltage, as shown in Fig. 61.
Fig. 61. Hybrid multilevel inverter topology

120
This topology uses an output transformer to add the output voltages of each inverter.
In order for the inverter output voltages to be added up, the inverter outputs must be
synchronized with a separation of 120o between each phase as shown in Fig. 61. It is
well known that the switching capability of IGCT devices is limited at higher
frequencies [57]. Hence, a hybrid modulation strategy which incorporates stepped
synthesis in conjunction with variable pulse width of consecutive steps has been
presented in [58]. Under this modulation strategy, the IGCT inverter is modulated to
switch only at fundamental frequency of the inverter output, while the IGBT inverter is
used to switch at a higher frequency [59]. With this hybrid topology and modulation
strategy, the high quality PWM output voltage depends on the IGBT switching, while
the overall voltage generation is decided by the voltage ratings of the IGCTs.
5.4 Comparison
Conventional multi stack fuel cell systems with/without the line-frequency
transformer and single-stage power conversion topology have very high cost because of
bulky line-frequency transformers (boost voltage from 480 V level to medium voltage
level of 2.3 or 4.16 kV) and reactive components. Further, scaling these topologies to
higher power and higher voltage applications would result in high part count which in
turn decreases cost effectiveness.
On the other side the most attractive features of multilevel inverters are as follows:
• They can generate output voltages with extremely low distortion and lower
dV/dt.

121
• They draw input current with very low distortion.
• They generate smaller common-mode (CM) voltage and implementation of
sophisticated modulation methods can entirely eliminate common-mode voltages
[60].
• They can operate at a lower switching frequency, reducing the switching losses
and EMI.
Table XIII outlines the summary of key parameters for five mega watt topologies
introduced in the previous sub-chapters.
TABLE XIII MEGA WATT TOPOLOGIES SUMMARY
Topology # 1 2 fuel cell stacks (350 V) series connected and center point grounded, 1 DC-DC converter followed by a 3-level NPC (IGCT) (or 7-level NPC IGBT) inverter to produce 2300 V 3- phase AC
Topology # 2
4 fuel cell stacks (350 V) series connected in pairs and center point grounded, 2 DC-DC converters with outputs connected in series, followed by a 3-level inverter to produce 4160 V 3-phase AC, control flexibility, HV devices
Topology # 3
4 fuel cell stacks (350 V) series connected in pairs and center point grounded, 2 DC-DC converters with outputs connected in series, followed by a 11-level NPC inverter to produce 4160 V 3-phase AC, control flexibility, LV IGBT, no need for output filter
Topology # 4
Each fuel cell stack (350 V) (18 total) connected to isolated DC-DC converters (9 total), followed by a 1-phase LV inverter (9 total). Several such modules are connected in cascade to form one MV AC system, LV power electronics, no need for output filter
Topology # 5
Fuel cell stacks (4 total) followed by DC-DC converter (2 total) and 3- phase inverters (2 total). Several of these modules are combined together via 3-phase transformers to realize a multilevel inverter system for medium voltage. HV and LV devices are combined, no need for output filter

122
Table XIV compares the topologies with respect to the component count in the DC-
DC and DC-AC stages and their ratings, the use of magnetics (filters and transformers),
the complexity of the implemented modulation, the switching frequency and roughly
estimated cost. In general, the need for output filter and transformer increases the cost of
the system because of the large size and price of such devices. Some topologies do not
require use of output filters; as a result, the complexity of the modulation schemes in
these topologies is higher in order to maintain the quality of the output signal.
TABLE XIV MEGA WATT POWER TOPOLOGY COMPARISON
Topology DC-DC
component count (rating)
DC-AC component
count (rating)
Output filter Transformer Modulation
complexity Switching frequency
Roughly estimated
cost
# 1a
400 MOSFETS (700 V, 20 A)
192 diodes (8 kV, 4.2 A)
12 IGCT (2.1 kV, 500 A)
6 diodes (2.2 kV, 305 A)
BIG NO SIMPLE 2 kHz $ 725700
# 1b
400 MOSFETS (700 V,20 A) 192 diodes
(8 kV, 4.2 A)
252 IGBT (900 V, 75 A)
270 diodes (700 V, 35 A)
SMALL NO MEDIUM 20 kHz $ 554400
# 2
400 MOSFETS (700 V,20 A)
56 diodes (4.8 kV, 10.2 A)
6 IGCT (6.5 kV, 500 A)
0 diodes MEDIUM NO SIMPLE 20 kHz $ 607300
# 3
400 MOSFETS (700 V,20 A)
56 diodes (4.8 kV, 10.2 A)
420 IGBT (900 V, 75 A)
216 diodes (700 V, 35 A)
NO NO MEDIUM 20 kHz $ 505800
# 4
360 MOSFETS (700 V, 20 A)
108 diodes (1.2 kV, 35 A)
72 IGBT (1.2 kV, 110 A)
0 diodes NO NO MEDIUM 12.6 kHz $ 363700
# 5
380 MOSFETS (700 V, 20 A)
8 diodes (2 kV, 200 A)
12 diodes (1 kV, 110 A)
36 IGBT (600 V, 400 A)
12 IGCT (1.2 kV, 500 A)
18 diodes (500 V, 300 A)
6 diodes (1 kV, 430 A)
NO YES HIGH 2.88 kHz $ 915100

123
When it comes to the switching devices, the higher the component count, the higher the
cost. This is particularly true for high voltage rated IGCTs and IGBTs as their unit price
is in the order of several thousand dollars, whereas the price of low-voltage rated IGBTs
is around 10 dollars.
5.5 Common mode analysis
The connection of distributed power sources with the utility grid generally requires
an electronic power converter for processing the locally generated power and injecting
current into the system. If the source provides a DC voltage, the converter must be able
to produce a low-distortion high-power factor AC current. Pulse width-modulated
(PWM) converters can be used to produce any voltage or current waveform. This
modulation technique has been used in both DC-DC and DC-AC converters. These
converters present some drawbacks, especially related to the electromagnetic
interference generation, due to the high-frequency commutation [61]. A low-pass filter is
necessary to attenuate the high-frequency components due to the switching process [62].
These high-frequency commutations have the effect of inducing large current spikes
(due to the dV/dt) thought stray capacitance as shown in Fig. 62.

124
Fig. 62. Effect of common mode dV/dt in stray capacitances
The time it takes the voltage to change from one voltage level to an other is
essentially controlled by the semiconductor switching time (rise and fall time). The
transition time of a semiconductor is inherent to the technology used for the particular
device. For example the transition times for insulated gate bipolar transistors (IGBTs) is
in the range from 0.05 to 0.2 µs, and for metal oxide field effect transistors (MOSFETs)
it ranges from 50 – 80 ns. As a result the dV/dt produced by the operation of MOSFETs
can be 2.5 to 4 times larger than in the case of IGBTs. The time it takes to transition
from one voltage level to another (rise time, tr, and fall time, tf) determines the
equivalent noise coupling frequency which can be calculated as follows [63]:
rise
n t38.0f = (38)
Thus MOSFETs generate noise in the frequency range from 4.75 MHz to 7.6 MHz.
On the other hand IGBTs have a noise coupling frequency in the range from 1.6 MHz to

125
6.4 MHz. The coupling frequency of MOSFET devices can be up to 5 times higher than
that of IGBTs. Typically a combination of MOSFET and IGBT devices is used for fuel
cell applications. The reason for this is that the power conditioning units are normally
constructed in a two stage approach composed of a step-up DC-DC converter and a
cascaded inverter which are implemented using MOSFETs and IGBTs, respectively.
Consequently, both types of noise coupling frequencies exist in these systems.
The effect of the common mode noise induced by stray common mode currents on
other equipment is a function of the distance separating the noise generation and
reception. Since power converters are enclosed in metal cabinets most of the electro
magnetic interference is due to the conducted noise current circulating through ground.
Therefore it is important to keep the circulation paths of common mode currents as short
as possible.
5.5.1 Topology #1
The analysis of the generation of common-mode voltage and current in power
conditioning systems is simplified if an equivalent circuit is used. From the common-
mode voltage point of view each of the legs in the three phase inverter can be modeled
as a switching mode voltage source from the midpoint of the DC link (denoted by “n”)
to one of the output lines of the inverter. The common mode equivalent circuit for
medium voltage topology #1 is given by the schematic shown in Fig. 63 regardless of
the inverter type (low voltage device inverter or medium voltage neutral-point clamped
inverter).

126
Fig. 63. Common mode equivalent circuit for medium voltage topology #1 a) detailed equivalent b)
simplified equivalent The transformer in the DC-DC converter is modeled by lumped capacitances from
primary and secondary to ground, and capacitor from secondary to primary models the
parasitic capacitance between two sides of the transformer. From Fig. 63 the voltage
from the point “n” to ground can be calculated by:
3
)VVV(VVV3
VVVVVVV cgbgagcnbnancgcnbgbnagan
gn++−++
=−+−+−
= (39)
Assuming that the utility voltage is balanced we have that Vag + Vbg + Vcg = 0, thus
3
VVVV cnbnan
gn++
= (40)
In the same way the common mode voltage generated by the DC-DC converter and its
rectifier can be calculated by
2
VVV pypx
pg+
= (41)

127
2
VVV sfsd
sn+
= (42)
Using the equivalent common mode source Vng, Vpg, and Vsn the equivalent circuit in
Fig. 63a can be simplified as shown in Fig. 63b. The common mode current, Icm, then
can be calculated using (43) as follows
dt
dVC
dt)VV(d
Cdt
dVC
dt)VVV(d
CI pgpg
snnpps
pgpg
pgsnngps1#CM +
+=+
−+= .(43)
The theoretical analysis is verified using computer simulations in PSim software
package. The circuit schematic used for simulating a three-phase 3-level NPC inverter
with IGCT devices is shown in Fig. 64. Low switching frequency (2 kHz) requires larger
filter when IGCT devices are used. The input voltage of the system is 700 V and its
output is 2.3 kV (line-to-line rms), 60 Hz.
Fig. 64 Circuit schematic of medium voltage topology #1 with IGCT devices

128
The values used for the parasitic capacitance for the transformer are Cpg=200 pf,
Csg=200 pF, and Cps=50 pF. Fig. 65 shows the resulting common mode current Icm,
voltage Van, voltage Vng and the common mode voltage of the system. From this figure it
can be observed that the common mode current is as high as 15.42 A with rms value of
1.81 A.
Also circuit schematic shown in Fig. 66 is used for simulating another variation of
the medium voltage topology #1 - the three-phase 7-level NPC inverter with IGBT
devices, as a low voltage device case. In this case a higher switching frequency (20 kHz)
is used resulting in smaller output filter. The input voltage of the system is the same as
before (700 V) and its output is set to 2.3 kV (line-to-line rms), 60 Hz.
Fig. 65 Simulation result of medium voltage topology #1 with IGCT devices
Values for parasitic capacitance for the transformer stayed the same as before. Fig.
67 shows the resulting common mode current Icm, voltage Van, voltage Vng and the

129
common mode voltage of the system. As can be seen from Fig. 66 the common mode
current is considerably larger in this case. The peak common mode current for this case
reaches 52.27 A; with rms value of 1.043 A. This is about three times higher than the
previous case because this topology has considerably higher switching frequency. The
magnitude of these transitions is a function of the parasitic capacitances, the magnitude
of the DC-link voltage and the raise and fall time of the semiconductors as was shown in
equations (38) and (43).
Fig. 66 Circuit schematic of medium voltage topology #1 with IGBT devices

130
Fig. 67 Simulation result of medium voltage topology #1 with IGBT devices
5.5.2 Topologies #2 and #3
The common mode equivalent circuit for medium voltage topology #2 and topology
#3 can be obtained in the same fashion as was done for the previous topology. The
resulting equivalent circuit is shown in Fig. 68. From this common mode equivalent
circuit one can obtain that the voltage that appears from point “n” to ground is given by
(40) and the voltage at mid points of the secondary windings is then calculated using
(44) and (45).
2
VVV f1sd1s
n1s+
= (44)
2
VVV d2sf1s
n2s+
= (45)

131
Fig. 68. Common mode equivalent circuit for topology #2
Using these equations the common mode current can be then calculated as follows.
dtdV
Cdt
)VV(dC
dtdV
Cdt
)VV(dCI g2p
2pgn2s2np
2psg1p
1pgn1s1np
1ps2#CM ++
+++
= (46)
Equation (46) clearly shows that the magnitude of the common mode current circulating
through ground is generated by the operation of both DC-DC converters and the DC-AC
inverter.
Fig. 69 Circuit schematic of medium voltage topology #2

132
Fig. 70 Simulation result of medium voltage topology #2
A simulation of the medium voltage topology #2 shown in Fig. 69 is run in order to
verify the result obtained in equation (46), and the resulting common mode current is
shown in Fig. 70. The input voltage of the system is 700 V for each DC-DC converter
and system’s output is 4.16 kV (line-to-line rms), 60 Hz. Values for parasitic
capacitances for the transformer stayed the same as in the previous case. As can be seen
from Fig. 70 the common mode current peak is 30.65 A and the rms current is 2.69 A.
This is larger than in the case of topology #1 with IGCTs, but smaller than the same
topology with IGBT devices. One reason is the higher DC link voltage necessary to
generate 4.16 kV instead of 2.3 kV at the output, which also influences the dV/dt also to
be higher. Another reason is that this configuration has two DC-DC converters with two
transformers which create second common mode voltage source, as was shown in
equation (46) which further increases the magnitude of the common mode current.

133
5.5.3 Topology #4
Fig. 71 shows the equivalent circuit of the cascaded multilevel inverter shown in Fig.
60 suitable for common mode voltage analysis. The points “n11”, “n12” and “n13”
represent the DC-link mid points of three single-phase inverter cells in phase A. Further,
the transformer in the DC-DC converter is modeled by lumped capacitances from
primary and secondary to ground, and capacitance from secondary to primary, assuming
that they are equal for each DC-DC converter. The voltages Va1a1’ to Va3a3’ represent the
PWM output voltages of single-phase inverter cells 1 to 3 in phase A respectively. From
the equivalent circuit shown in Fig. 64 it can be seen that
3c'3c2c'2c1c'1cCN
3b'3b2b'2b1b'1bBN
3a'3a2a'2a1a'1aAN
VVVVVVVVVVVV
++=++=++=
(47)
The common mode voltage generated by the cascaded inverter modules is given by
3
VVVV CNBNAN
CM++
= (48)
The instantaneous summation of PWM voltages VAN + VBN + VCN may not be zero and
is dependent on the PWM strategy employed. Since each single inverter cell has 0 and
±Vd switching states, the worst case value for VAN, VBN, VCN and common mode voltage
VCM is ±3Vd.

134
Fig. 71. Common mode equivalent circuit for topology #4
Fig. 72 shows the simulated circuit of cascaded multilevel inverter. The simulation
parameters were: inverter DC-link voltage set to 1200 V; switching frequency 12.6 kHz;
output voltage 4.16 kV (line-to-line rms); PWM strategy = SPWM - unipolar with 120o
phase shift between inverter stages; with the transformer’s parasitic capacitances as in
previous case. Fig. 73b shows the resulting common mode current Icm, voltage Va1n,
voltage Vng1 and the common mode voltage of the system. As can be seen from figure
the common mode current is considerably larger in this case. The peak common mode
current for this case reaches 136.3 A; with rms value of 10.95 A. This topology has
many common mode sources (9 DC-DC converters) which results in higher common
mode current.
The common mode voltage in this topology is distributed between the line
transformer capacitance to ground and the respective DC-DC converter’s transformer
secondary winding capacitances to ground. The common mode voltage of each

135
transformer secondary winding is also widely different. From the equivalent circuit in
Fig. 71, it is easy to infer that the common mode voltage is maximum for the transformer
secondary winding supplying power to the inverter cell which is closest to the load. That
is, voltage Vn13g > Vn11g voltage (Fig. 71). The exact nature of the transformer secondary
windings with respect to ground can be determined via simulations and is shown in Fig.
73a.
Fig. 72. Circuit schematic of medium voltage topology #4

136
a)
b)
Fig. 73. Simulation result of medium voltage topology #4
5.5.4 Topology #5
Fig. 74 shows the common mode equivalent circuit of the hybrid multilevel inverter
shown in Fig. 61 obtained in same fashion as previous topologies. This topology uses an
output transformer to add the output voltages of each inverter. Both DC-DC converters

137
and DC-AC inverters are modeled similar to previous topologies. If we assume that the
first inverter system generates three phase voltages with rms V1 (terminals a1, b1, c1) and
that second inverter system is generating the three phase voltages with rms V2 (terminals
a2, b2, c2), then the output voltage at the terminals a3, b3, c3 will be
6/j1123 eV3nVV π⋅⋅+= (49)
where n1 is transfer ratio of delta to Y transformer T1. Thus, the final output voltage to
the utility side (terminals A, B, C) will be
6/j23out e
31nVV π−⋅⋅⋅= (50)
where n2 is transfer ratio of Y to delta transformer T2. From (49) and (50) we can
conclude that the common mode voltage of the inverter system 1 will have bigger
influence than the common mode voltage of the inverter system 2.
Fig. 74. Common mode equivalent circuit for topology #5

138
Fig. 75 shows the simulated circuit of hybrid multilevel inverter. DC-link voltage of
inverter 1 was set to 1000 V, and inverter 2 DC-link voltage was set to 2000 V, output
voltage was 4.16 kV (line-to-line rms), 60Hz.
Fig. 75. Circuit schematic of medium voltage topology #5

139
a)
b)
Fig. 76. Simulation results of medium voltage topology #5
Fig. 76a shows the resulting output voltages of phase B for each converter before
they are added with transformer T1, Vbng and Vbng1, and voltage between point ‘n’ and
ground for both converters. Fig. 76b shows the resulting common mode current Icm, the
common mode voltage of the system 1 and common mode voltage of the system 2. The

140
peak common mode current for this case reaches 85.78 A; with rms value of 1.93 A. The
value of the common mode voltage is much smaller than in the cascaded inverter case,
but it is still very high if we compare it with results for topologies #1 and #2.
5.5.5 Reduction of common mode current
The short duration and high amplitude of the current spikes in the common mode
current contribute to the conducted EMI, which can affect the operation of low power
electronic circuitry. The amount of EMI generated is proportional to the magnitude of
the current pulses in the common mode current. For this reason it becomes necessary to
reduce the magnitude of the current pulses. From equations (43) and (46) it can be seen
that the common mode current is generated by the common mode voltage sources of the
DC-DC converter and DC-AC inverter. Also since the voltage in the DC link between
the DC-DC converter and inverter is several times higher than the voltage produced by
the fuel cell; the component of the common mode current generated by the inverter is
dominant in the overall common mode current. Further analyzing equations (43) and
(46) it becomes clear that to limit the main component of the common mode current the
capacitance Cps in the equivalent circuit has to be reduced. In the common mode
equivalent circuit this capacitance stands for the parasitic capacitance between the
primary and secondary of the high frequency transformer used in the DC-DC converter,
as can be seen in Fig. 77a.

141
Fig. 77. Conventional and shielded transformer
A practical way of reducing the value of this capacitance is by using a shield in the
transformer. The shield is then connected to ground (Fig. 77b), reducing the capacitive
coupling between primary and secondary.
To verify the effectiveness of the shielded transformer all medium voltage topologies
were simulated in PSim and the common mode current was measured. Fig. 78a shows
the common mode current obtained for the medium voltage topology #1 with IGCT
devices when a shielded transformer is used, while Fig. 78b shows the common mode
current obtained for the medium voltage topology #1 with IGBT devices when a
shielded transformer is used.
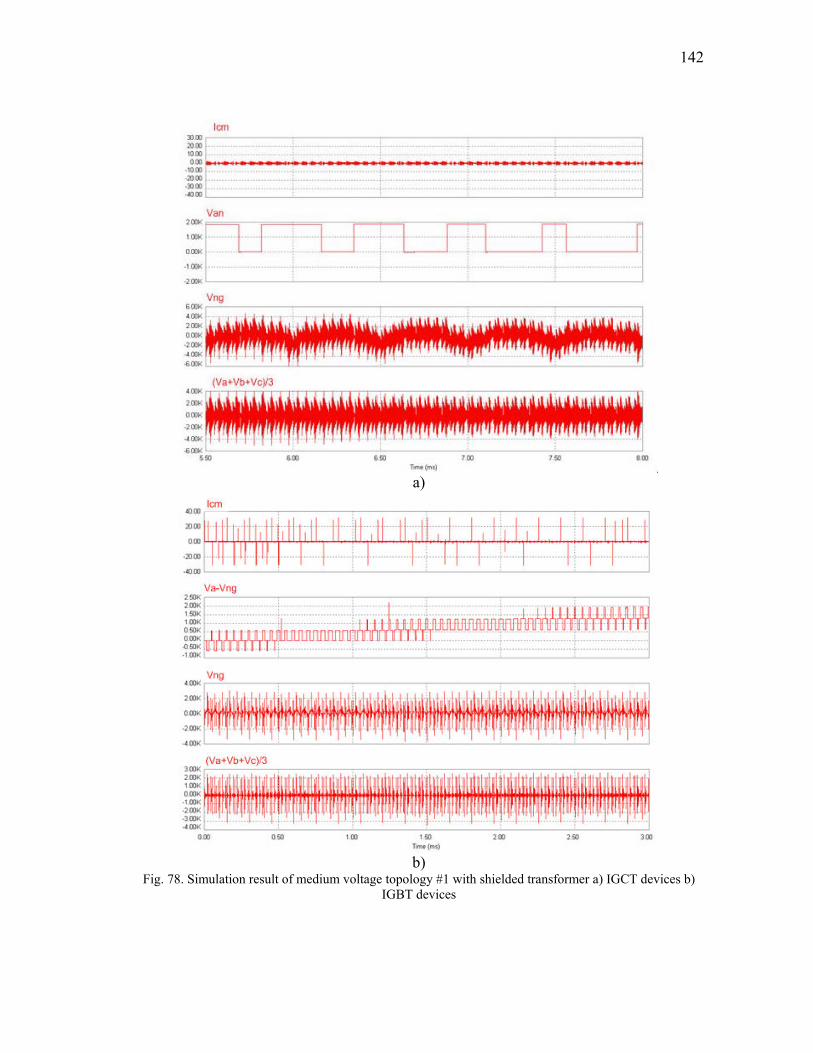
142
a)
b)
Fig. 78. Simulation result of medium voltage topology #1 with shielded transformer a) IGCT devices b) IGBT devices

143
As can be seen from Fig. 78 the common mode current is significantly reduced. In
this case the peak amplitude of the current is 2.72 A in case IGCT devices were used and
3.2 A in case IGBT devices were used. The common mode current is five orders of
magnitude smaller than the current present when a normal transformer is used to
implement the DC-DC converter in case when inverter with IGCT devices was used, and
sixteen times smaller when inverter with IGBT devices was used.
The case of the medium voltage topology #2 is studied next. The same three phase
fuel cell power converter shown in Fig. 69 is simulated. However, in this case the
parasitic capacitance from transformer primary to secondary was split into two
capacitances of 25 pF as shown in Fig. 77b to account for the shielding in the
transformer. Fig. 79 shows results obtained from the simulation. As can be observed
from the figure the peak common mode current in this case reaches 4.56 A.
Fig. 79. Simulation result of medium voltage topology #2 with shielded transformer

144
Next, simulations were repeated for cascaded multilevel inverter from Fig. 72 with
all 9 transformers shielded. The parasitic capacitance from transformer primary to
secondary was split into two capacitances of 25 pF as explained in previous case. Fig. 80
shows results obtained from the simulation. The peak common mode current in this case
reaches 116 A. This is a minor improvement, so this topology needs improvements in
PWM modulation strategy. An example approach was explained in [30].
Fig. 80. Simulation result of cascaded multilevel topology #4 with shielded transformer
Finally the case of the hybrid multilevel topology #5 was studied. Fig. 81 shows
results obtained from the simulation. As can be observed from the figure the peak
common mode current in this case reaches 69 A. This is also a minor improvement and
there is a need to change the PWM modulation strategy to fix the common mode voltage
and current problems.

145
Fig. 81. Simulation result of hybrid multilevel topology #5 with shielded transformer
From the comparison of the results shown in previous figures one can see that the
common mode current is greatly reduced by the introduction of a shield in the high
frequency transformer in the DC-DC converter. The magnitude of the reduction in the
peak value of the common mode current depends on the topology. From these results it
is possible to conclude that by using a shielded transformer the common mode current
can be minimized, which contributes to a reduction of the conducted EMI.
5.6 Conclusion
Fuel cell stacks produce DC voltage with a 2:1 variation in output voltage from no
load to full load. A power conditioner consisting of DC-DC and DC-AC converters is
required for utility interface. In this chapter power electronics converter topologies
suitable for high megawatt fuel cell based power plants were examined in detail. It was
shown that converting DC power produced by fuel cell to AC power suitable for utility

146
interface can be accomplished by a variety of converter topologies and their
interconnections. The aim of this chapter was to study the various possibilities and
compare them with respect to performance, component count, cost, usage of magnetics,
etc. It was also shown that the switching mode nature of the power converters generates
common mode voltage with respect to ground. The presence of high frequency common
mode voltage contributes to circulating ground current which can interfere with ground
fault protection system and also contribute to neutral shift and electro magnetic
interference (EMI). This chapter presented an analysis of common mode voltage in the
converter topologies and discussed several mitigation methods. Several possible fuel cell
power converter topologies were considered for utility scale generation. This Chapter
presents extensive simulations regarding common mode and converter performance for
all megawatt topologies.
147
CHAPTER VI
CONCLUSIONS
A combination of the high cost of fossil fuels and the increased awareness of their
negative environmental impact has influenced the development of new cleaner energy
sources. Among various viable technologies the fuel cells have emerged as one of the
most promising sources for both portable and stationary applications.
Fuel cell stacks produce DC voltage with a 2:1 variation in output voltage from no
load to full load conditions. Hence, to increase the utilization efficiency and system
stability, a power conditioner consisting of DC-DC and DC-AC converters is required
for load interface. The design of power conditioners is driven by the application. This
dissertation presented several different solutions for applications ranging from low-
power portable sources for small electronics and laptop computers to megawatt-power
applications for fuel cell power plants. The design and analysis for each power
conditioner was presented in detail and the performance was verified using simulations
and prototypes.
Special consideration was given to the role of supercapacitors which act as the
additional energy storage elements. Chapter II showed that the supercapacitor connected
at the terminals of a fuel cell can contribute to increased steady state stability when
powering constant power loads, improved transient stability against load transients, and
increased fuel efficiency (i.e. reduced hydrogen or other fuel consumption). Further, it
was shown that the electric equivalent circuit of a fuel cell is essential to establishing a

148
design procedure to size the required supercapacitor. The development of the equivalent
circuit model for fuel cells and supercapacitors using frequency analysis was presented
and results discussed. Additionally, the benefits obtained in steady state stability of the
power conditioner when powered by the hybrid source were analyzed and it was shown
that such configuration possesses several advantages from the energy management point
of view. For transient stability analysis, the effect of fuel cell internal impedance (extra
element) along with the impedance of the nonlinear supercapacitor on the transfer
function of the DC-DC converter was analyzed. Finally, experimental evaluation and
comparison of fuel consumption in the conventional and hybrid systems was performed,
showing that the hybrid source has improved fuel utilization.
Next chapter discussed in detail the conceptual design behind the four proposed
power distribution architectures for fuel cell powered laptop computers. For each
architecture, advantages/disadvantages were highlighted. Power consumption of two
different laptop computers was measured for different types of loads to determine
transient and steady state needs of the system.
Furthermore, a hybrid multi-input bi-directional DC-DC converter for applications in
fuel cell powered laptop computers has been proposed. The purpose of this multi-input
converter is to suitably control the energy flow from multiple energy sources to enable all
day computing. The AC-DC adapter and the fuel cell and its components were integrated
with the converter in an external unit while the conventional Li-Ion battery was placed
within the laptop casing. A design example highlighting the parameters of the fuel cell
stack, Li-Ion battery, and supercapacitor modules appropriately sized for a typical load on

149
a laptop computer was shown. Analysis, design and control aspects of the hybrid DC-DC
converter were presented to meet performance requirements for all day computing.
Simulation results verified the performance of the system under various input and output
power conditions. Experimental results showed that the bi-directional converter is
working as expected in both operating modes, bucking the voltage down to the usable
levels when the battery is supporting the DC link and boosting the fuel cell voltage to
charge the batteries and sustain the DC link when the fuel cell is maintaining the DC link
voltage. Transient behavior of the DC link during the sudden load change is excellent due
to the presence of supercapacitors. It was shown that this topology stores and delivers
energy more efficiently than the conventional systems and hence, can be used for energy
storage for other portable applications.
Chapter IV introduced a fuel cell powered, passive stand-by single-phase UPS
system. It has been shown that the proposed topology provides stable power to the load
when the utility is interrupted. A mathematical approach to analyze the interactions
between the internal impedance of the fuel cell and the DC-DC converter closed loop
control to verify steady state and transient stability has been presented. It has been
shown that the fuel cell’s dominant time constant is load dependent and varies from
8.97ms (light load) to 20.37ms (full load) resulting in fuel cell’s relatively slow dynamic
response. Design inequalities have been reviewed to better understand the interaction
between the DC-DC converter and fuel cell and, as well, potential instability conditions.
A method to size the supercapacitor module was incorporated to overcome the load
transients such as instantaneous power fluctuations, slow dynamics of the fuel

150
preprocessor and overload conditions. It was shown that the supercapacitor values
calculated for overload conditions were sufficient to enhance stability and improve
dynamic response of the fuel cell. A complete design example illustrating the amount of
hydrogen storage required for 1 hour power outage and sizing of supercapacitors for
transient load demand has been presented for a 1.5 kVA UPS.
Finally, Chapter V examined in detail power electronics converter topologies
suitable for high mega watt fuel cell based power plants. It was shown that converting
DC power produced by fuel cell to AC power suitable for utility interface can be
accomplished by a variety of converter topologies and their interconnections. The aim of
this chapter was to study the various possibilities and compare them with respect to
performance, component count, cost, usage of magnetics, etc. It was also shown that the
switching mode nature of the power converters generates common mode voltage with
respect to ground. The presence of high frequency common mode voltage contributes to
circulating ground current which can interfere with ground fault protection system and
also contribute to neutral shift and electro magnetic interference. Chapter V presented an
analysis of common mode voltage in the converter topologies and discussed several
mitigation methods. Several possible fuel cell power converter topologies were
considered for utility scale generation. Extensive simulations regarding common mode
and converter performance for all mega watt topologies were presented.

151
REFERENCES
[1] Y.R. de Novaes, R.R. Zapelini, and I. Barbi, “Design considerations of a long-term
single-phase uninterruptible power supply based on fuel cells,” in Proc. IEEE-
PESC, 2005, pp. 628-1634.
[2] M. Pagano, and L. Piegari, “Electrical networks fed by fuel-cells for
uninterruptible electrical supply,” in Proc. IEEE-ISIE, 2002, pp. 953-958.
[3] EG&G Technical Services, Inc., Fuel Cell Handbook, 6th ed., Morgantown, WV:
US Department of Energy, Office of Fossil Energy, 2002.
[4] A.F. Burke, “Batteries and ultracapacitors for electric, hybrid, and fuel cell
vehicles,” in Proc. of the IEEE, 2007, pp. 806–820.
[5] M. Amrhein, and P.T. Krein, “Dynamic simulation for analysis of hybrid electric
vehicle system and subsystem interactions, including power electronics,” IEEE
Trans. Vehicular Technology, vol. 54, pp. 825-836, May 2005.
[6] http://www.neahpower.com/powergap/overview.shtml.
[7] http://www.toshiba.co.jp/about/ press/2003_03/pr0501.htm.
[8] W. Choi, P. Enjeti, and J.W. Howze, “Fuel cell powered UPS systems: design
considerations”, in Proc. IEEE-PESC, 2003, pp. 385-390.
[9] Y. Watanabe, M. Matsumoto, and K. Takasu, “The market for utility-scale fuel cell
plants,” Journal of Power Sources, vol.61, pp. 53-59, Jul. 1996.
[10] G. Bernsten, ”Scale-up experience with mega-watt class inverter topologies,” Solid
State Energy Conversion Alliance Workshop, May 2006, pp.122-128.

152
[11] S. Stevandic, and J. Jiang, “Standalone, reduced-order model and control of a grid-
connected fuel cell power plant,” in IEEE Power Engineering Society General
Meeting, 2003, pp. 679-686.
[12] M. Uzunoglu, and M.S. Alam, ”Dynamic modeling, design, and simulation of a
combined PEM fuel cell and ultracapacitor system for stand-alone residential
applications,” IEEE Trans. Energy Conversion, vol. 21, pp. 767-775, Sep. 2006.
[13] B. Maher, “Use of ultracapacitors and fuel cells in both stationary and mobile
applications,” Fuel Cell, pp. 32-38, Dec. 2006/Jan. 2007.
[14] R. Smith, and W. Fuglevand, “Ultracapacitors and fuel cells make a perfect match
for portable applications,” Portable Design, Jan. 2004.
[15] J. Correa, F. Farret, L. Canha, and M. Simones, “An electrochemical–based fuel
cell model suitable for electrical engineering automation approach,” IEEE Trans.
Industrial Electronics, vol. 51, pp. 1103-1112, Oct. 2004.
[16] R. Amphlett, R. Mann, B. Peppley, P. Roberge, and A. Rodigues, “A practical
PEM fuel cell model for simulation vehicle power sources,“ in Proc. Battery
Conference on Applications and Advances, 1995, pp. 221–226.
[17] M. Ceraolo, C. Miulli, and A. Pozio, “Modeling static and dynamic behavior of
proton exchange membrane fuel cells on the basis of electro-chemical description,”
Journal of Power Sources, vol. 113, pp. 131-144, Jan. 2003.
[18] W. Lajnef, J.-M. Vinassa, S. Azzopardi, O. Briat, E. Woirgard, C. Zardini, and J.L.
Aucouturier, “Ultracapacitors modeling improvement using an experimental
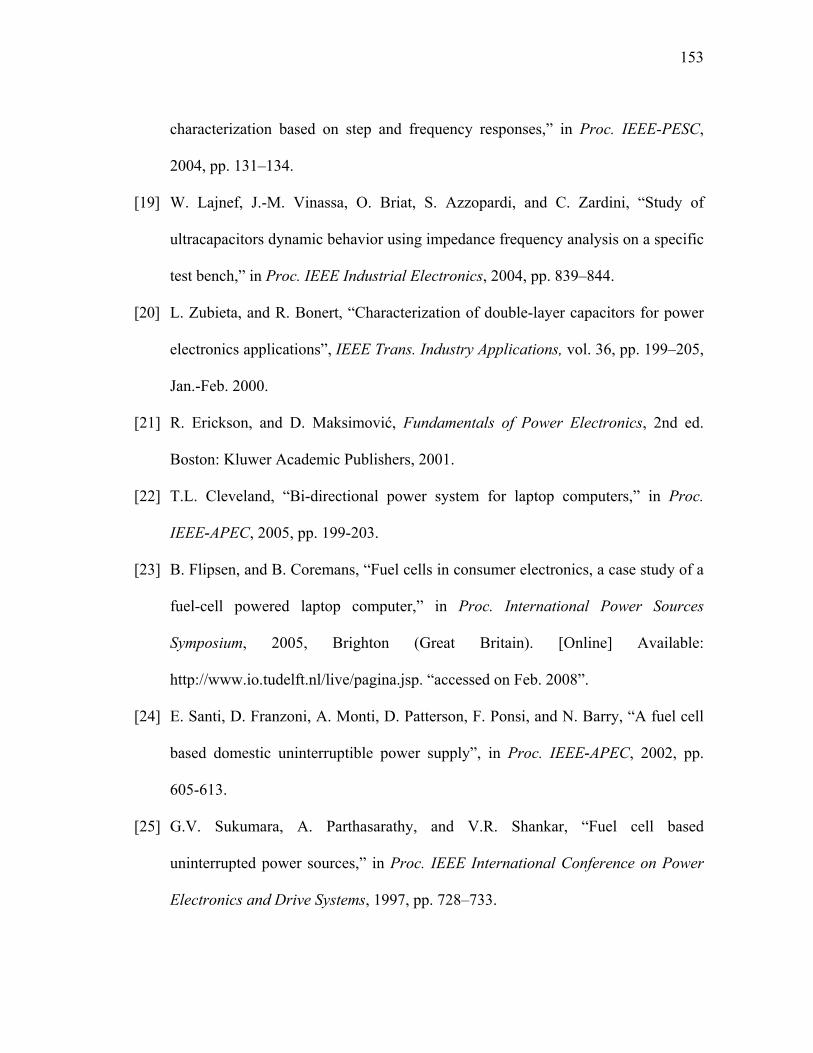
153
characterization based on step and frequency responses,” in Proc. IEEE-PESC,
2004, pp. 131–134.
[19] W. Lajnef, J.-M. Vinassa, O. Briat, S. Azzopardi, and C. Zardini, “Study of
ultracapacitors dynamic behavior using impedance frequency analysis on a specific
test bench,” in Proc. IEEE Industrial Electronics, 2004, pp. 839–844.
[20] L. Zubieta, and R. Bonert, “Characterization of double-layer capacitors for power
electronics applications”, IEEE Trans. Industry Applications, vol. 36, pp. 199–205,
Jan.-Feb. 2000.
[21] R. Erickson, and D. Maksimović, Fundamentals of Power Electronics, 2nd ed.
Boston: Kluwer Academic Publishers, 2001.
[22] T.L. Cleveland, “Bi-directional power system for laptop computers,” in Proc.
IEEE-APEC, 2005, pp. 199-203.
[23] B. Flipsen, and B. Coremans, “Fuel cells in consumer electronics, a case study of a
fuel-cell powered laptop computer,” in Proc. International Power Sources
Symposium, 2005, Brighton (Great Britain). [Online] Available:
http://www.io.tudelft.nl/live/pagina.jsp. “accessed on Feb. 2008”.
[24] E. Santi, D. Franzoni, A. Monti, D. Patterson, F. Ponsi, and N. Barry, “A fuel cell
based domestic uninterruptible power supply”, in Proc. IEEE-APEC, 2002, pp.
605-613.
[25] G.V. Sukumara, A. Parthasarathy, and V.R. Shankar, “Fuel cell based
uninterrupted power sources,” in Proc. IEEE International Conference on Power
Electronics and Drive Systems, 1997, pp. 728–733.

154
[26] N. Kato, T. Murao, K. Fujii, T. Aoiki, and S. Muroyama, “1 kW portable fuel cell
system based on PEFCs,” in Proc. IEEE-TELESCON, 2000, pp. 209–213.
[27] F.Z. Peng, J.S. Lai, J. McKeever, and J. VanCoevering, “A multilevel voltage-
source inverter with separate DC sources for static VAr generation,” IEEE Trans.
Industry Applications, vol. 32, pp. 1130-1138, Oct. 1996.
[28] B. Ozpineci, L.M. Tolbert, and Z. Du, “Multiple input converters for fuel cells,” in
Proc. IEEE-IAS, 2004, pp. 791-797.
[29] B. Ozpineci, Z. Du, L.M. Tolbert, D.J. Adams, and D. Collins, “Integrating
multiple solid oxide fuel cell modules,” in Proc. IEEE-IECON, 2003, pp. 1568-
1573.
[30] D.A. Rendusara, E. Cengelci, P.N. Enjeti, V.R. Stefanovic, and J.W. Gray,
“Analysis of common mode voltage – ‘Neutral shift’ in medium voltage PWM
adjustable speed drive (MV-ASD) systems,” IEEE Trans. Power Electronics, vol.
15, pp. 1124-1133, Nov. 2000.
[31] L. Palma, and P. Enjeti, “An inverter output filter to mitigate dV/dt effects in PWM
drive system,” in Proc. IEEE-APEC, 2002, pp 550–556.
[32] S. Ogasawara, and H. Akagi, “Modeling and damping of high-frequency leakage
currents in PWM inverter-fed AC motor drive systems,” IEEE Trans. Industry
Applications, vol. 32, pp. 1105–1114, Sep. 1996.
[33] P.C. Loh, D.G. Holmes, Y. Fukuta, and T.A. Lipo, “A reduced common mode
hysteresis current regulation strategy for multilevel inverters,” IEEE Trans. Power
Electronics, vol. 19, pp. 192–200, Jan. 2004.

155
[34] P.C Loh, D.M. Vilathgamuwa, F. Gao, C.J. Gajanayake, L.W. Gay, and P.F.
Leong, “Random pulse-width modulated neutral-point-clamped inverter with
reduced common-mode switching,” in Proc. IEEE-PEDS, 2005, pp. 1435–1440.
[35] H. Zhang, A. Von Jouanne, S. Dai, A.K. Wallace, and F. Wang, “Multilevel
inverter modulation schemes to eliminate common-mode voltages,” IEEE Trans.
Industry Applications, vol. 36, pp. 1645–1653, Nov. 2000.
[36] U. Dewald, “Micro-reformers turn methanol into hydrogen,” Initiative
Brennstoffzelle 12.03.2004 - micro devices. [Online] Available:
http://www.initiative-brennstoffzelle.de/ibz/live/nachrichten/show.php3 “accessed
on Feb. 2008”.
[37] M. Harfman-Todorovic, L. Palma, and P. Enjeti, ”Design of a wide input range
DC-DC converter with a robust power control scheme suitable for fuel cell power
conversion,“ in Proc. IEEE-APEC, 2004, pp.374-379.
[38] H.P. Dhar, “Medium-term stability testing of proton exchange membrane fuel cell
stacks as independent power units,” Journal of Power Sources, vol. 143, pp 185-
190, Apr. 2005.
[39] S.B. Beikarov, and A. Emadi, “Uninterruptible power supplies: classification,
operation, dynamics and control,” in Proc. IEEE-APEC, 2002, pp. 597–604.
[40] S. Karve, “Three of a kind [UPS topologies, IEC standard],” IEE Review, vol. 46,
pp. 27-31, Mar. 2000.

156
[41] M.S. Rauls, D.W. Novotny, and D.M. Divan, “Design considerations for high
frequency coaxial winding power transformers,” IEEE Trans. Industrial
Electronics, vol. 29, pp. 375-381, Mar.-Apr. 1993.
[42] C. Pereira, S. Ahmed, S.H.D. Lee, and M. Krumpelt. Integrated fuel processor
development. Presented at 2002 Future Car Congress. [Online] Available:
http://www.ipd.anl.gov/anlpubs/2001/12/41460.pdf
[43] O.D. Patterson, and D.M. Divan, “Pseudo-resonant full-bridge DC/DC converter,”
IEEE Trans. Power Electronics, vol. 6, pp. 671-678, Oct. 1991.
[44] G. Hua, F.C. Lee, and M.M. Jovanovic, “An improved full-bridge zero-voltage-
switched PWM converter using a saturable inductor,” IEEE Trans. Power
Electronics, vol. 8, pp. 530-534, Oct. 1993.
[45] N.H. Kutkut, D.M. Divan, and R.W. Gascoigne, “An improved full-bridge zero-
voltage switching PWM converter using a two-inductor rectifier,” IEEE Trans.
Industry Applications, vol. 31, pp. 119-126, Jan.-Feb. 1993.
[46] Ballard Power Systems Inc, NexaTM Power Module User’s Manual MAN5100078,
Burnaby, BC, Canada: Ballard Power Systems Inc, Oct. 2005.
[47] M.W. Chase Jr., NIST-JANAF Thermochemical Tables, 4th ed., Washington D.C:
American Institute of Physics for the NIST, 1998.
[48] J.H. Dymond, and E.B. Smith, The Virial Coefficients of Pure Gases and Mixtures,
A Critical Complication, Oxford: Oxford University Press, 1980.
[49] J.M. Smith, H.C. Van Ness, and M.M. Abbott, Introduction to Chemical
Engineering Thermo Dynamics, New York: McGraw-Hill, 1996.

157
[50] S.K. Mazumder, and R. Huang, “A high-power high-frequency and scalable multi-
megawatt fuel-cell inverter for power quality and distributed generation,” in Proc.
Power Electronics, Drives and Energy Systems, 2006, pp. 1–5.
[51] J.S. Lai, and F. Z. Peng, “Multilevel converters–A new breed of power
converters,” IEEE Trans. Industry Applications, vol. 32, pp. 509–517, May/Jun.
1996.
[52] L. Tolbert, F.-Z. Peng, and T. Habetler, “Multilevel converters for large electric
drives,” IEEE Trans. Industry Applications, vol. 35, pp. 36–44, Jan./Feb. 1999.
[53] R. Teodorescu, F. Beaabjerg, J. K. Pedersen, E. Cengelci, S. Sulistijo, B. Woo, and
P. Enjeti, “Multilevel converters — A survey,” in Proc. European Power
Electronics Conf., Lausanne, Switzerland, 1999, CD-ROM.
[54] J. Rodríguez, J.-S. Lai, and F.Z. Peng, “Multilevel inverters: A survey of
topologies, controls, and applications,” IEEE Trans. Industrial Electronics, vol. 49,
pp.724-738, Aug. 2002.
[55] P. Hammond, “A new approach to enhance power quality for medium voltage ac
drives,” IEEE Trans. Industry Applications, vol. 33, pp. 202–208, Jan./Feb. 1997.
[56] W.A. Hill, and C.D. Harbourt, “Performance of medium voltage multilevel
inverters,” in Proc. IEEE-IAS, 1999, pp. 1186–1192.
[57] B.J. Baliga, Power Semiconductor Devices. Boston, MA: PWS, 1996.
[58] M.D. Manjrekar, and T.A. Lipo, “A hybrid multilevel inverter topology for drive
applications,” in Proc. IEEE-APEC, 1998, pp. 523–529.

158
[59] M.D. Manjrekar, P.K. Steimer, and T.A. Lipo, “Hybrid multilevel power
conversion system: A competitive solution for high-power applications,”e IEEE
Trans. Industry Applications, vol. 36, pp. 834-841, May/Jun 2000.r
[60] E. Cengelci, S.U. Sulistijo, B.O. Woom, P. Enjeti, R. Teodorescu, and F.
Blaabjerge, “A new medium voltage PWM inverter topology for adjustable speed
drives,” IEEE Trans. Industry Applications, vol. 35, pp. 628-637, May/Jun 1999.
[61] U.S. Department of Energy, Future Energy Challenge, 2001. [Online]. Available:
http://www.energychallenge.org.
[62] G.M. Martins; J.A. Pomilio, S. Buso, and G. Spiazzi, “Three-phase low-frequency
commutation inverter for renewable energy systems,” IEEE Trans. Industrial
Electronics, vol. 53, pp. 1522-1528, Oct. 2006.
[63] G. Skibinski, J.Pankau, R. Sladky, and J. Campbell, ”Generation, control and
regulation of EMI from AC drives,” in Proc. IEEE-IAS, 1997, pp. 1571–1583.

159
VITA
Maja Harfman Todorovic received her B.S. degree from University of Belgrade,
Serbia in 2001 and, her M.S. degree from Texas A&M University, College Station,
Texas in 2004, both in Electrical Engineering. She graduated with her Ph.D. in the
Department of Electrical and Computer Engineering at Texas A&M University in May
2008. Her research interests include converters for fuel cells, green power, SMPS
design, UPS systems, energy storage devices and digital control of power converters.
Ms. Harfman Todorovic may be reached through the Department of Electrical
and Computer Engineering, Texas A&M University, College Station, TX 77843, mail
stop 77843-3128. Her email is [email protected].
Related Documents