Analysis and Design Methodology for System Cost Reduction in Distributed Power Systems Wardah Inam, Thipok Rak-amnouykit and David J. Perreault Massachusetts Institute of Technology Cambridge, MA, US [email protected], [email protected] and [email protected] Khurram K. Afridi University of Colorado Boulder Boulder, Colorado, US [email protected] Abstract—This paper focuses on analyzing system-level cost and efficiency trade-offs in designing converters for power systems. We address the optimization of power converters to meet system-level goals of microgrids for rural electrification and propose a weighted efficiency criteria, derived from the percentages of energy processed by the converter at different power levels. We also propose a method to trade-off efficiency and cost of converters to decrease overall system cost and have developed two types of converters to demonstrate this proposed methodology. I. DESIGNING CONVERTERS TO REDUCE SYSTEM COST Power converters play a major role in determining the total system cost of many applications, such as distributed energy and electricity backup systems. However, detailed analysis of the impact of converter efficiency’s variation with load on total system cost has rarely been discussed in literature. Several works have investigated the cost of individual components that affect the power converter cost [1], [2]. Significant progress has also been made on the optimization of reliability versus cost [3], [4]. While some works compare efficiency and cost of different system topologies [5], works that model and assess the total system cost impact of converters are still rare [6]. A sophisticated design methodology, which determines the cost and efficiency trade-off of power converters, will enable us to better evaluate new topologies and decrease the total system cost. Power converters are usually designed to meet objectives such as optimizing efficiency or reducing converter cost, without considering the impact of the converter on overall system performance and cost. For high-efficiency applications, the design emphasizes on increasing the peak efficiency and/or a source-related weighted efficiency, such as the California Energy Commission “CEC” efficiency [7]. For low-cost appli- cations, the design often emphasizes the cost of the converter, rather than the initial or the lifetime cost of the system. Hence, power converters with low component count are often utilized, minimizing the converter’s cost, but not necessarily the sys- tem’s initial or lifetime cost. The discrepancy between these two approaches arises because no framework exists to assess the design trade-off between efficiency and cost over the life- time of an application. These design decisions have prevailed in part because there have been few opportunities to co-design the power converters and the entire application. However, in creating new power systems (e.g. dedicated microgrids, power distribution systems, etc.), there is an opportunity to truly co-design and co-optimize the power system and the power converters. In this paper, the optimization of converters to meet system- level goals is discussed. A weighted efficiency metric, derived from the percentage of energy processed by the converter at each power level and based on system-level studies, is proposed. The metric helps design power converters which will minimize the total energy loss in the system. This is followed by a method to evaluate the trade-off between efficiency and cost of power converters, aiming to decrease overall system cost. The trade-off helps justify the increased cost of the converter and identify the power converter that achieves the lowest system cost. We demonstrate this methodology using two types of load converters on a microgrid system for rural electrification. The methodology can also be extended to evaluate the source converter design for this microgrid system, or to other energy applications entirely. Source Unit Load Unit PV panel Load Unit Load Unit Load Unit Ba4ery Load Unit Charge Controller Source Converter Load Converter Distribu=on Loss Loss Loss Loss Loss Figure 1: A system with six Power Management Units depict- ing the losses incurred II. APPLICATION:AFFORDABLE ELECTRICITY ACCESS The design methodology presented in this paper can be applied to a range of applications, especially those in which the power converter’s cost of production or typical efficiency metrics do not completely represent the total cost of the system.

Welcome message from author
This document is posted to help you gain knowledge. Please leave a comment to let me know what you think about it! Share it to your friends and learn new things together.
Transcript

Analysis and Design Methodology for System CostReduction in Distributed Power Systems
Wardah Inam, Thipok Rak-amnouykit and David J. PerreaultMassachusetts Institute of Technology
Cambridge, MA, [email protected], [email protected] and [email protected]
Khurram K. AfridiUniversity of Colorado Boulder
Boulder, Colorado, [email protected]
Abstract—This paper focuses on analyzing system-level costand efficiency trade-offs in designing converters for powersystems. We address the optimization of power converters tomeet system-level goals of microgrids for rural electrificationand propose a weighted efficiency criteria, derived from thepercentages of energy processed by the converter at differentpower levels. We also propose a method to trade-off efficiencyand cost of converters to decrease overall system cost and havedeveloped two types of converters to demonstrate this proposedmethodology.
I. DESIGNING CONVERTERS TO REDUCE SYSTEM COST
Power converters play a major role in determining the totalsystem cost of many applications, such as distributed energyand electricity backup systems. However, detailed analysis ofthe impact of converter efficiency’s variation with load on totalsystem cost has rarely been discussed in literature. Severalworks have investigated the cost of individual components thataffect the power converter cost [1], [2]. Significant progresshas also been made on the optimization of reliability versuscost [3], [4]. While some works compare efficiency and cost ofdifferent system topologies [5], works that model and assessthe total system cost impact of converters are still rare [6]. Asophisticated design methodology, which determines the costand efficiency trade-off of power converters, will enable us tobetter evaluate new topologies and decrease the total systemcost.
Power converters are usually designed to meet objectivessuch as optimizing efficiency or reducing converter cost,without considering the impact of the converter on overallsystem performance and cost. For high-efficiency applications,the design emphasizes on increasing the peak efficiency and/ora source-related weighted efficiency, such as the CaliforniaEnergy Commission “CEC” efficiency [7]. For low-cost appli-cations, the design often emphasizes the cost of the converter,rather than the initial or the lifetime cost of the system. Hence,power converters with low component count are often utilized,minimizing the converter’s cost, but not necessarily the sys-tem’s initial or lifetime cost. The discrepancy between thesetwo approaches arises because no framework exists to assessthe design trade-off between efficiency and cost over the life-time of an application. These design decisions have prevailedin part because there have been few opportunities to co-designthe power converters and the entire application. However, in
creating new power systems (e.g. dedicated microgrids, powerdistribution systems, etc.), there is an opportunity to trulyco-design and co-optimize the power system and the powerconverters.
In this paper, the optimization of converters to meet system-level goals is discussed. A weighted efficiency metric, derivedfrom the percentage of energy processed by the converterat each power level and based on system-level studies, isproposed. The metric helps design power converters which willminimize the total energy loss in the system. This is followedby a method to evaluate the trade-off between efficiency andcost of power converters, aiming to decrease overall systemcost. The trade-off helps justify the increased cost of theconverter and identify the power converter that achieves thelowest system cost. We demonstrate this methodology usingtwo types of load converters on a microgrid system for ruralelectrification. The methodology can also be extended toevaluate the source converter design for this microgrid system,or to other energy applications entirely.
Source Unit
Load Unit
PV panel
Load Unit
Load Unit
Load Unit Ba4ery
Load Unit
Charge Controller Source Converter Load Converter
Distribu=on
Loss
Loss Loss
Loss
Loss
Figure 1: A system with six Power Management Units depict-ing the losses incurred
II. APPLICATION: AFFORDABLE ELECTRICITY ACCESS
The design methodology presented in this paper can beapplied to a range of applications, especially those in whichthe power converter’s cost of production or typical efficiencymetrics do not completely represent the total cost of thesystem.
DJP
Typewritten Text
2016 IEEE Workshop on Control and Modeling
DJP
Typewritten Text
for Power Electronics (COMPEL '16)

Globally, more than 1.2 billion people do not have accessto electricity [8]. The cost of electricity infrastructure presentsan economic obstacle to electrification of many impoverishedcommunities. To develop solutions which can provide af-fordable access to electricity, we must aim to minimize thetotal system cost. In this paper, we consider the microgridarchitecture proposed earlier [9], which consists of two PowerManagement Units (PMUs). The generator module interfaceswith solar panels and batteries, and sets up the networkvoltage. The consumer module is a point-of-load converter,providing power conversion necessary to power different loadssuch as LED lights, cell phones, fans, etc. Fig. 1 shows abuilding block of the microgrid consisting of one generatingunit and five consuming units. These building blocks canbe repeated in different configurations to form an ad hocmicrogrid.
III. CONVERTERS EVALUATED
Two types of load converters, hard-switched PWM and soft-switched resonant, were built to demonstrate the proposedmethodology. For the hard-switched converter, the flybacktopology was selected. The soft-switched resonant convertershad two different design variations: first version incorporateda transformer with litz wire winding and second versionincorporated a transformer with printed circuit board winding.
n:1D1
Vout
S1
Cin+_Vin
LED Driver
12V
5V
LED
Fan
Cell phone
RD CD
RS CS
DS
12 V
(a) Schematic of the flyback converter
(b) Prototype of the flyback converter
Figure 2: Flyback converter
A. Flyback ConverterFlyback converter is one of the simplest and most-common
power conversion topologies for low-power isolated conver-
Table I: Components of the 12 V main power stage of theflyback converter
Component Type Cost($)
InvertersInput Capacitors 10µF/50V Ceramic capacitors, Qty: 5 0.068Transistors 150V/26A MOSFET (FDD390N15A), Qty:1 0.472
Snubber3.3kΩ (2W) Resistor Qty:122nF/100V Capacitor, Qty:1100V/1A Schottky diode, Qty: 1
0.155
Control IC Current-mode flyback dc/dc controller(LTC3805), Qty: 1
1.760
Transformer Power transformer (FA2900) Qty:1 1.890RectifierDiode 60V/3A Schottky diode (PMEG6030), Qty:1 0.120
Diode Snubber 33Ω (1W) Resistor, Qty:1240pF/100V NPO Capacitor, Qty:1 0.047
Output Capacitor 22µF/16V Ceramic capacitors 0.054ProtectionSwitch 20V/4.2A MOSFET (SMD15PL), Qty: 1 0.054
Fuse Fuse Glass 2AG, Qty: 1250V/10A Clip cartridge 0.180
Output Diode 30V/2A Schottky diode, Qty: 1 0.045
sion. It requires very few components; a simple flyback powerstage consists of a switch, a transformer and a diode. Despitethe advantage of simplicity, there are some drawbacks: theconverter suffers high device stresses, requires a gapped energystorage transformer, and is relatively large in volume. Theschematic and prototype board of the flyback converter builtare shown in Fig. 2. The flyback main power stage is followedby dedicated post-regulators to manage powering of cell-phones and LEDs. In this analysis only the 12 V main powerstage will be considered. The components used for the powerstage of the converter are detailed in Table I, and the cost ofthe power stage is provided in Fig. 5.
Cr Lr
Lm
np:ns1:ns2
D1
D2
S2
S1
Cin+_
Vin
D2
D4
Vout1
D5
D7
D6
D8
Vout2
(a) Schematic of the first version of the resonant converter
(b) Prototype of the first version of the resonant converter
Figure 3: Multi-output resonant converter with litz wire trans-former
Cr Lr
Lm
np:ns1:ns2
D1
D2
S2
S1
Cin+_
Vin
D2
D4
Vout1
D5
D7
D6
D8
Vout2
LDO
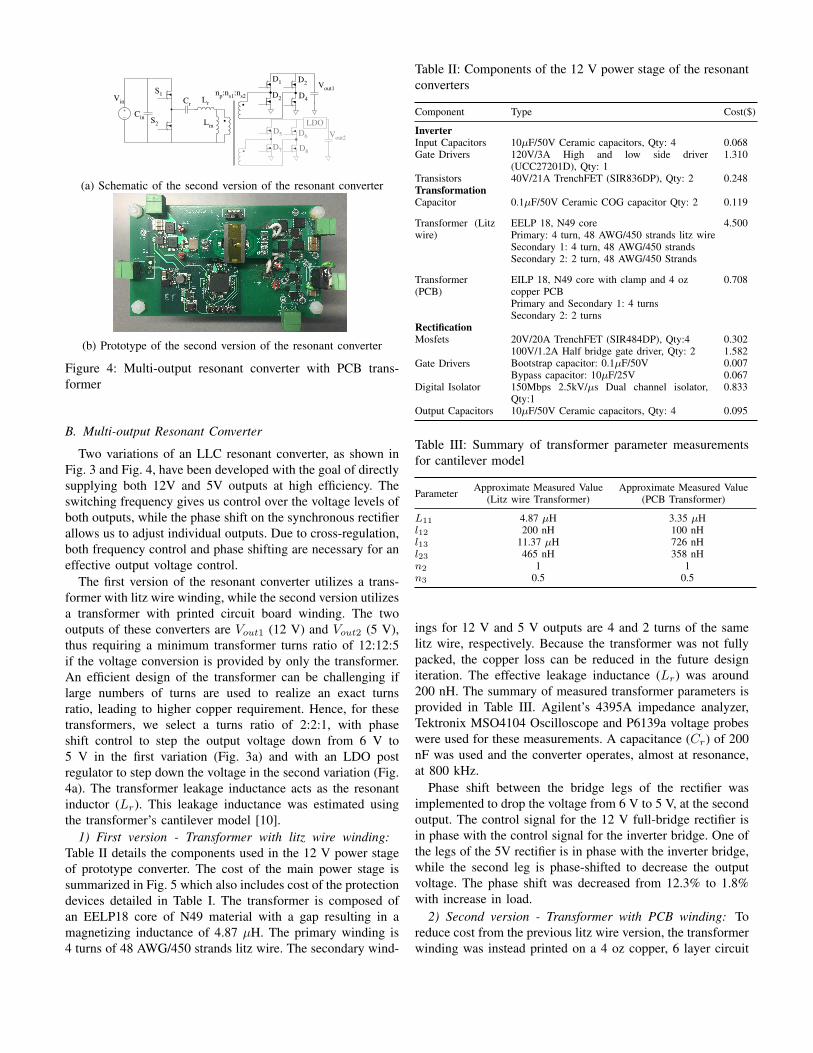
(a) Schematic of the second version of the resonant converter
(b) Prototype of the second version of the resonant converter
Figure 4: Multi-output resonant converter with PCB trans-former
B. Multi-output Resonant Converter
Two variations of an LLC resonant converter, as shown inFig. 3 and Fig. 4, have been developed with the goal of directlysupplying both 12V and 5V outputs at high efficiency. Theswitching frequency gives us control over the voltage levels ofboth outputs, while the phase shift on the synchronous rectifierallows us to adjust individual outputs. Due to cross-regulation,both frequency control and phase shifting are necessary for aneffective output voltage control.
The first version of the resonant converter utilizes a trans-former with litz wire winding, while the second version utilizesa transformer with printed circuit board winding. The twooutputs of these converters are Vout1 (12 V) and Vout2 (5 V),thus requiring a minimum transformer turns ratio of 12:12:5if the voltage conversion is provided by only the transformer.An efficient design of the transformer can be challenging iflarge numbers of turns are used to realize an exact turnsratio, leading to higher copper requirement. Hence, for thesetransformers, we select a turns ratio of 2:2:1, with phaseshift control to step the output voltage down from 6 V to5 V in the first variation (Fig. 3a) and with an LDO postregulator to step down the voltage in the second variation (Fig.4a). The transformer leakage inductance acts as the resonantinductor (Lr). This leakage inductance was estimated usingthe transformer’s cantilever model [10].
1) First version - Transformer with litz wire winding:Table II details the components used in the 12 V power stageof prototype converter. The cost of the main power stage issummarized in Fig. 5 which also includes cost of the protectiondevices detailed in Table I. The transformer is composed ofan EELP18 core of N49 material with a gap resulting in amagnetizing inductance of 4.87 µH. The primary winding is4 turns of 48 AWG/450 strands litz wire. The secondary wind-
Table II: Components of the 12 V power stage of the resonantconverters
Component Type Cost($)
InverterInput Capacitors 10µF/50V Ceramic capacitors, Qty: 4 0.068Gate Drivers 120V/3A High and low side driver
(UCC27201D), Qty: 11.310
Transistors 40V/21A TrenchFET (SIR836DP), Qty: 2 0.248TransformationCapacitor 0.1µF/50V Ceramic COG capacitor Qty: 2 0.119
Transformer (Litzwire)
EELP 18, N49 corePrimary: 4 turn, 48 AWG/450 strands litz wireSecondary 1: 4 turn, 48 AWG/450 strandsSecondary 2: 2 turn, 48 AWG/450 Strands
4.500
Transformer(PCB)
EILP 18, N49 core with clamp and 4 ozcopper PCBPrimary and Secondary 1: 4 turnsSecondary 2: 2 turns
0.708
RectificationMosfets 20V/20A TrenchFET (SIR484DP), Qty:4 0.302
Gate Drivers100V/1.2A Half bridge gate driver, Qty: 2Bootstrap capacitor: 0.1µF/50VBypass capacitor: 10µF/25V
1.5820.0070.067
Digital Isolator 150Mbps 2.5kV/µs Dual channel isolator,Qty:1
0.833
Output Capacitors 10µF/50V Ceramic capacitors, Qty: 4 0.095
Table III: Summary of transformer parameter measurementsfor cantilever model
Parameter Approximate Measured Value(Litz wire Transformer)
Approximate Measured Value(PCB Transformer)
L11 4.87 µH 3.35 µHl12 200 nH 100 nHl13 11.37 µH 726 nHl23 465 nH 358 nHn2 1 1n3 0.5 0.5
ings for 12 V and 5 V outputs are 4 and 2 turns of the samelitz wire, respectively. Because the transformer was not fullypacked, the copper loss can be reduced in the future designiteration. The effective leakage inductance (Lr) was around200 nH. The summary of measured transformer parameters isprovided in Table III. Agilent’s 4395A impedance analyzer,Tektronix MSO4104 Oscilloscope and P6139a voltage probeswere used for these measurements. A capacitance (Cr) of 200nF was used and the converter operates, almost at resonance,at 800 kHz.
Phase shift between the bridge legs of the rectifier wasimplemented to drop the voltage from 6 V to 5 V, at the secondoutput. The control signal for the 12 V full-bridge rectifier isin phase with the control signal for the inverter bridge. One ofthe legs of the 5V rectifier is in phase with the inverter bridge,while the second leg is phase-shifted to decrease the outputvoltage. The phase shift was decreased from 12.3% to 1.8%with increase in load.
2) Second version - Transformer with PCB winding: Toreduce cost from the previous litz wire version, the transformerwinding was instead printed on a 4 oz copper, 6 layer circuit

board. The cost of using 4 oz copper is slightly highercompared to that of 1 oz copper, but 4 oz copper yieldshigher efficiency. The increased cost per board has been takenin to account as the increased transformer cost in Table II.For this prototype, phase-shift control was not very effectivebecause the leakage inductance L13 of the PCB windings (aspresented in the cantilever model) is very small. Hence, anLDO was added to decrease the output voltage from 6 V to5 V. The transformer core is gapped to achieve a magnetizinginductance of 3.35 µH. It had a leakage inductance of 150 nH,which acts as the resonant inductor (Lr), and a capacitance(Cr) of 200 nF. This converter operates around 915 kHz.
$-
$2.00
$4.00
$6.00
$8.00
$10.00
$12.00
$14.00
Flyback Resonant (litz wire) Resonant ( PCB)
Cost of Converters
Inverter Transformation Rectifier Protection
$5.28
$13.1
$8.85
Figure 5: Cost of the 12 V power stage of the three converters
0 5 10 15 20 25Output Power (W)
65
70
75
80
85
90
95
100
Eff
icie
ncy
(%)
FlybackResonant (Litz-wire)Resonant (PCB)
Figure 6: Efficiency vs output power of the three converters
IV. DETERMINING THE CONVERTER’S WEIGHTEDEFFICIENCY METRIC THAT MINIMIZES ENERGY LOSS
In this section, we propose a weighted efficiency metric,which is derived from the load profile and based on theactual percentage of energy processed by the converter ateach power level during a year. To determine the converter’sefficiency profile that would result in minimum energy loss,
we first calculate the annual load profile of the converterfrom several system characteristics and the usage model. Fromthe load profile, the fraction of time in a year that the loadconverter spends at each output power level is computed,then the fraction of output energy drawn at each power levelis calculated. Combining this histogram with the efficiencyversus output power curve, the weighted efficiency of eachconverter can be determined.
A. Annual Load Profile
The estimation of the annual load profile takes into accountthe loads, the variation of each load’s power consumption, andthe duration each load will be used in a year. Our microgridsystem for rural electrification consists of four load types - anindoor light bulb (3 W), an outdoor light bulb (3 W), a fan (15W), and a cell phone (2.5 W). Each load’s power consumptionis modelled considering product and manufacturing variations.Because the annual usage data does not exist for this newlycreated power system, it is necessary to construct a usagemodel and determine usage duration of each load. The modelalso incorporates user behavioral information collected frominterviews, along with relevant physical data of the systemlocation, such as irradiance and temperature.
In this model, a light bulb is switched on during the hourswhen it is dark outside and people are awake. We determinethe ambient light level from the National Renewable EnergyLaboratory’s (NREL) solar irradiation data at the systemlocation - Jamshedpur, India [11]. The interviews conductedduring a field trial were used to assess when people are awakeand when they are likely to use indoor or outdoor light bulbs.These two time intervals were overlapped to determine theamount of hours light bulbs are likely to be switched on duringeach day of a year. The load profile of the fan is modelledon user behavioral information and outside temperature data.The fan is switched on when the outside temperature is high(more than 31C). Cellphone usage is harder to accuratelypredict as it is strongly dependent on the number of phonesper household. During the interviews, it was confirmed that thenumber of phones per household varies and is dependent onthe number of people in the house. In the model, an average ofone phone per household is charged every day. The time thephone starts charging can vary, however, the phone is usuallycharged for at least three hours per day.
The load profile generated by the usage model is a plot ofthe output power as a function of time. From this plot in thetime domain, the histogram of the fraction of time the systemspends at each power level is calculated. The percentage ofenergy processed by the load converter at each power level isthen derived from the time histogram, as shown in Fig. 7.
B. Weighted Efficiency
A power converter’s efficiency curve is a fundamentalindicator of its performance. Many well-known efficiencymetrics are derived from the efficiency curve, for exam-ple, the California Energy Commission (CEC) efficiency isa weighted average of the efficiencies at six power levels

Figure 7: Percentage of energy processed by the load converterincluding variation in each load’s power consumption
Figure 8: Percentage of energy processed by the load converter,assuming no variation in each load’s power consumption
(ηCEC = 0.04η10% + 0.05η20% + 0.12η30% + 0.21η50% +0.53η75%+0.05η100%). The CEC efficiency gives more weightto the efficiency at high loads, however, the load profiles ofmany power applications, including the rural electrificationmicrogrid considered in this paper, are dominated by light-load and mid-load usage. Therefore, given the knowledge ofthe system’s load profile, an efficiency metric that reflectsthe converter’s performance in the system more effectivelycan be derived. By removing load variation (e.g. an LEDlight consuming 3.1 W is considered to be consuming 3W) and aggregating consecutive power level bins with lowpercentages of energy output, we obtain a consolidated versionof the percentage of energy processed by the load converterat each power level, as shown in Fig. 8. This gives us theweighted energy metric, as in Equation. 1. Using this metric,the weighted efficiency of the three converters is calculated,as shown in Table. IV.
ηenergy = 0.11η12% + 0.24η24% + 0.03η34% + 0.48η60%
+ 0.09η70% + 0.04η84% + 0.01η94% (1)
Table IV: Weighted efficiency metric for three converters
Converter ηenergy
Flyback 85.82%Resonant (Litz wire) 93.17%Resonant (PCB) 91.96%
V. DETERMINING THE COST OF POWER CONVERTER’SEFFICIENCY
A more efficient power converter may require a morecomplex topology and higher cost of production. Despitesaving some cost by reducing power loss in the system, anoverly complicated converter may cost more than the totalamount it can save over the system lifetime. To calculatewhether the increase in efficiency of the converter justifies theincrease in cost, a system-level simulation is performed. Foreach converter topology under consideration, we first calculatethe corresponding optimal solar panel and battery capacities,then calculate the related initial cost and lifetime cost of thesystem. The initial cost sums up the cost of all components,while the lifetime cost accounts for the cost of replacement ofcomponents during the lifetime.
The following subsections describe the steps required tocalculate the total system cost. These steps are summarizedin the flowchart in Fig. 9.
1) Set Availability Preference: Regardless of the choice ofload converter topology, the system should be able to providesimilar amount of energy. Specifically we define the systemavailability as the ratio of energy provided to energy demand.Therefore, the system parameters, such as the size of PV paneland battery, must be configured such that the minimum avail-ability level is met. Because the three load converter prototypeshave different efficiency characteristics, the correspondingoptimal system configurations that yield similar availabilitylevel can be different. Given a load converter and its efficiencycurve, we iterate through the sizing of PV panel and batteryuntil the system reaches the desired availability. Note that thesystem cost increases greatly as the availability preferenceis increased higher than 90%, because high availability levelrequires electricity provision even in a very rare case. Hence,the cost of providing 100% availability is much higher than thecost of non-served energy. An availability of 92% is chosenfor the simulation.
2) Calculate Generation and Load Profiles: The generationprofile is derived from solar irradiance data of the targetlocation - Jamshedpur, India. The power generated by the solarpanels is calculated throughout a year from the annual irradi-ance data from NREL and the capacity of those panels. Theresulting generation profile is a plot of the power generatedas a function of time. Similarly, the load profile is determined

Figure 9: Flowchart showing the steps to determine system cost for each power converter
from user behavioral model and various system characteristics,as discussed earlier in Section IV-A.
3) Stored Energy: The difference between power generatedand output power is the amount available for storage in thebattery. The amount of energy stored in the system alsodepends greatly on the battery capacity. If the battery is alreadyfully charged, any extra power generated will not be stored,resulting in “spillage”. Therefore, if the battery is too small,the system can not fully utilize the capability of solar energysource and may fail to provide enough output energy to meetthe availability requirement. On the contrary, if the battery istoo large, it will significantly increase the system cost. Thissizing problem presents the trade-off between the battery costand the availability level.
4) Losses in the System: System losses affect the sizing ofpower generation and required storage necessary to meet theavailability requirement. A system with higher power loss fromsource to load will need a larger power source and storage toprovide the same output power as a system with lesser loss.
As illustrated in Fig. 1, the system loss consists of converterinefficiency, battery charging/discharging inefficiency, and lineresistances. By tracking the power flow between differentpoints throughout the system, the losses can be calculated.
29%
30%
31%
6%4%
Breakdown of Initial Cost
Battery
PV panel
Electronics
Wiring
Poles
Figure 10: Cost breakdown of the system with five Flybackload converters and one source converter

Table V: Initial and lifetime cost of the system for 92% availability
Converter BatteryCapacity
PV PanelCapacity
Power Stage($/unit)
Power Stage($/5 units)
InitialSystem ($)
LifetimeSystem Cost
Flyback 22 Ah 200 W $5.28 $26.4 $460 $757.4Resonant (litz wire) 20 Ah 180 W $12.54 $62.7 $470.4 $743.7Resonant (PCB) 20 Ah 190 W $8.85 $44.3 $458.9 $732.2
Table VI: System parameters and cost of components used
Parameters Value
System ParametersNumber of source units 1Number of load units 5Number of Poles 5Wiring length (per household) from source 40 mWiring size 2.55 mm2
Network voltage 24 VAvailability 92 %Battery (LFP) lifetime 5 yearsPole (bamboo) lifetime 5 yearSystem lifetime 15 yearsCostPV panel $0.7/WLFP battery $0.5/WhPower wire $0.06/mCat3 cable $0.03/mPoles (bamboo) $3.33/poleSource Unit $40Load Unit $15 + power stage cost
5) Iterating and Comparing System Costs: The system’sinitial cost includes the cost of PV panel, battery, sourceand load converters, distribution lines, and mounting poles, assummarized in Table VI. The lifetime cost, over 15 years inthis case, includes the additional replacement cost for systemcomponents. The battery (Lithium Ferro Phosphate) and thebamboo poles must be replaced every 5 years. The simulationis designed to produce the optimal configuration of PV panelsand batteries resulting in the lowest lifetime cost. Becausethe system’s energy availability is a function of the PV panelcapacity, battery capacity, as well as the loss incurred, wemust find the range of system specifications that can meetthe target availability for each load converter. For a givenconverter, we iterate through different combinations of PVpanel capacity and battery capacity, repeat the loss calculation,and compare the resulting availability with the target value.The configurations that meet the availability criteria proceedto the next step of system cost calculation.
Fig. 10 provides a breakdown of the initial capital cost ofthe system with flyback converter. The simulation process isrepeated for the three power converters in consideration. Theconverter with lowest lifetime cost is then selected. Table.V summarizes the results of the simulation. The resonantpower converter with PCB transformer, despite having higherproduction cost than the flyback converter, leads to an optimalsystem with improved initial and lifetime costs. The decreasein initial system cost is due to the converter’s lower cost andhigher weighted efficiency, which reduces the initial sizing -and hence cost - of other system components . The improved
lifetime cost of the system also follows from this advantage,specifically the lower battery capacity which needs to bereplaced after every five years.
VI. CONCLUSION AND FUTURE WORK
This paper presents a methodology to co-design and co-optimize power converters with a new power system. Theproposed methodology is demonstrated through an analysisof a rural electrification microgrid design. To minimize thesystem’s lifetime cost, we develop an approach to evaluateand compare the cost effectiveness of implementing differentload converters. First, a model is created to estimate the annualload profile. A weighted efficiency metric is then derived fromthe model to evaluate the load converter. Combining the newefficiency metric definition and a converter’s efficiency versusoutput power curve yields the weighted efficiency value for theconverter in context of the system. This metric can indicate aconverter choice that minimizes energy loss at the load side,which often translates to smaller sizing for PV panel andstorage but does not guarantee the minimum initial or lifetimecost for the system. For each load converter, we run a system-level simulation to find the range of corresponding systemconfigurations that meet the required specification. From theseconfigurations, we select the one that has the lowest lifetimecost for the system. Lastly, the most optimal configuration foreach type of converter is compared with the others to find thebest possible option for the system.
The analysis in this work considers only load converter’s12 V main power stage. This can be extended to also includeother converters and multiple outputs of the converter.
REFERENCES
[1] C. Sullivan, “Cost-constrained selection of strand diameter and numberin a litz-wire transformer winding,” Power Electronics, IEEE Transac-tions on, vol. 16, pp. 281–288, Mar 2001.
[2] B. Burger, D. Kranzer, and O. Stalter, “Cost reduction of pv-inverterswith sic-dmosfets,” in Integrated Power Systems (CIPS), 2008 5thInternational Conference on, pp. 1–5, March 2008.
[3] K. Ma and F. Blaabjerg, “Reliability-cost models for the power switchingdevices of wind power converters,” in Power Electronics for DistributedGeneration Systems (PEDG), 2012 3rd IEEE International Symposiumon, pp. 820–827, June 2012.
[4] X. Yu and A. Khambadkone, “Reliability analysis and cost optimizationof parallel-inverter system,” Industrial Electronics, IEEE Transactionson, vol. 59, pp. 3881–3889, Oct 2012.
[5] K. Kim, S. Lertburapa, C. Xu, and P. Krein, “Efficiency and cost trade-offs for designing module integrated converter photovoltaic systems,” inPower and Energy Conference at Illinois (PECI), 2012 IEEE, pp. 1–7,Feb 2012.
[6] R. Burkart and J. Kolar, “Component cost models for multi-objectiveoptimizations of switched-mode power converters,” in Energy Conver-sion Congress and Exposition (ECCE), 2013 IEEE, pp. 2139–2146, Sept2013.

[7] C. Calwell, S. Foster, T. Reeder, and A. Mansoor, “Test method forcalculating the energy efficiency of single-voltage external ac-dc andac-ac power supplies,” Energy Star R© Adapter Test Methodology, 2004.
[8] IEA, World Energy Outlook 2015. International Energy Agency, 2015.[9] W. Inam, D. Strawser, K. Afridi, R. Ram, and D. Perreault, “Architecture
and system analysis of microgrids with peer-to-peer electricity sharing tocreate a marketplace which enables energy access,” in Power Electronicsand ECCE Asia (ICPE-ECCE Asia), 2015 9th International Conferenceon, pp. 464–469, June 2015.
[10] R. W. Erickson and D. Maksimovic, “A multiple-winding magneticsmodel having directly measurable parameters,” in Power ElectronicsSpecialists Conference, 1998. PESC 98 Record. 29th Annual IEEE,vol. 2, pp. 1472–1478 vol.2, May 1998.
[11] “National solar radiation database (nsrdb).”
Related Documents