1 1. Summary The composition of an unknown sample of a mixture of carbonates will be determined by using a combination of several experimental apparatuses, including x-ray diffraction (XRD), thermogravimetric analyisis (TGA) and differential thermal analysis (DTA). In addition, published thermochemical data will be applied to check the accuracy of the XRD analysis by generating a Van’t Hoff, or Second Law [of thermodynamics] plot to compare the thermal behavior of the compounds believed to be present in the given sample with that of the thermal behavior of the same sample under a decomposition, or in this case, a calcination reaction under an inert atmosphere in a system ranked from ambient (room) to some elevated temperature. 2. Introduction This exercise will demonstrate the characterization of a sample of an unknown mineral or concentrate in order to determine the proper conditions for processing the sample. In this case, a mixture of unknown carbonates will be analyzed in order to determine the decomposition temperatures of the carbonates. A general reaction for metal carbonate decomposition is shown below. MeCO 3(s) → MeO (s) + CO 2(g) Industrially, this process is referred to as calcination. Calcination is a crucial operation, as it is employed in the manufacturing of lime for use in cement as well as used as a pretreatment step in the processing of other mineral products.

Welcome message from author
This document is posted to help you gain knowledge. Please leave a comment to let me know what you think about it! Share it to your friends and learn new things together.
Transcript

1
1. Summary
The composition of an unknown sample of a mixture of carbonates will be determined by using a combination of several experimental apparatuses, including x-ray diffraction (XRD), thermogravimetric analyisis (TGA) and differential thermal analysis (DTA). In addition, published thermochemical data will be applied to check the accuracy of the XRD analysis by generating a Van’t Hoff, orSecond Law [of thermodynamics] plot to compare the thermal behavior of the compounds believed to be present in the given sample with that of the thermal behavior of the same sample under a decomposition, or in this case, a calcination reaction under an inert atmosphere in a system ranked from ambient (room) to some elevated temperature.
2. Introduction
This exercise will demonstrate the characterization of a sample of an unknown mineral or concentrate in order to determine the proper conditions for processing the sample. In this case, a mixture of unknown carbonates will be analyzed in order to determine the decomposition temperatures of the carbonates. A general reaction for metal carbonate decomposition is shown below.
MeCO3(s) → MeO(s) + CO2(g)
Industrially, this process is referred to as calcination. Calcination is a crucial operation, as it is employed in the manufacturing of lime for use in cement as well as usedas a pretreatment step in the processing of other mineral products.

2
On November 3, 2014, the sample was obtained and prepared for examination by XRD, TGA, and DTA. In conjunction with the aforementioned experiments, the use of Arrhenius plots will be employed to verify the decomposition temperature ofthe carbonates after examination. Information from these methods will be used collectively to determine the carbonates in the unknown sample.
3. Experimental (Method and Apparatus)
The sample that was received was a mixture of what appearedto be three carbonates mixed together. The sample was medium in particle size (~20-40 mesh), and therefore had tobe pulverized in order for the samples to mounted into the Rigaku XRD and the TGA/DTA. After pulverizing, the sample was then split by coning and quartering. The split was then separated into a -200 mesh size fraction to be used for the remainder of this experiment. The sample was a uniform light red color after pulverizing. An image of the carbonate mixture before pulverizing is shown below.
Fig. 3.1: Unprepared Sample
XRD
The use of XRD will be employed in determining the make up of the carbonate mixture. XRD will also be used to
3
determine the composition of the calcine after the calcination portion of this experiment.
When a beam of x-ray radiation is directed towards a crystalline substance, a reflection of the ray can be obseved at various angles. At different angles, different substances will have a characteristic peak based on the difference in the distances between the sets of planes in the crystal lattice of the substance.1 The following equation, known as the Bragg condition, quantifies the relationship between the x-ray intensity and the angle of diffraction with respect to the distance of the crystal lattice:
nλ= 2dsinθ
The machine in use, a Rigaku Ultima IV, comes equipped withthe data regarding the diffraction pattern of many different compounds. This data will be used to compare theintensities and the diffraction angles of known substances to that of the unknown substance. By matching a compound of interest, say for example the diffraction pattern of Fe2O3 with that of the unknown, the compound of interest canbe determined if the known pattern matches that of the peak.
TGA/DTA
After using XRD to analyze the composition of the sample, aVan’t Hoff (or an Arrhenius) plot will be made to determinethe theorhetical decomposition temperatures for the sample.The Van’t Hoff plot shows the relationship between the partial pressure of CO2 (log K or logPCO2) and temperature (1T in Kelvin). The temperature at which decomposition

4
should occur will be the point at which the PCO2 exceeds atmospheric pressure, Patm.
To verify that the decomposition temperatures are correct, TGA and DTA will be performed on the sample to determine the decomposition temperatures of the actual sample.
To measure the temperature at which decomposition occurs, ameasure of an increase or decrease of heat will be noted byan exotherm or endotherm (a spike or a trough). To do this, the temperature of the sample will be compared to that of an inert material as the temperature of the system is raised from room temp 20oC to 1100oC. The inert materialshould not have any changes in temperature, but the sample material will, which should result in a change in heat content.2 This form of analysis is the DTA portion of the experiment.
Furthermore, the change of the samples mass during decomposition can also be measured using TGA. Similarly, the inert material will also be used as a referece weight to the sample undergoing thermal decomposition. The weightlosses of the sample should correspond with the heat flow into the sample during the experiment.2
If the initial analysis of the XRD was correct, the TGA/DTAresults should closely match the theorhetical decompositiontemperatures of the various carbonates from which the Van’tHoff plot was constructed. If the XRD was incorrect, that is the TGA/DTA do not match the theorhetical decomposition temperatures, further analysis using XRD may be required.
Calcination
After analyzing the raw or feed sample with XRD and TGA/DTA, the sample will be split into however many samplesthat will be needed to test the decomposition temperature
5
of each carbonate determined from the Van’t Hoff plot. Thecarbonate sample will undergo calcination for 60 minutes ina tube furnace, at which point the samples will be allowed to cool down to be sampled by XRD to analyze for the oxidesof each metal.
4. Results and Discussion
XRD
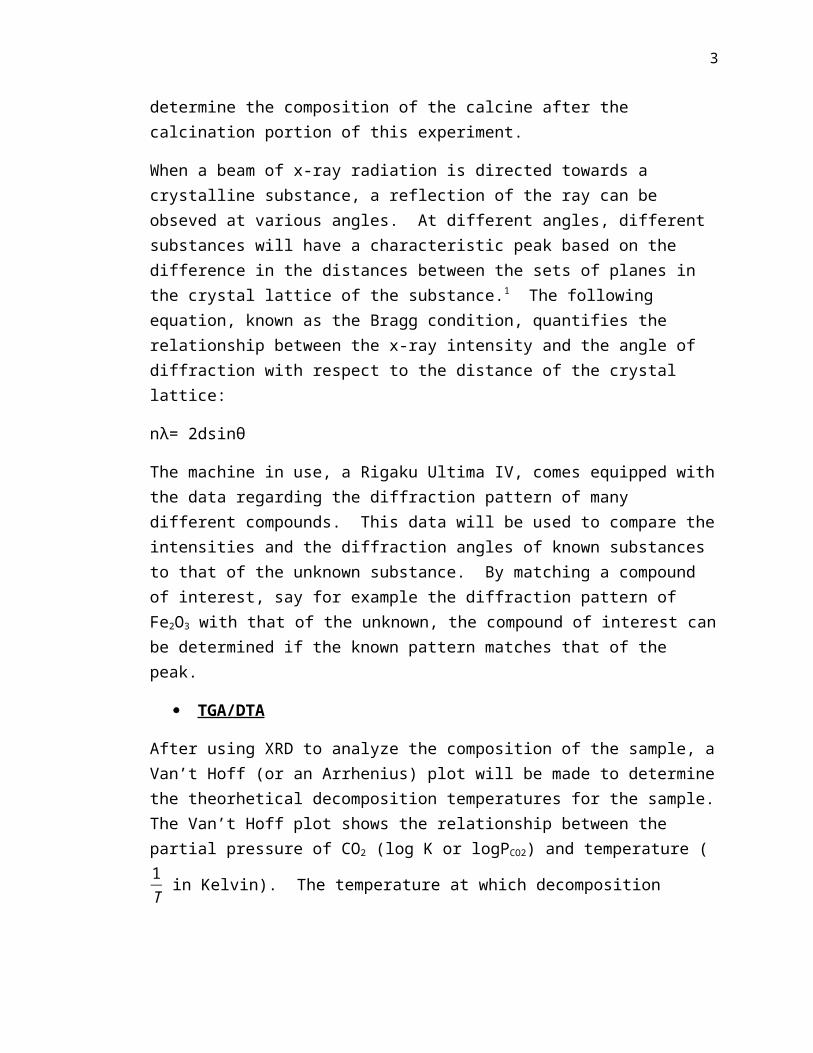
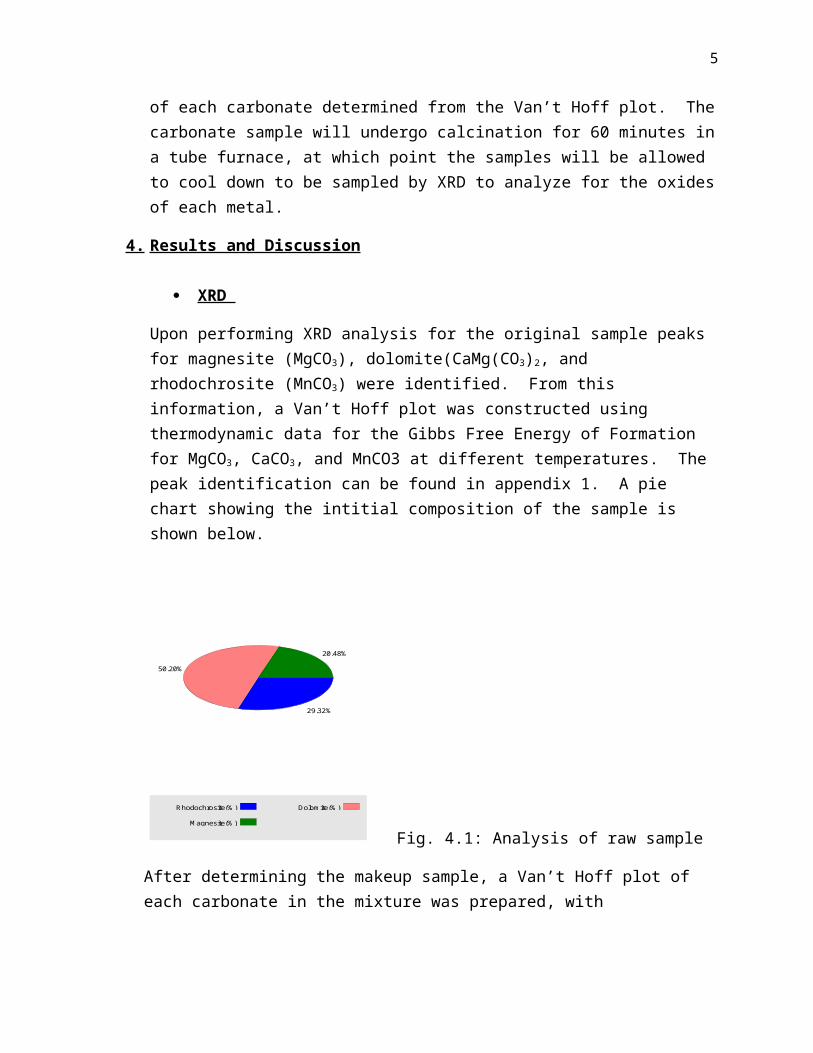
Upon performing XRD analysis for the original sample peaks for magnesite (MgCO3), dolomite(CaMg(CO3)2, and rhodochrosite (MnCO3) were identified. From this information, a Van’t Hoff plot was constructed using thermodynamic data for the Gibbs Free Energy of Formation for MgCO3, CaCO3, and MnCO3 at different temperatures. The peak identification can be found in appendix 1. A pie chart showing the intitial composition of the sample is shown below.
29.32%
50.20%
20.48%
Rhodochrosite(% ) Dolom ite(% )
M agnesite(% )
Fig. 4.1: Analysis of raw sample
After determining the makeup sample, a Van’t Hoff plot of each carbonate in the mixture was prepared, with
6
thermochemical data from the United States Dept. of the Interior, found in appendix 2.
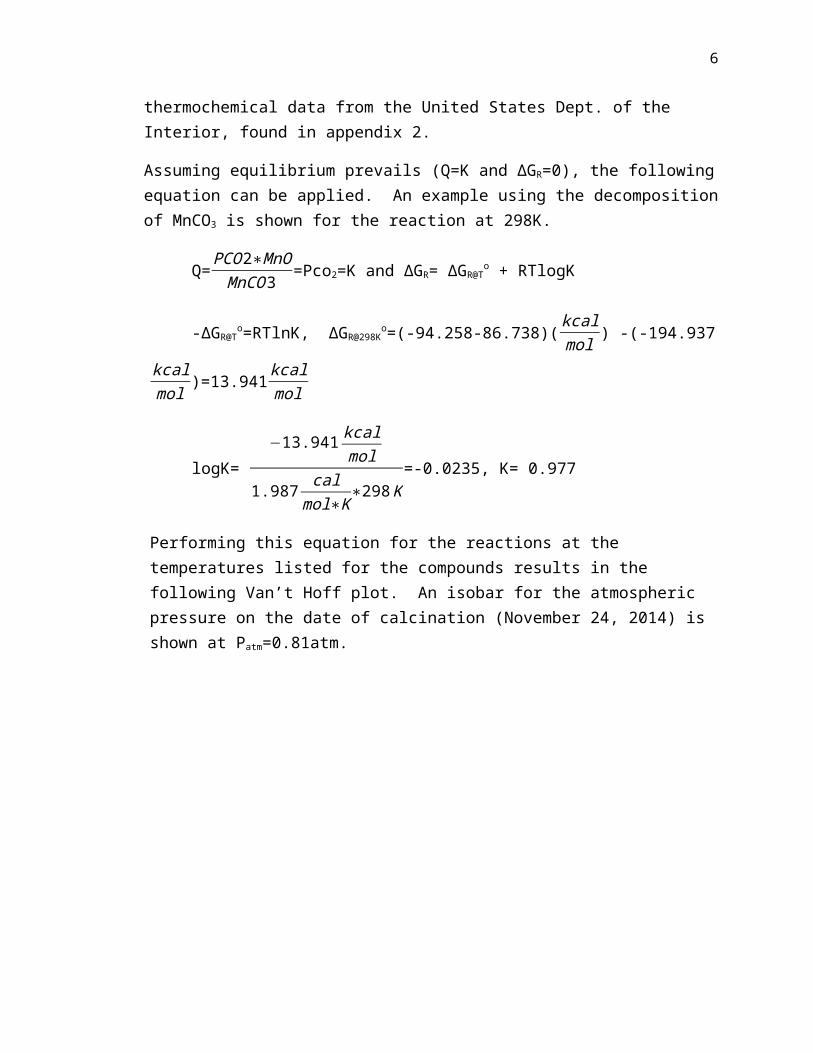
Assuming equilibrium prevails (Q=K and ΔGR=0), the followingequation can be applied. An example using the decompositionof MnCO3 is shown for the reaction at 298K.
Q=PCO2∗MnOMnCO3 =Pco2=K and ΔGR= ΔGR@To + RTlogK
-ΔGR@To=RTlnK, ΔGR@298K
o=(-94.258-86.738)(kcalmol ) -(-194.937
kcalmol )=13.941kcalmol
logK= −13.941 kcal
mol
1.987 calmol∗K∗298K
=-0.0235, K= 0.977
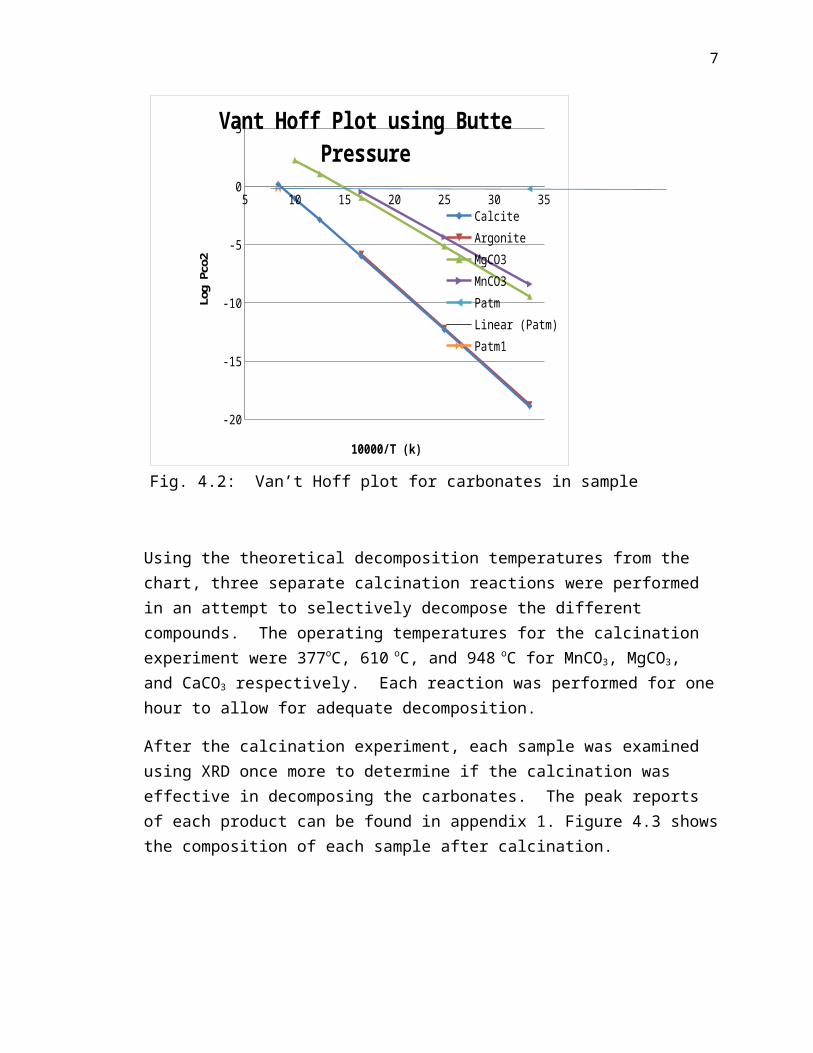
Performing this equation for the reactions at the temperatures listed for the compounds results in the following Van’t Hoff plot. An isobar for the atmospheric pressure on the date of calcination (November 24, 2014) is shown at Patm=0.81atm.
7
5 10 15 20 25 30 35
-20
-15
-10
-5
0
5Vant Hoff Plot using Butte Pressure
CalciteArgoniteMgCO3MnCO3PatmLinear (Patm)Patm1
10000/T (k)
Log Pco2
Fig. 4.2: Van’t Hoff plot for carbonates in sample
Using the theoretical decomposition temperatures from the chart, three separate calcination reactions were performed in an attempt to selectively decompose the different compounds. The operating temperatures for the calcination experiment were 377oC, 610 oC, and 948 oC for MnCO3, MgCO3, and CaCO3 respectively. Each reaction was performed for onehour to allow for adequate decomposition.
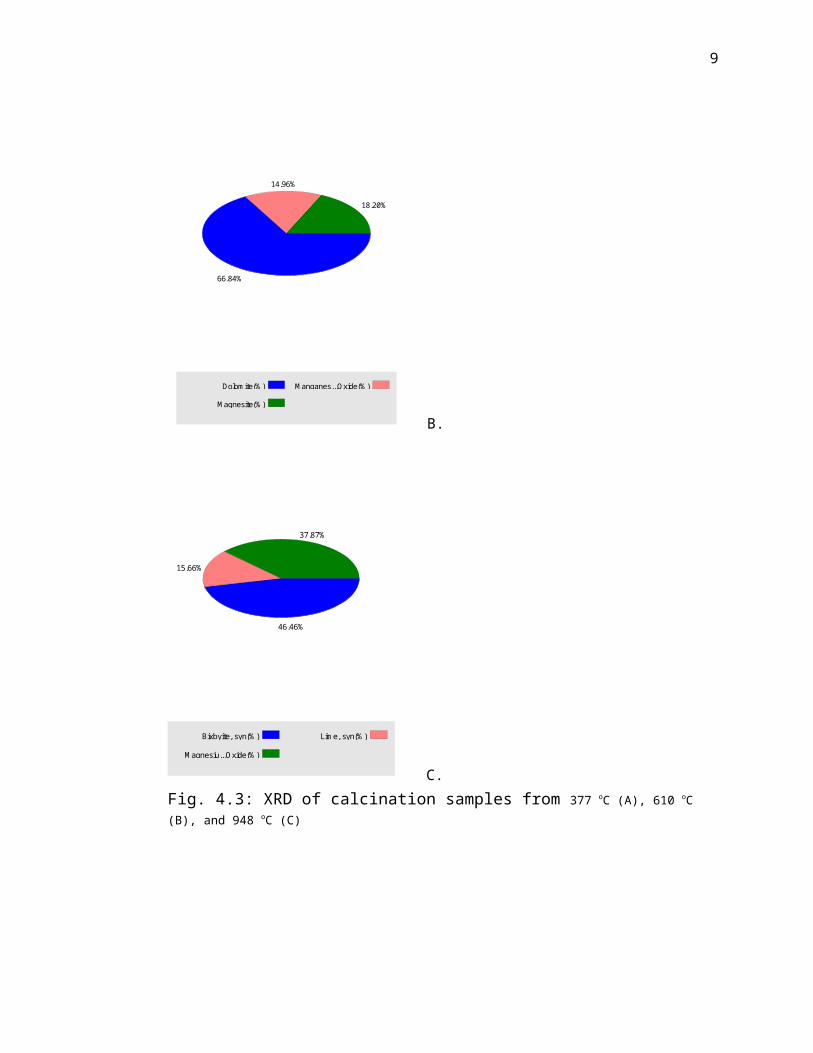
After the calcination experiment, each sample was examined using XRD once more to determine if the calcination was effective in decomposing the carbonates. The peak reports of each product can be found in appendix 1. Figure 4.3 showsthe composition of each sample after calcination.

8
53.07%
41.21%
5.72%
Rhodochrosite(% ) Dolom ite(% )
m agnesite HP(% )
A.
9
66.84%
14.96%
18.20%
Dolom ite(% ) M anganes...Oxide(% )
M agnesite(% )
B.
46.46%
15.66%
37.87%
Bixbyite, syn(% ) Lim e, syn(% )
M agnesiu...Oxide(% )
C.Fig. 4.3: XRD of calcination samples from 377 oC (A), 610 oC (B), and 948 oC (C)
10
TGA/DTA
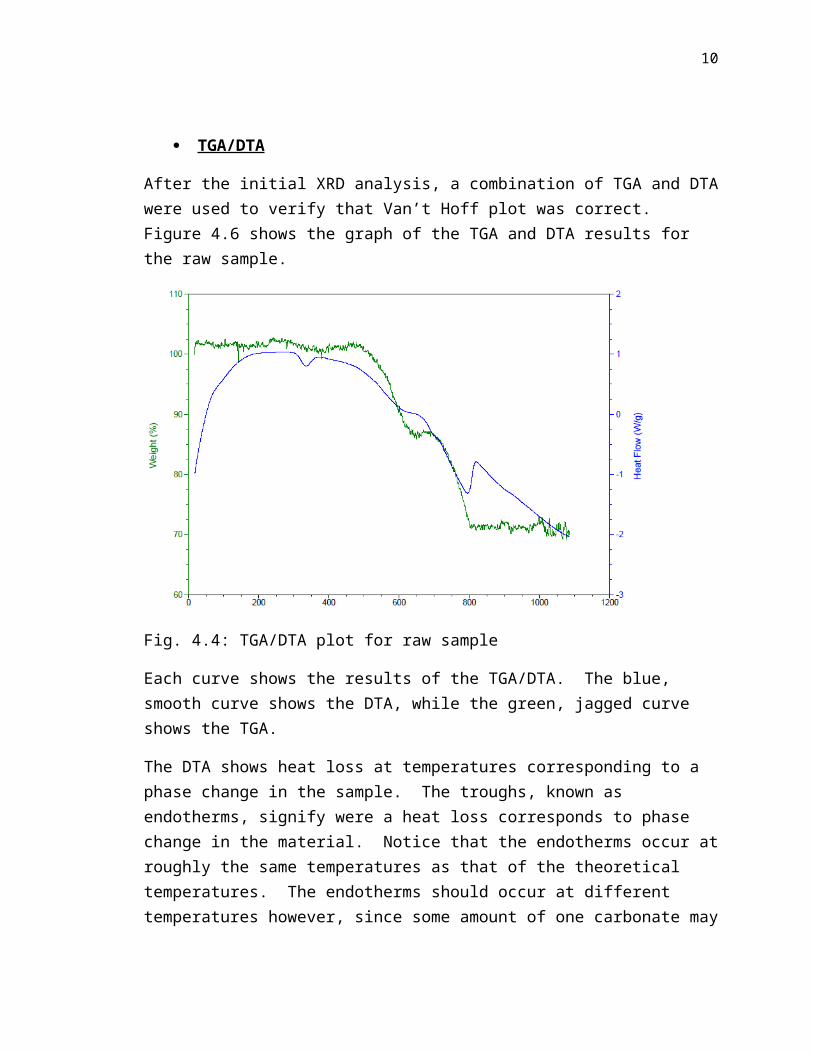
After the initial XRD analysis, a combination of TGA and DTAwere used to verify that Van’t Hoff plot was correct. Figure 4.6 shows the graph of the TGA and DTA results for the raw sample.
Fig. 4.4: TGA/DTA plot for raw sample
Each curve shows the results of the TGA/DTA. The blue, smooth curve shows the DTA, while the green, jagged curve shows the TGA.
The DTA shows heat loss at temperatures corresponding to a phase change in the sample. The troughs, known as endotherms, signify were a heat loss corresponds to phase change in the material. Notice that the endotherms occur atroughly the same temperatures as that of the theoretical temperatures. The endotherms should occur at different temperatures however, since some amount of one carbonate may

11
not decompose completely, thereby changing how much heat would theoretically be required for decomposition.
The TGA shows the mass percent loss of the sample during decomposition. Notice that each loss in mass corresponds with each endotherm. Also notice that weight losses for MgCO3 and CaCO3 are significantly larger than that of MnCO3. This could signify that the decomposition of MnCO3 is slowerat this temperature than at higher temperatures.
At the end of the ramp test for TGA/DTA weight loss is insignificant, with only a slight drop in mass towards the end of the test (about 900oC to 1100oC. The sample is stillabsorbing heat at this point of the test as well. Again, bycorrelating results from the TGA and DTA, it can be assumed that the sample may undergo further decomposition if the sample undergoes a longer residence time.
Calcination
The mass of each sample was recorded before and after calcination to determine how much mass had reported to the oxide and gas (CO2) phases during calcination. The following table shows the mass loss to CO2 off gas from eachreaction, as well as a noticeable phase change based on the color of the sample for each run.
Calcination InfoRun Temp (oC)
initial mass (g)
final mass (g) % loss
color change
1 377 1.387 1.356 2.2% n, red
2 610 3.945 3.465 12.2%y, black
3 948 1.137 0.778 31.6%y, black
Fig. 4.5: Calcination results
12
The results from each calcination test show that each mass loss was higher for each temperature. This shows that more material decomposed for each run, which coincides with the data received from the TGA, showing that at higher temperatures, more of the sample decomposes. Also note thatfor calcination of MnCO3 there was no color change, while there was a color change for the second and third calcination tests. This also shows that the amount of MnCO3
was also low in comparison to that of CaCO3 and MgCO3, in that the material had no significant changes in composition after calcination at this temperature, even though there wasa mass loss.
5. Findings and Recommendations
Using a combination of XRD, thermodynamic data, TGA, and DTA, it is possible to determine the composition and thermalbehavior of an unknown substance or mixture by using these methods in conjunction with one another. By using XRD to analyze the composition of the sample, a Van’t Hoff plot could be made using the appropriate thermochemical data for the substances believed to be in the sample. Accuracy of the diagram can then be confirmed using TGA and DTA to analyze how the sample behaves at the theoretical decomposition temperatures.
During XRD analysis, it was apparent that some mineral phases could be used to determine the composition of a sample. For instance, in the XRD report for the calcinationtest performed at 948oC, the phase bixbyite, Mn2
3+O3, 3 was
used to determine if an oxide of manganese had been formed during decomposition. This was useful in determining if themixture contained manganese, as the peak from the XRD of thecalcined sample showed evidence of the presence of manganeseoxide, which should be present after calcination of a manganese carbonate bearing compound, i.e. rhodochrosite.
13
From the pie chart for the low temperature calcination, it appears that the sample was predominantly composed of carbonates and not oxides. However, the data from the TGA/DTA shows that at temperatures near that of the theoretical decomposition temperature for that MnCO3, calcination may occur, but very slowly. The calcination experiment also shows that weight loss is insignificant until higher temperatures are reached. From this information, along with the lack of color change, it can be assumed that calcination for the sample will not occur at low temperatures.
For the calcination test at 948 oC, the amount of lime producedwas low. The sample was not low in calcium content, as the raw material contained about 50% dolomite. To explore how to optimize the formation of CaO, calcination tests for different time intervals should be performed on the same material, and analyzed using XRD to determine if longer residence times yield higher lime content in the calcine.
14
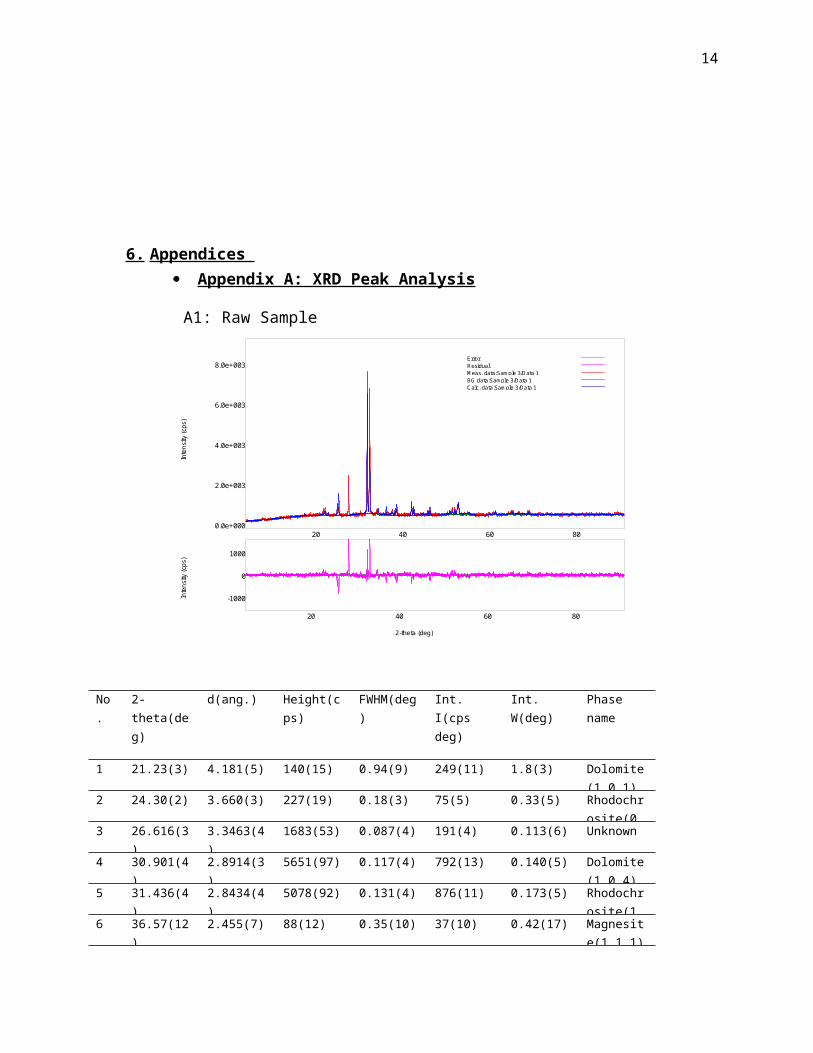
6. Appendices Appendix A: XRD Peak Analysis
A1: Raw Sample
20 40 60 80 0.0e+000
2.0e+003
4.0e+003
6.0e+003
8.0e+003
20 40 60 80
-1000
0
1000
Intensity (cps)
2-theta (deg)
ErrorResidualM eas. data:Sam ple 3/Data 1BG data:Sam ple 3/Data 1Calc. data:Sam ple 3/Data 1
Intensity (cps)
No.
2-theta(deg)
d(ang.) Height(cps)
FWHM(deg)
Int. I(cps deg)
Int. W(deg)
Phase name
1 21.23(3) 4.181(5) 140(15) 0.94(9) 249(11) 1.8(3) Dolomite(1,0,1),
2 24.30(2) 3.660(3) 227(19) 0.18(3) 75(5) 0.33(5) Rhodochrosite(0,
3 26.616(3)
3.3463(4)
1683(53) 0.087(4) 191(4) 0.113(6) Unknown
4 30.901(4)
2.8914(3)
5651(97) 0.117(4) 792(13) 0.140(5) Dolomite(1,0,4)
5 31.436(4)
2.8434(4)
5078(92) 0.131(4) 876(11) 0.173(5) Rhodochrosite(1,
6 36.57(12)
2.455(7) 88(12) 0.35(10) 37(10) 0.42(17) Magnesite(1,1,1)
15
7 41.07(2) 2.1957(10)
259(21) 0.16(2) 48(4) 0.18(3) Dolomite(1,1,-3)
8 41.54(2) 2.1720(12)
205(18) 0.17(3) 41(3) 0.20(3) Rhodochrosite(1,
9 50.11(2) 1.8188(7)
84(12) 0.21(8) 27(5) 0.32(10) Unknown
10 50.429(14)
1.8081(5)
335(24) 0.110(18)
59(5) 0.18(3) Dolomite(0,1,8)
11 50.999(12)
1.7892(4)
307(23) 0.143(14)
52(4) 0.17(3) Dolomite(1,1,-6)
12 51.603(17)
1.7697(5)
323(23) 0.20(3) 70(7) 0.22(4) Rhodochrosite(0,1,8)13 51.818(9
)1.7629(3)
422(27) 0.172(12)
79(7) 0.19(3) Rhodochrosite(1,
14 63.91(10) 1.455(2) 64(10) 1.8(3) 247(18) 3.9(9)
Rhodochrosite(1,0,10),Dolomite(1,2,-4),Magne
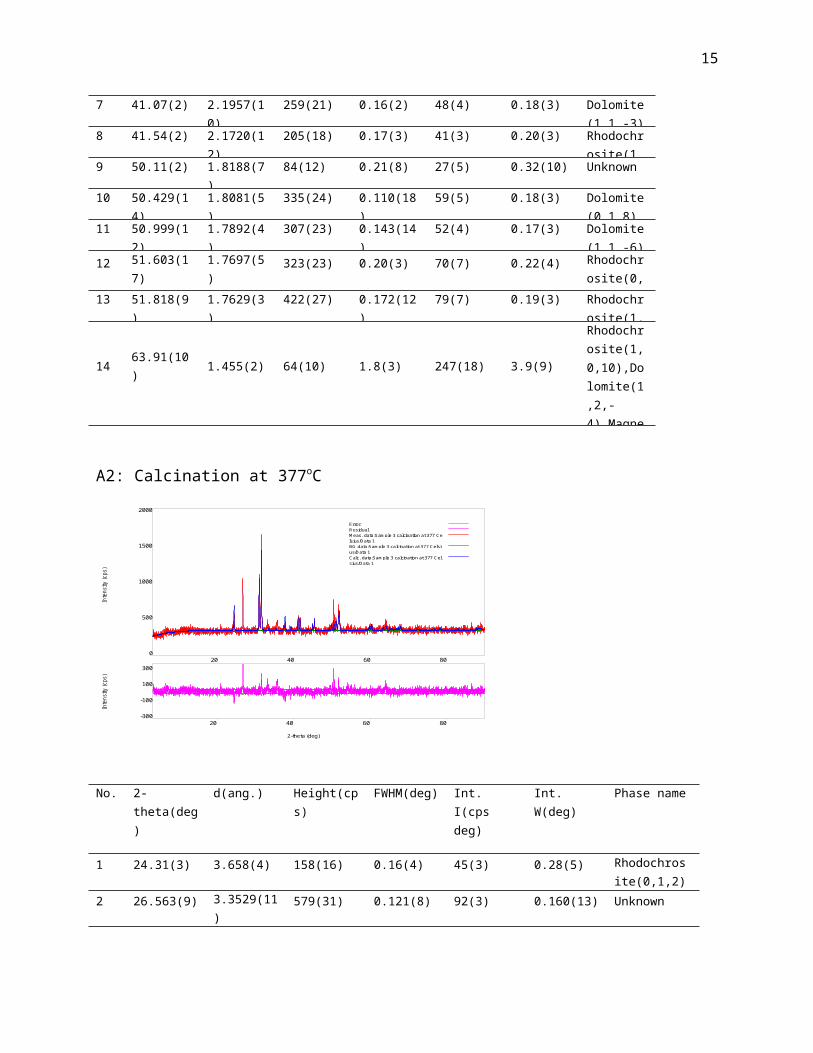
A2: Calcination at 377oC
20 40 60 80 0
500
1000
1500
2000
20 40 60 80 -300
-100
100
300
Intens
ity (c
ps)
2-theta (deg)
ErrorResidualM eas. data:Sam ple 3 calcination at 377 Celsius/Data 1BG data:Sam ple 3 calcination at 377 Celsius/Data 1Calc. data:Sam ple 3 calcination at 377 Celsius/Data 1
Intens
ity (c
ps)
No. 2-theta(deg)
d(ang.) Height(cps)
FWHM(deg) Int. I(cps deg)
Int. W(deg)
Phase name
1 24.31(3) 3.658(4) 158(16) 0.16(4) 45(3) 0.28(5) Rhodochrosite(0,1,2)
2 26.563(9) 3.3529(11)
579(31) 0.121(8) 92(3) 0.160(13) Unknown

16
3 30.885(10)
2.8928(9) 544(30) 0.166(10) 103(5) 0.19(2) Dolomite(1,0,4)
4 31.419(4) 2.8448(4) 1148(44) 0.110(6) 180(3) 0.157(9) Rhodochrosite(1,0,4)
5 35.3(4) 2.54(3) 20(6) 4.1(6) 92(10) 4.6(19)Rhodochrosite(0,0,6),Dolomite(0,0,6),mag6 40.93(4) 2.2030(18
)58(10) 0.80(11) 53(8) 0.9(3) Rhodochros
ite(1,1,3),Dolomite(7 50.08(4) 1.8199(12
)91(12) 0.09(5) 17(3) 0.19(6) Unknown
8 50.436(4) 1.80790(14)
416(26) 0.070(6) 42(3) 0.100(13) Dolomite(0,1,8),magnesite
9 50.978(8) 1.7899(3) 180(17) 0.078(15) 24(2) 0.13(2) Dolomite(1,1,-6)
10 51.605(9) 1.7696(3) 270(21) 0.107(16) 33(15) 0.12(6) Rhodochrosite(0,1,8)
11 51.85(5) 1.7619(17)
135(15) 0.29(14) 46(15) 0.34(14) Rhodochrosite(1,1,6)
12 64.01(3) 1.4534(6) 120(14) 0.16(5) 35(4) 0.29(6) Rhodochrosite(2,1,4)
A3: Calcination at 610oC
20 40 60 80 0
500
1000
1500
20 40 60 80
-200 -100 0 100 200
Intensity (c
ps)
2-theta (deg)
ErrorResidualM eas. data:Sam ple 3 Calcination at 610 Celsius/Data 1BG data:Sam ple 3 Calcination at 610 Celsius/Data 1Calc. data:Sam ple 3 Calcination at 610 Celsius/Data 1
Intensity (c
ps)
No. 2- d(ang.) Height(cps FWHM(deg) Int. I(cps Int. Phase name
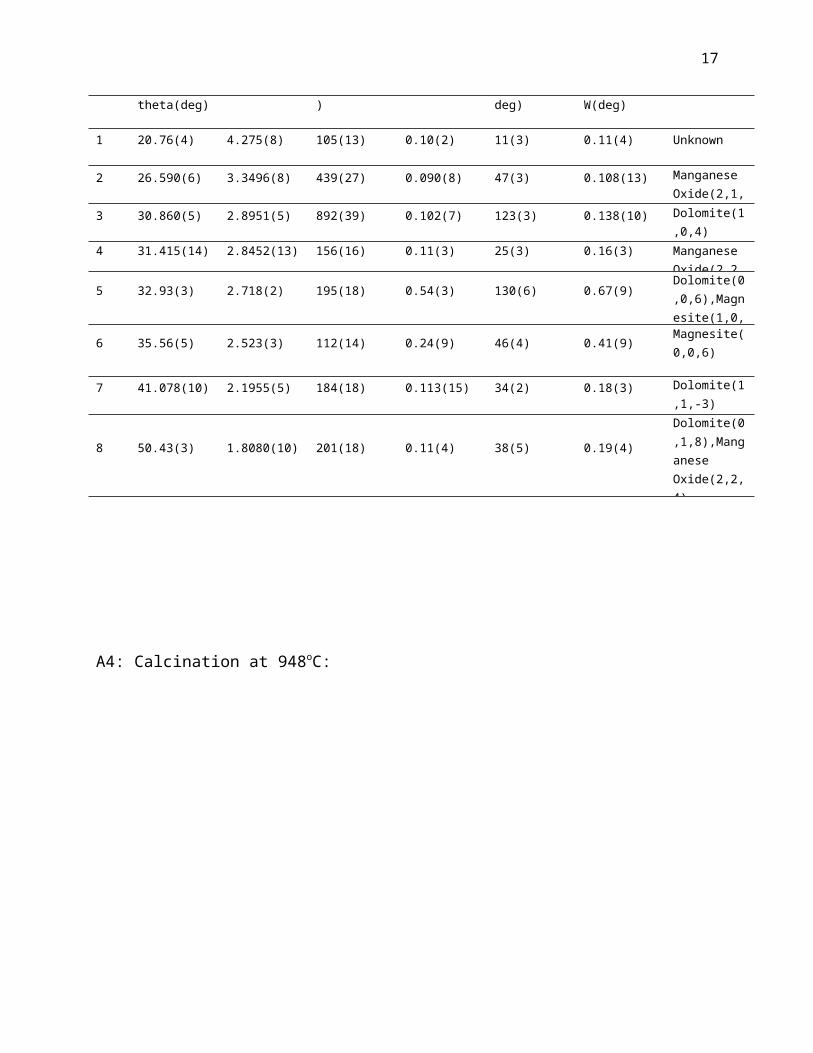
17
theta(deg) ) deg) W(deg)
1 20.76(4) 4.275(8) 105(13) 0.10(2) 11(3) 0.11(4) Unknown
2 26.590(6) 3.3496(8) 439(27) 0.090(8) 47(3) 0.108(13) Manganese Oxide(2,1,1)3 30.860(5) 2.8951(5) 892(39) 0.102(7) 123(3) 0.138(10) Dolomite(1,0,4)
4 31.415(14) 2.8452(13) 156(16) 0.11(3) 25(3) 0.16(3) Manganese Oxide(2,2,
5 32.93(3) 2.718(2) 195(18) 0.54(3) 130(6) 0.67(9)Dolomite(0,0,6),Magnesite(1,0,
6 35.56(5) 2.523(3) 112(14) 0.24(9) 46(4) 0.41(9) Magnesite(0,0,6)
7 41.078(10) 2.1955(5) 184(18) 0.113(15) 34(2) 0.18(3) Dolomite(1,1,-3)
8 50.43(3) 1.8080(10) 201(18) 0.11(4) 38(5) 0.19(4)
Dolomite(0,1,8),Manganese Oxide(2,2,4)
A4: Calcination at 948oC:

18
20 40 60 80 0
200
400
600
800
1000
20 40 60 80
-100
0
100
Intensity (c
ps)
2-theta (deg)
ErrorResidualM eas. data:Sam ple 3 Calcination at 948 Celsius/Data 1BG data:Sam ple 3 Calcination at 948 Celsius/Data 1Calc. data:Sam ple 3 Calcination at 948 Celsius/Data 1
Intensity (c
ps)
No.
2-theta(deg)
d(ang.) Height(cps)
FWHM(deg)
Int. I(cps deg)
Int. W(deg)
Phase name
1 26.569(12)
3.3521(14)
400(26) 0.121(11)
58(3) 0.145(18)
Unknown
2 32.959(16)
2.7154(13)
255(21) 0.36(4) 185(7) 0.72(8) Bixbyite, syn(2,2,3 35.53(4) 2.524(3) 102(13) 0.42(8) 81(6) 0.80(16) Bixbyite, syn(3,2,4 37.26(2) 2.4113(1
4)187(18) 0.17(3) 41(4) 0.22(4) Lime,
syn(2,0,0)5 38.24(3) 2.352(2) 65(10) 0.15(5) 16(3) 0.24(9) Bixbyite,
6 49.65(6) 1.835(2) 33(7) 1.01(15) 35(8) 1.1(5) Bixbyite,
7 53.78(6) 1.7031(17)
101(13) 0.38(9) 60(6) 0.59(14) Lime, syn(2,2,0)

19
Appendix B: Thermochemical Data for Species Involved at Various Temperatures3

20
7. References 1. Siblia, J.P., Reidinger, F., Sanjeeva, N.M., Correale,
S.T. (1988)X-Ray Analysis, A Guide to Materials Characterization and ChemicalAnalysis (pp. 115-118), VCH Publishers, Inc.
2. Siblia, J.P., Turi, E.A., Khanna, Y.P., Taylor, T.J.,(1988) Thermal Analysis, A Guide to Materials Characterization and Chemical Analysis (pp. 205-213), VCH Publishers, Inc.
3. Bixbyite, retrieved from www.mindat.org/min-691.html on December 13, 2014
4. Pankratz, L.B., Stuve, J.M., Gokcen, N.A., Thermodynamic Data for Mineral Technology, Bulletin 677, (pp.141-142, 266, 275), United States Department of the Interior, Bureau of Mines

21
Related Documents