Analysing retailers' buying behaviour and loyalty of branded edible groundnuts in the North West Province and Gauteng APL Lourens 12532169 Mini-dissertation submitted in partial fulfilment of the requirements for the degree Magister in Business Administration at the Potchefstroom Campus of the North-West University Supervisor: Prof R Janse van Rensburg May 2014

Welcome message from author
This document is posted to help you gain knowledge. Please leave a comment to let me know what you think about it! Share it to your friends and learn new things together.
Transcript

Analysing retailers' buying behaviour and loyalty of branded edible groundnuts in the North West Province and Gauteng
APL Lourens
12532169
Mini-dissertation submitted in partial fulfilment of the requirements for the degree Magister in Business
Administration at the Potchefstroom Campus of the North-West University
Supervisor: Prof R Janse van Rensburg May 2014

i
ABSTRACT
South Africa is an exporter of groundnuts (Arachis Hypogaea). The domestic market reaps
the spinoff advantage that export quality reaches store shelves, but unfortunately at a
price that is directly linked to the price traders achieve on the export market. The local
edible groundnut demand is relatively stable, but some processors saw a dramatic decline
in the demand for groundnuts within the fast moving consumer goods (FMCG) industry.
Businesses in the groundnut industry have a specific objective to create a turnaround
strategy for groundnut production in South Africa, in an attempt to increase exports of
locally produced groundnuts. This directly results that importance of the domestic market,
compared to the export market is secondary.
Since retail buyers are the “gatekeepers of consumer choice”, it is important to understand
buying behaviour and brand loyalty, as well as the factors that influence buyers’ decisions
in a business to business context. Limited literature exists for the domestic South African
that highlights or indicates specific buyer preferences towards branded edible groundnuts.
Furthermore, a general conceptual model to measure or to provide insight on retailer
buyer preferences and buying behaviour lack, or are generally unrelated.
An adapted model was used to analyse retail buyer behaviour, perceptions, and brand
loyalty influences and data was collected by means of a self administrered questionnaire.
Descriptive statistics as well as factor analysis were utilised to identify which factors
influence retail buyers’ purchase behaviour and loyalty towards an edible groundnut
brand. The Kaiser-Meyer-Olkin measure of sampling adequacy, Bartlett’s test of sphericity
and Cronbach Alpha was used to determine whether the collected data was appropriate
for factor analysis. Through the factor analysis the following ten factors were identified as
having a significant influence on retailers’ buying behaviour as well as brand loyalty
towards branded edible groundnuts:
Long-term relationship with a preferred brand.
Brand Loyalty.
Brand trust.
Brand performance.
Satisfaction.

ii
Intentional repurchase.
Brand affect.
Company reputation.
Involvement.
Value for money.
More research on this topic is required to develop a single conceptual model in order to
measure and analyse retail buyer behaviour and preference for a specific brand on a
larger scale within the FMCG industry.
Key terms: Groundnuts, retail, buyer behaviour, brand loyalty.

iii
ACKNOWLEDGMENTS
Aan my vrou, Arina en my seun, Fourie, Dankie vir al julle hulp en opofferings gedurende
die laaste 3 jaar van my studies. Julle geduld en ondersteuning was onmisbaar. Dit word
opreg waardeer.
To my supervisor, Prof. LR Janse van Rensburg, your flexible and accommodating
guidance is greatly valued.
iv
ABBREVIATIONS
B2B Business to Business
BFAB Bureau for Food and Agricultural Policy
FMCG Fast Moving Consumers Goods
GN Groundnuts
HB House Brands
KMO Kaiser-Meyer-Olkin
NDA National Department of Agriculture
ROI Return on investment
SPSS Inc. Statistical Package for the Social Sciences Incorporated
SSA Sub Sahara Africa
t/ha Ton per hectare
USA United States of America

v
TABLE OF CONTENTS
ABSTRACT i
ACKNOWLEDGMENTS iii
ABBREVIATIONS iv
LIST OF FIGURES viii
LIST OF TABLES ix
CHAPTER 1: AN INTRODUCTION OF GROUNDNUTS IN THE SOUTH
AFRICAN CONTEXT 1
1.1 INTRODUCTION 1
1.2 THE GROUNDNUT INDUSTRY IN SOUTH AFRICA 4
1.3 PROBLEM STATEMENT 6
1.4 GOAL OF THE STUDY 9
1.4.1 Goal 9
1.4.2 Objectives 9
1.5 RESEARCH METHODOLOGY 10
1.5.1 Literature study 10
1.5.2 Empiric survey 10
1.5.2.1 Research design and method of data collection 10
1.5.2.2 Development of the sample plan 11
1.5.2.3 Development of the questionnaire 11
1.5.2.4 Data analysis 12
1.6 CHAPTER CLASSIFICATION 12

vi
TABLE OF CONTENTS CONTINUED
CHAPTER 2: ANALYSING RETAILER’S BUYING BEHAVIOUR AND
LOYALTY OF BRANDED EDIBLE GROUNDNUTS 13
2.1 INTRODUCTION 13
2.2 BRANDED GROUNDNUTS IN THE RETAIL MARKET PLACE 13
2.3 BUSINESS BUYING BEHAVIOUR 14
2.4 BRAND IMAGE 22
2.5 COMPANY REPUTATION 24
2.6 LOYALTY 25
2.7 PERCEIVED PRODUCT ATTRIBUTES (QUALITY, PRICES AND COST) 26
2.8 SUMMARY 28
CHAPTER 3: RESEARCH METHODOLOGY AND RESULTS 30
3.1 INTRODUCTION 30
3.2 RESEARCH METHODOLOGY 30
3.3 STATISTICS 31
3.3.1 Kaiser Meyer Olkin measure of sampling adequacy 31
3.3.2 Bartlett’s test of sphericity 32
3.3.3 Factor analysis 32
3.3.4 Cronbach Alpha 33
3.4 RESULTS 33
3.4.1 Demographic profile 33
3.4.2 Descriptive statistics 35
3.4.2.1 Groundnut brand perceptions 35

vii
TABLE OF CONTENTS CONTINUED
3.4.2.2 Groundnut category performance 38
3.4.3 Buying behaviour mean values 39
3.4.3.1 Grand mean values per category 45
3.4.4 Sample adequacy and sphericity 46
3.4.5 Factor Analysis 46
3.4.6 Reliability 53
3.5 SUMMARY 56
CHAPTER 4: CONCLUSION AND RECOMMENDATIONS 58
4.1 INTRODUCTION 58
4.2 CONCLUSION 58
4.3 RECOMMENDATIONS 62
4.4 AREAS OF FUTURE RESEARCH 65
4.5 SUMMARY 66
REFERENCES 69
APPENDIX A 75

viii
LIST OF FIGURES
Figure 1.1: Global groundnut production and average yields. 1
Figure 1.2: Export market performance for the last 40 years. 2
Figure 1.3: South African consumption compared to production. 3
Figure 1.4: South African groundnut export volume history. 4
Figure 1.5: South African consumption breakdown. 5
Figure 1.6: Competition between groundnuts and soybeans in South Africa. 6
Figure 1.7: Market value chain for Groundnuts. 7
Figure 2.1: Howard-Sheth model of buyer behaviour. 15
Figure 2.2: A conceptual model between retailers’ perceptions of brands
and suppliers. 17
Figure 2.3: Key brand loyalty influences. 21
Figure 3.1: Position in the business of respondents. 33
Figure 3.2: Educational background of respondents. 34
Figure 3.3: Respondents Gender distribution per trading area. 35
Figure 3.4: Respondents preferred groundnut brands. 36
Figure 3.5: Respondents quality perception of groundnut brands. 37
Figure 3.6: Respondents groundnut category performance. 38
Figure 3.7: Average mean values, per measured category. 46
ix
LIST OF TABLES
Table 2.1: Factors retail buyers consider before purchase. 19
Table 2.2: Most important product attributes for food retail buyers. 26
Table 3.1: Brand Preference mean. 36
Table 3.2: Brand perceived quality mean. 37
Table 3.3: Validated Questions reliability per dimension. 38
Table 3.4: Mean values of all survey questions. 41
Table 3.5: Mean values higher than 3.5. 44
Table 3.6: KMO and Bartlett’s Test. 46
Table 3.7: Total Variance Explained. 47
Table 3.8: Component Pattern Matrix per question. 50
Table: 3.9: Reliability Statistics. 54
Table 3.10: Validated Questions per Dimension. 55
Table 3.11: Validated of 10 new factors. 56

1.1
Accord
(Arach
over 2
Averag
(t/ha) t
industr
Figure
Source
Figure
years.
increas
AN OVER
INTRODU
ding to the
is Hypoga
0 million h
ge yields h
to 1.7 t/ha
ry (Meyer,
e 1.1: Glob
e: Meyer an
1.1 illustr
Currently
sed perform
RVIEW OF
UCTION
e Bureau
ea) produc
hectares u
owever inc
, mainly du
Van Der B
bal ground
nd Van De
rates the s
the annua
mance, the
F GROUND
for Food
ction rema
under prod
creased si
ue to the d
Burgh, 2012
dnut produ
er Burgh (2
significant
al world gro
ere still see
CHAPTE
DNUTS IN
and Agr
ined relativ
duction ann
gnificantly
developme
2: 12).
uction and
2012: 11)
increase
oundnut pr
ems to be
ER 1
THE SOU
icultural P
vely consta
nually (Me
from 1990
ent and int
d average
in yield a
roduction i
insufficien
UTH AFRIC
Policy (BFA
ant during
eyer, Van
0 to 2011,
troduction
yields
and produc
s 34.96 m
nt stock wo
CAN CONT
AP), globa
2008 to 20
Der Burgh
from 1 ton
of new cu
ction over
million tons.
orldwide. P
TEXT
al groundn
012, with ju
h, 2012: 1
n per hecta
ultivars to t
the past
. Despite t
Pazderka a
1
nut
ust
0).
are
the
30
his
and

Emmot
market
Figure
Source
A dram
droppe
4% to g
policies
player
37% a
market
market
varietie
It is un
howeve
2010: 3
tt (2010: 3
t on edible
e 1.2: Expo
e: Pazderka
matic decl
ed from 77
global exp
s, and red
in product
nd 39% of
ts was ma
t economy
es with bet
nlikely that
er have re
3). Countri
3) are of th
groundnut
ort market
a & Emmo
ine occurr
% in the 1
orts. The s
duced mar
tion and w
f the mark
ainly drive
y, increas
tter techniq
t SSA will
emained st
ies like Nig
he opinion
ts up to the
t performa
ott (2010:3)
red over t
960’s to cu
sharp decl
rket pull (P
was the firs
et share, r
n by: “agr
ed inputs
ques” (Pazd
recapture
trong prod
geria, Sene
that Sub-
e late 1960
ance for th
).
the past f
urrent leve
ine was m
Pazderka &
st ranked e
respective
ricultural re
into grou
derka & Em
its domina
ucers for t
egal and G
Sahara Af
0’s as pres
he last 40
four decad
els where S
ainly drive
& Emmott:
exported d
ly. China’s
eforms in
undnut pro
mmott: 201
ance in th
the domes
Ghana, for
frica (SSA)
sented by F
years
des, as th
SSA is pres
en by low y
: 2010: 2).
uring the p
s rapid gro
the late 7
oduction,
10: 4).
e export m
stic market
instance,
) dominate
Figure 1.2.
e contribu
sently only
yields, qua
. China be
period 200
owth into th
70s, devel
and use
market; som
t (Pazderk
are amon
ed the exp
.
ution of SS
y contributi
lity, domes
ecame a k
01-2007, w
he groundn
lopment of
of improv
me countr
ka & Emmo
g the top t
2
port
SA
ing
stic
key
with
nut
f a
ved
ries
ott:
ten

global
importa
such a
produc
countri
deman
Figure
Source
Within
produc
1.3. Th
Norway
ground
problem
turn re
global
producers
ant food s
s China, In
cers, groun
es only ex
nd (Pazder
e 1.3: Sout
e: Meyer an
the South
ction prima
he main e
y and Ind
dnut export
ms which
esulted in t
market (M
s and occ
staple in m
ndia, and I
ndnuts pla
xport a sm
ka & Emm
th African
nd Van De
h African
arily exceed
export des
onesia. Fi
t market. O
had a neg
the curren
eyer & Van
cupy 12%
many hous
ndonesia,
ay an imp
mall amou
mott: 2010:
consump
er Burgh (2
context, t
ded domes
tinations i
gure 1.4
Over the la
ative impa
t opinion t
n Der Burg
of the m
seholds of
which are
portant ro
nt of prod
4).
ption comp
2012:18).
the countr
stic consu
nclude: Ja
provides a
ast two yea
act on the
that South
gh, 2012: 3
market as
these cou
ranked as
ole in hou
duction due
pared to p
ry remains
mption and
apan, the
a historica
ars, South
filling of e
h Africa is
30).
groundnu
untries. In
s the first, s
sehold co
e to stable
production
s an expo
d demand
Netherland
al overview
Africa exp
xciting exp
an unrelia
uts continu
many Asi
second an
onsumption
e and stro
n
orter of gr
as illustra
ds, Finlan
w of the S
perienced
port contra
able suppli
ue to be
ian countr
d fifth large
n and the
ong domes
roundnuts
ated in Figu
d, Germa
South Afric
some qua
acts, which
ier within t
3
an
ries
est
ese
stic
as
ure
ny,
can
ality
h in
the

Figure
Source
1.2
Within
ground
value a
1) Edib
peanut
2) Crus
3) Feed
Ground
and Fi
market
in the e
e 1.4: Sout
e: Meyer an
THE GRO
the dome
dnuts, com
added prod
ble ground
t sauce, pe
shed groun
d: Groundn
dnuts are p
igure 1.5
t. Accordin
edible mar
th African
nd Van De
OUNDNUT
estic South
mpared to t
duct with th
dnuts: Foo
eanut flowe
ndnut: Gro
nut oilcake
processed
provide a
ng to Scho
ket (49%),
groundnu
er Burgh (2
INDUSTR
h African m
the global
he main ca
od product
er and pea
undnut Oil
e
into a num
breakdow
oeman (20
followed b
ut export v
2012:20)
RY IN SOU
market, a
groundnut
ategories b
ct which in
anut milk.
l
mber of pro
wn of diffe
011: 68) th
by peanut
volume hi
TH AFRIC
relative sm
t industry.
being (NDA
nclude roa
oducts for
erent uses
e biggest p
butter (29%
story
CA
mall marke
The uses
A: 2008: 6)
sted grou
the domes
s within th
part of loca
%).
et exists fo
s vary from
:
ndnuts, pe
stic and ex
he local S
al product
or the use
m raw nuts
eanut butt
xport marke
South Afric
ion is utilis
4
of
s to
ter,
ets
can
sed

Figure
Source
Due to
export
mentio
ground
filters t
is direc
Within
industr
profitab
as an a
produc
Burgh,
ground
levels w
advant
(SAFEX
e 1.5: Sout
e: Meyer an
o high com
contract w
oned earlie
dnut indust
through to
ctly linked t
the South
ry (Figure
bility, the e
alternative
ced in typic
2012: 20)
dnut to so
which exc
tage of so
X), providi
th African
nd Van De
petition an
would rece
er, South A
try is expo
the South
to the price
h Africa, gr
1.6). Soy
ease of pro
rotational
cal product
. As Figure
ybean pro
ceed the h
oybeans is
ng the ind
consump
er Burgh (2
nd demand
eive priorit
Africa is a
ort focused
African do
e Traders a
roundnut p
bean prod
oduction a
crop, and
tion cycle w
e 1.6 also
oduction g
igh 1980 a
s that it t
dustry with
ption brea
2012:19).
d in the glo
ty over a
n exporter
d. The ove
omestic ma
achieve on
production
duction is
nd availab
as a legu
with summ
illustrates,
gained mo
areas prev
trades as
a transpa
kdown
obal marke
local cont
r of ground
rall spinoff
arket. Unfo
n the expor
is in direc
on the inc
ble improve
me it offer
mer crops s
1997 was
mentum a
viously use
a commo
rent forwa
et, a challe
tract (Scho
dnuts and
f advantag
ortunately
rt market.
ct competit
crease, m
ed technolo
rs similar ro
such as ma
the point w
and grew
ed for grou
odity on t
rd pricing
enging rea
oeman, 20
rightfully
ge is that e
it comes a
tion with t
ainly due
ogy. Soyb
otational b
aize (Meye
where the
significant
undnut pro
the Future
mechanism
lity is that
011: 69).
so, the lo
export qua
at a price th
he soybea
to a shift
eans is se
benefits wh
er & Van D
change fro
tly to curre
oduction. T
es Exchan
m, compar
5
an
As
cal
ality
hat
ans
in
een
hen
Der
om
ent
The
nge
red

to the
2012:2
Figure
Source
1.3
As illus
farmer
necess
a proc
either p
“There
crude
market
transpa
groundnu
21).
e 1.6: Com
e: Meyer an
PROBLEM
strated by
, and then
sary equipm
essor with
producing
is no sing
oil, grains
t price to o
arent price
t industry
mpetition b
nd Van De
M STATEM
the Groun
n shelled,
ment and f
hin the gro
peanut bu
gle price l
s, cocoa b
one specific
e determin
which lac
between gr
er Burgh (2
MENT
ndnut value
graded, a
facilities). T
oundnut sn
tter or roas
evel for gr
eans etc.
c reference
ation mec
cks such t
roundnuts
2012:21)
e chain (Fi
nd stored
The Trade
nack makin
sting the g
roundnuts,
It is there
e point” (M
hanism ex
transparen
s and soy
igure 1.7),
by a silo
er either ex
ng industr
roundnuts
, as there
efore very
Meyer & Va
xists, unce
cy (Meyer
beans in S
groundnu
owner or
xports the p
y. The pro
for the sna
is no stoc
y tricky to
n Der Burg
rtainty and
r and Van
South Afr
ts are prod
a trader (
product or
ocessor ad
ack indust
ck market
link the S
gh, 2012: 2
d a “signifi
n Der Burg
ica
duced by t
(that has t
r sells it off
dds value
ry.
for it like
South Afric
28). Since
ficant amou
6
gh,
the
the
f to
by
for
can
no
unt

of distr
Burgh,
Figure
Source
rust among
2012: 66)
e 1.7: Mark
e: NDA (20
gst individu
.
ket value c
012:28)
uals throug
chain for G
ghout the e
Groundnu
entire valu
uts
e chain” exxist. (Meye
er & Van D
7
Der

8
Volume and price contract negotiations take place on an individual basis between the
producer and trader, and this process is mainly negotiated with an export contract in
place, which the trader uses as a benchmark and leverage. In 2012 record high local
prices were seen for choice grade groundnuts. External conditions contributing to these
high prices were present mainly due to low international stock levels and availability
(Schoeman, 2011: 69). Lack of transparency within the groundnut value chain is making
contract price negotiations ever more difficult (Meyer & Van Der Burgh, 2012: 66).
The negotiated price between the trader and processor, will secure a base price and the
required volumes for the Processor. Subsequently the price will filter through to the retail
market and finally to the end user or consumer. Since the edible market carries the most
weight in terms of the supply breakdown and distribution (Figure 1.5), it also has relevance
to the end consumer. The local demand is relatively stable (Figure 1.3), but some
Processors saw a dramatic decline in the demand for its groundnut products in 2012
within the snack industry. Consumers within the local South African snack market,
reached a point where groundnuts were not on their shopping list anymore (Temple,
Steyn, Fourie & De Villiers, 2011: 57).
Van Schalkwyk (2003: 45) conducted a study to determine the demand relations of
oilseeds in South Africa. The price elasticity of groundnuts was the smallest in absolute
terms, indicating that groundnuts are the least sensitive to changes in its raw state price. A
possible explanation could be that very little of these products are used in their primary
form and it is mainly processed. Van Schalkwyk (2003: 49) determined that the price of
groundnuts is inelastic in its primary form and elastic in a processed state, indicating that
it’s significant effect on consumption and demand. As indicated by Schoeman (2011: 68),
edible groundnuts represent the largest portion of use distribution within the South African
market, demonstrating that the retail selling price could have a significant effect on
groundnut demand. Barda and Sardianou (2010: 138) analysed consumer’ activism in
response to rising prices and concluded that consumers are affected in various ways and
respond differently to price increases. By identifying consumer behaviour, it will be
possible to determine the effect on issues and challenges currently facing the South
African groundnut industry.

9
Limited information and literature is currently available for the determination of reasons
why local consumers buy groundnuts. As indicated, local consumption contributes the
largest portion of groundnuts uses, but there still is no clear indication of factors that drive
sales and demand for branded edible groundnuts within the local retail market. This study
will provide a better understanding of the behaviour that influences, and affects a buyer
when buying groundnuts.
1.4 GOAL OF THE STUDY
1.4.1 Goal
The goal of the study is identify factors that motivate formal or informal buyers to purchase
branded groundnuts for resale to consumers.
In order to achieve the presented goal, the following factors would be investigated to gain
a better understanding of the relevant buyer perception when buying groundnuts for resale
to a consumer:
1. Buyer repurchases intentions.
2. Buyer brand preference.
3. Buyer product attributes.
4. Quality.
5. Product offerings.
1.4.2 Objectives
Businesses in the groundnut industry such as the Protein Research Trust, the Groundnut
Forum and BFAP, have a specific objective to create a turnaround strategy for groundnut
production in South Africa. The main focus of the above mentioned businesses are to
increase exports of locally produced groundnuts. On the other hand, the domestic market,
and the effect of the export market on the South African groundnut consumer, is of lesser
importance (Schoeman, 2011: 68).
The objectives of this study were to determine the factors which are important South
African retail product buyers. No literature for the local South African market is available

10
that highlights or indicates specific buyer preferences in order to satisfy the local
consumer demand. The contribution of this study would be to highlight the importance of
the domestic market for edible groundnuts. It would also provide insight to the local buyer
preferences by investigating the effect of price, brand, quality and substitute product
offerings with in the snack market.
This in turn would provide an indication of how to procure, and offer a solution to the buyer
and consumer in such a way that it can benefit the groundnut industry as a whole, and add
to industry role players’ efforts to regain the presence of the South African groundnut
industry in the local market.
1.5 RESEARCH METHODOLOGY
1.5.1 Literature study
For this study, a literature review was conducted and secondary data from published
sources gathered and presented in an organised way to uncover the factors affecting
purchasing behaviour. Literature highlighting the purchase behaviour of retailers, traders
and wholesalers in branded groundnuts specifically is limited - the principles of other
consumer behaviour and purchasing behaviour studies was adapted to fit this study.
Sources include the Internet; and scientific databases such as EBSCO Host, JSTOR,
Science-Direct, and journal articles.
1.5.2 Empiric survey 1.5.2.1 Research design and method of data collection
Welman, Kruger and Mitchell (2010:2) stated that research is a process where scientific
knowledge is gathered by objective methods and procedures. There are various research
methods and techniques available as research tools, but research methodology considers
and explains the logic behind these methods and procedures (Welman et al. 2010:2).
Brynard and Hanekom, (1997:28) define research methodology as the methods of
collecting data, while Babbie and Mouton (2004:75) are of the opinion that it is the
research process and the kinds of tools and procedures used to conduct research. The
11
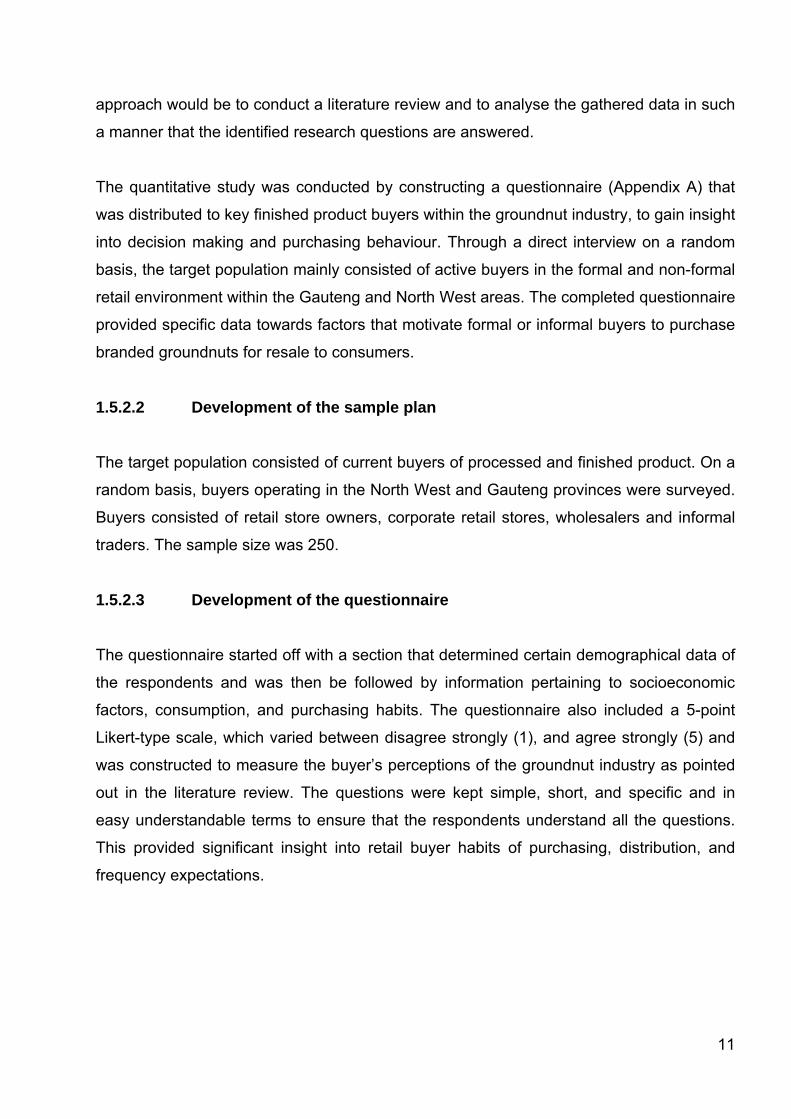
approach would be to conduct a literature review and to analyse the gathered data in such
a manner that the identified research questions are answered.
The quantitative study was conducted by constructing a questionnaire (Appendix A) that
was distributed to key finished product buyers within the groundnut industry, to gain insight
into decision making and purchasing behaviour. Through a direct interview on a random
basis, the target population mainly consisted of active buyers in the formal and non-formal
retail environment within the Gauteng and North West areas. The completed questionnaire
provided specific data towards factors that motivate formal or informal buyers to purchase
branded groundnuts for resale to consumers.
1.5.2.2 Development of the sample plan
The target population consisted of current buyers of processed and finished product. On a
random basis, buyers operating in the North West and Gauteng provinces were surveyed.
Buyers consisted of retail store owners, corporate retail stores, wholesalers and informal
traders. The sample size was 250.
1.5.2.3 Development of the questionnaire
The questionnaire started off with a section that determined certain demographical data of
the respondents and was then be followed by information pertaining to socioeconomic
factors, consumption, and purchasing habits. The questionnaire also included a 5-point
Likert-type scale, which varied between disagree strongly (1), and agree strongly (5) and
was constructed to measure the buyer’s perceptions of the groundnut industry as pointed
out in the literature review. The questions were kept simple, short, and specific and in
easy understandable terms to ensure that the respondents understand all the questions.
This provided significant insight into retail buyer habits of purchasing, distribution, and
frequency expectations.
12
1.5.2.4 Data analysis
The data was captured using Microsoft Excel-spread sheets and then submitted for
statistical analysis by Statistical Services based at the University of the North West
(Potchefstroom Campus). The following was determined:
Descriptive statistics (mean and standard deviation) was used to establish the relevant
baseline data.
Cronbach Alpha was used to test the reliability of the data.
The validity and reliability of the data was determined in order to give a level of stability,
consistency, replicability, and objectivity.
1.6 CHAPTER CLASSIFICATION
The chapters in this mini-dissertation are presented as follows:
Chapter 1: Provided the reader with the relevant background and perspective of the study.
It includes an introduction, background of the study, problem statement and objectives of
the study, and research methodology
Chapter 2: Comprises of a literature review of the factors that could possibly influence
retail buyer purchase behaviour and brand loyalty.
Chapter 3: The methodology utilised in this study is described and results from this study
are also highlighted.
Chapter 4: The conclusions drawn from the results obtained in Chapter 3 are discussed,
and relevant recommendations are also made during this chapter

13
CHAPTER 2
ANALYSING RETAILERS’ BUYING BEHAVIOUR AND LOYALTY OF BRANDED EDIBLE GROUNDNUTS.
2.1 INTRODUCTION
A literature review was conducted to determine the factors affecting purchasing behaviour
of retail buyers. Despite numerous attempts to construct comprehensive buying behaviour
theories, none is accepted as a single working model and to answer specific questions on
buying behaviour, the researchers have to rely on middle range theories (Horten, 1984:
25). This chapter will provide the reader with a background on branded groundnuts within
the current marketplace, as well as a conceptual buyer behaviour model, and an adapted
conceptual model to analyse retailer’s buying behaviour and loyalty towards edible
branded groundnuts.
2.2 BRANDED GROUNDNUTS IN THE RETAIL MARKETPLACE
The fast moving consumer goods (FMCG) industry is one of the most “competition driven”
industries (Oraman, Azabagaoglu & Inan, 2011: 189). It generally consists of consumer
packaged products that are meant for daily consumption with a high return on investment
(ROI) and can be divided into one of the following categories: food and beverages,
consumer durables, personal care, sports goods, apparel, household goods, luxury
brands, or textiles (Oraman et al., 2011: 188). Bawa and Sidhu, (2003: 5322) state that
snack foods are a substantial part of the food industry. The leading category is potato
chips, tailed by extruded snacks, corn chips, nuts, meat snacks, pretzels, and popcorn.
There is not a definite definition for the term ‘snack’ or ‘snack food’. It can relate to
anything from a small meal in the broadest sense that allow easy-to-handle consumption
that need little or no preparation and are intended to immediately satisfy occasional
hunger (Bawa & Sidhu, 2003: 5322).
A study by Wangchroen, Ngarmsak and Wilkinson (2005: 1) found that 66% of
respondents purchased snacks in supermarkets, 46 % at larger retailers, 30% at informal
markets, 18% at convenience stores and lastly 13% at hawkers. Within the FMCG
environment and snack industry, nut-based snacks consist of roasted groundnuts, fried

14
groundnuts, coated and fried groundnuts, toasted and salted pecans, roasted and salted
almonds, sugared and spiced nuts, flavoured nuts and nut mixtures (Bawa & Sidhu, 2003:
5322). He, Fectcher and Rimal (2005: 85) found that despite the significant role
groundnuts play within the snack food market, there is a definite decline in demand and a
better understanding of the factors affecting demand is necessary.
2.3 BUSINESS BUYING BEHAVIOUR Within the literature a number of conceptual buying behaviour models exist: The
Andreason model, Nicosia, Howard and Sheth, Howard, Engel-Kollat-Blackwell, Engel-
Blackwell-Miniard, Task and Nontask orientated, Webster and Wind, Sheth, and Choffray
and Lilien are just a few (Du Plessis, Rousseau & Blem, 1995: 355). It should be stated
that literature focusing specifically on the purchasing behaviour of retailers, traders, and
wholesalers is limited, especially compared to the principles of consumer purchasing
behaviour (Skytte & Blunch, 2001: 133). In addition, Insch, Prentice and Knight (2011:
258) and Horten (1984: 393) highlights that limited attempts exist to rank factors or to
develop a specific model of the retail buyer’s decision making process with regards to
branded products, as this decision making generally takes place in a dynamic environment
and that buying methods vary both between and within businesses. Norton (1984: 392)
states that existing retail buyer behaviour models tend to be very complex due to the
larger business context in which it normally takes place.
Du Plessis et al. (1995: 357) state that buying behaviour models provide a basic
framework for the buying process and that it is difficult to prove it accurate, as data to
prove it exact is limited. However, Horten (1984: 392) highlights that significant similarities
between consumer and retail buyer behaviour exists. Du Plessis et al., (1995: 357)
describes the Howard-Sheth model (Figure 2.1) as a significant contributor to determine
consumer behaviour, while Norton (1984: 32) highlights its limitations. The model is
recognised as extensively tested as a comprehensive theory of buyer behaviour.
Despite criticism of being too complex to be of practical value, the Howard-Sheth model
(Figure 2.1) helps to explain the buyer decision making process and contribute to a better
understanding of buyer behaviour (Du Plessis et al., 1995: 357).

15
Figure 2.1: Howard-Sheth model of buyer behaviour
Source: Du Plessis, Rousseau and Blem (1995: 355).
Brown, Zablah, Bellenger, and Johnston (2011: 194) suggest that retail buying behaviour
is characterised by the tendency of buyers to rely on objective factors when choosing
between products and that potential influences, including a risk reduction purpose. Retail
buyers are considered to be the gatekeepers of consumer choice, and consumers are only
able to choose from a product range retail buyers have pre-purchased from suppliers or
manufacturers (Insch, et al., 2011: 257). Consumers play a significant role through their
food buying activity in shaping the retailer’s product offering, but the decision on what is
available for the consumers to purchase, remain with the retail buyer (Dawson, 2013:
339).
Glynn (2007: 64) also argue that literature has not generally considered the product
category role of manufacturer-retailer relationships involving specific brands; this is
particularly significant, taking into account that the brand marketing strategies of
manufacturers often involve ranging brands into particular categories in order to enhance
RIO for themselves as well as for retailers. Kotler and Armstrong (2012: 190) describe
retail buyer behaviour as the process where businesses acquire goods and services with
Intention
Attention Bias
Attitude
Overt Search
Stimulus ambiguity
Confidence
Brand Choice Motives
Satisfaction
Intention
Attitude
Attention
Brand
Purchase
Indicative: a. Quality b. Price c. Distinctiveness d. Service e. Availability
Symbolic: a. Quality b. Price c. Distinctiveness d. Service e. Availability
Social: a. Family b. Reference groups c. Social class
Inputs Stimulus display
Perceptual constructs
Learning constructs
Outputs

16
the main purpose to resell these purchased goods at a profit. Within the business buying
process, the business buyer decides which products have to be acquired; source it;
evaluate it; and selects a supplier as well as the relevant brand that should be offered to
the end consumer (Kotler & Armstrong, 2012: 190). The business-to-business (B2B)
marketer has to understand business markets, business buyer behaviour and consumer
markets. The manufacturer also has to satisfy retailer’ as well as the final consumer needs
and expectations (Kotler & Armstrong, 2012: 190).
Perreault and McCarthy (2006: 178) highlight that numerous marketing managers focus
on customers, who are not the end or final consumer. More purchases are made by
businesses and organisations, compared to the end customer and so these business or
business customers can be defined as any buyers who buy for the main purpose of
reselling to the end consumer (Kotler & Armstrong, 2012: 194). To differentiate from end
customers, businessl customers are referred to as either - business buyers, intermediate
buyers or industrial buyers, all of which operate in the B2B market (Perreault & McCarthy,
2006: 178). According to Hansen and Skytte (1998: 279) a conceptual model for retailer
buying behaviour appear to be scattered and relatively unrelated within the literature, but
in general retail buying behaviour is characterised by the following
Retailers are resellers of finished goods, but in addition also markets’ retail
experience to the consumer.
Retailer buyers have to generate revenue as well as control costs.
Retail buying decisions are guided by the marketing; logistical as well are
merchandising functions.
There are a limited number of suppliers to choose from.
There is an increase in House Brands (HB) where the retailer is directly involved in
product development, sales forecasting, and feasibility.
Sheth (1973: 56) states that industrial buyers often have to decide on factors other than
rational or realistic criteria and, that a retailer buyer behaves more like a consumer in what
he buys and more like a producer in how merchandise is purchased (Sheth, 1981: 181).
Such buyers could be referred to in a sense as ‘‘expert consumers’’ (Insch et al., 2011:
258) and their decisions are characterised by speed, informality and volume; depending
on the buyers’ experience (Doyle and Weinberg, 1973: 46). The buying process is

17
basically where buyers have to decide which products their business need, source it,
evaluate it, select an appropriate supplier or brand, and finally purchase the product
accordingly (Kotler & Armstrong, 2012: 194). However, Brown et al. (2011: 194) show that
brands perform an important role in business markets as a representation of quality, as
well as the expectation a customer has from a manufacturer or supplier. Should there be
no significant differences between the product offerings, accountability as well as the
economic factors drive or determines the final decision to purchase a product. Hence the
B2B buying process is influenced and determined by internal business, interpersonal,
individual, as well as external environmental factors (Kotler & Armstrong, 2012: 190).
There is increasing evidence suggesting that buying behaviour is influenced by brands in
the B2B context, in particular as a purchasing risk reducing tool (Brown et al., 2011: 194).
Kotler and Armstrong (2012: 195) states that business buyers are not only influenced by
economic factors, but personal factors also have an effect before an order is placed with a
manufacturer or supplier. When buyers have to make a decision between competing
products, business requirements and personal factors contributes and has an influence on
the final buying decision.
With the recent growth and expansion of large retailers, they gained power through
volume buying, but this success was largely based on suppliers’ successful branding
strategies in the market and strong brand names (Zboja & Voorhees, 2006: 381). This
increased trust and satisfaction in the market, and as illustrated by figure 2.2 a retailer’s
trust and satisfaction with a supplier has a direct effect on the retailer’s repurchase
intention of a specific supplier’s brand.
Figure 2.2: A conceptual model between retailers’ perceptions of brands and suppliers
Source: Adapted from Zboja and Voorhees (2006: 382).
Trust in the brand
Satisfaction with the brand
Satisfaction with the Supplier
Trust in the Supplier
Retailer’s Repurchase Intentions
+ +
+
+
+
+

18
Morgan and Hunt (1994: 23) explained that trust could only exist when one party has
confidence in another party’s consistent reliability and integrity. Glynn (2007: 55) also
found that a retailer’s assessment of a specific product brand’s performance depends on
the product category within the store environment, as well as satisfaction with the brand.
Within the retail environment, retailers provide manufactures a means to sell their products
to the end user effectively. Retailers however do attempt to change this and place an
increased importance on HB’s, resulting in consolidation into larger businesses, extending
outside traditional national boundaries and the employment of category management.
Manufacturers cannot rely much more on ‘trade leverage’ or brand loyalty and perceived
quality, as retailers increasingly support their own in-house brands (Glynn, 2007: 55).
It must be stated the trade leverage of manufactures brands represent a number of
benefits to the retailer. These benefits include pre-establish brand demand, retailer image
enhancement, commitment from the manufacturer, higher retailer margins, positive
customer relations, higher inventory turnover and lastly less associated costs (Glynn,
2007: 56; Perreault & McCarthy, 2006: 258). Dawson (2013: 340) argues that sales
growth is essential for retailer’s strategies and objectives in order to increase their
bargaining power over suppliers. To add, retailers follow a buying power model that allows
them to sell FMCG products to consumers, before the retailer is required to pay the
supplier or manufacturer. There are three core features to the retailer buying power model
(Dawson, 2013, 340):
Rapid inventory rotation to reduce the retailer’s period of ownership of the relevant
product.
Increased period between taking ownership of the items and settlement of
suppliers or manufactures.
Increasing the volume of sales to the end user.
The buyer power model guides the retailer’s decision on what to buy from suppliers, as
well as decisions for in-store merchandising practices that would maximise inventory
rotation, supplier payments, and potential retailer margin opportunities (Dawson, 2013:
341). Table 2.1 illustrates ten identified influences that retail buyers consider when making
a purchase form a particular manufacturer or supplier (Insch et al., 2011: 261).

19
Table 2.1: Factors retail buyers consider before purchase
Factor Description
Financial return What profit or margin could be achieved? Increasingly
competitive environment and price wars.
Marketing capabilities
(above the line)
Advertising and promotion capabilities – to create or
stimulate consumer demand.
Marketing capabilities
(below the line)
Marketing spend and merchandising capabilities – to
provide in store support, opening deals, and new product
launch support.
Fit Product range and in store variety – there is limited store
and shelf space available. Additional lines compete with
existing product ranges and lines that might be more
profitable.
Previous or current
successes
Sales success of similar products and ranges already in
other stores – will give merit to a supplier to use as
leverage to justify shelf space.
Price Maintaining competitiveness is important - price creates
consumer perceptions that could be positive or negative for
the retailer.
Supplier
characteristics
The supplier’s reputation, brand, experience, dedicated
sales members, logistical performance, size - all factors that
could lower costs, increase effectiveness, provide financial
assistance, and lower risk for the retailer.
Visual appearance The overall physical visual appearance of the product – an
appealing appearance influences the buyer’ decision
making as well as the consumers evaluation of the product.
Uniqueness Differentiation and uniqueness of the product offering -
leads to potential category growth and fill product offering
gaps that currently exists in the market place.
Health and Safety Regulations and traceability – all requirements should be
met in terms of health-, safety-, labelling regulation as well
as all relevant food safety accreditations.
Source: Insch et al. (2011: 261), Doyle and Weinberg (1973: 51).
20
Zboja and Voorhees (2006: 383) argue behavioural intentions are characterised by
repurchase intentions, loyalty, willingness to pay, word-of-mouth and lastly complaining.
According to Ericş, Ünal, Candan and Yildirim (2012: 1399), B2B repurchase intentions
are correlated with brand commitment, and a repeat purchase of a branded product could
be explained on the basis that the product is more profitable than the rest or that no other
brand is available.
Nelson, Jolly, Hinds, Donis, and Prophete (2005: 214) proved through a conjoint analysis
that price was the most important feature for consumers’ preferences for roasted
groundnut products. Ericş et al. (2012: 1403) concluded that trust, satisfaction and
affective commitment had the highest effect on reseller’ repurchase intention and that a
retailer is able to attract more consumer’s by aligning itself with popular known brands
(Zboja & Voorhees, 2006: 386). Cretu and Brodie (2007: 231) indicated that branding
attributes such as how well known the supplier or manufacturer is, as well as the general
reputation of the supplier contributes to the general loyalty towards specific supplier’s
brand.
Zboja and Voorhees (2006: 381) presented a conceptual model (Figure 2.1) of the
relationship between retailer’s perception of brands and suppliers, which would influence
the reseller’ repurchase intentions from the specific supplier. Furthermore buyer’
repurchase intentions and loyalty are similar in nature, and a direct link between
satisfaction, trust, repurchase intentions and loyalty is identified (Zboja and Voorhees,
2006: 383).
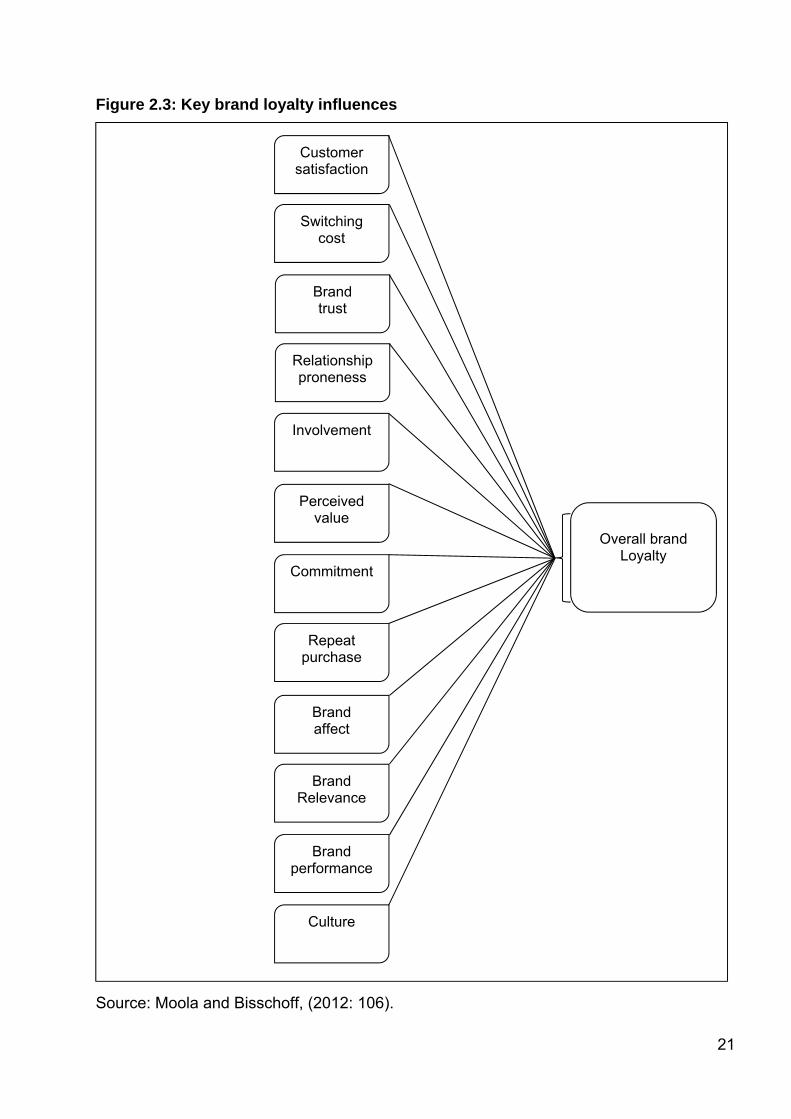
Goldsmith, Flynn, Goldsmith and Stacey (2010: 339) shows that marketers seek brand
loyalty for their brands to maintain consistent repurchasing behaviour on a long-term
basis. Moola and Bisschoff, (2012: 101) developed a conceptual model to measure brand
loyalty within the FMCG environment as illustrated by Figure 2.3.
21
Figure 2.3: Key brand loyalty influences
Source: Moola and Bisschoff, (2012: 106).
Customer satisfaction
Brand trust
Relationship proneness
Overall brand
Loyalty
Brand Relevance
Brand performance
Culture
Switching cost
Involvement
Perceived value
Commitment
Repeat purchase
Brand affect

22
2.4 BRAND IMAGE
Zboja and Voorhees (2006: 381) argue that few researchers have considered customer’s
perceptions and evaluations of a retailer, based on the brands the retailer offer to sell.
Specific brands serve as a competitive advantage for manufactures as well as for retailers
and a branded product can offer a tangible statement to the buyer (Jones & Kim, 2011: 1).
Brands are a source of risk mitigation for B2B buyers by means of a set of expectations
about the relevant product and its intrinsic value (Glynn, 2010: 1226). Within the B2B
setting, branding has a multifunctional approach which includes physical product
characteristics, brand image, company reputation, associated policies, support and
distribution services (Brown et al., 2011: 196). Through strong brands, manufactures are
able to create trade leverage when dealing with retailers (Glynn, 2007: 55). As strong
brands are a notable aspect of the retailer’s business performance, and determine how
retailers and manufactures approach the B2B relationship (Glynn, 2010: 1226).
As owners, manufactures or suppliers normally brand their products with a national brand
label; retailers, wholesalers or distributors offer HB, store brands or own private labels
(Dawes & Nenycz-Thiel, 2013: 60). HB follows a growing trend in and is outpacing the
growth of manufacture brands in Europe and well as the United States of America (USA).
Retailers also make use of HB’s to differentiate themselves from other brands by offering
value products that compete on price, as well as premium products that offer unique and
high quality attributes (Dawes & Nenycz-Thiel, 2013: 60). According to Kotler and
Armstrong (2012: 255) a brand identifies a manufacture of a product through a specific
name, sign, symbol, design or any combination of these, and it adds value to the product,
and stretches beyond the products physical attributes.
Zboja and Voorhees (2006: 386) explain that brand trust and satisfaction can have a
definite impact on retailer repurchase intentions, but only if the feelings of trust and
satisfactions the customer has, are positively portrayed onto the retailer. This implies that
repurchase would continue should the consumer be satisfied with the retailer and the
manufacturers’ product. Cretu and Brobie (2007: 230) found that a specific brand has an
influence on a consumers’ perception of a product, while a retailers’ reputation has an
influence on a consumers’ perception of value and loyalty.

23
Oliver (1997: 13) defines satisfaction as the pleasing level of consumption related
fulfilment, resulting from a product’s feature or the product itself. Furthermore Ericş et al.
(2012: 1399) describe satisfaction as the positive attitude that is established as a result of
evaluating a product after consumption, while Lombart and Louis (2012: 647) describe
satisfaction as a positive post choice evaluative judgment.
Glynn (2007: 64) suggests that retailer trust of the supplier is imperative for category
management realisation and that strong brands are purchased more frequently, have
greater loyalty, and have lower price elasticity (Glynn, 2010: 1227). Ericş et al., (2012:
1399) argue that a buyer’s satisfaction has a positive effect on brand commitment and
Glynn (2007: 57) points out that satisfaction is a strong predictor of loyalty as well as
repurchases intentions. Brand commitment is the enduring desire a buyer has to continue
a relationship with a brand, and is divided into affective and continuance (Ericş et al.,
2012: 1398):
Affective Commitment is typically the emotional connection a buyer has with a
specific brand, and is based on a strong sense of association and shared values
with the brand.
Continuance commitment refers to associated weak feelings with a buyer has to
a specific brand, and represents brand change due to high switching cost and
few available alternatives.
Jones and Kim (2011: 1) elaborate that branding elements establish product preference,
while brand preference is based on the selection of a specific brand over other brands
because of habit or favourable or satisfactory past experiences (Perreault & McCarthy,
2006: 257). Ericş et al. (2012: 1399) defines brand loyalty as the tendency to consistently
choose a specific brand among numerous brands in the same product group and
constantly purchase that specific brand. Buyers with brand loyalty are defined as those
who continually buy a specific brand and feel strong commitment towards the brand
(Jones & Kim, 2011: 3). Glynn (2007: 63) argues that brand equity in the market plays a
significant role in a buyer’s purchase decision, and that category management permits
retailers to manage brands to optimise overall category profit.

24
Zentes, Morschett, and Schramm-Klein (2011, 233) argues that globally, food retailers are
developing their own branded product ranges and that loyalty can more easily be built on
HB than on manufacturer brands. Retailer’s in-house brands have moved from being low
priced, low quality copies of manufacturer brands, to where around 40% of sales are
currently through retailer in-house branded products (Dawson, 2013: 343). According to
Glynn (2007: 64) retailer category groupings reflect consumer preferences, competing
brands, customer demand, and preference variations. Morgan, Kaleka and Gooner (2007:
514) suggest that a retailer’s relationship with a supplier, category related capabilities and
resources are key advantages for the relevant category’s performance and profitability.
Since consumers purchase branded groundnuts through a retailer and not through directly
through a manufacturer, there is a tendency to develop trust and preference in a specific
brand they purchase from the retailer (Zboja & Voorhees, 2006: 382).
2.5 COMPANY REPUTATION
Retailers must take note of consumer assessments regarding the brands they carry and
that it can influence end consumer perceptions of their stores. This implies that retailers
can increase customer satisfaction evaluations by carrying and offering strong brands
(Zboja & Voorhees, 2006: 386). Retailers worldwide are making a definite effort to align
themselves with high quality brands, in an attempt to differentiate, expand product range
and to shape the choice of consumer preferences (Dawson, 2013: 342). Cretu and Brodie
(2007: 230) point out that branding research generally focussed on consumer goods and
that only recently attention was placed on B2B markets, where a business’s reputation has
a strong influence on the buying behaviour. According to Berry (2000: 128) the retailer
becomes the brand, rather than the product and that the retailers’ reputation is likely to
have a significant influence on the buying process.
Brown et al., (2011: 194) highlight that B2B consist of tangible and intangible attributes:
the tangible includes the product, price, and the physical product specification; intangible
attributes include the company’s reputation as well as attainable services. Retailers can
benefit by offering established popular brands, enhance their image, build trust and
credibility with customers, and increase pre-establish demand (Zboja & Voorhees, 2006:
382). Dawson (2013: 343) explains that retailers increasingly make use of HB’s to gain
greater control over supply as well as in-store product ranges. This also results in more

25
direct product development and category management for the relevant retailer (Glynn,
2007: 63). Subsequently retailers have more direct control to preference HB product
offerings compared to manufactures brands. Dawes & Nenycz-Thiel, (2013: 64) found that
HB compete more intensely with other HB’s compared to manufactures brands, and also
that consumers will buy a HB regardless of the retailer. This implies that HB does not
create exceptional store loyalty for a retailer. Glynn (2010: 1227) argue that larger retailers
are able to sell a wider range of brands, while smaller resellers reduce their risk by
focusing on major or stronger brands.
2.6 LOYALTY Moola and Bisschoff, (2012: 102) indicate that the concept brand loyalty became a well-
researched topic since 1990, as it is cheaper and more convenient to retain an existing
market than to create a new one. Manternach (2010: 28) points out that loyal customer
will realise repeated purchases of a specific brand with minimal consideration of other
options. If well managed and well positioned in the mind of the consumer (Aaker 1996:
136), brand loyalty represents a strategic asset for a retailer (Aaker 1991: 43). Branding is
of significant importance in the retailing industry to influence consumer’s perceptions
about the specific retailer, store selection and increased loyalty towards the specific
retailer. It also identifies the associated products offered by the retailer and differentiates
the retailer from its competitors (Lombart & Louis, 2012: 644).
Zboja and Voorhees (2006: 382) explain that consumers have definite assessments of a
specific product brand, as well as for the retailer. Furthermore the consumer also fosters a
relationship with the retail outlet and the purchased brand. Retailers are in a position to
exploit and leverage the popular brands they carry and to create the perception, with
consumers, that they are likely to benefit by purchasing these brands at the specific
retailer. Stronger brands thus have a better chance of being accepted by the retail buyer
(Glynn, 2010: 1227). Hansen and Skytte (1998: 292) confirm that retailers are also more
willing to buy a product from an established supplier and furthermore showed nine
required factors that would foster cooperation between retailers and suppliers:
Maintained high quality standards and consistency.
Flexible responsiveness.

26
Joint product development.
Effective delivery systems.
Frequent contact.
Wide product range.
Physical product differentiation.
Strong brands.
Limited number of suppliers.
2.7 PERCEIVED PRODUCT ATTRIBUTES (QUALITY, PRICES AND COST) Lee and Resurreccion (2006: 877) indicate that market acceptance of roasted groundnuts
are characterised by overall appearance, aroma, flavour, colour, and texture. In addition, a
distinctive and intense nutty flavour, crunchiness, stale- / rancid- / oxidised favour and
shelf-life contribute to significantly too the overall quality of roasted groundnuts. Skytte and
Blunch (2001:134) consulted retail buyers as well as suppliers, and compiled a list of
relevant product attributes most important for retail buyers. Retail buyers are focusing on
more than the traditional marketing mix and are looking for more diverse attributes in order
to satisfy the requirements of their consumers, as illustrated by Table 2.2 (Skytte and
Blunch, 2001:144).
Table 2.2: Most important product attributes for food retail buyers Product attribute Description Product quality Product quality is consistent.
Traceability Product can be traced back throughout the value
chain.
Price Competitiveness.
Supply The suppliers are able to supply sufficient volume
according to demand.
Promotional activities The product is backed with sufficient in-store
promotions and advertising support.
Product range A broad product range should be available.
Long-term relationship A long term orientation is beneficial for the
manufacturer and the buyer.
Manufactures reputation Does the manufactures uphold a good reputation

27
within the broader market.
Footprint A buyer prefers to buy and support a local
manufactured product.
Source: Skytte and Blunch (2001:134).
Glynn (2010: 1227) showed that brands have to offer something distinctive in order to
maintain its competitive advantage over moderate or less known brands. Sethuraman and
Cole (1999: 342) found that consumers are willing to pay a premium price for a high
quality product or if a positive quality differentiation exists compared to other brands. A
premium price is the “maximum’ price consumers are willing to pay for a specific brand
relative to a competing brand as the proportionate differential (Sethuraman & Cole, 1999:
340). Retail buyers are well aware of consumer tastes and preferences, but the consumer
still has the ability to shape demand even within the constraint product offerings of the
retailer (Dawson, 2013: 345). He, Fletcher and Arbindra (2005: 79) argue that groundnuts
have lost market share in the snack industry due to increased competition from alternative
product snack offerings such as potato chips, popcorn, and pretzels.
In addition Nelson et al. (2005: 215) confirm that the expected market share of a potential
new groundnut product would be able capture the market at various price levels, and
concluded that a definite correlation exists between price increases and a declining market
share. He et al. (2005: 79) argues that consumers have unfound health risks perception of
groundnuts by indicating the benefit of unsaturated fat, which complimented a low-
carbohydrate diet. With the improvement of consumers knowledge regarding the
nutritional attributes associated with groundnuts, snack groundnuts could see a renewed
rise in demand (He et al., 2005: 80). Jekanowski, et al. (2000: 50) also highlighted that
consumers with higher education levels became more likely to differentiate products on
tangible quality characteristics and price, and are less susceptible to advertising and
branding initiatives. He et al. (2005: 80) conducted a study on snack groundnuts
consumption behaviour and type preference, and the respondents’ behaviour with regards
to groundnut consumption cumulated to:
82% consumes groundnuts at home
29% consumed groundnuts at someone else’s home
17% often consumes groundnuts at the workplace

28
61% drank a soft drink while eating groundnuts
14% drank beer while eating groundnuts
Less than 1% are consumed with breakfast
Less than 3% are consumed with lunch
Less than 3% with dinner
3 % are consumed during mid-morning
More than 35 % are consumed mid-afternoon
More than 49 % are consumed after-dinner
The preferred type is directly associated with the choices available, but consumers chose
groundnuts according to taste and personal preference. He et al. (2005: 80) illustrates that
consumer’s age, gender, ethnic status, and education influence consumers tastes and
preferences.
2.8 SUMMARY A literature review was conducted to determine the factors affecting purchasing behaviour
of retail buyers, but a single general conceptual model to measure retailer buying
behaviour is lacking and is unrelated. Retail buyers are the “gatekeepers of consumer
choice” and consumers can only choose from a product range a retailer has on shelf.
Buying behaviour as well as the factors that influence buyer’s decisions was described in
a B2B context.
A conceptual model for buyer behaviour, consumer’s perceptions of brands and retailers
as well as a key brand loyalty influences model was illustrated. Manufactures are able to
create trade leverage when dealing with retailers and these brands determine how
retailers and manufactures approach their B2B relationships. It was also illustrated how
the reputation of the retailer can have a strong influence on the buying behaviour, as the
retailer rather than the product becomes the brand in the long run.
Branding is of significant importance in the retailing industry to influence consumer’s
perceptions about the specific retailer, store selection and increased loyalty towards the
retailer and brand. Lastly a list of product attributes most important to the retailers was
discussed and a list of consumption habits was highlighted. In the next chapter the data

29
gathered by means of an adapted research instrument developed by Moola and Bisschoff
(2012: 106) will be discussed.
30
CHAPTER 3
RESEARCH METHODOLOGY AND RESULTS
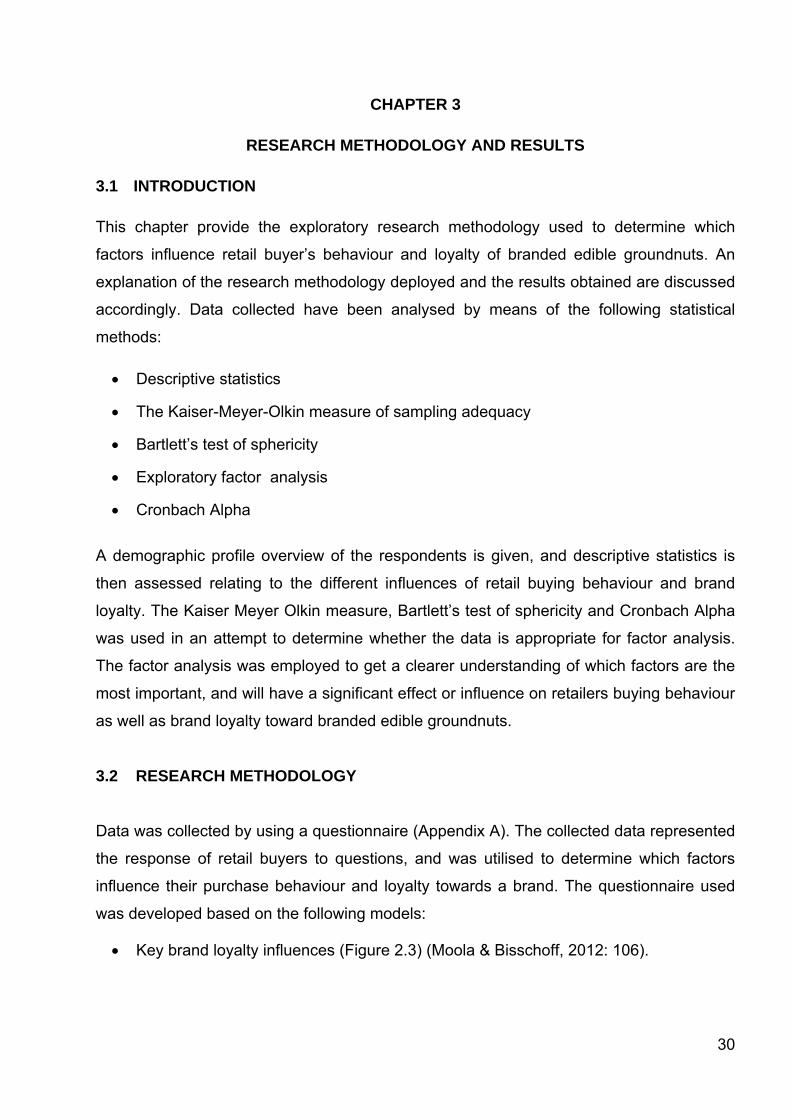
3.1 INTRODUCTION
This chapter provide the exploratory research methodology used to determine which
factors influence retail buyer’s behaviour and loyalty of branded edible groundnuts. An
explanation of the research methodology deployed and the results obtained are discussed
accordingly. Data collected have been analysed by means of the following statistical
methods:
Descriptive statistics
The Kaiser-Meyer-Olkin measure of sampling adequacy
Bartlett’s test of sphericity
Exploratory factor analysis
Cronbach Alpha
A demographic profile overview of the respondents is given, and descriptive statistics is
then assessed relating to the different influences of retail buying behaviour and brand
loyalty. The Kaiser Meyer Olkin measure, Bartlett’s test of sphericity and Cronbach Alpha
was used in an attempt to determine whether the data is appropriate for factor analysis.
The factor analysis was employed to get a clearer understanding of which factors are the
most important, and will have a significant effect or influence on retailers buying behaviour
as well as brand loyalty toward branded edible groundnuts.
3.2 RESEARCH METHODOLOGY
Data was collected by using a questionnaire (Appendix A). The collected data represented
the response of retail buyers to questions, and was utilised to determine which factors
influence their purchase behaviour and loyalty towards a brand. The questionnaire used
was developed based on the following models:
Key brand loyalty influences (Figure 2.3) (Moola & Bisschoff, 2012: 106).

31
Howard-Sheth model of buyer behaviour (Figure 2.1) (Du Plessis, Rousseau &
Blem, 1995: 355).
A conceptual model between retailers’ perceptions of brands and suppliers (Figure
2.2) (Zboja & Voorhees, 2006: 382).
Factors retail buyers consider before buying (Table 2.1) (Insch et al., 2011: 261;
Doyle and Weinberg, 1973: 51).
Product attributes most important for food retail buyers (Table 2:1) (Skytte and
Blunch, 2001:134)
The sample consisted of buyers of branded groundnuts within the Gauteng and North-
West provinces’. A total of 250 questionnaires were distributed and 143 questionnaires
were completed. This realised in a 58% response yield rate. All questionnaires were
distributed through a distribution company delivering a range of snacks to various retailers
in both the North West and Gauteng provinces.
3.3 STATISTICS
The Statistical Package for the Social Sciences Incorporated (SPSS Inc), version 21, was
employed to statistically analyse collected data. The following statistical applications were
used to analyse and validate the data:
3.3.1 Kaiser Meyer Olkin measure of sampling adequacy
The Kaiser-Meyer-Olkin (KMO) measure of sampling adequacy was deployed to
determine whether the samples used were satisfactory. The KMO measure of sampling
adequacy returns a value of between 0 and 1 of the fraction of variance between the
variables (Darlington 2004:13). According to Field (2009: 647), a value near to 1 indicates
that patterns of correlations are relatively close and that the factor analysis should yield
distinctive and reliable factors. Values between:
0.5 and 0.7 are regarded as average, and
values between 0.7 and 0.8 are regarded as good,
values between 0.8 and 0.9 are excellent, and

32
values above 0.9 are outstanding
Field (2009: 647) states that values of the KMO that measure closer to 1.0 indicates that
factor analysis may be performed and that a higher value will ultimately result in more
reliable factor analysis of the sample. Field (2009: 659) also states that a larger measure
of sample adequacy will result in better data analysis and furthermore, should the KMO
measure of sample adequacy be less than 0.5, the data is not acceptable for factor
analysis purposes.
3.3.2 Bartlett’s test of sphericity
The Bartlett test of sphericity is a statistical test that is associated with factor analysis and
it examines the hypothesis that the variables in the population are uncorrelated. It is an
indicator of the strength of the relationship among variables, and is also an indicator of
whether the data is suitable for factor analysis (Field 2009: 782). In other words, the
Bartlett test of sphericity tests the null hypothesis. Thus each variable correlates with itself
(r = 1) but has no correlation to other variables (r = 0). A significance level of 0.0000 is
small enough to reject the hypothesis and it can be concluded that the strength of the
relationship among variables is strong, this justify that the data could be employed to
factor analysis (Field, 2009: 660).
3.3.3 Factor analysis
Factor analysis could be described as a collection of methods examining how underlying
constructs influence the responses on a number of measured variables, and could be
defined as a process that test whether a specified set of constructs influence responses in
a predicted way (DeCoster, 1998: 1). According to Field (2009: 673) exploratory factor
analysis with factor loadings of ≥0.4 could be considered to validate the items that
measure each of determined factor constructs, and that a cumulative variance of ≥60%
could be regarded as a good fit of the data.

33
3.3.4 Cronbach Alpha
Peterson (1994: 381) defines reliability as the degree to which measures are free from
error and yield consistent results. Peterson also states that for a scale to be valid and
practical, it must be reliable. Cronbach Alpha was utilised to determine the reliability of
each of the buying behaviour and brand loyalty influences from the data. Field (2009: 668)
states that the reliability is regarded to be satisfactory when the Alpha coefficient is ≥0.70.
Cortina (1993: 102) indicate that for exploratory research, levels of ≤.58 can still be
regarded as acceptable. It should be noted however that the results of repeated studies
might differ at these low levels.
3.4 RESULTS 3.4.1 Demographic profile
The demographic profile of the respondents who are actually responsible for purchasing
edible groundnuts includes gender, store type, position in the business, educational
background, and the current trading area. More males 83 (58%), compared to female 60
(42%) participated in the survey. 77 (54%) of the respondents are employed within a
corporate retail chain, and 66 (46%) are employed within an independent retail chain
(Figure 3.1).
Figure 3.1: Position in the business of respondents
12%
48%
23%
14%
1%3%
45%
27%
5%
20%
0%
10%
20%
30%
40%
50%
60%
Apprentice Middle manager Senior manager Owner other
Male
Female
Position in the business

34
Of the respondents, majority are currently employed as middle or senior managers in their
respective businesses. It is interesting to note that when compared to females, 28% more
males are employed as apprentice’s, 3% more as middle managers and that 9% more
own their own businesses. Compared to males, there are 4% more females employed as
senior and 19% more females operate in other types of FMCG businesses (Figure 3.1).
The education profile of the sample indicated that compared to females, 24% more males
have a degree and 1% actually had no formal qualification. Compared to males, females
have 10% more high school and 1% more diploma qualifications (Figure 3.2).
Figure 3.2: Educational background of respondents
The survey was conducted within the trading areas of two provinces. From the North West
46 (32%) questionnaire were completed and from Gauteng, 97 (68%). There were 47%
more males in the North West and 17% more in the Gauteng province, compared to
females (Figure 3.3).
52%
31% 31%
0% 1%
62%
32%
7%
0% 0%0%
10%
20%
30%
40%
50%
60%
70%
High School Diploma Degree Higher degree None
Male
Female
Educational background

35
Figure 3.3: Respondents Gender distribution per trading area
3.4.2 Descriptive Statistics 3.4.2.1 Groundnut brand perceptions
In order to better understand retail buyer brand perceptions with regards to groundnuts
that is currently available in the market; the key brands represented in the majority of retail
chains was identified and given to respondents as an option to choose from as a preferred
brand as well as a perceived quality offering. The survey was based on a 5-point Likert
scale and the results are presented in Table 3.1 and Table 3.2. The reliability of the data
was also determined by employing the coefficient of Cronbach Alpha (Table 3.3).
Table 3.1 provides the results from the survey in an attempt to indicate which current
brand respondents would prefer to purchase and offer for resale. There is a significant
preference towards Simba and Safari. Simba is marginally ahead of Safari, but both
brands are the preferred choice compared other brand offerings (Figure 3.4). It is also
21%
37%
11%
31%
0%
5%
10%
15%
20%
25%
30%
35%
40%
North West Gauteng
Gender distribution
Male
Female

36
noteworthy that only 24 respondents included “other” brands, and still did not regard them
as a preferred choice. “Other” brands also had the lowest mean, indicating that new
entrants have to compete with the two leading brands, and that the current formal retail
environment is very competitive.
Table 3.1: Brand Preference mean
Code Brand name N Min Max Mean Standard Deviation
BP 1 Champ 142 1 3 2.105 .721
BP 1 House Brand 143 1 4 2.335 .701
BP 3 Messaris 142 1 4 2.5 .702
BP 4 Safari 143 2 5 4.118 .707
BP 5 Simba 143 2 5 4.398 .618
BP 6 Snack Factory 143 1 3 2.209 .626
BP 7 Other Brand 24 1 3 1.75 .793
Figure 3.4: Respondents preferred groundnut brands
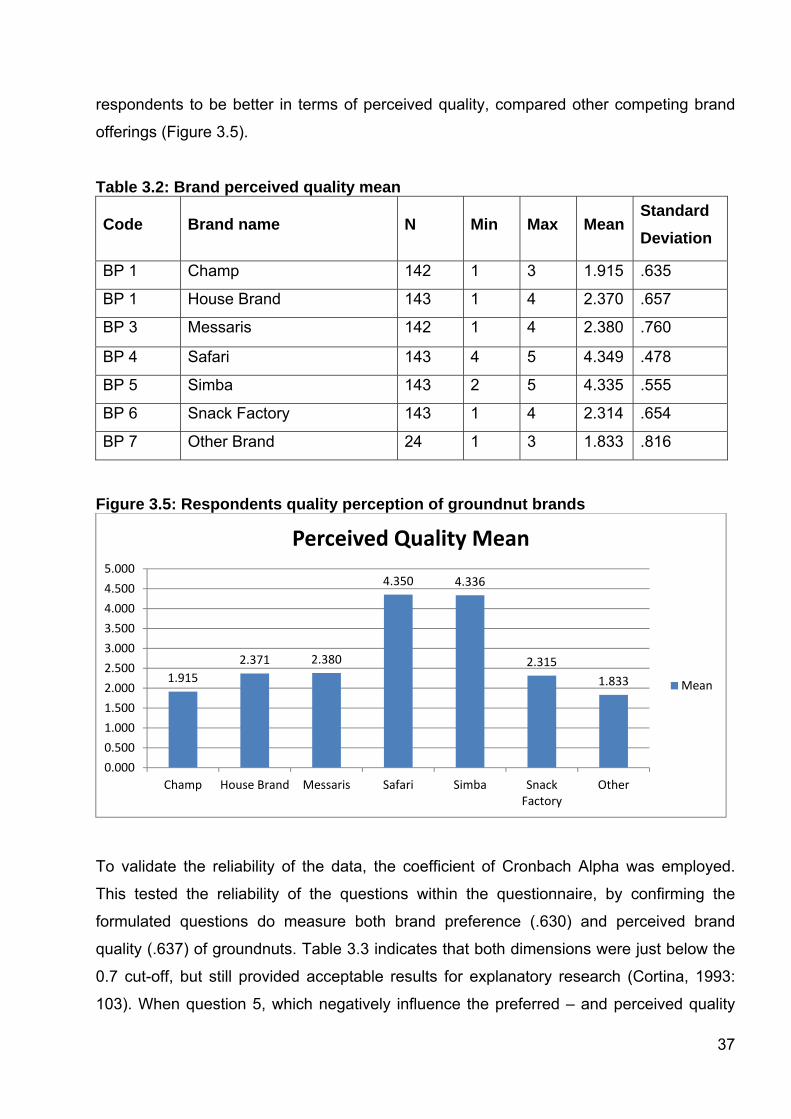
Table 3.2 illustrates the survey results of which current groundnut brand is currently
regarded by the respondents as a better quality product. There is also significant
preference towards Simba and Safari. Safari seems to be marginally ahead of Simba, but
similar as with the aforementioned brand preference, both brands are highlighted by
2.1062.336 2.500
4.1194.399
2.2101.750
0.000
0.500
1.000
1.500
2.000
2.500
3.000
3.500
4.000
4.500
5.000
Champ House Brand Messaris Safari Simba SnackFactory
Other
Preferred Brand Mean
Mean
37
respondents to be better in terms of perceived quality, compared other competing brand
offerings (Figure 3.5).
Table 3.2: Brand perceived quality mean
Code Brand name N Min Max Mean Standard Deviation
BP 1 Champ 142 1 3 1.915 .635
BP 1 House Brand 143 1 4 2.370 .657
BP 3 Messaris 142 1 4 2.380 .760
BP 4 Safari 143 4 5 4.349 .478
BP 5 Simba 143 2 5 4.335 .555
BP 6 Snack Factory 143 1 4 2.314 .654
BP 7 Other Brand 24 1 3 1.833 .816
Figure 3.5: Respondents quality perception of groundnut brands
To validate the reliability of the data, the coefficient of Cronbach Alpha was employed.
This tested the reliability of the questions within the questionnaire, by confirming the
formulated questions do measure both brand preference (.630) and perceived brand
quality (.637) of groundnuts. Table 3.3 indicates that both dimensions were just below the
0.7 cut-off, but still provided acceptable results for explanatory research (Cortina, 1993:
103). When question 5, which negatively influence the preferred – and perceived quality
1.9152.371 2.380
4.350 4.336
2.3151.833
0.0000.5001.0001.5002.0002.5003.0003.5004.0004.5005.000
Champ House Brand Messaris Safari Simba SnackFactory
Other
Perceived Quality Mean
Mean

38
brands is deleted, the results increase to a much more satisfactory level of .705 (Preferred
brand) and .694 (Perceived quality). It can be concluded the data is reliable and that the
questions posed in the questionnaire are valid.
Table 3.3: Validated Questions reliability per dimension
Dimension Cronbach Alpha Questions Validated
Cronbach Alpha (after deleting
questions)
Preferred Brand .630 1,2,3,4,(5),6,7 .706
Perceived Brand
Quality
.637 1,2,3,4,(5),6,7 .694
3.4.2.2 Groundnut category performance As illustrated by Figure 3.6, 55% of respondents indicated that their current groundnut
category is not growing in turnover and, 51% indicated that their groundnut category is not
growing in volume. Respondents also confirmed that should there be a wider range of
product offerings available, 59% would buy more. This pose an opportunity for
manufactures and suppliers of groundnuts, as 60% of respondents regards groundnuts as
an important product in their stores.
Figure 3.6: Respondents groundnut category performance
45% 49%
59% 60%55% 51%
41% 40%
0%
10%
20%
30%
40%
50%
60%
70%
Is your groundnutcategory growing in
turnover?
Is your groundnutcategory growing in
volume?
Do you want toincrease your product
range?
Are groundnuts an important product for you to have on your
store’ shelve?
YesNo
Groundnut category Performance

39
3.4.3 Buying behaviour mean values
The mean values of all questions posed in the questionnaire, are illustrated in table 3.4.
Field (2009: 35) showed that mean values could be interpreted as follows:
Less than 3 can be regarded as unacceptable
Between 3 and 3.5 can be regarded as acceptable
More than 3.5 can be regarded as very satisfactory
Table 3.5 highlights all factors that measured mean values of 3.5 and higher. As indicated,
a mean value of 3.5 and higher could be regarded as satisfactory. These factors could be
seen as having an effect on retail buying behaviour. The factors presented in Table 3.5
are important and subsequently could have an effect on retailer groundnut buying
behaviour as well a brand loyalty. An interpretation of the identified factors could be:
Retailers are generally satisfied with the groundnut brands they purchase.
Distinctive attributes keep retailers from buying more groundnuts.
A retailer will not repeat a purchase if they are dissatisfied with a particular groundnut
brand.
Prevailing economic conditions will make retailer to switch groundnut brands.
Retailers trust the groundnut brands they normally buy.
Retailers buy groundnut brands that show consistent high quality.
The reputation of a groundnut brand is a key factor for a retailer to continue buying it.
Retailers have a preference to maintain a long term relationship with a specific
groundnut supplier.
Continuous focus and communication is important for the retailer.
Greater involvement with a specific groundnut brand increases the retailer’s preference
towards that specific brand.
Perceived product quality is important for a retailer’ preference towards a groundnut
brand.
Price worthiness is a key influence when retailers buy a groundnut brand.
Purchased groundnut brands should enhance retailer’s reputation with their customers.
Retailers buy groundnut brands that portray freshness and positive significance.

40
Retailers prefer groundnut brands that are constantly updating, innovation and
improving to stay relevant in the market.
Retailers evaluate groundnut brands based on perceived performance in the category.
Should a better performing groundnut be available, the retailer will switch to that brand.
Retailers buy the top performing groundnut brand.
The company the retailer buys their groundnuts from must have a good reputation.
The company the retailer buys their groundnuts from must have a strong brand.
This is a very simplified interpretation based on the mean values, and a further more
advance analysis must be conducted to elaborate on retailers buying behaviour in general.

41
Table 3.4: Mean values of all survey questions
Measurement Category
Statement N Min Max MeanStandard
Deviation
Grand Mean
Customer I am satisfied with the GN brand I purchase. 143 2 3 4.125 .669
Satisfaction Distinctive GN attributes keep me buying more. 143 3 2 3.818 .774
I do not repeat a purchase if I am dissatisfied about a particular GN
brand.
143 5 5 3.944 .909 3.96
Switching I do not switch GN brands because of the high cost implications. 143 1 5 3.363 .923
Cost Risk I do not switch GN brands because of the effort required to find a
replacement.
143 1 5 2.965 .930
Aversion I avoid switching GN brands due to the risks involved. 143 1 5 2.538 .969
I switch GN brands according to the prevailing economic conditions. 143 2 5 3.748 .809 3.153
Brand I trust the GN brands which I purchase. 143 1 5 3.993 .899
Trust The GN brands I purchase have consistently high quality. 143 3 5 4.244 .571
The reputation of a GN brand is a key factor for me to continue buying
it.
143 2 5 4.286 .677 4.174
Relationship I prefer to maintain a long term relationship with a GN supplier. 143 3 5 4.349 .652
Proneness I maintain a relationship with a GN supplier that focuses and
communicates with me continuously.
143 2 5 3.552 .728 3.951
Involvement My preference towards a GN brand increases the more I am involved 143 2 5 3.503 .739

42
with it.
I consider other GN brands when my involvement with a particular
brand diminishes.
143 1 5 3.139 .835 3.321
Perceived My preference for a GN brand is based on product quality. 143 3 5 4.223 .665
Value Price worthiness is a key influence when I buy a GN brand. 143 2 5 4.265 .768
The GN brands that I purchase enhance my reputation with my
customers.
143 2 5 4.111 .661 4.200
Commitment I do not purchase/sample other GN brands if my preferred GN brand
is unavailable.
143 1 5 3.153 .898
I remain committed to a GN brand even through price increases. 143 1 5 2.769 .969
I remain committed to a GN brand even through declining popularity. 143 1 5 2.979 .907 2.967
Repeat I do not necessarily purchase the same GN brand all the time. 143 1 5 2.587 .973
Purchase I always sample new GN brands as soon as they are available. 143 2 5 2.888 .904
I establish a GN brand purchasing pattern and seldom deviate from it. 143 1 5 2.902 .874 2.792
Brand Affect I am distressed when I am unable to purchase a particular GN brand. 143 1 5 3.440 .924 3.440
Brand The GN brands that I purchase have freshness about them and
portray positive significance.
143 2 5 3.937 .724
Relevance My preferred GN brands are constantly updating, innovation and
improving so as to stay relevant in the market.
143 1 5 3.720 .867 3.828
Brand I evaluate a GN brand based on perceived performance in the
category.
143 2 5 3.678 .900
Performance I will switch GN brands should a better performing GN brand be 143 2 5 3.846 .771

43
available.
I only buy the top performing GN brand. 143 1 5 3.517 .894 3.680
Company The company I buy my GN brands from has a good reputation. 143 3 5 4.251 .598
Reputation The company I buy my GN brands from is a strong brand. 143 3 5 4.139 .576 4.195
Product I rather buy other snacks, because GN is too expensive. 143 1 5 3.111 1.163
Attribute All GN brands are the same quality. 143 1 5 2.818 1.032
I see whole groundnuts as better quality than split nuts. 143 1 5 3.279 .988
If there were more flavours, I would buy more. 143 1 5 3.027 1.100 3.059

44
Table 3.5: Mean values higher than 3.5 Measurement Category Statement Mean
Customer I am satisfied with the GN brand I purchase. 4.125
Satisfaction Distinctive GN attributes keep me buying more. 3.818
I do not repeat a purchase if I am dissatisfied about a particular GN brand. 3.944
Switching Cost Risk Aversion I switch GN brands according to the prevailing economic conditions. 3.748
Brand Trust I trust the GN brands which I purchase. 3.993
The GN brands I purchase have consistently high quality. 4.244
The reputation of a GN brand is a key factor for me to continue buying it. 4.286
Relationship I prefer to maintain a long term relationship with a GN supplier 4.349
Proneness I maintain a relationship with a GN supplier that focuses and communicates with me continuously. 3.552
Involvement My preference towards a GN brand increases the more I am involved with it. 3.503
Perceived My preference for a GN brand is based on product quality. 4.223
Value Price worthiness is a key influence when I buy a GN brand. 4.265
The GN brands that I purchase enhance my reputation with my customers. 4.111
Brand The GN brands that I purchase have a freshness about them and portray positive significance. 3.937
Relevance My preferred GN brands are constantly updating, innovation and improving so as to stay relevant in the
market.
3.720
Brand I evaluate a GN brand based on perceived performance in the category. 3.678
Performance I will switch GN brands should a better performing GN brand be available. 3.846
I only buy the top performing GN brand. 3.517
Company The company I buy my GN brands from has a good reputation. 4.251
Reputation The company I buy my GN brands from is a strong brand. 4.139

45
3.4.3.1 Grand mean values per category In order to present the category means, it was converted to a percentage format as
presented in Figure 3.7. It was done by converting each category average mean values of
the 5-piont Likert scale to a percentage, and divided it by 5. For interpretation purposes,
Bisschoff and Haasbroek (2009: 24) indicate that:
A level of less than 60% can be regarded as unimportant
60% to 75% can be regarded as acceptable or important
75% and higher can be regarded as excellent or very important.
As illustrated by Figure 3.7, the following categories: perceived value (84.01%), company
reputation (83.92%), brand trust (83.50%), customer satisfaction (79.25%), relationship
proneness (79.02%), brand relevance (76.57%) are all seen as very important factors and
the potential interaction between them will have an effect on retail buying behaviour.
Brand Performance (73.61%), brand affect (68.81%), involvement (66.43%), switching
cost (63.08%), product attribute (61.19%), all measured between 60% and 75% and can
be regarded as important range that will affect the buying behaviour of retailers. both
commitment (59.23%), repeat purchase (56.78%) below 60% and to extend can be
regarded as unimportant with a relative small influence on retail buying behaviour and
brand loyalty.
Figure 3.7: Average mean values, per measured category
79.25%
63.08%
83.50%79.02%
66.43%
84.01%
59.23% 56.78%
68.81%76.57% 73.61%
83.92%
61.19%
0%
10%
20%
30%
40%
50%
60%
70%
80%
90%
Average Mean % per category
Ave
rage
mea
n %
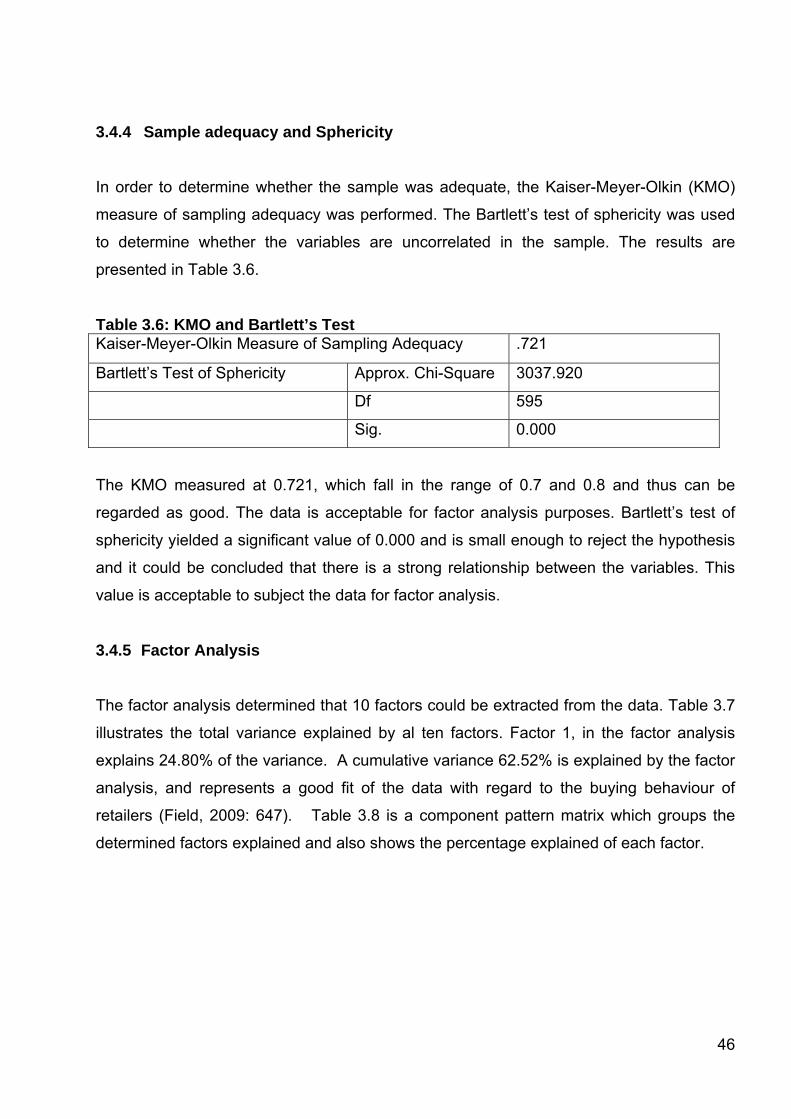
46
3.4.4 Sample adequacy and Sphericity
In order to determine whether the sample was adequate, the Kaiser-Meyer-Olkin (KMO)
measure of sampling adequacy was performed. The Bartlett’s test of sphericity was used
to determine whether the variables are uncorrelated in the sample. The results are
presented in Table 3.6.
Table 3.6: KMO and Bartlett’s Test Kaiser-Meyer-Olkin Measure of Sampling Adequacy .721
Bartlett’s Test of Sphericity Approx. Chi-Square 3037.920
Df 595
Sig. 0.000
The KMO measured at 0.721, which fall in the range of 0.7 and 0.8 and thus can be
regarded as good. The data is acceptable for factor analysis purposes. Bartlett’s test of
sphericity yielded a significant value of 0.000 and is small enough to reject the hypothesis
and it could be concluded that there is a strong relationship between the variables. This
value is acceptable to subject the data for factor analysis.
3.4.5 Factor Analysis
The factor analysis determined that 10 factors could be extracted from the data. Table 3.7
illustrates the total variance explained by al ten factors. Factor 1, in the factor analysis
explains 24.80% of the variance. A cumulative variance 62.52% is explained by the factor
analysis, and represents a good fit of the data with regard to the buying behaviour of
retailers (Field, 2009: 647). Table 3.8 is a component pattern matrix which groups the
determined factors explained and also shows the percentage explained of each factor.

47
Table 3.7: Total Variance Explained
Factor
Initial Eigenvalues
Extraction Sums of Squared Loadings
Total
% of
Variance
Cumulative
% Total
% of
Variance
Cumulative
%
1 8.683 24.808 24.808 8.333 23.810 23.810
2 3.356 9.588 34.396 3.008 8.595 32.405
3 2.773 7.921 42.317 2.435 6.957 39.362
4 2.162 6.177 48.494 1.832 5.234 44.596
5 1.837 5.248 53.742 1.414 4.040 48.636
6 1.622 4.634 58.375 1.217 3.477 52.113
7 1.504 4.297 62.673 1.126 3.218 55.330
8 1.412 4.034 66.707 1.055 3.015 58.345
9 1.189 3.396 70.104 .815 2.330 60.675
10 1.017 2.905 73.009 .646 1.846 62.522
The identified factors have been named and are interpreted as follows:
Factor 1: Long-term relationship with a preferred brand.
Factor 1 is an important factor and it has been identified as long-term relationship with a
preferred brand. There are four items loaded into this factor and it explains 24.80% of the
variance. The items loaded into the factor points to a required long-term relationship with
the manufacturer and that there is a tendency that preference towards the brand increases
with direct communication, involvement and the reputation of the groundnut brand.
Factor 2: Brand Loyalty
Factor 2 is labelled as brand loyalty. Four items are loaded in this factor and it explains
9.58% of the variance. Retailers do form a sense of loyalty with a specific brand and stay
committed to the brand, even if price increases are imposed. There are a few retailers that
will maintain a routine order. A perception exists that there is a relative risk involved by
switching to an alternative brand, and the retailer would rather have less stock than
bringing in a new groundnut brand.

48
Factor 3: Brand trust
Factor 3 is labelled as brand trust. Three items are loaded in this factor and it explains
7.92% of the variance. As long as a groundnut brand continues to perform in the
marketplace, retailers will continue to buy it based on the opinion that the right choice was
made. Even with replacement suppliers and brands available, there is still a preference to
support the leading brand, as the retailer perceive it to be the best brand.
Factor 4: Brand performance
Factor 4 is labelled as brand performance, two items are loaded in this factor and the
factor explains 6.17% of the variance. Retailers base their decisions to purchase after
evaluating the groundnut brand performance in the category. Should a better performing
groundnut brand be available in the marketplace compared to current brands, the retailer
will buy the better performing brand as an addition to their current snack category.
Factor 5: Satisfaction
Factor 5 is labelled as satisfaction; with three items loaded in this factor it explains 5.24%
of the variance. Retailers are satisfied with constant brand improvements to maintain the
competitive advantage. Retailers also prefer to buy a product that portrays a distinct
freshness. Should the requirements not be met, an alternative brand would be considered.
Factor 6: Intentional repurchase
Factor 6 could be identified as Intentional repurchase. Two items is loaded in this factor
and explains 4.63% of the variance. Retailers are determined to have a preferred brand on
shelve, and will attempt maintain their specific chosen groundnut product range.
Factor 7: Brand affect
Factor 7 is labelled as brand affect and is explained by a variance of 4.29%. Three items
are loaded in this factor and it shows that retailers perceive a groundnut brand to be just
as good as its last encountered experience. Though the retailer will remain loyal towards a
specific brand, they still see groundnuts in general as the same, and will sample a new
groundnut brand should it be presented.

49
Factor 8: Company reputation
Factor 8 is identified as company reputation and is explained by a variance of 4.03%. Six
items are loaded in this factor. Retailers prefer to buy from a company that has a good
reputation with a strong or well-known brand offering. Quality must be consistent and an
extended product range is preferred.
Factor 9: Involvement
Factor 9 explains a variance of 3.39% and is labelled as involvement. There is only a
single item loaded in this factor. As a Retailers’ involvement in the brand decline, the
retailers’ interest in a brand also declines.
Factor 10: Value for money
Factor 10 is labelled as value for money and explains a variance of 2.90%. Three items
are loaded in this factor. It is evident that retailers do consider price worthiness when
buying a specific groundnut brand. Should there be an economic constraint, cheaper
brand would be considered, as long as the brand is accepted by the retailer’s customers.

50
Table 3.8: Component Pattern Matrix per question
No.
Factor:
Behaviour factors
1 2 3 4 5 6 7 8 9 10
12 I maintain a relationship with a GN supplier that focuses and
communicates with me continuously. .671
10 The reputation of a GN brand is a key factor for me to
continue buying it. .600
13 My preference towards a GN brand increases the more I am
involved with it. .538
11 I prefer to maintain a long term relationship with a GN
supplier. .523
19 I remain committed to a GN brand even through price
increases. .676
6 I avoid switching GN brands due to the risks involved. .675
18 I do not purchase/sample other GN brands if my preferred
GN brand is unavailable. .515
23 I establish a GN brand purchasing pattern and seldom
deviate from it. .506
8 I trust the GN brands which I purchase. .798

51
29 I only buy the top performing GN brand. .634
5 I do not switch GN brands because of the effort required to
find a replacement. -.448
27 I evaluate a GN brand based on perceived performance in
the category. -.826
28 I will switch GN brands should a better performing GN brand
be available. -.695
26 My preferred GN brands are constantly updating, innovation
and improving so as to stay relevant in the market. .700
25 The GN brands that I purchase have a freshness about them
and portray positive significance. .647
3 I do not repeat a purchase if I am dissatisfied about a
particular GN brand. .457 -.446
24 I am distressed when I am unable to purchase a particular
GN brand. .692
21 I do not necessarily purchase the same GN brand all the
time. -.484
20 I remain committed to a GN brand even through declining
popularity. -.736
33 All GN brands are the same quality. -.624
22 I always sample new GN brands as soon as they are
available. -.516

52
2 Distinctive GN attributes keep me buying more. -.413
30 The company I buy my GN brands from has a good
reputation. -.627
31 The company I buy my GN brands from is a strong brand. -.568
15 My preference for a GN brand is based on product quality. -.507
9 The GN brands I purchase have consistently high quality. .440 -.500
35 If there were more flavours, I would buy more. -.452
1 I am satisfied with the GN brand I purchase. -.444
14 I consider other GN brands when my involvement with a
particular brand diminishes. -.827
16 Price worthiness is a key influence when I buy a GN brand. .658
7 I switch GN brands according to the prevailing economic
conditions. .567
17 The GN brands that I purchase enhance my reputation with
my customers. .500

53
3.4.6 Reliability
Cronbach Alpha coefficients were employed to statistically determine the reliability of the
data. The reliability measures appear in Table 3.9. As mentioned before, reliability is
regarded to be satisfactory when the Cronbach Alpha coefficient is higher than 0.70. The
overall data measured .877 and could be regarded as reliable.
Table: 3.9: Reliability Statistics Cronbach Alpha N of Items
.877 35
The validation of the questions is illustrated in Table 3.10. All questions correspond with
the questionnaire (Appendix A). The dimension column refers to Cronbach Alpha for each
group of questions when it is entered into the factor analysis. If a low reliability is
displayed, the identified individual low reliability coefficients of the questions are
considered and deleted in an attempt to increase the reliability. The individual deleted
questions are indicated by the brackets. The improved reliability coefficients are then
displayed in the last column where the target reliability coefficient of ≥0.70 is highlighted
accordingly. It should be noted that as this is exploratory research, and the lower value as
of 0.58 can also be regarded as acceptable (Moola & Bisschoff, 2012: 106).
The following was determined:
Customer satisfaction measured an unsatisfactory coefficient of .432; even with
question number 3 deleted the reliability increased to a marginally higher .476
which is still regarded as unacceptable.
Switching cost risk aversion also measured a final unsatisfactory level of .530.
Brand trust is regarded unacceptable at .527.
Relationship proneness measured acceptable for exploratory research at .589.
Involvement was found unacceptable at .220.
Perceived value measured satisfactory at .736.
Commitment measured unacceptable at .468
Repeat purchase measured .493, when questions 21 were deleted, reliability
increased to .585.
Brand relevance measured very satisfactory at .861.

54
Brand performance measured .622, and increased .684 to after question 29 was
deleted.
Company reputation measured acceptable at .692.
Product attribute measured .434 and significantly increased to .604 after the
deletion of question 32.
From of table 3.10 it is evident that Relationship Proneness, Perceived Value, Company
Reputation are reliable and that these influences have been measured by all the relevant
questions, and that there is no need to change these sections of the questionnaire.
Table 3.10: Validated Questions per Dimension
Dimension Cronbach
Alpha Questions Validated
Cronbach Alpha (after deleting questions)
Customer Satisfaction .432 Q1,Q2,(Q3) .476
Switching Cost Risk
Aversion
.485 (Q4),Q5,Q6,Q7 .530
Brand Trust .358 (Q8),Q9,Q10 .527
Relationship Proneness .589 Q11,Q12 .589
Involvement .220 Q13,Q14 .220
Perceived Value .736 Q15,Q16,Q17 .736
Commitment .468 Q18,Q19,Q20 .468
Repeat Purchase .493 (Q21),Q22,Q23 .585
Brand Relevance .861 Q25,Q26 .861
Brand Performance .622 Q27,Q28,(Q29) .684
Company Reputation .692 Q30,Q31 .692
Product Attribute .434 (Q32),Q33,Q34,Q35 .604
Note: Deleted questions are indicated by brackets
With the deletion of questions 4, 8, 21, and 32; switching cost risk aversion, brand trust,
repeat purchase, and product attribute showed improvement in reliability respectively.
These questions do have a significant negative effect on measuring buyer behaviour and

55
brand loyalty, and should be considered to be removed from the questionnaire. Customer
satisfaction, switching cost risk aversion, brand trust, are all just below the .58 mark.
Cortina (1993: 102) indicated that for exploratory research, a level lower that .50 can still
be acceptable. It must be noted that the results might differ should the study be repeated
in such cases. Both involvement and commitment measured as unreliable and further
investigation is determine the reasons of the failure.
The Component Pattern Matrix (Table 3.8) identified 10 factors that could be extracted
from the data. After the relevant questions have been grouped, the Cronbach Alpha
coefficients were again used to statistically determine the reliability of the data. Table 3.11
illustrates the data accordingly.
Table 3.11: Validated of 10 new factors
Dimension Cronbach
Alpha Questions Validated
Cronbach Alpha (after deleting
questions)
Factor 1 .782 Q1,Q10,Q11,Q12 .782
Factor 2 .683 Q6, Q18, Q19, Q23 .683
Factor 3 .250 Q8,Q9,(Q5) .763
Factor 4 .684 Q27,Q28 .684
Factor 5 .733 (Q3),Q25,Q26 .861
Factor 6 -.724 Q21,Q24 -.724
Factor 7 .751 Q2,Q20,Q22,Q33 .751
Factor 8 .777 Q1,Q15,Q30,Q31,Q35 .777
Factor 9 .220 Q14 .220
Factor 10 .685 (Q7),Q16,Q17 .693
A high level of reliability was achieved from the new contracted data and the factors
measured the following:
Factor 1 measured satisfactory at .782
Factor 2 measured satisfactory at .683

56
Factor 3 measured unsatisfactory at .250, when question 5 was deleted a
significant higher .763 was measured.
Factor 4 measured satisfactory at .684.
Factor 5 measured satisfactory at .733. But with the removal of question 3, it
increased to a very satisfactory .86.
Factor 6 measured negative at -.724, and was the only factor regarded as
unreliable.
Factor 7 measured satisfactory at .751.
Factor 8 measured satisfactory at .777.
Factor 9 measured unsatisfactory at .220 and is regarded as unacceptable. It
should be noted that this factor only consist of one question.
Factor 10 measured satisfactory at .685, with the removal of question 7, a marginal
improvement of .693 was realised.
3.5 SUMMARY This chapter is the basis of the research project. It was determined that two brands, Simba
and Safari, are significantly favoured by retail buyers over other groundnut brands.
Descriptive statistics showed that brand performance, brand affect, involvement, switching
cost/ risk aversion, and product attribute, are all important factors that have an effect the
buying behaviour and brand loyalty of retailers.
The KMO measured at 0.721, and the Bartlett’s test of sphericity yielded a significant
value of 0.000, indicating that the data is suitable to subject to factor analysis. The factor
analysis identified ten factors from the data and with a cumulative variance of 62.52%, the
data represents a good fit to explain the buying behaviour of retailers.
The ten factors identified were named as follows:
Factor 1: Long-term relationship with a preferred brand, and explains a variance of
24.80%.
Factor 2: Brand Loyalty, and explains a variance of 9.58%.
Factor 3: Brand trust, and explains a variance of 7.92%.
Factor 4: Brand performance, and explains a variance of 6.17%.

57
Factor 5: Satisfaction, and explains a variance of 5.24%.
Factor 6: Intentional repurchase, and explains a variance of 4.63%.
Factor 7: Brand affect, and explains a variance of 4.29%.
Factor 8: Company reputation, and explains a variance of 4.03%.
Factor 9: Involvement, and explains a variance of 3.39%.
Factor 10: Value for money, and explains a variance of 2.90%.
Chapter four is the last chapter of this research report and concludes the project
accordingly. Conclusions and recommendations from analysed data are presented as well
as areas for future research with regards to retail buying and brand loyalty is provided.

58
CHAPTER 4
CONCLUSION AND RECOMMENDATIONS
4.1 INTRODUCTION Conclusions and recommendations are based on the literature and empirical research
results. Findings from chapter three will be discussed in this chapter. The chapter attempts
to provide a framework for manufactures of branded edible groundnuts to get a better
understanding of retail buyer’s behaviour and their loyalty towards the brands they
support.
4.2 CONCLUSIONS
The primary objective of this study was to analyse retail buying behaviour and brand
loyalty of branded edible groundnuts. Through the factor analysis, ten factors have been
identified to have a significant influence on both buyer behaviour and brand loyalty, and
these factors also corresponds with literature on buying behaviour and brand loyalty.
Literature shows that a single conceptual model for specifically on the purchasing
behaviour of retailers lack, compared to models measuring consumer purchasing
behaviour (Skytte & Blunch, 2001: 133). Based on existing conceptual models for buyer
behaviour, retailer’s perceptions of brands and as well as a key brand loyalty influences
were measured as part of exploratory research to determine whether it correspond with
literature.
There were several factors identified through the study, which could have an influence on
retailer buying behaviour. The study showed that retail buyers have specific preferences
for specific edible groundnut brands. Both the Safari and Simba brands are clear market
leaders, compared to competing brands. Retail buyers also support groundnut brands that
they are satisfied with, and can trust to maintain the require quality and service levels.
Buyers have a preference for groundnut brands that show consistent high quality and that
portray freshness as well as a positive significance. Retailer buyers regard distinctive
product attributes and value for money as factors keeping them satisfied and loyal. Should
a retailer be dissatisfied with a particular groundnut brand, a repeat a purchase will not be

59
guaranteed. Retailers evaluate groundnut brands based on perceived performance within
their snack category. Since there are limited in-store shelf spaces available, there is a
tendency to focus purchases from the top performing groundnut brands in an attempt to
realise the highest category profitability. If a better performing groundnut brand is
available, the retailer will switch to that brand
Value for money, for the customer as well as for the retailer, is a key influence when
retailers have to decide which groundnut brand to purchase. To add to this, prevailing
economic conditions will make a retailer switch between groundnut brands in an effort to
maintain profitability and volume sales. In an attempt to remain competitive, a retail buyer
prefers to support the market leader. Therefore the manufacturer or supplier the retailer
buys groundnuts from, must have a strong brand as well as a good standing reputation.
Retailers also have a preference to maintain a long term relationship with a specific
groundnut supplier, and continuous focus and communication from the suppliers’ side is
an important factor to maintain the B2B relationship.
It should also be noted that since retailers are associated with the brands they offer to the
final consumer, retailers purchase groundnut brands that enhances their reputation with
their customers. Therefore the reputation of a groundnut brand is a key factor when a
retailer has to decide to buy it or not. Furthermore, retailers prefer to support groundnut
brands that stay relevant in the market through constantly updating, innovating and
improving their product or brand image. Should the retail buyer have greater involvement
with a specific groundnut brand, the retailer’s preference towards the specific brand
increases.
A study performed by Moola and Bisschoff (2012), provided the platform for this research
project. Literature showed and confirmed that buyer behaviour and brand loyalty are
determined and influenced by several aspects and it can be concluded that:
Perceived value, company reputation, brand trust, customer satisfaction,
relationship proneness, and brand relevance are all seen as very important factors
that can have a significant effect on retail buying behaviour.

60
Brand performance, brand affect, involvement, switching cost, and product
attributes, are also regarded as factors that will have some effecting the buying
behaviour and loyalty of retail buyers.
Both commitment and repeat purchase can be regarded as unimportant and seem
to have a relative small influence on retail buying behaviour and brand loyalty.
After performing a factor analysis, factors were identified that are regarded as to be
important towards both buying behaviour and brand loyalty. It can be concluded that:
A retailer wants to build a long-term relationship with a brand manufacturer, by
means of direct, focused and frequent communication by a groundnut supplier.
Retailers are forced to be more involved with a specific brand. Direct involvement
adds to the retailer’ brand preference, as well as the buyer’s overall brand
perception.
Retailers are of the opinion that there is a relative risk involved by switching their
trusted brand to an alternative brand. By having trust and satisfaction in their
chosen brand, the retailer would rather have less stock on shelf, than listing a new
groundnut brand. There are a few retailers that will maintain a routine order and by
forming this loyalty with a specific brand, the retailers will stay committed to the
brand, even when price increases are imposed.
Brand trust in a brand is strengthened by its positive and continuous performance in
the market place. As long as consumers buy it, the retailer will offer it as part of its
category product offering. As long as the retailer perceive the brand as being the
best, even with replacement suppliers and brands available, they will support the
specific brand.
Category performance is how retailers measure their performance. This could be
broken down further into specific line items, which represent a specific product and
brand. Retailers make their decisions to purchase a groundnut brand, after
evaluating its performance within the category. Should a groundnut brand be
performing satisfactory, there would be no need to search for an alternative or a
replacement product. But, should a better performing groundnut brand be available

61
in the marketplace compared to current brands, the retailer will buy the better
performing brand to add it to their snack category.
There is a preference towards brands that constantly improve and offer a distinct
difference compared to other brands. Retailer buyers also want to purchase a
product that portrays a distinct freshness. This allows retailers to maintain a
competitive advantage and it contributes to the retailer’s overall satisfaction.
Should this not be met, the retailer will investigate what other brands are available
to considered as an alternative.
Retailers are determined to have a preferred brand on shelve, and will attempt to
maintain their specific chosen groundnut product range. This will result in
intentional repurchases by both retailer buyers and consumers. This action will
ensure that consumers are able to buy the leading market brands from the retailers
who have it available for sale.
Retail buyers see groundnuts, in general as the same, therefore every purchase the
retail buyer make should fully adhere to the retailer’s expectations. Should a
groundnut brand not meet the expectations, the brand could easily be perceived, by
the retail buyer, as not meeting the required performance. This brand affect is all
based on the retailer’s last encountered experience, hence be it positive or
negative. Should it be positive, the retailer will remain loyal towards the brand, but
should it be negative, the retail buyer will sample a new groundnut brand from an
alternative supplier.
Companies with a good standing reputation or a well-known brand name are
preferred by retail buyers. It allows the retailers to choose from a larger product
range offering. It also provides the buyer with a sense of assurance that product
quality and associated services will remain consistent. This reduces risk for the
retail buyer, as there is a sense of certainty the groundnut brand they purchase
would consistently adhere to the required specifications.

62
It is evident that retailers do consider price worthiness when buying a specific
groundnut brand. Should there be an economic constraint, a cheaper brand would
be considered, as long as the brand meets the retailer’s requirements and is
accepted by the retailer’s customers.
4.3 RECOMMENDATIONS From the literature discussed and the identified factors that have an effect on retail buyer
behaviour and brand loyalty, the following recommendations can be made for a
manufacture or supplier of branded groundnuts to the retail market:
Long-term relationship with a preferred brand
The manufacturer of a groundnut brand should place emphasis on the relationship with
the retailer (Skytte and Blunch, 2001:134). A positive relationship with the retailer buyers
will contribute towards brand loyalty and trust. A long-term relationship holds advantages
for both the retailer and the manufacturer. As retailers are the gatekeepers of consumer’s
choice, a positive relationship will ensure the respective groundnut brands representation
on the retailers’ shelves. It is recommended to manufacturers to foster a long-term
relationship with retail buyers in order to maintain, and grow the groundnut brands market
share.
Brand Loyalty
Brand loyalty, as indicated in the literature, leads to repurchases with little regard to
available alternatives (Manternach, 2010: 28). This becomes a strategic asset for the
retailer, as it also fosters a relationship and positive brand perception with the end
consumer. Manufactures must ensure that retail buyers are satisfied with their product and
brand performance. This will contribute to increased brand loyalty, trust and commitment
towards the relevant brand.
Brand trust
Brand trust is more than just trust in a particular brand. A retail buyer would support a
manufacturer or suppliers that consistently deliver a product that adheres to the retailer’s
expectation in terms of quality, service and value for money (Ericş et al., 2012: 1403).

63
Branded groundnut suppliers must ensure that they adhere to retail buyers required
expectations continuous, in an attempt to maintain satisfaction and ultimately contribute to
brand trust. This will ensure that the specific groundnut brand does have a competitive
advantage over competing alternative brands in the retail market.
Brand performance
A retail buyer measures a brand in terms of its performance per category (Glynn, 2007:
55). Groundnuts are part of the retailers snack category and compete with other types of
snacks, as well as other groundnut brands. Since retailers are associated with the brands
they offer to the consumer, manufacturers should also manage and grow the loyalty of the
end consumers as well. In order to increase brand awareness, a focused advertising
strategy should be utilised to promote the relevant groundnut brand and to communicate
with the end consumer. By creating demand pull, retailers are inclined to replenish their
stock levels in order to fill the required demand by the end consumer. Manufactures
should utilise this opportunity to consistently fill the retail buyer’ orders, with a product that
maintain the required category profitability.
Satisfaction
As literature indicated, satisfaction is a strong predictor of loyalty as well as repurchases
intentions (Zboja & Voorhees, 2006: 381). Manufactures need to be aware of the retailer’s
requirements to fill their expectations consistently. Satisfaction will strengthen trust
between the retailer buyer and the manufacturer. As showed in the research results, there
are two leading groundnut brands. This forms the benchmark for competing brands in the
South African edible groundnut market. As long as retail buyers are satisfied with these
brands, they will maintain the majority market share. It is recommended that
manufacturers ensure that their brands and products are distinctly different from those of
competitors, in order to keep retail buyers satisfied in terms of product offering, service,
value for money, and quality.
Intentional repurchase
Repurchase intentions show that the buyer is satisfied with the product (Zboja &
Voorhees, 2006: 381). Intentional repurchase is an indicator of the retailer buyer approval
of the product and an indicator of strong brand loyalty. Repeat purchases are also proof

64
that the final consumer demands the respective product, which strengthens the retail
buyers’ intention and positive attitude towards the groundnut brand. It is therefore
recommended that the groundnut manufacture provides continuously a product that
differentiates itself from other competing FMCG brands in an attempt to fulfil the retail
buyers’ demand.
Brand affect
Brand affect does have an effect on retail buyers’ behaviour and loyalty. This will
influence the decision for future purchases or repurchase the groundnut brand. Buyers
remember the last purchasing experience with the manufacture or of the manufacturer’ or
brand, whether it is positive or negative (Perreault & McCarthy, 2006: 257). A positive
experience may be sufficient to alter perceptions of more than one preceding negative
experience, and vice versa. This directly correlates with customer satisfaction.
Manufactures have to take notice of brand affect and support it with a positive customer
experience. This includes all the aspects of the value chain. Retail buyers will support a
groundnut supplier that have the relevant capacity to deliver, provide all associated
services to deliver a consistent positive purchasing experience. Again, this will increase
the brand trust that can be related to experience. Positive, honest business principals and
a transparent business approach will contribute to retail buyers becoming loyal towards a
groundnut brand.
Company reputation
Retailers prefer to buy from a company that has a good reputation with a strong or well-
known brand offering (Dawson, 2013: 342). Quality must be consistent and a range of
offerings is preferred in order to maintain a good standing reputation. A positive company
reputation will add to the willingness of a retail buyer to make a purchase or not, especially
compared to a company (or brand) that is unknown. Manufactures of well-known brands
can utilise the opportunity by using their brand name as leverage through marketing
campaigns to increase end customer demand and ultimately retail sales demand.
Involvement
Though it measured relatively low in the factor analysis, manufactures should be aware of
the fact that involvement does have an effect on buyer behaviour and brand loyalty (Moola

65
& Bisschoff, 2012: 106). Retail buyers do regard their direct involvement with a product as
a factor to trigger interest in the product or not. Suppliers or manufactures must ensure
that retail buyers are kept informed about the product, and also keep them involved
through new product development or promotional activities in an attempt to ensure
continued support and increased interest and brand loyalty.
Value for money
Profitability is a key concern for any retailer (Insch et al., 2011: 261). The brand with the
highest margin and sales value will be a valued asset in their snack category.
Manufactures must source groundnuts at competitive prices, in an attempt to fulfil the
retail buyer’ overall final product requirement. Manufactures have to source groundnuts
consistently, at the most competitive price, which adheres to the minimum quality
specifications of the retail buyer. Retail buyers are responsible to manage, and increase
their relevant product category’s profitability. It is recommended that the manufacture
determine the retailer’s required margin levels and provide them with a product that meets
this requirement. Neither the retail buyer, nor the end consumer will purchase a groundnut
brand that is not competitively priced.
4.4 AREAS OF FUTURE RESEARCH This study gives an outline for the development of a conceptual model to measure retail
buyer behaviour and preference for a specific groundnut brand. Through the ten factors
identified, a model could be constructed, and tested against the results achieved, to reflect
typical retail buyer behaviour.
With the distribution of the questionnaires, all respondents were involved in a specific retail
store. Care should be taken to extend the study to include wholesale buyers, providing
final product to a range of retail outlets. This group should also be targeted in an attempt
to test the outcomes achieved in this study. This will reflect the perceptions, as well as the
factors affecting retail buyers behaviour (and loyalty) of groundnuts that are sold in the
broader and diverse retail value chain.
66
4.5 SUMMARY The objective of this study was to analyse retail buying behaviour and brand loyalty of
branded edible groundnuts. A factor analysis was performed to identify factors that are
regarded as important towards both buying behaviour and brand loyalty. The results
obtained were tested against literature and it can be concluded that:
A retailer wants to build a long-term relationship with a brand manufacturer or
supplier.
Switching between brands does involve a relative risk for the retailer.
The retailers trust in a brand is strengthened by its positive and continuous
performance in the market.
Retailers base their decisions on category performance.
There is a preference towards brands that allow retailers to maintain a competitive
advantage over its competitors.
Retailers prefer to offer leading market brands on sale.
Suppliers should fully adhere to the retailer’s expectations and requirements.
Retailers prefer to deal with suppliers that have a good standing reputation or a
well-known brand.
Price worthiness is regarded as important, as long as the brand meets the retailer’s
requirements and is accepted by the retailer’s customers.
Based on the literature and the identified factors, the following recommendations can be
made for a manufacture or supplier of branded groundnuts to the retail market:
The supplier of a groundnut brand should place emphasis on a positive relationship
with the retailer. This will contribute towards brand loyalty and trust, as well as a
long-term relationship holds advantages for both the retailer and the manufacturer.
This will contribute towards the growth of a groundnut brands’ market share.

67
Brand loyalty leads to retail repurchases. Suppliers must ensure that retail buyers
are satisfied with their product and performance, as it will contribute to increased
brand loyalty, trust and commitment towards the relevant brand.
Branded groundnut suppliers must adhere to retail buyer’s requirement and
expectations. It will result in buyer satisfaction and ultimately contribute towards
increased brand trust.
Groundnuts are part of the retailers snack category and compete with other types of
snacks, and other groundnut brands. Supplier should utilise focused advertising
strategies to promote their relevant groundnut brand to maintain the required
category profitability.
Manufactures need to be aware of the retailer’s requirements to fill their
expectations consistently. Suppliers have to ensure that their brands and products
are well differentiated from competitors, in order to keep retail buyers satisfied in
terms of product offering, service, value for money, and quality.
Intentional repurchase is an indicator of the retailer buyer approval of the product
and an indicator of strong brand loyalty and repeated purchases are also proof that
the final consumer demands the respective groundnut brand. It is therefore
recommended that the groundnut manufacture provides continuously a product that
differentiates itself from other competing FMCG brands in an attempt to fulfil the
retail buyers’ requirements.
Brand affect does influence retail buyers for future purchases of a groundnut brand
based on the last purchasing experience with the supplier or of the manufacturer’ or
brand, whether it is positive or negative. This directly correlates with customer
satisfaction and supplier has to take notice of brand affect and support it with a
positive customer experience.
Retailers prefer to buy from a company that has a good reputation, that supply the
required quality and that offer a range of products. Supplier of well-known brands
can use their brand name as leverage through marketing campaigns to increase
end customer demand and increased retail demand.
Retail buyers do regard their direct involvement with a product as a factor to trigger
interest in the product. Suppliers must ensure that retail buyers are kept informed
about the product, new product developments and promotional activities in an
attempt to ensure continued support and increased interest and brand loyalty.

68
Profitability is a key concern for any retailer and manufactures have to source
groundnuts consistently, at the most competitive price, while still maintaining
minimum quality specifications. This will result in adhering to the retailers required
profit margin level and a product that meets this requirement.

69
REFERENCES Aaker, D. A. 1991. Managing Brand Equity: Capitalizing on the Value of a Brand Name.
New York: The Free Press.
Aaker, D. A. 1996. Building Strong Brands. New York: The Free Press.
Babbie, E. & Mouton, J. 2004. The practice of social research. 4th ed. Cape Town:
Oxford University Press Southern Africa.
Barda, C. & Sardianou, E. 2010. Analysing consumers’ “activism” in response to rising
prices. International Journal of Consumer studies. 34 (2010): 133-139
Bawa, A.S. & Sidhu, J.S. 2003. Snack foods / Range on the Market. Snack foods
worldwide. Food Technology, 45 (58): 5322-5332.
Berry, L.L. 2000. Cultivating service brand equity. Journal of the Academy of Marketing
Science, 28 (1): 128-137.
Bisschoff, C.A. & Haasbroek, A. 2009. Customer grand values in the remarket automotive
industry. Commercium, 9(1): 24-43
Brown, B.P., Zablah, A.R., Bellenger, D. N. & Johnston, W.J. 2011. When do B2B brands
influence the decision making of organizational buyers? An examination of the relationship
between purchase risk and brand sensitivity. International Journal of Research in
Marketing, 28: 194-204.
Brynard, P.A. & Hanekom. S.X. 1997. Introduction to Research in Public Administration.
Pretoria: J.L. Van Schaik Publishers.
Cortina, J.M. 1993. What is Coefficient Alpha? An examination of Theory and Applications.
Journal of Applied Psychology, 78(1): 98-104.
70
Cretu, A.E. & Brodie, R. J. 2007. The influence of brand image and company reputation
where manufactures market to small firms: A customer value perspective. Industrial
Marketing Management, 36: 230-240.
Darlington, R. 2004. Factor Analysis. http://www.psych.cornell.edu/darlington/ factor.htm.
Date of access: 17 October 2013.
Dawes, J. & Nenycz-Theil, M. 2013. Analysing the intensity of private label competition
across retailers. Journal of Business Research, 66: 60-66.
Dawson, J. 2013. Retailer activity in shaping food choice. Food Quality and preference,
28: 338-347.
Decoster, J. 1998. Overview of Factor Analysis. http://www.stat-help.com/notes.html. Date
of access: 17 October 2013.
Doyle, P. & Weinberg, C.B. 1973. Effective New Product Decisions for Supermarkets.
Operational Research Quarterly, 24 (1): 45-54
Du Plessis, P.J., Rousseau, G.G. & Blem, N.H., 1995. Buyer Behaviour. Strategic
marketing applications. Southern book publishers: Halfway House.
Ericş, A., Ünal, S., Candan, F.B. & Yildirim, H. 2012. The effect of brand satisfaction, trust
and brand commitment on loyalty and repurchase intentions. Procedia – Social and
Behavioural Sciences, 58: 1395-1404.
Field, A. 2009. Discovering statistics using SPSS. 3rd ed. London: Sage Publications.
Glynn, M.S. 2007. How retail category differences moderate retailer perceptions of
manufacturer brands. Australasian Marketing Journal, 15 (2): 55-67.
Glynn, M. S. 2010. The moderating effect of brand strength in manufacturer-reseller
relationships. Industrial Marketing Management, 2010: 1226-1233

71
Goldsmith, R. E., Flynn, L. R., Goldsmith, E. & Stacey, E. C. 2010. Consumer attitudes
and loyalty towards private brands. International Journal of Consumer Studies, 34: 339-
348.
Hansen, T.H. & Skytte, H. 1998. Retailer buying behaviour: a review. The International
Review of Retail, Distribution and Consumer Research, 8 (3): 277-301.
HE, S., Flecther, S. & Rimal, A. 2005. Snack peanut consumption: Type preference and
consumption manners. Journal of Food Distribution Research, 36 (1): 79-85.
Horton, R.L. 1984. Buyer behaviour. A Decision-making Approach. Merrill: Ohio.
Insch, A., Prentice, R.S. & Knight, J.G. 2011. Retail buyers’ decision-making and buy
national campaigns. Australian Marketing Journal, 19: 257-266.
Jekanowski, M.D., Williams, D.R. & Schick, W.A. 2000. Consumers' willingness to
purchase locally produced agricultural products: an analysis of an Indiana survey. 2000 –
http//:www.ageconsearch.umn.edu. Date of access: 02 August 2013.
Jones, R. & Kim, Y. 2011. Single-brand retailers: Building brand loyalty in the off-line
environment. Journal of Retailing and Consumer Services, 2011: 1-8.
Kotler, P., Armstrong, G. 2012. Principles of marketing. Global edition. 14th Edition.
Pearson, Boston.
Lee, C.M. & Resurreccion, A.V.A. 2006. Consumer acceptance of roasted peanuts
affected by storage temperature and humidity conditions. LWT, 39: 872-882.
Lombart, C. & Louis, D. 2012. Consumer satisfaction and loyalty: Two main consequences
of retailer personality. Journal of Retailing and Consumer Services, 19: 644-652.
Manternach, L. 2010. Successful organizations build brand loyalty. Corridor Business
Journal, 7(1): 28-38.

72
Meyer, F. & Van Der Burgh, G. 2012. Evaluating the sustainability of the South African
Groundnut Industry. Bureau for Food and Agricultural Policy. http://www.bfap.co.za. Date
of access: 09 January 2013
Moola, A.I. & Bisschoff, C.A. 2012. Validating a Model to Measure the Brand Loyalty of
Fast Moving Consumer Goods. Journal for Social Science, 31 (2): 101-115.
Morgan, N.A., Kaleka, A. & Gooner, R. A. 2007. Focal supplier opportunism in
supermarket retailer category management. Journal of Operations Management, 25: 512-
527.
Morgan, R.M. & Hunt, S.D. 1994. The commitment – trust theory of relationship marketing.
Journal of Marketing, Volume 58 (3): 20-38.
NDA, 2008. Market value chain profile. http://www.daff.org.za Date access: 09 January
2013
NDA, 2012. Groundnut market value chain profile 2011/2012. Department of Agriculture,
Forestry and Fisheries. http://www.daff.org.za Date access: 24 April 2013
Nelson, R.G., Jolly, C. M., Hinds, M. J, Donis. Y. & Prophete, E. 2005. Conjoint analysis
of consumer preferences for roasted peanut products in Haiti. International Journal of
Consumer Studies, May2005, Vol. 29 (3): 208-215.
Oliver, R.L. 1997. Satisfaction: a behavioural perspective on the consumer. McGraw-Hill,
New York.
Oraman, Y., Azabagaoglu, M.O. & Inan,I.H. 2011. The firms’ survival and competition
trough global expansion: A case study from food industry in FMCG sector. Procedia Social
and Behavioural Sciences, 24: 188-197.

73
Pazderka. C. & Emmott. A. 2010. Chatham House procurement for development forum:
Groundnuts case study Chatham. http:// www.chathamhouse.org.uk
/16792_0610casestudy_groundnuts.pdf. Date access: 09 January 2013
Perreault, W. D. & McCarthy, E. J. 2006. Basic marketing: A global–managerial approach.
15th Edition. McGraw-Hill/Irwin, New York.
Peterson, R.A. 1994. A Meta-Analysis of Cronbach’s Coefficient Alpha. Journal of
Consumer Research, 21(2): 381-391.
Schoeman, B. 2011. Die werking van die grondboon mark. Graan SA. Julie 2011.
Sethuraman, R. & Cole, C. 1999. Pricing strategy & practice: Factors influencing the price
premiums that consumers pay for national brands over store brands. Journal of Product &
Brand Management, 8 (4): 340-351.
Sheth, J. 1973. A model of industrial buying behaviour. Journal of Marketing, 37 (4): 50-
56.
Sheth, J. 1981. A theory of merchandise buying behavior. American Marketing
Association, 1981: 180-189.
Skytte, H. & Blunch, N. J. 2001. Food retailers’ buying behaviour: An analysis in 16
European countries. Chain and network science, 2001: 133-145.
Temple, N. J. Steyn, N.P. Fourie, J. & De Villiers, A. 2011. Price and availability of healthy
food: A study in rural South Africa . Nutrition, Volume, 27 (1):55-58.
Van Schalkwyk, H.P. 2003. Demand relations of oilseed products in South Africa
Bloemfontein: University of the Freestate. (Dissertation – Mcom)
Wangchroen, W., Ngarmsak, T. & Wilkinson, B.H. 2005. Snack product consumer
surveys: large versus small samples. Food Quality and Preference, 16 (6): 1-5.

74
Welman, C., Kruger, F. & Mitchell, B. 2010. Research Methodology. 3rd ed. Southern
Africa: Oxford Southern Africa.
Zboja, J.J. & Voorhees, C.L. 2006. The impact of brand trust and satisfaction on retailer
repurchase intentions. Journal of Services Marketing, 20 (5): 381-390.
Zentes, J., Morschett, D., & Schramm-Klein, H. 2011. Strategic retail management. 2nd ed.
Weisbaden: Gabler.

75
APPENDIX A
Section A - Demographic details The following section is about the demographical distribution in your specific area
Please indicate the following by making an X in the appropriate box
5. TRADING AREA (province) North-West Gauteng
1. GENDER Male 1.2 Female
2. Store information a. Type: Corporate Retail Independent retail Informal trader Wholesaler b. Store
name:________________
3. POSITION IN THE BUSINESS Apprentice Middle Manager Senior Manager Owner Other:_______________
4. EDUCATION BACKGROUND High School Diploma Graduate Post Graduate None
1
2
1
2
1
2
3
4
4
3
2
1
5
4
3
2
1
5
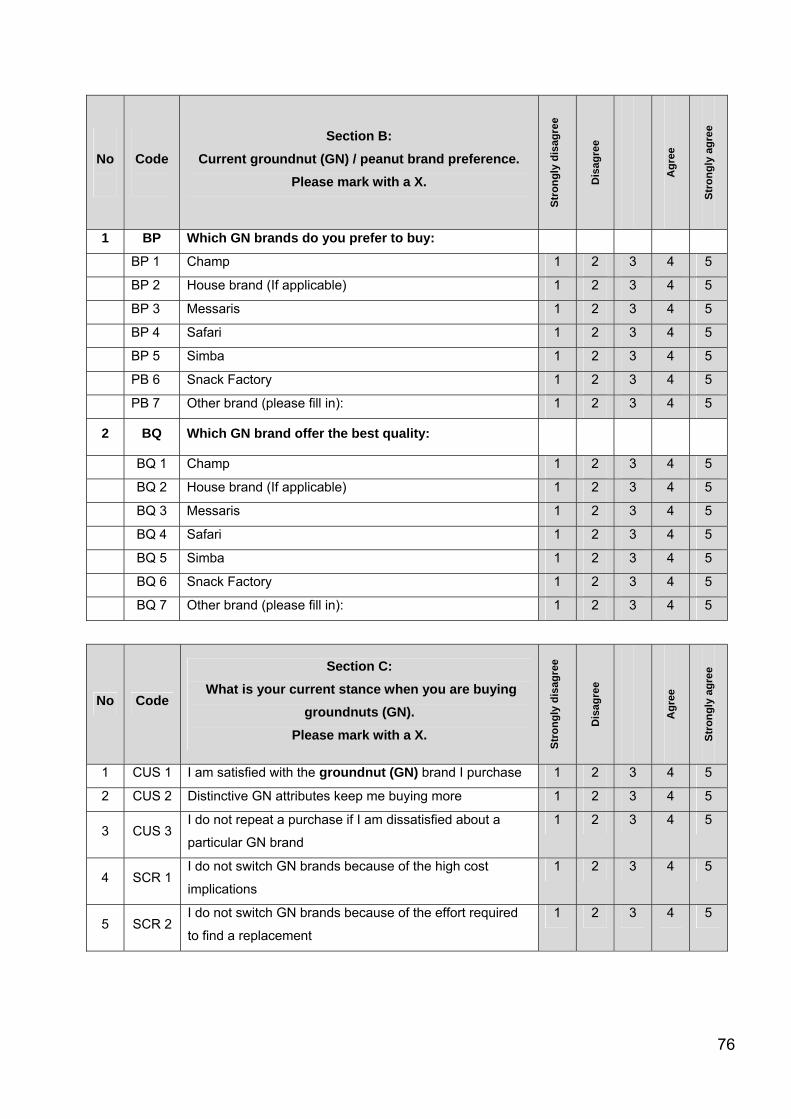
76
No
Code
Section B: Current groundnut (GN) / peanut brand preference.
Please mark with a X.
Stro
ngly
dis
agre
e
Dis
agre
e
Agr
ee
Stro
ngly
agr
ee
1 BP Which GN brands do you prefer to buy:
BP 1 Champ 1 2 3 4 5
BP 2 House brand (If applicable) 1 2 3 4 5
BP 3 Messaris 1 2 3 4 5
BP 4 Safari 1 2 3 4 5
BP 5 Simba 1 2 3 4 5
PB 6 Snack Factory 1 2 3 4 5
PB 7 Other brand (please fill in): 1 2 3 4 5
2 BQ Which GN brand offer the best quality:
BQ 1 Champ 1 2 3 4 5
BQ 2 House brand (If applicable) 1 2 3 4 5
BQ 3 Messaris 1 2 3 4 5
BQ 4 Safari 1 2 3 4 5
BQ 5 Simba 1 2 3 4 5
BQ 6 Snack Factory 1 2 3 4 5
BQ 7 Other brand (please fill in): 1 2 3 4 5
No Code
Section C: What is your current stance when you are buying
groundnuts (GN). Please mark with a X.
Stro
ngly
dis
agre
e
Dis
agre
e
Agr
ee
Stro
ngly
agr
ee
1 CUS 1 I am satisfied with the groundnut (GN) brand I purchase 1 2 3 4 5
2 CUS 2 Distinctive GN attributes keep me buying more 1 2 3 4 5
3 CUS 3 I do not repeat a purchase if I am dissatisfied about a
particular GN brand
1 2 3 4 5
4 SCR 1 I do not switch GN brands because of the high cost
implications
1 2 3 4 5
5 SCR 2 I do not switch GN brands because of the effort required
to find a replacement
1 2 3 4 5

77
Stro
ngly
dis
agre
e
Dis
agre
e
Agr
ee
Stro
ngly
agr
ee
6 SCR 3 I avoid switching GN brands due to the risks involved 1 2 3 4 5
7 SCR 4 I switch GN brands according to the prevailing economic
conditions
1 2 3 4 5
8 BTS 1 I trust the GN brands which I purchase 1 2 3 4 5
9 BTS 2
The GN brands I purchase have consistently high quality 1 2 3 4 5
10 BTS 3 The reputation of a GN brand is a key factor for me to
continue buying it
1 2 3 4 5
11 RPR 1
I prefer to maintain a long term relationship with a GN
supplier
1 2 3 4 5
12 RPR 2
I maintain a relationship with a GN supplier that focuses
and communicates with me continuously
1 2 3 4 5
13 INV 1
My preference towards a GN brand increases the more I
am involved with it
1 2 3 4 5
14 INV 2
I consider other GN brands when my involvement with a
particular brand diminishes
1 2 3 4 5
15 PVL 1
My preference for a GN brand is based on product quality 1 2 3 4 5
16 PVL 2
Price worthiness is a key influence when I buy a GN
brand
1 2 3 4 5
17 PVL 3
The GN brands that I purchase enhances my reputation
with my customers
1 2 3 4 5
18 COM 1
I do not purchase/sample other GN brands if my preferred
GN brand is unavailable
1 2 3 4 5
19 COM 2
I remain committed to a GN brand even through price
increases
1 2 3 4 5
20 COM
3
I remain committed to a GN brand even through declining
popularity
1 2 3 4 5
21 RPS 1
I do not necessarily purchase the same GN brand all the
time
1 2 3 4 5
22 RPS 2
I always sample new GN brands as soon as they are
available
1 2 3 4 5
23 RPS 3
I establish a GN brand purchasing pattern and seldom
deviate from it
1 2 3 4 5

78
Stro
ngly
dis
agre
e
Dis
agre
e
Agr
ee
Stro
ngly
agr
ee
24 BAF 1
I am distressed when I am unable to purchase a particular
GN brand
1 2 3 4 5
25 BRV 1
The GN brands that I purchase has freshness about them
and portray positive significance
1 2 3 4 5
26 BRV 2
My preferred GN brands are constantly updating,
innovation and improving so as to stay relevant in the
market
1 2 3 4 5
27 BPF 1
I evaluate a GN brand based on perceived performance in
the category
1 2 3 4 5
28 BPF 2
I will switch GN brands should a better performing GN
brand be available
1 2 3 4 5
29 BPF 3
I only buy the top performing GN brand 1 2 3 4 5
30 CR 1
The company I buy my GN brands from has a good
reputation
1 2 3 4 5
31 CR 4
The company I buy my GN brands from is a strong brand 1 2 3 4 5
32 PA 1 I rather buy other snacks, because GN is too expensive. 1 2 3 4 5
33 PA 2 All GN brands are the same quality. 1 2 3 4 5
34 PA 3 I see whole groundnuts as better quality than split nuts 1 2 3 4 5
35 PA 4 If there were more flavours, I would buy more 1 2 3 4 5
Section C:
Current groundnut (GN) category performance: Please mark with a X.
1 CP 1 Is your groundnut category growing in turnover? Yes No
2 CP 2 Is your groundnut category growing in volume? Yes No
3 CP 3
Do you want to increase your product range (new
products) Yes No
4 CP 4
Are groundnuts an important product for you to have on
your store’ shelve? Yes No
Related Documents