1 Analysis of ground reaction force and electromyographic activity of the gastrocnemius muscle during double support Andreia S. P. Sousa Escola Superior da Tecnologia de Saúde do Porto, Área Científica de Fisioterapia Centro de Estudos de Movimento e Actividade Humana Rua Valente Perfeito, 322 - 4400-330 Vila Nova de Gaia, PORTUGAL E-mail: [email protected] Rubim Santos Escola Superior da Tecnologia de Saúde do Porto, Departamento de Física Centro de Estudos de Movimento e Actividade Humana Rua Valente Perfeito, 322 - 4400-330 Vila Nova de Gaia, PORTUGAL E-mail: [email protected] Francisco P. M. Oliveira Faculdade de Engenharia da Universidade do Porto, Instituto de Engenharia Mecânica e Gestão Industrial Rua Dr. Roberto Frias, s/n, 4200-465 Porto, PORTUGAL E-mail: [email protected] Paulo Carvalho Escola Superior da Tecnologia de Saúde do Porto, Departamento de Fisioterapia Centro de Estudos de Movimento e Actividade Humana Rua Valente Perfeito, 322 - 4400-330 Vila Nova de Gaia, PORTUGAL E-mail: [email protected]

Welcome message from author
This document is posted to help you gain knowledge. Please leave a comment to let me know what you think about it! Share it to your friends and learn new things together.
Transcript

1
Analysis of ground reaction force and electromyographic activity of the
gastrocnemius muscle during double support
Andreia S. P. Sousa
Escola Superior da Tecnologia de Saúde do Porto,
Área Científica de Fisioterapia
Centro de Estudos de Movimento e Actividade Humana
Rua Valente Perfeito, 322 - 4400-330 Vila Nova de Gaia, PORTUGAL
E-mail: [email protected]
Rubim Santos
Escola Superior da Tecnologia de Saúde do Porto,
Departamento de Física
Centro de Estudos de Movimento e Actividade Humana
Rua Valente Perfeito, 322 - 4400-330 Vila Nova de Gaia, PORTUGAL
E-mail: [email protected]
Francisco P. M. Oliveira
Faculdade de Engenharia da Universidade do Porto,
Instituto de Engenharia Mecânica e Gestão Industrial
Rua Dr. Roberto Frias, s/n, 4200-465 Porto, PORTUGAL
E-mail: [email protected]
Paulo Carvalho
Escola Superior da Tecnologia de Saúde do Porto,
Departamento de Fisioterapia
Centro de Estudos de Movimento e Actividade Humana
Rua Valente Perfeito, 322 - 4400-330 Vila Nova de Gaia, PORTUGAL
E-mail: [email protected]

2
João Manuel R. S. Tavares
Faculdade de Engenharia da Universidade do Porto,
Departamento de Engenharia Mecânica
Instituto de Engenharia Mecânica e Gestão Industrial
Rua Dr. Roberto Frias, s/n, 4200-465 Porto, PORTUGAL
E-mail: [email protected]
Corresponding author:
Prof. João Manuel R. S. Tavares
Faculdade de Engenharia da Universidade do Porto
Rua Dr. Roberto Frias, s/n
4200-465 Porto, PORTUGAL
E-mail: [email protected], url: www.fe.up.pt/~tavares
Phone: +351 22 5081487, Fax: +351 22 5081445

3
Analysis of ground reaction force and electromyographic activity of the
gastrocnemius muscle during double support
Abstract
Purpose: Mechanisms associated with energy expenditure during gait have
been extensively researched and studied. According to the double-inverted
pendulum model energy expenditure is higher during double support, as lower
limbs need to work to redirect the centre of mass velocity. This study looks into
how the ground reaction force (GRF) of one limb affects the muscle activity
required by the medial gastrocnemius (MG) of the contralateral limb during
step-to-step transition. Methods: Thirty-five subjects were monitored as to the
MG electromyographic activity (EMGa) of one limb and the GRF of the
contralateral limb during double support. Results: After determination of the
Pearson correlation coefficient (r), a moderate correlation was observed
between the MG EMGa of the dominant leg and the vertical (Fz) and
anteroposterior (Fy) components of GRF of the non-dominant leg (r=0.797,
p<0.0001; r=-0.807, p<0.0001) and a weak and moderate correlation was
observed between the MG EMGa of the non-dominant leg and the Fz and Fy of
the dominant leg, respectively (r=0.442, p=0.018; r=-0.684 p<0.0001).
Conclusions: The results obtained suggest that during double support, GRF is

4
associated with the EMGa of the contralateral MG and that there is an
increased dependence between the GRF of the non-dominant leg and the
EMGa of the dominant MG.
Keywords: Double-inverted pendulum model; Double support phase; Ground
reaction force; Ankle plantar flexor activity; Electromyography.
Number of pages: 38
Number of tables: 1
Number of figures: 4

5
1. Introduction
Several models have been suggested to describe human gait
mechanisms [1-7]. Although neural and mechanical systems, including
musculoskeletal dynamics, supra-spinal and afferent modulation, work together
to minimise energy expenditure [8, 9], it is widely accepted that the recovery of
mechanical energy during gait is incomplete, even though muscles work to
compensate energy loss [6, 7, 10, 11]. Understanding how individual muscles
contribute to specific tasks can provide important insights into neuromuscular
control and walking mechanics. This understanding can also aid in developing
improved prosthetic, orthotic and other assistive devices to mitigate
neuromuscular impairments and designing more effective rehabilitation
strategies.
According to the double-inverted pendulum model [7, 12] a major energy
loss in walking is due to step-to-step transitions [12], which occur mainly during
double support as the two leg forces need to redirect the centre of mass (COM)
velocity from a downward and forward direction to an upward and forward
direction. The leading leg strikes the ground, performing negative work on the
COM and the energy lost may be restored through positive work by the trailing
leg. The double-inverted pendulum model predicts that restoring mechanical
work is done by the trailing leg at the instant of heel strike through a powerful

6
plantar flexion [6, 13, 14]. Based on these assumptions, a relation between
ankle plantar flexors muscle activity and heel strike force would be expected, as
these muscles play a major role in propulsion in late stance during unimpaired
walking [15, 16] and are important to provide body support [17-19], matching
the second peak of the vertical ground reaction force [20]. Considering
predictions of the double-inverted pendulum model, impact forces can
demonstrate the role of the gastrocnemius muscle: it contributes to push-off and
limits heel strike. According to Doets et al., 2009 [21], the larger the heel strike
cost in the leading leg during heel strike, the higher the metabolic cost of
walking, i.e., the energy dissipated during step-to-step transition explains 29%
of the variance in the metabolic energy cost of walking.
Neurophysiologically, the regulation of human walking requires a close
coordination of muscle activation between the two legs which seems to be
achieved by a flexible neuronal coupling at spinal level (for reviews, see, for
example, [22, 23]). During gait, a perturbation of one leg evokes a purposeful
bilateral response pattern, with a similar onset latency on both sides, which is
thought to be mediated at spinal level under supraspinal control [22, 24-26].
Also, there is evidence of bilateral interlimb coordination in homonymous
muscle groups in the human, as each limb affects the strength of muscle
activation and the time-space behavior of the other [27].
7
Many different groups of afferents from flexor and extensor muscles can
influence the locomotor pattern. Most attention has focused on the action of
group I afferents from ankle extensors, which contributes to 30-60% of ankle
extensor activity [28]. Feedback-mediated reinforcement of ankle extensor
muscle activity contributes, together with supraspinal drive and possibly spinal
drive (i.e., central pattern generator), to propel the body forward. During the
stance phase of the human step cycle, the ankle undergoes a natural
dorsiflexion that stretches the soleus muscle [28]. In [29], it has been reported
that the Hoffman reflex is relatively low at the time of heel contact, increases
progressively during the stance phase, and reaches its maximum amplitude in
the late stance phase. However, ankle extensor muscle velocity during normal
walking is slow [30] suggesting that group Ia afferent pathways may not be
effectively recruited during normal walking. In fact, there is a growing body of
evidence suggesting that load information provided by group Ib afferents,
arising from force-sensitive Golgi tendon organs, contributes substantially to
ongoing muscle activity. In addition, it has been suggested that tendon organ
feedback via an excitatory group Ib pathway contributes to the late stance
enhancement of the soleus muscle activity [31]. In [32], it has been found that
electrical stimulation of an extensor nerve at group I strength during walking in
8
the cat spinal substantially increased ongoing activity in other extensor muscles
(medial and lateral gastrocnemius).
Taking into account the above and that ground reaction force (GRF) is
regarded as a representative measurement of gait, because it is the external
force involved in walking and affects the acceleration of the body’s centre of
mass [33], the main purpose of this study is to investigate how much a relatively
simple measure such as the heel strike force can explain plantar flexor muscle
activity during propulsion of the contralateral leg. Such knowledge can, for
instance, be used to evaluate patients’ gait and the efficacy of prosthetic and
orthotic devices. The results obtained will also contribute to understand the
mechanisms involved in the double support phase of walking, specifically the
function of plantar flexors.
2. Methods
2.1 Subjects
Thirty-five healthy female subjects were tested (age = 19.7±1.3 years,
height = 1.65±0.045 m, body weight = 56±5.4 kg, non-dominant Q angle =
14.57±0.85 degrees; dominant Q angle = 14.7±0.96 degrees; mean±S.D.).
Individuals not matching at least one of the following criteria were excluded:
history of recent osteoarticular or musculotendon injury of the lower limb or
signs of neurological dysfunction which could affect lower limb motor

9
performance; history of lower limb surgery; lower limb anatomical deformities, Q
angle below 14º or above 17º [18]. Biomechanical changes resulting from
abnormal alignment may influence joint loads, the mechanical efficiency of
muscles, and proprioceptive orientation and feedback from the hip and knee,
resulting in altered neuromuscular function and control of lower limbs [19]. All
subjects were right-leg dominant.
The study conformed to the ethical norms of the Institutions involved and
to the Declaration of Helsinki, dated 1964. Informed consent was obtained from
all participants.
2.2 Instrumentation
Vertical (Fz), anteroposterior (Fy) and mediolateral (Fx) GRF values were
obtained from a force plate, model FP4060-10, from Bertec Corporation (USA),
connected to a Bertec AM 6300 amplifier, with default gains and a 1000 Hz
sampling rate. The amplifier was connected to a Biopac 16-bit analogical-digital
converter, from BIOPAC Systems, Inc. (USA). The floor and the underlying
structure were rigid and flat to minimise any vibrations. Also, the top of the force
plate was at the floor level, which was obtained by having a raised walkway. To
avoid measurement errors, a gap of 1-2 mm was left between the force plate
and the surrounding floor. Reliability of measurements of GRF magnitude has
an intraclass correlation coefficient (ICC) of 0.88 [34]. Medial gastrocnemius
10
(MG) electromyographic activity (EMGa) was monitored using Biopac Systems,
Inc – MP 150 Workstation; TD150B steel electrodes were used with bipolar
configuration, 20 mm between detection surfaces (centre to centre) and a
reference electrode. At preferred walking speeds the total energy of the mean
EMG value averaged across the gait cycle has been shown to be highly
consistent [35]. Gait timing was measured by the Brower Timing system (IRD-
T175, Utah, USA), which presents a sensitivity of 0.01 seconds. For each
subject, the time interval measured was used to calculate the mean speed of
walking in each trial. Two pressure transducers (TSD111, BIOPAC Systems,
Inc.) were used to access gait cycles of the trailing leg. Q angle measurement
was performed with a Baseline universal goniometer. Intra-rater reliability for
measuring Q-angle in the supine position presents ICC values of 0.94 [36]. Skin
impedance was measured with an Electrode Impedance Checker (Noraxon
USA, Inc.). Signals obtained from the force plate, the electromyography and the
pressure transducer were processed with Acqknowledge, version 3.8, from
BIOPAC Systems, Inc.
2.3 Procedures
Subjects were asked to perform two series of three trials of walking at
self-selected speed, as three strides of EMG data per subject provide reliable
information [35]. The EMGa of the MG muscle of one leg (the trailing leg) and

11
the GRF of the contralateral leg (the leading leg) were collected. In the first
series, the EMGa of the dominant limb during propulsion and the GRF of the
non-dominant limb at heel strike were monitored. In the second series, we
collected the EMG signal of the non-dominant limb during propulsion and the
GRF of the dominant limb at heel strike. Measurements were randomised to
prevent possible influence from order or learning effects. The lateral
gastrocnemius was not measured as it has been documented that EMG
patterns of both heads of the gastrocnemius are similar in terms of the timing of
activation during walking [20, 37]. In addition, it appears that the MG plays an
important role in forward propulsion, whereas the soleus does not [38].
a) Skin and instrument preparation
Skin surface of the subjects’ lower limbs was prepared to reduce electrical
resistance to less than 5000 Ω [39]: shaving of the MG area; removal of dead
skin cells with alcohol; removal of non-conductor elements with abrasive pad
[40]. Measurement electrodes were placed at the MG centre, according to [41],
and fixed with adhesive tape, to prevent displacement and to guarantee
homogeneous and constant pressure. The reference electrode was placed on
the patella. Between electrodes positioning and the beginning of measurements
we set an interval not lower than 5 minutes [42]. Mean walking speed was
verified using a photoelectric timing system, with sensors positioned 0.95 m

12
apart, at floor level, on both sides of the force plate. Pressure transducers were
placed on default anatomic locations (calcaneal centre and first
metatarsophalangeal joint), which helped to measure the gait cycle time of the
leg which had no contact with the plate [43]. All subjects used the same shoe
type, in their size.
b) Measurement
All subjects walked along a 10 m walkway, as 10-12 m is the preferable
interval to measure gait of young people, since it permits fast walkers to ‘get
into their stride’ before any measurements are made [44]. Subjects were
instructed to step on a force plate located in the middle of the walkway and to
keep walking past the reference point without stopping. In each measurement,
only the limb on which the GRF was measured had full contact with the plate
and there was no extra load on it. Subjects walked for a minimum of 8 steps
[45, 46]. According to the concept of gait optimisation, it is hypothesised that the
neuromuscular locomotor system is best stabilised at the usual walking speed,
that is to say, gait variability is also minimised at the usual walking speed [47-
49]. Therefore, walking speed was freely chosen by each subject. Before the
data acquisition session itself, subjects executed several trials to get used to the
procedures.

13
EMGa data were collected by a one-channel unit at 1000 Hz. The signals
were pre-amplified at the electrode site and then fed into a differential amplifier
with an adjustable gain setting (12 - 500 Hz; CMRR: 95 dB at 60 Hz, input
impedance of 100 MΩ and gain of 1000). Raw signals were digitised and stored
on computer disks for subsequent analysis by the Acqknowledge software. After
measurement, the EMG signal of MG during propulsion was processed and
analised. Propulsion was defined as the time between the beginning of weight
transfer from the calcaneous to the first metatarsophalangeal joint and the
maximum peak of load of the first metatarsophalangeal joint. To guarantee valid
results, we have previously taken measurements in each limb both with
pressure (foot) switches and with the force plate. Comparing the signals
obtained, we have concluded that by positioning pressure switches according to
the indicated, we could use the defined time window to assess the EMG activity
of the GM during propulsion. The EMG signal of MG during propulsion was
filtered digitally with a zero-lag, second-order Butterworth filter with an effective
band pass of 20–500 Hz and the root mean square (RMS) was calculated [40].
The signal was also normalised according to maximal voluntary contraction to
reduce subject variability and to convert the EMG amplitude to an estimate of
muscle activation [50]. Following a warm-up consisting of three submaximal
isometric contractions, each subject was instructed to perform one series of

14
three trials of maximal isometric plantar flexion force. Subjects were standing
with the hip at 90º, the knee extended and the ankle in neutral position. They
were asked to execute maximal isometric force for plantar flexion, under
resistance, during 5 seconds, with one-minute rest between trials, being
conformed that there was no EMGa [51]. The signals collected within the first
and last seconds of each 5 seconds of isometric contraction were not used for
analysis because of the possible occurrence of ankle movement at the initiation
and completion of the test. Therefore, a 3-second window of EMG signal was
used for analysis. This window of raw EMGa was processed using the RMS
procedure to assess the electrical activity of the MG muscle.
GRF components (Fx, Fy and Fz) were filtered with a Butterworth filter and
normalised according to weight [49, 52]. The maximum value of the heel strike
impulse peak in the Fz, Fy and Fx trace were used for analysis. To account for
possible effects due to anthropometrics, gait speed was normalized to leg
length [53, 54]. To reduce the within-individual variability and increase statistical
power, the calculated variables for the three trials for each subject were
averaged [55].
2.4 Statistics
Data analysis was performed using the Statistical Package Social
Science (SPSS), version 13.0, from SPSS Inc. (USA). Shapiro-Wilk test results

15
and Histogram analysis have shown that data were normally distributed; as a
result, we have used parametric statistics. The Paired-Samples T Test was
applied to assess possible significant differences between dominant and non-
dominant limbs in terms of EMGa during propulsion and GRF during heel strike.
The Pearson Correlation Coefficient Test was used to assess the correlation
between MG EMGa and GRF and between EMGa/GRF and speed.
3. Results
Figures 1-3 demonstrate the correlation between the EMGa of the non-
dominant leg during propulsion and the GRF of the dominant leg during heel
strike and between the EMGa of the dominant leg during propulsion and the
GRF of the non-dominant leg during heel strike. According to the Pearson
Correlation Coefficient Test, there was moderate correlation between the MG
EMGa of the dominant leg during propulsion and Fz and Fy of the contralateral
leg during heel strike (r=0.797, p<0.0001; r=-0.807, p<0.0001) and weak and
moderate correlation between the MG EMGa of the non-dominant leg during
propulsion and Fz and Fy, respectively, of the dominant leg during heel strike
(r=0.442, p=0.018; r=-0.684, p<0.0001). These correlations indicate that the
amount of variability in MG EMGa of the dominant leg explained by Fz and Fy
of the contralateral leg is 63.5% and 65.12%, and that the amount of variability
in MG EMGa of the non-dominant leg explained by Fz and Fy of the
16
contralateral leg is 19.5% and 46.8%, respectively. Figure 4 shows how raw
EMG signal and GRF profile vary for both limbs. No statistically significant
correlations were observed between Fx of the dominant leg and EMGa of the
contralateral leg (r=0.189, p=0.276) and between Fx of the non-dominant leg
and EMGa of the contralateral leg (r=-0.184, p=0.291).
Although subjects walked at their comfortable speed and values of
standard deviation between subjects were low, it was important to analyse the
influence of speed variation on EMGa and GRF. The Pearson Correlation
Coefficient Test showed a non-significant correlation between speed and EMGa
of dominant (r=0.104, p=0.551) and non-dominant limbs (r=-0.187, p=0.282)
and between speed and Fz, Fy and Fx of dominant (r=-0.102, p=0.558; r=-
0.192, p=0.269; r=-0.284, p=0.099) and non-dominant limbs (r=0.055, p=0.792;
r=-0.39, p=0.823; r=-0.017, p=0.923).
Comparing EMGa and GRF values obtained in dominant and non-
dominant limbs (Table 1), there is not enough statistical evidence to conclude
that there are significant differences in Fz and Fy at heel strike (p=0.18;
p=0.358) and MG EMGa during propulsion (p=0.08). Differences were observed
between Fx of dominant and non-dominant limbs at heel-strike (p<0.0001).
4. Discussion and Conclusions

17
The importance of active work during propulsion [56-58] leads to the
need of understanding the mechanisms involved in step-to-step transition, and
more specifically to assess the influence of the contralateral leg heel strike on
the degree of ankle plantar flexors’ muscle activity.
Experiments in this study have shown a statistically significant correlation
between the MG EMGa of the dominant leg during propulsion and Fz and Fy of
the contralateral limb during heel strike and between the MG EMGa of the non-
dominant leg and Fz and Fy of the contralateral limb at heel strike. According to
the double-inverted pendulum model, the activity of the leading leg in the double
support phase can be designated by heel strike, as the force directed along the
leg executes negative work. On propulsion of the trailing leg, an equal amount
of positive work is performed, arousing the need to restore energy loss in the
following heel strike. Transition between steps reaches an optimum level when
propulsion and heel strike have the same magnitude and a short duration [7].
Looking at the step-to-step mechanism presented in [6, 7], the results of this
study suggest that Fz and Fy are associated to the amount of activity required
by the MG of the contralateral limb, which is consistent to the role of plantar
flexors during propulsion, as they have been considered important contributors
to vertical and horizontal acceleration [16, 17, 59, 60]. This finding corroborates
the concept that the power activity of the trailing leg (propulsion) is related to

18
that of the leading leg (stabilisation), and that the interaction between muscle
powers during gait can reflect specific propulsion and control strategies that are
related to each limb [61].
In this study, ankle plantar flexor activation timing has not been analysed;
however, it seems that the activity of medial gastrocnemius activity preceded
the contralateral heel strike, which is not surprising since, when a muscle is
activated, it takes time before the muscle force is fully developed. The time
taken to reach maximum force depends on factors such as muscle fiber type,
activation level and contraction dynamics, but for isometric contractions, it
ranges between 23-73 ms [62-64]. The preactivation period occurred before
heel strike, and muscle activity within this period, is the result of feedforward
control mechanisms. This is consistent with the evidence that the spinal co-
ordination of bilateral leg muscle activation depends on a facilitation by
supraspinal centres. Indeed, cerebellar contribution via reticulo-spinal neurons
has been suggested in humans [65] and recent evidence was presented for a
cortical (supplementary motor area) control of interlimb co-ordination [66].
Considering the information pointed above, it would be important in future
studies to analyse plantar ankle flexors timing activity during double support.
It is becoming more and more accepted that, in addition to neural
mechanisms, the mechanical properties of the body play a primary role in the

19
dynamics and intrinsic frequencies with the complex nonlinear properties, to
which the frequencies, phases and shapes of motoneuron signals must be
adapted for efficient locomotion and motor control [67]. The results of this study
demonstrate that there is a relation between the mechanics of the leading leg
and the muscle activity of the trailing leg during step-to-step transition. The
importance of ankle muscle activity in step-to-step transition is expressed in
studies dedicated to this mechanism in transtibial amputed subjects [68] and
subjects with total ankle arthroplasty [21]. These studies indicate that ankle
impairment leads to a decrease of positive work by the trailing leg and a
consequent increase of negative work by the leading leg, which partially
explains the increased metabolic cost of walking. The results of our study
demonstrate a higher correlation between MG EMGa and Fy, which
corroborates its major importance in forward propulsion [38]. On the other hand,
no significant correlation was observed between Fx at heel strike and MG
EMGa during propulsion, which can result not only from the fact that MG major
role is related to trunk support and forward displacement [16, 17] but also from
the fact that Fx is the highest variable component [60]. This higher variability
can explain the differences observed between dominant and non-dominant
limbs at heel strike.

20
As to the results obtained, there are two important questions that need
discussion. First, different values of Pearson correlation have been noted
between the EMGa of dominant and non-dominant limbs and the GRF of
contralateral limbs (the first have presented a moderate correlation and the
second only a weak correlation). Differences between dominant and non-
dominant limbs have been reported frequently, as lower limbs are not used
equally during walking [69]. This asymmetry has been interpreted based on the
support and mobility associated to each limb [70-72], as one leg contributes
more to propulsion while the contralateral one is mainly responsible for support
and body weight transfer during walking (dominant and non-dominant limbs,
respectively) [73-75]. Therefore, it can be hypothesised that the higher
correlation between the EMGa of the dominant limb and Fz and Fy of the
contralateral limb results from the fact that the dominant limb contributes more
to propulsion, and so it is more adapted to this function. On the other hand,
evidence suggests that the dominant leg is stronger in plantar flexion [76] which
allows accepting that during the double support phase, it is more related to Fz
and Fy of the contralateral leg than the non-dominant limb. The second
question is related to the growing evidence showing the compartmentalisation
of the human gastrocnemius [77-80]. It has been demonstrated that portions of
the same gastrocnemius muscle are activated differently, depending on the
21
direction of the ankle force [79], and that surface EMGs recorded from the
pinnated MG muscles are extremely selective [80]. Taking this information into
account, it would be important, in future studies, to analyse the different
activation patterns from distinct parts of the triceps surae muscle, as the
possibility of having specific, localised MG regions involved in limb propulsion
could be related to the finding that Fz and Fy only explain part of the MG EMGa.
Several studies agree that changes in walking speed are associated with
increases in the intensity of muscle activation [70, 81-85]. The results of this
study show that speed differences obtained between subjects were not related
to MG EMGa and GRF. These findings can be explained by the fact that
subjects walked at their own comfortable speed and mean values obtained
were according to reference values [86]; in addition, standard deviation values
were low, which is related to the high homogeneity of the sample. As to the
influence of speed on GRF values, the results of this study are according to the
ones obtained in [87], where the GRF increased linearly with gait speed only up
to about 60% of the subjects’ maximum speed. It is important to note that this
study only addressed the correlation of subject walking speed on MG EMGa
and GRF to exclude a possible effect of speed, as subjects were asked to walk
at a comfortable speed. However, as changes in walking speed are associated
with increases in the intensity of muscle activation and GRF magnitude, it would

22
be important, in future studies, to analyse the influence of speed on the relation
between MG EMGa of the trailing leg and GRF of the leading leg.
Another aspect that is important to note is related to the repeatibility of
GRF peak measurements and limitations of the instruments. As stated in the
instruments section, we have taken into account several considerations as to
force platform mounting to avoid measurement errors. In addition, the
coefficient of variation of GRF peak values obtained in each subject was almost
always below 12.5%. Moreover, like in the present study, several other
researchers used the GRF first peak value not only in healthy subjects [49, 88,
89] but also in subjects with pathology [90-93] and even as a measure to control
the influence of an exercise program [94]. However, considering limitations in
terms of repeteability of GRF peak measurements, it would be important in
future studies to analyse the relation between muscle activity of one limb and
the slope of the transient of GRF of the contralateral limb during double support.
Considering that the EMGa of the trailing leg was correlated with the
magnitude of Fz and Fy of the leading leg, it would be important, in future
studies, to assess how much of the negative work produced during heel strike
might be compensated by this muscle.
References

23
1. Saunders, M; Inman, T and Heberhart, D. The major determinants in normal and pathological gait . The Journal of Bone and Joint Surgery 1953, 53(3), 543-558.
2. Cavagna, G and Kaneko, M. Mechanical work and efficiency in level walking and running. Journal of Physiology 1977, 268(2), 467-481.
3. Cavagna, G and Margaria, R. Mechanics of walking. Journal of Applied Physiology 1966, 21(1), 271-278.
4. Waters, L and Mulroy, S. The energy expenditure of normal and pathological gait: relation to mechanical energy cost. Journal of Neurophysiology 1999, 9(3), 207-231.
5. Donelan, J; Kram, R and Kuo, A. A simultaneous positive and negative external mechanical work in human walking. Journal of Biomechanics 2002, 35(1), 117-124.
6. Kuo, A; Donelan, M and Ruina, A. Energetic consequences of walking like an inverted pendulum: step to step transitions. Exercise Sports Science Review 2005, 33(2), 88-97.
7. Kuo, A; Doneland, M and Ruina, A. The six determinants of gait in the inverted pendulum analogy: a dynamic walking perspective. Human Movement Science 2007, 26(4), 617-656.
8. Borghese, N; Bianchi, L and Lacquaniti, F. Kinematic determinants of human locomotion. Journal of Physiology 1996, 494(3), 863-869.
9. Arechavaleta, G; Laumond, J; Hicheur, H and Berthoz, A. An optimal principle governing human walking. IEEE Transactions on Robotics 2008, 24(1), 5-14.
10. Griffin, T; Roberts, T and Kam, R. Metabolic of generation muscular force in human walking: insights from load-carring and speed experiments. Journal of Applied Physiology 2003, 95(1), 172-183.
11. Yakovenko, S; Mashuhwar, V; Vanderhorst, V; Holstege, G and Prochazka, A. Spatiotemporal activation of lumbosacral motoneurons in the locomotor step cycle. Journal of Neurophysiology 2002, 87(3), 1542-1553.
12. Donelan, J; Kram, R and Kuo, A. Mechanical work for step-to-step transitions is a major determinant of the metabolic cost of human walking. The Journal of Experimental Biology 2002, 205(23), 3717-3727.
13. Kuo, A. Energetics of actively powered locomotion using the simplest walking model. Journal of Biomechanical Engineering 2002, 124(1), 113-120.
14. Kuo, A. Stabilization of lateral motion in passive dynamic walking. International Journal of Robotic Research 1999, 18(9), 917-930.
15. Neptune; Kautz, S and Zajac, F. Muscle force redistributes segmental power for body progression during walking. Gait & Posture 2004, 19(2), 194-205.
16. Liu, M; Anderson, F; Pandy, M and Delp, S. Muscles that support the body also modulate forward progression during walking. Journal of Biomechanics 2006, 39(14), 2623-2630.
17. Neptune, R; Kautz, A and Zajac, E. Contributions of the individual ankle flexors to support, forward progression and swing initiation during normal walking. Journal of Biomechanics 2001, 34(11), 1387-1398.

24
18. Nguyen, A; Boling, M; Levine, B and Shultz, S. Relationships between lower extremity alignment and the quadriceps angle. Clinical Journal of Sports Medicine 2009, 19(3), 201-206.
19. Shultz, S; Carcia, C; Gansneder, B and Perrin, D. The independent and interactive effects of navicular drop and quadriceps angle on neuromuscular responses to a weight-bearing perturbation. Journal of Athletic Trainning 2006, 41(3), 251-259.
20. Winter, A. Energy generation and absorption at the ankle and knee during fast, natural and slow cadences. Clinical Orthopaedics 1983, 175, 147-157.
21. Doets, H; Vergouw, D; Veeger, H and Houdijk, H. Metabolic cost and mechanical work for the step-to-step transition in walking after successful total ankle arthroplasty. Human Movement Science 2009, 28(6), 786-797.
22. Dietz, V. Human neuronal control of automatic functional movements: interaction between central programs and afferent input. Physiological Reviews 1992, 72(1), 33-69.
23. Dietz, V. Do human bipeds use quadrupedal coordination? Trends in Neurosciences 2002, 25(9), 462-467.
24. Berger, W; Dietz, V and Quintern, J. Corrective reactions to stumbling in man: neuronal co-ordination of bilateral leg muscle activity during gait. The Journal of Physiology 1984, 357(1), 109-125.
25. Dietz, V; Quintern, J; Boos, G and Berger, W. Obstruction of the swing phase during gait: phase-dependent bilateral leg muscle coordination. Brain Research 1986, 384(1), 166-169.
26. Dietz, V and Berger, W. Inter-limb coordination of posture in patients with spastic paresis: impaired function of spinal reflexes. Brain 1984, 107(Pt 3), 965-978.
27. Stubbs, P; Sinkjaer, T; Nielsen, J; Nielsen, J and Mrachacz-Kersting, N, Evidence of spinal cord mediation of interlimb coordination in the human soleus muscle, in 7th edition of Progress in Motor Control. 2009: France.
28. Sinkjaer, T; Andersen, JB and Larsen, B. Soleus stretch reflex modulation during gait in humans . Journal of Neurophysiology 1996, 76(2), 1112-1120.
29. Capaday, C and Stein, R. Difference in the amplitude of the human soleus H reflex during walking and running. Journal of Physiology 1987, 392, 513-522.
30. Fukunaga, TK, K; Kawakami, Y; Fukashiro, S; Kanehisa, H; Maganaris, C. In Vivo Behaviour of Human Muscle Tendon During Walking. Proceedings of the Royal Society London B Biological Sciences 2001, 268(1464), 229-233.
31. Grey, MJ; Nielsen, JB; Mazzaro, N and Sinkjaer, T. Positive force feedback in human walking. Journal of Physiology 2007, 581(1), 99-105.
32. Pearson, K and Collins, D. Reversal of the influence of group Ib afferents from plantaris on activity in medial gastrocnemius muscle during locomotor activity. Journal of Neurophysiology 1993, 70(3), 1009-1017.
33. Winter, A. Biomechanics and Motor Control of Human Movement. 2nd ed, New York: Wiley; 1990.
34. Hanke, A and Rogers, W. Reliability of ground reaction force measurements during dynamic transitions from bipedal to single-limb stance in healthy adults. Physical Therapy 1992, 72(11), 810-816.

25
35. Arsenault, A; Winter, D; Marteniuk, R and Hayes, K. How many strides are required for the analysis of electromyographic data in gait? Scandinavian Journal of Rehabilitation Medicine 1986, 18(3), 133-135.
36. Ferro, E. Reliability and validity of an electronic inclinometer and standart goniometer for measuring the Q-angle in two different positions in a sample of women. International Journal of Exercise Science: Conference Abstract Submissions 2010, 2(4).
37. Sutherland, D; Cooper, L and Daniel, D. The role of the ankle plantar flexors in normal walking. Journal of Bone and Joint Surgery 1980, 62(3), 354-363.
38. Gottschall, J and Kram, R. Energy cost and muscular activity required for propulsion during walking. Journal of Applied Physiology 2003, 94(5), 1766-1772.
39. Basmajian, J and De Luca, C. Muscles alive, their function revealed by electromyography. 5 th ed, USA: Williams and Wilkins; 1985.
40. Turker, K. Electromyography: some methodological problems and issues. Physical Therapy 1993, 73(10), 57-69.
41. Hermens, H; Freriks, B; Disselhorst-Klug, C and Rau, G. Development of recommendations for SEMG sensors and sensor placement procedures. Journal of Electromyography and Kinesiology 2000, 10, 361-374.
42. Vredenbregt, J and Rau, G, Surface electromyography in relation to force, muscle length and endurance, in New Developments in Electromyography and Clinical Neurophysiology, J. Desmedt, Editor. 1973, Karger: Basel.
43. Norkin, C and Levangie, K. Joint Structure and Function. A Comprehensive Analysis. 2nd ed, EUA: Library of Congress; 1992.
44. Whitle, M. Gait Analysis: An Introduction. 4th ed. Vol. 1, USA: Elsevier; 2007.
45. James, R; Herman, A; Dufek, S and Bates, T. Number of trials necessary to achieve performance stability of selected ground reaction force variables during landing. Journal of Sports Science and Medicine 2007, 6(1), 126-134.
46. Oggero, E; Pagnacco, G; Morr, R; Simon, R and Berne, N. Collecting valid data from force plates: how many subjects must alter their gait? in North American Congress on Biomechanics. 1998: Proceedings of NACOB.
47. Sekiya, N; Nagasaki, H; Ito, H and Furuna, T. Optimal walking in terms of variability in step length . Journal of Orthopaedic and Sports Physical Therapy 1997, 26(5), 266-272.
48. Shiavi, RB, HJ; Limbird, T. Electromyographic gait assessment, part 1: Adult EMG profiles and walking speed. Journal of Rehabilitation Research and Development 1987, 24(2), 13-23.
49. Masani, K; Kousaki, M and Fukunaga, T. Variability of ground reaction forces during treadmill walking. Journal of Applied Physiology 2002, 92(5), 1885-1890.
50. Medved, V. Measurement of Human Locomotion, USA: CRC Press; 2001.
51. Brown, L and Weir, J. Asep procedures recommendation I: Accurate assessment of muscular strength and power. Official Journal of the American Society of Exercise Physiologists 2001, 4(3), 1-21.

26
52. Mullineaux, D; Milner, C; Davis, I and Hamill, J. Normalization of ground reaction forces . Journal of Applied Biomechanics 2006, 22(3), 230-233.
53. Kim, C and Eng, J. Magnitude and pattern of 3D kinematic and kinetic gait profiles in persons with stroke: relationship to walking speed. Gait & Posture 2004, 20(2), 140-146.
54. Hof, A; Elzinga, H; Grimmius, W and Halbetsma, J. Speed dependence of averaged EMG profiles in walking. Gait & Posture 2002, 16(1), 78-86.
55. Mullineaux, D; Bartlett, R and Bennett, S. Research methods and statistics in biomechanics and motor control. Journal of Sports Sciences 2001, 19(10), 739-760.
56. Simon, R; Mann, A; Hagy, L and Larsen, J. Role of the posterior calf muscles in normal gait. Journal of Bone & Joint Surgery 1978, 60(4), 465-472.
57. Hill, A. The mechanics of active muscle. Proceedings of the Royal Society B: Biological Sciences 1953, 141, 104-117.
58. Doke, J and Kuo, A. Metabolic Cost of Generating Force During Human Leg Swing. in ISB XXth Congress. 2007: ABS 29th Annual Meeting.
59. Zajac, F; Neptune, R and Kautz, S. Biomechanics and muscle coordination of muscle walking Part II: Lessons from dinamic simulations and clinical implications. Gait & Posture 2003, 17(1), 1-17.
60. Winter, A. The biomechanics and motor control of human gait: normal, elthery and patological, Waterloo, Ontário: Waterloo Biomechanics Press; 1991.
61. Sadeghi, H; Allard, P; Prince, P and Labelle, H. Symmetry and limb dominance in able-bodied gait: a review. Gait & Posture 2000, 12(1), 34-45.
62. Burke, R; Levine, D; Tsairis, P and Zajac, F. Physiological types and histochemical profiles in motor units of the cat gastrocnemius. Journal of Physiology 1973, 234(3), 723-748.
63. Burke, R; Levine, D and Zajac, F. Mammalian motor units: types and histochemical profiles in motor units of the cat gastrocnemius. Science 1971, 174, 709-712.
64. Gonyea, W; Marushia, A and Dixon, J. Morphological organization and contactile properties of the wrist flexor muscles in the cat. Anat Rec 1981, 199(3), 321-339.
65. Bonnet, M; Gurfinkel, S; Lipchits, M and Popov, K. Central programming of lower limb muscle activity in the standing man. Agressologie 1976, 17, 35-42.
66. Debaere, P; Swinnen, S; Beatse, E; Sunaert, S; Van Hecke, P and Duysens, J. Brain areas involved in interlimb co-ordination: a distributed network. Neuroimage 2001, 14(5), 947-958.
67. Rybak, IS, NA; Lafreniere-Roula, M; McGrea, DA. Modelling spinal circuitry involved in locomotor pattern generation: insights from deletions during fictive locomotion. Journal of Physiology 2006, 577(2), 34-45.
68. Houdijk, H; Pollmann, E; Groenewold, M; Wiggerts, H and Polomski, W. The energy cost fot the step-to-step transition in amputee walking. Gait & Posture 2009, 30(1), 35-40.
69. DuChatinier, K and Rozendal, R. Temporal symmetry gait of selected normal subjects . Anatomy 1970, 73(4), 353-361.
70. Hirasawa, Y. An observation on standing hability of Japonese males and females Journal of the Anthropological Society of Nippon 1979, 87(2), 81-92.

27
71. Hirasawa, Y. Left leg-supporting human straight (bipedal) standing. Saiensu 1981, 6, 32-44.
72. Vanden-Abeele, J. Comments on the funtional asymmetry of the lower extremities. Cortex 1980, 16(2), 325-329.
73. Peters, M. Footedness: asymmetries in foot preference and skill and neuropsychological assessment of foot movement. Psychological Bulletin 1988, 103(2), 179-192.
74. Gabbard, C. Foot lateralization and psychomotor control in four-years olds. Percept Motor Skills 1989, 68(2), 675-678.
75. Dargent-Pare, C; M, DA; Mesbah, M and Dellatolas, G. Foot and eye preferences in adults: relationship with handedness, sex and age. Cortex 1992, 28(3), 343-351.
76. Damholt, V and Termansen, N. Asymmetry of plantar flexion strength in the foot. Acta Orthopaedica Scandinavica 1978, 49(2), 215-219.
77. Wolf, S and Kim, J. Morphological analysis of the human tibialis anterior and medial gastrocnemius muscles. Acta Anatomica 1997, 158(4), 287-295.
78. McLean, L and Goudy, N. Neuromuscular response to sustained low-level muscle activation: with- and between-synergist substitution on the triceps surae muscles. European Journal of Applied Physiology 2004, 91(2-3), 204-216.
79. Staudenmann, D; Kingma, I; Daffertshofer, A; Stegeman, D and van Dieen, J. Heterogeneity of muscle activation in relation to force direction: a multi-channel surface electromyography study of triceps surae muscle. Journal of Electromyography and Kinesiology 2009, 19(5), 882-895.
80. Vieira, T; Loram, I; Muceli, S; Merletti, R and Farina, D. Postural activation of the human medial gastrocnemius muscle: are the muscle units spatially localised? Journal of Physiology 2010, 589.2, 431-443.
81. Singh, I. Functional asymmetry in the lower limbs. Acta Anatomica 1970, 77(1), 131-138.
82. Crowe, A; Schiereck, P; de Boer, R and Keessen, W. Characterization of human gait by means of body center of mass oscillations derived from ground reaction forces. IEEE Transactions on Biomedical Engineering 1995, 42(3), 293-303.
83. den Otter, A; Geurts, A; Mulder, T and Duysens, J. Speed related changes in muscle activity from normal to very slow walking speeds. Gait & Posture 2004, 19, 270-278.
84. Ivanenko, Y; Poppele, R; Macellari, V and Lacquaniti, F. Five basic muscle activation patterns account for muscle activity during human locomotion. Journal of Physiology 2004, 556(1), 267-282.
85. Crowe, A; Schiereck, P; de Boer, R and Keessen, W. Characterization of gait of young adult females by means of body centre of mass oscillations derived from ground reaction forces. Gait & Posture 1993, 1(1), 61-68.
86. Bohannon, R. Comfortable and maximum walking speed of adults aged 20-79 years: reference values and determinants. Age and Ageing 1997, 26, 15-19.
87. Keller, T; Weisberger, A; Ray, J; Hasan, S; Shiavi, R and Spengler, D. Relationship between vertical ground reaction force and speed during walking, slow jogging, and running. Clinical Biomechanics 1996, 11(5), 253-259.
28
88. Simpson, KJ and Jiang, P. Foot landing position during gait influences ground reaction forces. Clinical Biomechanics 1999, 14(6), 396-402.
89. Cook, T; Farrell, K; Carey, I; Gibbs, J and Wiger, G. Effects of restricted knee flexion and walking speed on the vertical ground reaction force during gait. Journal of Orthopaedic and Sports Physical Therapy 1997, 25(4), 236-244.
90. McCrory, JL; White, SC and Lifeso, RM. Vertical ground reaction forces: objective measures of gait following hip arthroplasty. Gait & Posture 2001, 14(2), 104-109.
91. Levinger, P and Gilleard, W. Tibia and rearfoot motion and ground reaction forces in subjects with patellofemoral pain syndrome during walking. Gait & Posture 2007, 25(1), 2-8.
92. Chockalingam, N; Dangerfield, P; Rahmatalla, A; Ahmed, E and Cochrane, T. Assessment of ground reaction force during scoliotic gait. European Spine Journal 2004, 13(8), 750-754.
93. Winiarski, S and Rutkowska-Kucharska, A. Estimated ground reaction forces in normal and pathological gait. Acta of Bioengineering and Biomechanics 2009, 11(1), 53-60.
94. Nyland, J; Burden, R; Krupp, R and Caborn, DNM. Single leg jumping neuromuscular control is improved following whole body, long-axis rotational training. Journal of Electromyography and Kinesiology 2011, 21(2), 348-355.
29
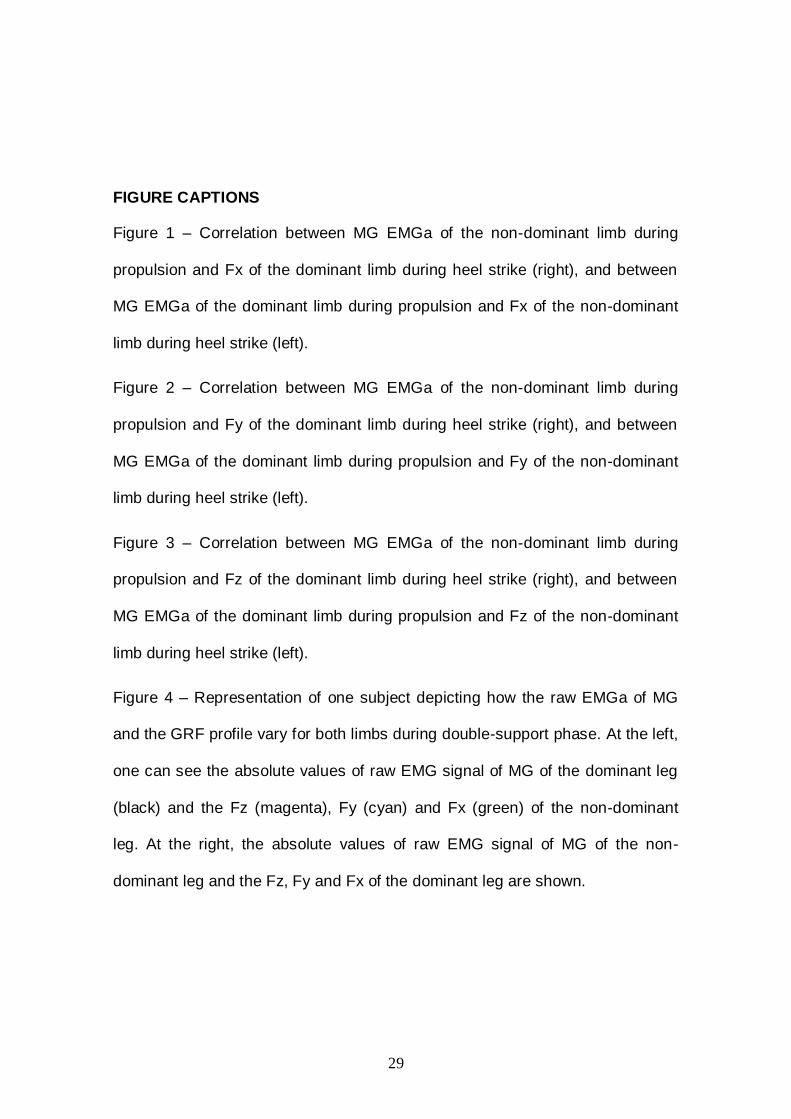
FIGURE CAPTIONS
Figure 1 – Correlation between MG EMGa of the non-dominant limb during
propulsion and Fx of the dominant limb during heel strike (right), and between
MG EMGa of the dominant limb during propulsion and Fx of the non-dominant
limb during heel strike (left).
Figure 2 – Correlation between MG EMGa of the non-dominant limb during
propulsion and Fy of the dominant limb during heel strike (right), and between
MG EMGa of the dominant limb during propulsion and Fy of the non-dominant
limb during heel strike (left).
Figure 3 – Correlation between MG EMGa of the non-dominant limb during
propulsion and Fz of the dominant limb during heel strike (right), and between
MG EMGa of the dominant limb during propulsion and Fz of the non-dominant
limb during heel strike (left).
Figure 4 – Representation of one subject depicting how the raw EMGa of MG
and the GRF profile vary for both limbs during double-support phase. At the left,
one can see the absolute values of raw EMG signal of MG of the dominant leg
(black) and the Fz (magenta), Fy (cyan) and Fx (green) of the non-dominant
leg. At the right, the absolute values of raw EMG signal of MG of the non-
dominant leg and the Fz, Fy and Fx of the dominant leg are shown.

30
TABLE CAPTION
Table 1 – Mean and standard deviation values of EMGa during propulsion and
GRF at heel strike in dominant and non-dominant members and speed.

31
FIGURES
Figure 1
Figure 2
Figure 3

32
Figure 4

33
TABLES
Table 1
Trial Component N Mean Standard deviation
1
Dominant EMG
35
0.3110 0.0689
Non-dominant:
Fz 1.0240 0.10960
Fy 0.0917 0.01677
Fx 0.0691 0.02771
Speed 0.3010 0.04930
2
Non-dominant EMG
0.3330 0.06090
Dominant:
Fz 1.0120 0.10570
Fy 0.0941 0.01421
Fx 0.0811 0.02329
Speed 0.4490 0.06060
Related Documents