Department of Chemical & Biomolecular Engineering Senior Design Reports (CBE) University of Pennsylvania Year Anaerobic Fermentation of Glycerol to Ethanol Chloe LeGendre Eric Logan University of Pennsylvania University of Pennsylvania Jordan Mendel Tamara Seedial University of Pennsylvania University of Pennsylvania This paper is posted at ScholarlyCommons. http://repository.upenn.edu/cbe sdr/5

Welcome message from author
This document is posted to help you gain knowledge. Please leave a comment to let me know what you think about it! Share it to your friends and learn new things together.
Transcript
Department of Chemical & Biomolecular Engineering
Senior Design Reports (CBE)
University of Pennsylvania Year
Anaerobic Fermentation of Glycerol to
Ethanol
Chloe LeGendre Eric LoganUniversity of Pennsylvania University of Pennsylvania
Jordan Mendel Tamara SeedialUniversity of Pennsylvania University of Pennsylvania
This paper is posted at ScholarlyCommons.
http://repository.upenn.edu/cbe sdr/5
LeGendre, Logan, Mendel, Seedial
1
Anaerobic Fermentation of
Glycerol to Ethanol Senior Design Project
Chloe LeGendre
Eric Logan
Jordan Mendel
Tamara Seedial
Submitted to:
Professor Leonard Fabiano
Professor Warren Seider
April 6, 2009
Chemical and Biomolecular Engineering CBE 459
Chemical and Biomolecular Engineering Department
University of Pennsylvania
LeGendre, Logan, Mendel, Seedial
2
Professor Leonard Fabiano Professor Warren Seider Chemical and Biomolecular Engineering Department University of Pennsylvania Philadelphia, PA 19104 April 6, 2009 Dear Professor Fabiano and Professor Seider,
Contained within this report is the design of a process to convert crude glycerol to ethanol for fuel consumption via the anaerobic fermentation of the feedstock by a wild strain of the microorganism Escherichia coli. As suggested by industrial consultant Mr. Bruce Vrana (DuPont), we have designed a plant to produce 50 MM gallons of denatured fuel ethanol annually using a combination of batch fermentation and continuous processing.
The plant design that we suggest is comprised of a continuous feed preparation section, a batch
fermentation section, and a subsequent continuous separation section for the recovery of ethanol and succinic acid (a valuable fermentation side-product). In the feed preparation section, crude glycerol, a byproduct from the biodiesel industry, is treated to remove salts and other impurities and then mixed with a nutrient supplement, diluted, and sterilized. In the batch fermentation section, this sterile glycerol feed is anaerobically metabolized by the E. coli, resulting in the formation of ethanol and succinic acid. The broth and vapor from the fermentation section are then sent to the separation section of the plant for product recovery.
Although the design uses a hypothetical strain of Escherichia coli as per the problem statement, researchers Dharmadi, Murarka, and Gonzalez of Rice University present a case for the same fermentation process in existing Escherichia coli. As such, the design presented here is physically feasible. The design has a good economic outlook, assuming that crude oil prices continue to rise and that political support for renewable fuels continues. The process is projected to have an approximate investor’s rate of return (IRR) of 32.24% on a total capital investment of about $108 MM. The net present value was estimated to be $95 MM based on an interest rate of 15%. Additionally, the energy consumption of the process was determined to be 8,000 BTU/gallon of ethanol, well below the 35,000 BTU/gallon energy benchmark provided in the problem statement.
If you have any questions, comments, or concerns regarding the report, please do not hesitate
to contact us. We want to thank you very much for your support throughout the duration of the project and your present consideration.
Sincerely, Chloe LeGendre Eric Logan Jordan Mendel Tamara Seedial
LeGendre, Logan, Mendel, Seedial
3
Table of Contents Abstract ................................................................................................................................................... 7
A. Process Overview .......................................................................................................................... 10
B. Importance for the Study .............................................................................................................. 11
C. Initial Project Charter .................................................................................................................... 16
Market and Competitive Analysis........................................................................................................... 17
Process Flowsheets and Material Balances............................................................................................ 24
Process Description ............................................................................................................................... 42
Fermentation Feed Preparation Section ............................................................................................. 43
Laboratory Section ............................................................................................................................. 46
Plant Seed Fermentation Section ....................................................................................................... 48
Main Fermentation Section................................................................................................................ 50
Separation Section ............................................................................................................................. 53
Energy Balance and Benchmark ............................................................................................................. 56
Unit Descriptions ................................................................................................................................... 61
Feed Preparation Section ................................................................................................................... 62
Storage Tanks: ............................................................................................................................... 62
Heat Exchangers: ........................................................................................................................... 65
Pumps:........................................................................................................................................... 66
Miscellaneous: ............................................................................................................................... 69
Seed Fermentation Train (Plant and Lab) ........................................................................................... 70
Fermenters: ................................................................................................................................... 70
Pumps:........................................................................................................................................... 73
Main Fermentation Section................................................................................................................ 77
Fermenters: ................................................................................................................................... 77
Storage Tanks: ............................................................................................................................... 79
Heat Exchangers: ........................................................................................................................... 79
Pumps:........................................................................................................................................... 80
Blowers: ......................................................................................................................................... 83
Separation Section ............................................................................................................................. 84
Storage Tanks: ............................................................................................................................... 84
Heat Exchangers: ........................................................................................................................... 85
LeGendre, Logan, Mendel, Seedial
4
Pumps:........................................................................................................................................... 87
Blowers: ......................................................................................................................................... 90
Columns: ........................................................................................................................................ 91
Miscellaneous: ............................................................................................................................... 93
Unit Specification Sheets ....................................................................................................................... 97
Feed Preparation Section: .................................................................................................................. 98
Storage Tanks: ............................................................................................................................... 98
Heat Exchangers: ......................................................................................................................... 104
Pumps:......................................................................................................................................... 106
Miscellaneous: ............................................................................................................................. 112
Seed Fermentation Section (Plant and Lab): ..................................................................................... 113
Fermenters: ................................................................................................................................. 113
Pumps:......................................................................................................................................... 119
Main Fermentation Section:............................................................................................................. 126
Fermenters: ................................................................................................................................. 126
Storage Tanks: ............................................................................................................................. 128
Heat Exchangers: ......................................................................................................................... 130
Pumps:......................................................................................................................................... 131
Blower: ........................................................................................................................................ 136
Separation Section: .......................................................................................................................... 137
Storage Tanks: ............................................................................................................................. 137
Heat Exchangers: ......................................................................................................................... 142
Pumps:......................................................................................................................................... 146
Blowers: ....................................................................................................................................... 153
Columns: ...................................................................................................................................... 154
Miscellaneous: ............................................................................................................................. 156
Alternate Units and Considerations ..................................................................................................... 164
Other ................................................................................................................................................... 167
Considerations ..................................................................................................................................... 167
Environmental Considerations ............................................................................................................. 171
Economic Analysis ............................................................................................................................... 174
Equipment Cost Estimates ............................................................................................................... 175

LeGendre, Logan, Mendel, Seedial
5
Utility Requirements ........................................................................................................................ 178
Operating Costs ............................................................................................................................... 181
Sensitivity Analysis ............................................................................................................................... 190
Crude Oil.......................................................................................................................................... 191
Glycerol ........................................................................................................................................... 196
Succinic Acid .................................................................................................................................... 197
Conclusion ........................................................................................................................................... 198
Bibliography ........................................................................................................................................ 200
Acknowledgements ............................................................................................................................. 204
Appendices .......................................................................................................................................... 206
Sensitivity Analysis ........................................................................................................................... 207
Correlation Example ........................................................................................................................ 207
Equipment Costing and Sizing Calculations ....................................................................................... 210
Agitators: ..................................................................................................................................... 211
Blowers: ....................................................................................................................................... 213
Crystallizer (C-1) ........................................................................................................................... 214
Distillation Towers: ...................................................................................................................... 215
Dryer: .......................................................................................................................................... 217
Electro-dialysis: ............................................................................................................................ 218
External Heat Losses from FERM1-12 ........................................................................................... 219
Fermenter Tanks: ......................................................................................................................... 220
Fermenter Tank Costs .................................................................................................................. 223
Furnace: ....................................................................................................................................... 224
Glycerol Purification System:........................................................................................................ 225
Heat Exchangers .......................................................................................................................... 226
Heat of Reaction Calculation for determining Temperature Change in Reactors ........................... 231
Molecular Sieves: ......................................................................................................................... 232
Pumps .......................................................................................................................................... 233
Reflux Accumulator: ..................................................................................................................... 238
Rotary Drum Vacuum Filter: ......................................................................................................... 239
Screw Conveyor: .......................................................................................................................... 240
Spray Nozzles for Clean-In-Place System ...................................................................................... 241

LeGendre, Logan, Mendel, Seedial
6
Storage, Mixing, and Holding Tanks .............................................................................................. 242
R-101 Glycerol Purification System Patent Application ..................................................................... 244
Glycerol Purification System Supplier Information ........................................................................... 262
Specifications ............................................................................................................................... 263
Key Features ................................................................................................................................ 264
Space, Utility, and Tank Requirements ......................................................................................... 264
Maintenance ................................................................................................................................ 264
Carbon Dioxide Cap and Trade Legislation........................................................................................ 265
Problem Statement .......................................................................................................................... 269
Relevant MSDS ................................................................................................................................ 274

LeGendre, Logan, Mendel, Seedial
7
Abstract Section I
LeGendre, Logan, Mendel, Seedial
8
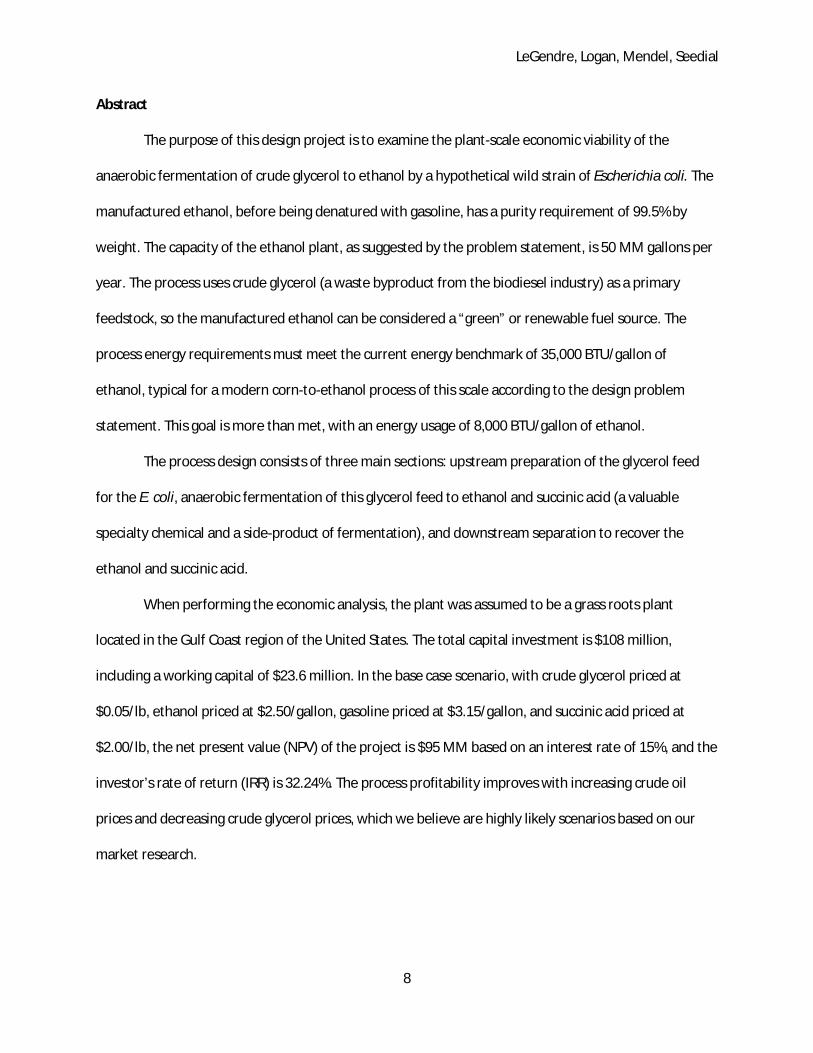
Abstract
The purpose of this design project is to examine the plant-scale economic viability of the
anaerobic fermentation of crude glycerol to ethanol by a hypothetical wild strain of Escherichia coli. The
manufactured ethanol, before being denatured with gasoline, has a purity requirement of 99.5% by
weight. The capacity of the ethanol plant, as suggested by the problem statement, is 50 MM gallons per
year. The process uses crude glycerol (a waste byproduct from the biodiesel industry) as a primary
feedstock, so the manufactured ethanol can be considered a “green” or renewable fuel source. The
process energy requirements must meet the current energy benchmark of 35,000 BTU/gallon of
ethanol, typical for a modern corn-to-ethanol process of this scale according to the design problem
statement. This goal is more than met, with an energy usage of 8,000 BTU/gallon of ethanol.
The process design consists of three main sections: upstream preparation of the glycerol feed
for the E. coli, anaerobic fermentation of this glycerol feed to ethanol and succinic acid (a valuable
specialty chemical and a side-product of fermentation), and downstream separation to recover the
ethanol and succinic acid.
When performing the economic analysis, the plant was assumed to be a grass roots plant
located in the Gulf Coast region of the United States. The total capital investment is $108 million,
including a working capital of $23.6 million. In the base case scenario, with crude glycerol priced at
$0.05/lb, ethanol priced at $2.50/gallon, gasoline priced at $3.15/gallon, and succinic acid priced at
$2.00/lb, the net present value (NPV) of the project is $95 MM based on an interest rate of 15%, and the
investor’s rate of return (IRR) is 32.24%. The process profitability improves with increasing crude oil
prices and decreasing crude glycerol prices, which we believe are highly likely scenarios based on our
market research.

LeGendre, Logan, Mendel, Seedial
9
Introduction Section II
LeGendre, Logan, Mendel, Seedial
10
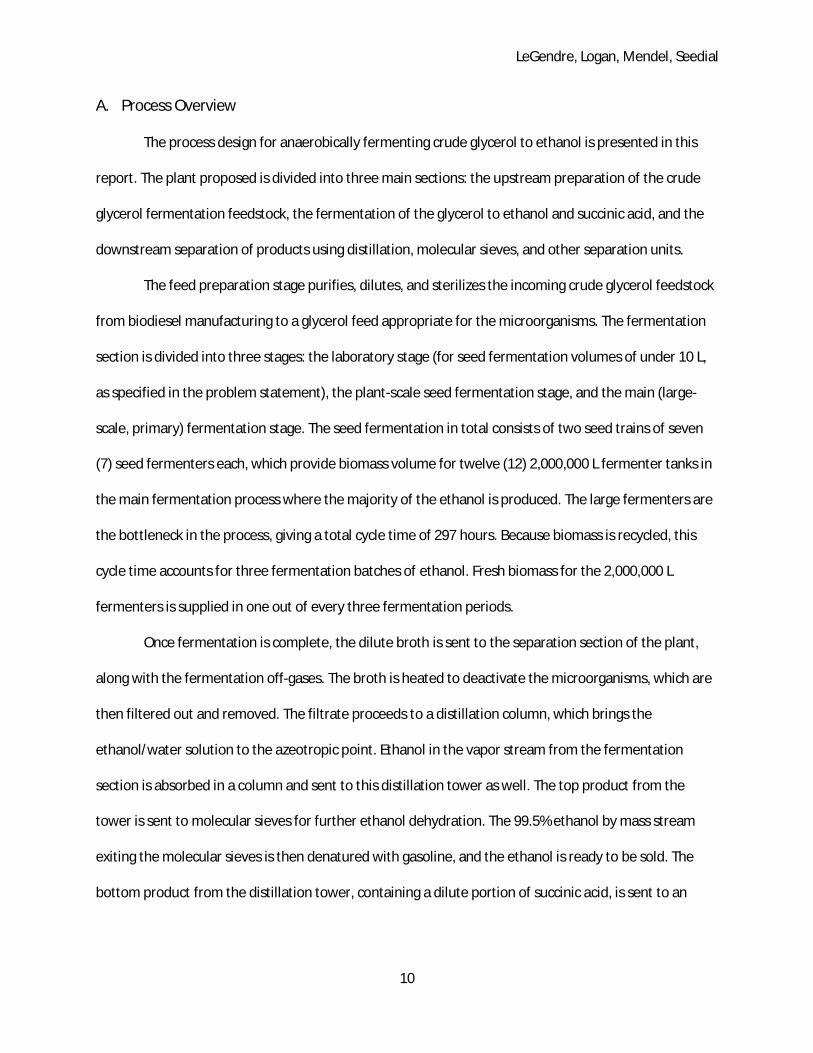
A. Process Overview The process design for anaerobically fermenting crude glycerol to ethanol is presented in this
report. The plant proposed is divided into three main sections: the upstream preparation of the crude
glycerol fermentation feedstock, the fermentation of the glycerol to ethanol and succinic acid, and the
downstream separation of products using distillation, molecular sieves, and other separation units.
The feed preparation stage purifies, dilutes, and sterilizes the incoming crude glycerol feedstock
from biodiesel manufacturing to a glycerol feed appropriate for the microorganisms. The fermentation
section is divided into three stages: the laboratory stage (for seed fermentation volumes of under 10 L,
as specified in the problem statement), the plant-scale seed fermentation stage, and the main (large-
scale, primary) fermentation stage. The seed fermentation in total consists of two seed trains of seven
(7) seed fermenters each, which provide biomass volume for twelve (12) 2,000,000 L fermenter tanks in
the main fermentation process where the majority of the ethanol is produced. The large fermenters are
the bottleneck in the process, giving a total cycle time of 297 hours. Because biomass is recycled, this
cycle time accounts for three fermentation batches of ethanol. Fresh biomass for the 2,000,000 L
fermenters is supplied in one out of every three fermentation periods.
Once fermentation is complete, the dilute broth is sent to the separation section of the plant,
along with the fermentation off-gases. The broth is heated to deactivate the microorganisms, which are
then filtered out and removed. The filtrate proceeds to a distillation column, which brings the
ethanol/water solution to the azeotropic point. Ethanol in the vapor stream from the fermentation
section is absorbed in a column and sent to this distillation tower as well. The top product from the
tower is sent to molecular sieves for further ethanol dehydration. The 99.5% ethanol by mass stream
exiting the molecular sieves is then denatured with gasoline, and the ethanol is ready to be sold. The
bottom product from the distillation tower, containing a dilute portion of succinic acid, is sent to an

LeGendre, Logan, Mendel, Seedial
11
electro-dialysis unit that concentrates this solution so that succinic acid can then be crystallized out of
solution. Succinic acid crystals are then dried and sold.
B. Importance for the Study
The demand for fuel has increased worldwide. As this demand increased, the number of oil
refineries being built has decreased, reflecting a rise in oil prices, with an all time record high in July
2008 of $147/barrel (Simpkins). This rise in price has directed an increase in research into alternative
fuel sources such as biofuels, which include ethanol, diesel, and butanol from renewable resources such
as corn fiber, biomass, and other agricultural byproducts. Bioethanol is the most widely used alternative
automotive fuel in the world. Brazil produces ethanol from sugar cane, and North America produces
ethanol from corn for use as an octane enhancer of gasoline (in a small percentage). These countries
account for more than 65% of global ethanol production (Organization for Economic Cooperation and
Development). Biodiesel is another alternative to fossil fuels. The increased production of biodiesel as an
alternative to petroleum has, however, led to a buildup of the by product, glycerol. Recently, crude
glycerol has been proposed as an alternative to corn as the starting material for the production of
ethanol for use as a fuel (Gonzalez et al. 2008). As such, this report is fueled by the need for a cheaper
source of ethanol and by the overproduction of glycerol.
Ethanol Demand:
The Energy Policy Act of 2005 established the renewable fuels standard (RFS) which directs that
gasoline sold in the United States contain a specified minimum volume of renewable fuel. Under the Act,
the total volume of renewable fuel to be utilized starts at 4 billion gallons in 2006 and increases to 7.5
billion gallons in 2012. However, the Energy Independence and Security Act of 2007, signed into law on
December 19th 2007, boosts the requirements for renewable fuel use to 36 billion gallons by 2022. The
act requires "advanced biofuels"—defined as fuels that cut greenhouse gas emissions by at least 50%—
to provide 21 billion gallons of fuel by 2022, or about 60% of the total requirement. In other words,
LeGendre, Logan, Mendel, Seedial
12
cellulosic biofuels must contribute at least 0.1 billion gallons in 2010, accelerating to 10 billion gallons in
2020 and 16 billion gallons in 2022 (US Department of Energy). Such advanced biofuels could include
ethanol derived from cellulosic biomass—such as wood waste, grasses, and agricultural wastes—as well
as biodiesel, butanol, and other fuels. Title II of the Energy Act also prohibits petroleum companies from
restricting the sale of alternative fuels under new franchise agreements, a provision that could allow gas
station owners to install more pumps for E85, a blend of 85% ethanol and 15% gasoline (US DOE-EERE).
The act also requires labeling diesel fuel pumps with their biodiesel content.
This new Energy Act was drafted at the time that oil prices were at a high. This quickened the
demand for a less expensive source of energy. However, in 2009, the price of crude oil has dropped
significantly from the summer 2008 high of $147 per barrel to $40.17 per barrel (Bloomberg). This drop
in prices is a result of the unemployment in the United States climbing in January to the highest level
since 1992. As such, oil futures in New York have traded between $38.60 and $42.68 in recent times as
the recession in the U.S., Europe and Asia has led to layoffs and reduced spending.
Since the ethanol plant that is being proposed will start production in approximately two years,
the market should stabilize as OPEC is at present shutting down some oil refineries in an effort to bring
balance to the market. Even so, the production of inexpensive bioethanol is still in high demand due to
the increasing demand for cleaner transportation fuels. There are great market opportunities for
biofuels—agriculturally- derived renewable fuels such as ethanol and biodiesel. Since the new energy
act of 2007, refiners are required by law to blend a certain amount of ethanol into gasoline or buy
enough credits to balance out that amount. If ethanol supply in the United States becomes lower than
demand, the United States could be forced to import fuel from Brazilian exporters. As such, there is now
an even more pressing need for a less expensive source of ethanol than the traditional grain.

LeGendre, Logan, Mendel, Seedial
13
The Glycerol Glut:
Glycerol is produced in two ways: natural glycerol is produced as a by-product in the production
of soap and in the conversion of fats and oils to fatty acids or fatty acid methyl esters, such as occurs in
biodiesel manufacturing, and synthetic glycerol is produced in various manners. Natural glycerol is
initially produced in a crude form that contains water and other impurities, which vary widely and
depend on the manufacturing process.
Asia is the largest producer and consumer of refined glycerin, accounting for 44% and 35% of
world production and consumption in 2007. Asia is expected to remain the largest market into 2012
with increasing demand in all applications as well as new markets for refined glycerin. Western Europe is
the second-largest producer and consumer of refined glycerin, accounting for nearly 35% and 28% of
world production and consumption, respectively, in 2007. North America was the third-largest market in
2007. These three regions accounted for nearly 91% of world production and 82% of world consumption
in 2007 (SRI).
Fig IS-1: Consumption of Refined Glycerol by Country(SRI)

LeGendre, Logan, Mendel, Seedial
14
The increased use of biofuels as alternative to petroleum has lead to a buildup up of the
biodiesel manufacturing byproduct, crude glycerol. In general, for every 1000 kilograms of biodiesel
made from vegetable oil, 100 kilograms of glycerol is produced as a byproduct (McCoy). Since the
previous glycerol supply and demand market was tight, recent increases in glycerol production from
biodiesel refineries have created a glut in the glycerol market. As a result, the price of glycerol has fallen
significantly, and biodiesel refineries are having difficulty in managing the glycerol by product which has
become a waste stream. According to the National Biodiesel Board, U.S. companies produced about 450
million gallons of biodiesel in 2007, and about 60 new plants with a production capacity of 1.2 billion
gallons are slated to open by 2010 (Voegele).
Purified glycerol has historically been a fairly high valued commercial chemical, usually valued at
$0.60-$0.90 / lb and was primarily used in the pharmaceutical and food and beverage industry. At this
time the price of glycerol as a feedstock was too high to pursue other uses for it. However, as of 2006
the price of glycerol had fallen to as low as $ 0.05- $0.15 /lb. This low price positions glycerol as a
favorable feedstock for chemical processes (Voegele).
The Department of Energy estimated that if enough biodiesel was produced to replace 2% of
petroleum diesel use, around 800 million pounds of glycerol would be produced. Since the US market
for crude glycerol is around 600 million pounds, the increasing biodiesel production is producing a
glycerol glut, and new markets for the excess glycerol need to be examined (US DOE-EERE).
Jerry Patak, director of commodities for Massachusetts-based World Energy Solutions Inc., says
the U.S. crude glycerin market is being inundated with imports. Southeast Asia and Europe are exporting
glycerin to the United States in large volumes at low prices. “The market is depressed as a result of
that,” he says. Patak expects those depressed prices to continue through the end of 2008, and possibly
into 2009 (Voegele).
The market is also experiencing reduced demand from Asia. Dave Elsenbast, Renewable Energy

LeGendre, Logan, Mendel, Seedial
15
Group Inc.’s vice president of procurement says his company has exported glycerin to Asia in the past.
“The Asian demand that we were selling into seems to have dramatically slowed,” he says. “They may
have started buying more of their supplies out of the Argentinean biodiesel market as that market has
developed.” (Voegele)
With increased fuel production from the biodiesel industry and the lack of exports of glycerol,
the price of crude glycerol can be expected to remain low for at least a few years.
Crude glycerol sells at a price comparable to that of sugars typically used in fermentation
processes, and it has a higher reduced state than that of sugars such as glucose and xylose. This property
of glycerol promises to increase the yield of chemicals from fermentation such as ethanol, succinic acid
and propanediols. Previously, researchers did not believe that that Escherichia coli bacteria could
anearobically metabolize glycerol. However, recent research done by researchers Gonzales and
Dharmadi of Rice University on the lab scale has shown that this microorganism is capable of this
process under certain pH and other external condition, producing a mixture of ethanol and a small
quantity of succinic acid. Gonzales and Dharmadi found the process to be very efficient, with operational
costs estimated to be about 40 percent less than those of producing ethanol from corn. Gonzalez has
said that new fermentation technologies that produce high-value chemicals like succinate hold even
more promise for biodiesel refiners because those chemicals are more profitable than ethanol (Boyd).
Succinate is a high-demand chemical feedstock that is used to make everything from noncorrosive
airport deicers and nontoxic solvents to plastics, drugs and food additives. Most succinate today comes
from nonrenewable fossil fuels (Yazdani).
Our project seeks to scale up the fermentation of glycerol to ethanol by Escherichia coli bacteria
and determine if it is economically feasible on the plant scale.

LeGendre, Logan, Mendel, Seedial
16
C. Initial Project Charter
Project Name Anaerobic Fermentation of Glycerol to Ethanol Project Champion The biodiesel manufacturing industry, “Green” energy
Proponents Project Leader Chloe LeGendre, Eric Logan, Jordan Mendel, and Tamara
Seedial Specific Goals Design an economically viable chemical process with a low
energy requirement to produce 50 MM gallons per year of ethanol by fermenting crude waste glycerol using E. Coli
Project Scope In Scope: • Full process design of a plant that produces ethanol to be
blended with gasoline for use in vehicles • Use crude glycerol as feedstock to reduce waste from the
biodiesel industry • Small scale production of high valued specialty chemical
Succinic Acid • Design a process more energy-efficient than the current
corn-to-ethanol production method • Determine profitability of proposed process Out of Scope: • Specific biochemistry of E.Coli
Deliverables • Full plant design • Economic analysis of process • Chemical cost sensitivity assessment
Timeline Deliverables completed by April 14, 2009

LeGendre, Logan, Mendel, Seedial
17
Market and Competitive Analysis
Section III

LeGendre, Logan, Mendel, Seedial
18
Market and Competitive Analysis
Ethanol
The worldwide demand for fuel has prompted a rise in the biofuels production, especially after
the fluctuation in oil prices in 2008. The most common biofuels are alcohols such as ethanol, butanol
and propanol, along with vegetable mass oil or biodiesel. These are all produced from biomass and are
beginning to infiltrate the world markets.
As a result of the Energy Independence and Security Act of 2007, signed into law on December
19th 2007, which boosts the requirements for renewable fuel use to 36 billion gallons by 2022, ethanol
production in the United States is expected to increase. This act also states that there is to be more
production of E85, a blend of 85% ethanol and 15% gasoline. (US Department of Energy-EERE). As such
the price of ethanol is related to the price of gasoline and by extension crude oil.
According to OECD (Organization for Economic Cooperation and Development) figures,
production of fuel ethanol on a global scale tripled to 52 billion liters (13.73 billion gallons) from 2000 to
2007, and by 2017 that number is expected to increase to 127 billion liters (33.54 billion gallons) per
annum. As production of ethanol increases, the amount that is traded on the open market as opposed
to being used domestically is expected to increase also, to 6 billion liters (1.58 billion gallons) in 2010
and further to more than 10 billion liters (2.64+ billion gallons) in 2017 (OECD).
Certain nations have a comparative advantage over others, in terms of necessary feed stocks
and transportation costs, so it is first useful to examine the global ethanol market. According to the
(international) OECD 2007 report, the global price of fuel ethanol is expected to hit a high of $55 per
hectoliter ($2.082 per gallon) by 2009 and to level off to $52 per hectoliter by 2017 ($1.969 per gallon)
(OECD).This global data is shown in Figure MA-1, along with comparative pricing data for biodiesel.

LeGendre, Logan, Mendel, Seedial
19
Figure MA-1. Global Prices of Ethanol and Biodiesel (USD)/gallon over the next 8 years (OECD data).
However, it is to be noted that this data that examines global markets ignores the influence of
policy support and legislature within individual countries. For example, policies such as the US Energy
Independence and Security Act (EISA) are not taken into account. Therefore one must look at nation-
wide market analyses in addition to global figures. The global data shows an ethanol price leveling off at
$1.97 per gallon at around 2017(OECD), which is significantly lower than the value predicted by data
from the United States Department of Energy.
Data from the DOE and current market data show direct correlations between the price of gas
and the price of ethanol within the United States (See Sensitivity Analysis Fig. SA-1). This correlation
could be a result of the Energy Policy Act of 2005 which established the renewable fuels standard (RFS).
This standard states that gasoline sold in the United States must contain a specified minimum volume of
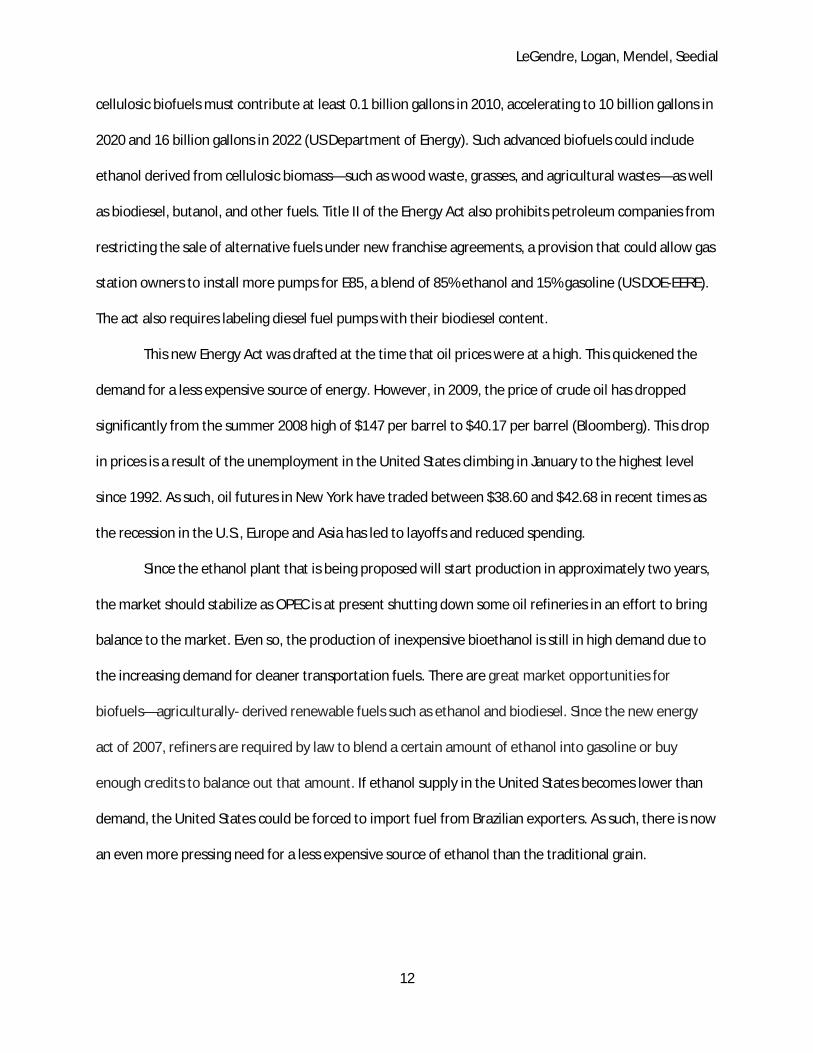
renewable fuel. In Fig. MA-2 below, the actual prices of oil and gas as recorded from the New York Stock
Exchange by Interactive Data Corporation are used to create correlations between these prices and the
price of ethanol. (See the Sensitivity Analysis for a summary of the correlation.)
0
0.5
1
1.5
2
2.5
3
3.5
4
4.5
2004 2006 2008 2010 2012 2014 2016 2018
Ethanol Biodiesel
LeGendre, Logan, Mendel, Seedial
20
Figure MA-2. Actual price of ethanol compared with prices generated by linear correlations with actual oil and actual gas prices.
Since the ethanol prices predicted by actual oil and actual gas prices seem to correspond well to
the actual prices of ethanol, the correlation between ethanol prices and oil prices can be validated. This
correlation also allows the prediction of future ethanol prices based on future oil prices.
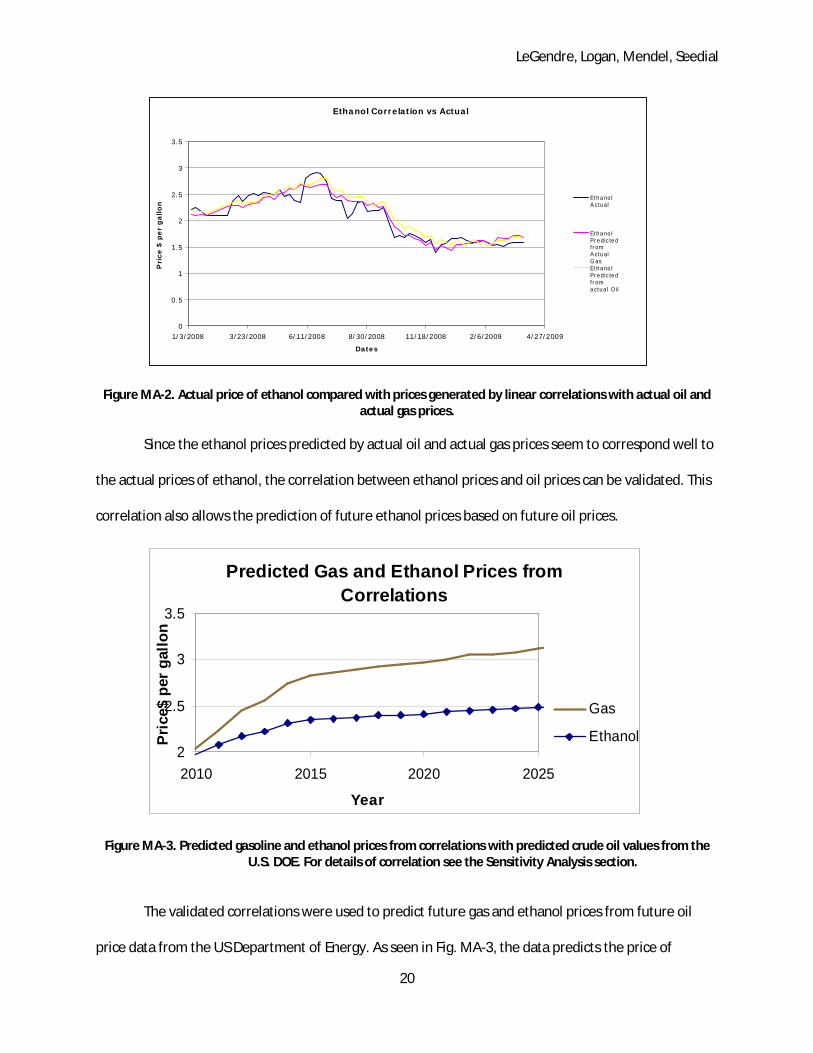
Figure MA-3. Predicted gasoline and ethanol prices from correlations with predicted crude oil values from the U.S. DOE. For details of correlation see the Sensitivity Analysis section.
The validated correlations were used to predict future gas and ethanol prices from future oil
price data from the US Department of Energy. As seen in Fig. MA-3, the data predicts the price of
Ethanol Correlation vs Actual
0
0.5
1
1.5
2
2.5
3
3.5
1/3/2008 3/23/2008 6/11/2008 8/30/2008 11/18/2008 2/6/2009 4/27/2009
Dates
Pri
ce $
per
gallon
EthanolActual
EthanolPredictedfromActualGasEthanolPredictedfromactual Oil
P redic ted G as and E thanol P ric es from C orrelations
2
2.5
3
3.5
2010 2015 2020 2025
Yea r
Pri
ce$
per
gal
lon
G as
E thanol
LeGendre, Logan, Mendel, Seedial
21
ethanol to steadily increase until a cost of $ 2.58/gallon. This value is slightly higher than that predicted
from the global data, and closer to the predicted value of ethanol in the design problem statement
($2.50/gallon) (See page 269).
Glycerol
Looking at the global OECD fuel production data from 2000 to 2007, biodiesel production saw an
even more pronounced expansion, from less than 1 billion liters (0.26 billion gallons) annually to about
11 billion liters (2.91 billion gallons). For every 1000 kg of biodiesel produced, roughly 100 kg of glycerol
is produced as a byproduct. When global production of biodiesel reaches its stable peak at 2.91 billion
gallons, or 9.69 billion metric tons (21.4 billion lbs) per year, roughly 2.91 billion gallons of glycerol per
year will be produced as a waste product (The Glycerol Challenge). The price of biodiesel in the same
period that production is increasing is expected to reach a steady value of $105.49 per hectoliter ($3.99
per gallon). This global data predicts that the crude glycerol bulk prices will be at or around the $0.05
per pound ($0.00475 per gallon) floor that prices have been hovering around in the last few years
(Lefebvre).
There is again a slight discrepancy between the global and domestic data since crude glycerol
prices seem to be dropping even lower than $0.05/lb in the United States. In January 2006, Dow
Chemical closed a glycerol-producing plant in Freeport, Texas due to the global glut of glycerol as a
byproduct created by the rise in production of biodiesel. This event signaled that the world had entered
into a new period in the market of crude glycerol. Whereas refined glycerol, mostly from Asia, is still a
market commodity with an adequate demand for its supply, and therefore subject to market influences,
crude glycerol is a chemical that few processes can or want to touch. This glycerol glut creates significant
opportunities for a plant, such as this one, that can use glycerol in its crude form (McCoy 7).
While demand for biodiesel is certainly rising, as signaled by the large predicted rate of growth
until the year 2017, demand for crude glycerol is not nearly rising as quickly. This will lead to a long

LeGendre, Logan, Mendel, Seedial
22
period, until innovation can catch up with favorable market conditions, of crude glycerol prices being
determined almost exclusively by the production rate of biodiesel. Since this rate is rising, there is a
direct relationship between the production of biodiesel and glycerol. The higher the supply of crude
glycerol, the lower its price falls. There should be an inverse relationship between production of
biodiesel and cost of glycerol (Voegele).
This inverse relationship is further corroborated by some of the limited data available on
glycerol prices since the expansion of the biodiesel industry. This data is illustrated in the Fig. MA-4,
which is quoted from “Anaerobic fermentation of glycerol: a path to economic viability for the biofuels
industry." (Gonzales 2009)
Figure MA-4. Prices of Crude Glycerol in relation to biodiesel production since 2004 (Gonzales 2009)
This data illustrates that glycerol prices may drop even lower than the 5 cents per pound that
was quoted as global data. If the price of ethanol increases until 2030, as predicted by the correlation in
Fig. MA-3, and the price of glycerol decreases, as seen in Fig. MA-4, the process of fermenting glycerol
into ethanol should be a profitable investment.
LeGendre, Logan, Mendel, Seedial
23
Succinic Acid
The anaerobic fermentation of glycerol to ethanol also produces succinic acid. Succinic acid is
used as a starting material for many important chemicals in the food, chemical and pharmaceutical
industries. Industrial succinic acid is usually produced from butane through maleic anhydride, and food
grade succinic acid is produced through older fermentation and separation technology (Paster et al).
These methods are costly, and succinic acid use remains limited. The current worldwide usage of
succinic acid is around 20,000 to 30,000 tons per year, but this will increase by around 10% per year in
light of new technologies (such as this fermentation process) that may decrease the price of succinic
acid production (Kidwell).
At present, succinic acid is mostly produced by the chemical process from n-butane through
maleic anhydride. In 2005, succinic acid was sold for $5.90-$9.00/kg ($2.68-$4.00 per pound) depending
on its purity (Song et al).This high cost was a result of expensive feed materials and a costly separation
process. The use of glycerol as a starting point should drop the price of production. In 2006, maleic
anhydride made from n-butane was sold for $0.977/kg ($0.45 per pound) (Song et al.), while the price of
glycerol was a little more than a tenth of that price ($0.05 per pound) (Yazdani). As such, it is reasonable
to assume that the price of succinic acid will be $2.00- $3.00/pound, as fermentation technologies cause
the price of production to decrease. At the price of $2.00/pound, the succinic acid revenue will increase
the profitability of the plant.

LeGendre, Logan, Mendel, Seedial
24
Process Flowsheets and Material Balances
Section IV
Feed Preparation Section………………….……………….……………….……………….……………….…………………… 25
Laboratory Section……………….……………….……………….……………….……………….……………….………………. 28
Plant Seed Fermentation Section……………….……………….……………….……………….……………….…….…… 30
Main Fermentation Section……………….……………….……………….……………….……………….…………………… 33
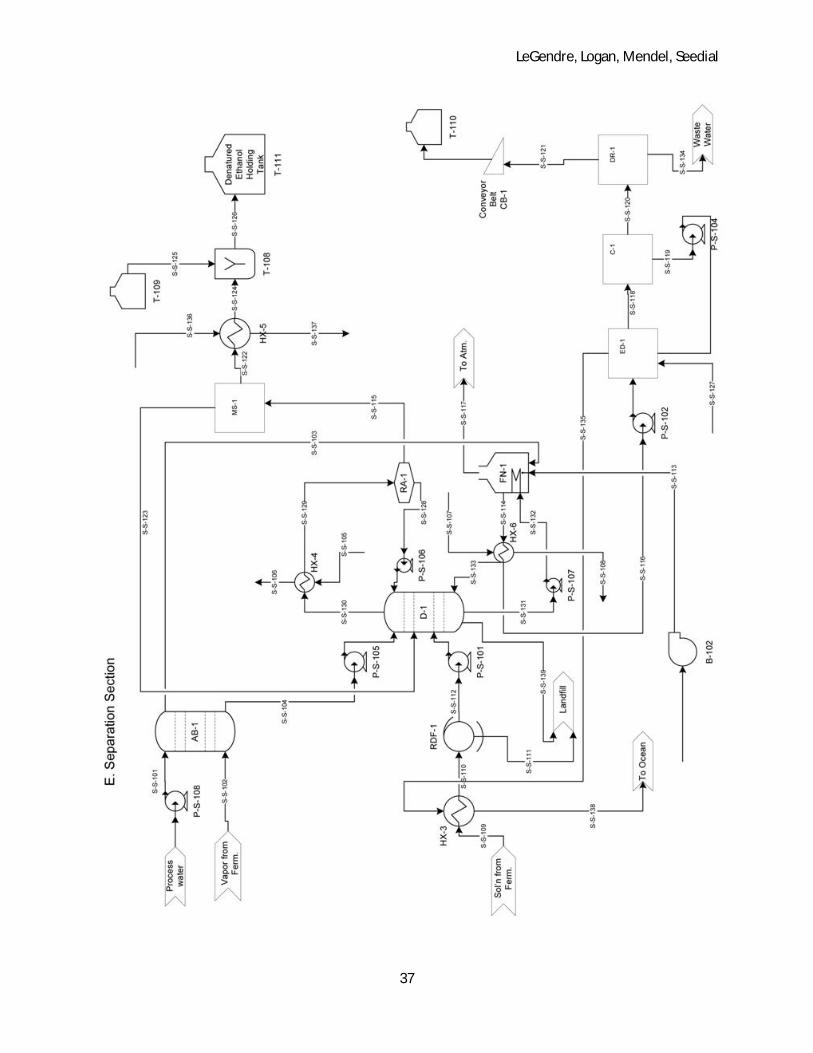
Separation Section……………….……………….……………….……………….……………….……………….………….……. 37
LeGendre, Logan, Mendel, Seedial
25

LeGendre, Logan, Mendel, Seedial
26
Stream number S-FP-101 S-FP-102 S-FP-103 S-FP-104 S-FP-105 S-FP-106 S-FP-107
Temperature °C 25.00 25.00 25.00 25.00 25.00 25.00 25.00
Pressure (psi) 14.60 14.60 14.60 14.60 14.60 14.60 14.60
Vapor Fraction 0.00 0.00 0.00 0.00 0.00 0.00 0.00
Mass (kg/hr) 43370.09 4832.32 6567.13 39900.49 151104.77 927.42 191932.67
Mole (kmol/hr) -- 268.24 -- 569.20 8387.72 9.27 8966.20
Volume (L/hr) 35169.79 4832.32 4832.32 32356.21 151104.77 927.42 185192.86
State Solution Liquid Solution Solution Liquid Solution Solution
Biomass 0.00 0.00 0.00 0.00 0.00 0.00 0.00
Carbon Dioxide 0.00 0.00 0.00 0.00 0.00 0.00 0.00
Corn Steep Liquor 0.00 0.00 0.00 0.00 0.00 9.27 9.27
Ethanol 0.00 0.00 0.00 0.00 0.00 0.00 0.00
Glycerol 400.20 0.00 0.00 400.20 0.00 0.00 400.20
Hydrogen 0.00 0.00 0.00 0.00 0.00 0.00 0.00
Succinic Acid 0.00 0.00 0.00 0.00 0.00 0.00 0.00
Water 169.00 268.24 268.24 169.00 8387.72 0.00 8556.72
Wastes (Salts, MONG) ---- 0.00 ---- 0.00 0.00 0.00 0.00
Biomass 0.00 0.00 0.00 0.00 0.00 0.00 0.00
Carbon Dioxide 0.00 0.00 0.00 0.00 0.00 0.00 0.00
Corn Steep Liquor 0.00 0.00 0.00 0.00 0.00 927.42 927.42
Ethanol 0.00 0.00 0.00 0.00 0.00 0.00 0.00
Glycerol 36855.87 0.00 0.00 36855.87 0.00 0.00 36855.87
Hydrogen 0.00 0.00 0.00 0.00 0.00 0.00 0.00
Succinic Acid 0.00 0.00 0.00 0.00 0.00 0.00 0.00
Water 3044.62 4832.32 4832.32 3044.62 151104.77 0.00 154149.38
Wastes (Salts, MONG) 3469.61 0.00 1734.80 0.00 0.00 0.00 0.00
Feed Preparation Stage Material Balance Block (1 of 2)
Molar components (kmol/hr)
Mass components (kg/hr)

LeGendre, Logan, Mendel, Seedial
27
Stream number S-FP-108 S-FP-109 S-FP-110 S-FP-111 S-FP-112 S-FP-113 S-FP-114
Temperature °C 111.04 121.00 186.11 179.97 37.00 25.00 25.00
Pressure (psi) 40.00 35.00 150.00 145.00 30.00 14.60 45.00
Vapor Fraction 0.00 0.00 1.00 0.01 0.00 0.00 0.00
Mass (kg/hr) 191932.67 191932.67 4044.94 4044.94 191932.67 1734.80 191932.67
Mole (kmol/hr) 8966.20 8966.20 224.53 224.53 8966.20 n/a 8966.20
Volume (L/hr) 185192.86 185192.86 755015.75 9646.96 185192.86 n/a 185192.86
State Solution Solution Vapor Liquid Solution Cake Solution
Biomass 0.00 0.00 0.00 0.00 0.00 0.00 0.00
Carbon Dioxide 0.00 0.00 0.00 0.00 0.00 0.00 0.00
Corn Steep Liquor 9.27 9.27 0.00 0.00 9.27 0.00 9.27
Ethanol 0.00 0.00 0.00 0.00 0.00 0.00 0.00
Glycerol 400.20 400.20 0.00 0.00 400.20 0.00 400.20
Hydrogen 0.00 0.00 0.00 0.00 0.00 0.00 0.00
Succinic Acid 0.00 0.00 0.00 0.00 0.00 0.00 0.00
Water 8556.72 8556.72 224.53 224.53 8556.72 0.00 8556.72
Wastes (Salts, MONG) 0.00 0.00 0.00 0.00 0.00 n/a 0.00
Biomass 0.00 0.00 0.00 0.00 0.00 0.00 0.00
Carbon Dioxide 0.00 0.00 0.00 0.00 0.00 0.00 0.00
Corn Steep Liquor 927.42 927.42 0.00 0.00 927.42 0.00 927.42
Ethanol 0.00 0.00 0.00 0.00 0.00 0.00 0.00
Glycerol 36855.87 36855.87 0.00 0.00 36855.87 0.00 36855.87
Hydrogen 0.00 0.00 0.00 0.00 0.00 0.00 0.00
Succinic Acid 0.00 0.00 0.00 0.00 0.00 0.00 0.00
Water 154149.38 154149.38 4044.94 4044.94 154149.38 0.00 154149.38
Wastes (Salts, MONG) 0.00 0.00 0.00 0.00 0.00 1734.80 0.00
Feed Preparation Stage Material Balance Block (2 of 2)
Molar components (kmol/hr)
Mass components (kg/hr)
LeGendre, Logan, Mendel, Seedial
28

LeGendre, Logan, Mendel, Seedial
29
Stream number SL-1 SL-2 SL-3 SL-4 SL-5 SL-6 SL-7 SL-8 SL-9 SL-10
Temperature °C 37.00 37.00 37.00 37.00 37.00 37.00 37.00 37.00 37.00 37.00
Pressure (psi) 14.80 14.80 14.80 14.80 14.80 14.80 14.80 14.80 14.80 14.80
Vapor Fraction 0.00 0.00 0.00 0.00 0.00 0.00 0.00 1.00 1.00 1.00
Mass (g/batch) 1.05 18.81 381.33 7630.03 19.89 403.54 8073.46 2.12 41.29 824.06
Mole (mol/batch) 0.04 0.96 19.71 394.76 0.92 18.85 377.16 0.09 1.78 35.59
Volume (mL/batch) 1.00 19.44 395.30 7911.00 19.15 389.42 7790.00 -- -- --
Ethanol Conc. (g/L) 0.00 95.70 96.28 96.19 0.00 0.00 0.00 -- -- --
State Slurry Soluti on Sol uti on Sol ution Sol uti on Sol uti on Solution Vapor Vapor Vapor
Biomass 0.04 0.04 0.07 0.58 0.00 0.00 0.00 0.00 0.00 0.00
Carbon Dioxide 0.00 0.00 0.00 0.00 0.00 0.00 0.00 0.04 0.82 16.33
Corn Steep Liquor 0.00 0.00 0.02 0.41 0.00 0.02 0.39 0.00 0.00 0.00
Ethanol 0.00 0.04 0.83 16.51 0.00 0.00 0.00 0.00 0.04 0.80
Glycerol 0.00 0.00 0.00 0.00 0.04 0.84 16.83 0.00 0.00 0.00
Hydrogen 0.00 0.00 0.00 0.00 0.00 0.00 0.00 0.04 0.82 16.50
Succinic Acid 0.00 0.00 0.01 0.18 0.00 0.00 0.00 0.00 0.00 0.00
Water 0.00 0.87 18.79 377.08 0.88 17.99 359.93 0.00 0.09 1.96
Biomass 1.05 1.08 1.70 14.16 0.00 0.00 0.00 0.00 0.00 0.00
Carbon Dioxide 0.00 0.00 0.00 0.00 0.00 0.00 0.00 1.84 36.13 718.64
Corn Steep Liquor 0.00 0.10 2.05 41.06 0.10 1.95 39.01 0.00 0.00 0.00
Ethanol 0.00 1.86 38.06 760.73 0.00 0.00 0.00 0.10 1.80 36.86
Glycerol 0.00 0.00 0.00 0.00 4.00 77.50 1550.32 0.00 0.00 0.00
Hydrogen 0.00 0.00 0.00 0.00 0.00 0.00 0.00 0.09 1.66 33.26
Succinic Acid 0.00 0.05 1.05 20.92 0.00 0.00 0.00 0.00 0.00 0.00
Water 0.00 15.72 338.47 6793.16 15.79 324.09 6484.14 0.09 1.70 35.30
Lab Scale Material Balance Block
Molar components (mol/batch)
Mass components (g/batch)
LeGendre, Logan, Mendel, Seedial
30

LeGendre, Logan, Mendel, Seedial
31
Stream number S-101 S-102 S-103 S-104 S-105 S-106 S-107Temperature °C 37.00 37.00 37.00 37.00 37.00 37.00 37.00Pressure (psi) 14.80 14.80 14.80 14.80 14.80 14.80 14.80Vapor Fraction 0.00 0.00 0.00 0.00 0.00 0.00 0.00Mass (kg/batch) 160.92 3230.44 64593.22 423410.27 7.63 152.12 3052.67Mole (mol/batch) 7517.65 150910.97 3017493.24 19779746.86 394.76 7870.57 157943.69Volume (L/batch) 156.00 3117.00 62325.00 408542.00 7.91 157.71 3164.95Ethanol Conc. (g/L) -- -- -- -- 96.19 96.16 96.17State Solution Solution Solution Solution Solution Solution Solution
Biomass 0.00 0.00 0.00 0.00 0.58 10.67 213.25Carbon Dioxide 0.00 0.00 0.00 0.00 0.00 0.00 0.00
Corn Steep Liquor 7.78 156.09 3121.14 20459.18 0.41 8.19 164.28Ethanol 0.00 0.00 0.00 0.00 16.51 329.22 6606.64
Glycerol 335.54 6735.78 134683.19 882851.83 0.00 0.00 0.00Hydrogen 0.00 0.00 0.00 0.00 0.00 0.00 0.00
Succinic Acid 0.00 0.00 0.00 0.00 0.18 3.53 70.89Water 7174.33 144019.10 2879688.90 18876435.84 377.08 7518.97 150888.64
Biomass 0.00 0.00 0.00 0.00 0.01 0.26 5.25Carbon Dioxide 0.00 0.00 0.00 0.00 0.00 0.00 0.00
Corn Steep Liquor 0.78 15.61 312.11 2045.92 0.04 0.82 16.43Ethanol 0.00 0.00 0.00 0.00 0.76 15.17 304.36
Glycerol 30.90 620.32 12403.51 81305.36 0.00 0.00 0.00Hydrogen 0.00 0.00 0.00 0.00 0.00 0.00 0.00
Succinic Acid 0.00 0.00 0.00 0.00 0.02 0.42 8.37Water 129.25 2594.50 51877.60 340058.99 6.79 135.45 2718.26
Plant Scale Seed Fermentation Train Material Balance Block (Batch) (1 of 2)
Molar components (mol/batch)
Mass components (kg/batch)

LeGendre, Logan, Mendel, Seedial
32
Stream number S-108 S-109 S-110 S-111 S-112 S-113 S-114Temperature °C 37.00 37.00 37.00 37.00 37.00 37.00 37.00Pressure (psi) 14.80 14.80 14.80 14.80 14.80 14.80 14.80Vapor Fraction 0.00 1.00 1.00 1.00 1.00 1.00 0.00Mass (kg/batch) 61047.80 16.44 329.89 6598.10 43596.29 50540.72 440861.80Mole (mol/batch) 3158605.38 709.59 14242.56 284861.20 1879984.19 2179797.55 22815309.40Volume (L/batch) 63293.21 -- -- -- -- -- 457030.26Ethanol Conc. (g/L) 96.16 -- -- -- -- -- 95.82State Solution Vapor Vapor Vapor Vapor Vapor Solution
Biomass 4263.84 0.00 0.00 0.00 0.00 0.00 30815.61Carbon Dioxide 0.00 325.48 6533.71 130642.69 856366.25 993868.13 0.00Corn Steep Liquor 3285.43 0.00 0.00 0.00 0.00 0.00 23744.61Ethanol 132109.86 16.13 323.64 6486.30 46673.86 53499.93 950630.80Glycerol 0.00 0.00 0.00 0.00 0.00 0.00 0.00Hydrogen 0.00 328.83 6601.06 131989.53 865194.82 1004114.24 0.00Succinic Acid 1417.72 0.00 0.00 0.00 0.00 0.00 10246.24Water 3017528.53 39.15 784.15 15742.68 111749.27 128315.25 21799872.14
Biomass 104.89 0.00 0.00 0.00 0.00 0.00 758.06Carbon Dioxide 0.00 14.32 287.55 5749.58 37688.68 43740.14 0.00Corn Steep Liquor 328.54 0.00 0.00 0.00 0.00 0.00 2374.46Ethanol 6086.17 0.74 14.91 298.82 2150.22 2464.69 43794.61Glycerol 0.00 0.00 0.00 0.00 0.00 0.00 0.00Hydrogen 0.00 0.66 13.31 266.09 1744.23 2024.29 0.00Succinic Acid 167.42 0.00 0.00 0.00 0.00 0.00 1209.97Water 54360.78 0.71 14.13 283.60 2013.16 2311.60 392724.70
Molar components (mol/batch)
Mass components (kg/batch)
Plant Scale Seed Fermentation Train Material Balance Block (Batch) (2 of 2)

LeGendre, Logan, Mendel, Seedial
33

LeGendre, Logan, Mendel, Seedial
34
Stream number S-114 S-115 S-116 S-117 S-118 S-119 S-120 S-121 S-122Temperature °C 37.00 37.00 37.00 37.00 37.00 37.00 37.00 37.00 37.00Pressure (psi) 14.80 14.80 14.80 14.80 14.80 14.80 14.80 14.80 14.80Vapor Fraction 0.00 0.00 0.00 0.00 0.00 0.00 0.00 0.00 0.00Mass (kg/batch) 440861.80 1556144.82 1556144.82 1556144.82 1556144.82 1556144.82 1556144.82 73447.58 73447.58Mole (kmol/batch) 22815.31 72695.81 72695.81 72695.81 72695.81 72695.81 72695.81 3801.03 3801.03Volume (L/batch) 457030.26 1501500.00 1501501.00 1501502.00 1501503.00 1501504.00 1501505.00 76141.62 76141.62Ethanol Conc. (g/L) 95.82 -- -- -- -- -- -- 95.82 95.82State Solution Solution Solution Solution Solution Solution Solution Solution Solution
Biomass 30.82 0.00 0.00 0.00 0.00 0.00 0.00 5.13 5.13Carbon Dioxide 0.00 0.00 0.00 0.00 0.00 0.00 0.00 0.00 0.00
Corn Steep Liquor 23.74 75.19 75.19 75.19 75.19 75.19 75.19 3.96 3.96Ethanol 950.63 0.00 0.00 0.00 0.00 0.00 0.00 158.38 158.38
Glycerol 0.00 3244.71 3244.71 3244.71 3244.71 3244.71 3244.71 0.00 0.00Hydrogen 0.00 0.00 0.00 0.00 0.00 0.00 0.00 0.00 0.00
Succinic Acid 10.25 0.00 0.00 0.00 0.00 0.00 0.00 1.71 1.71Water 21799.87 69375.90 69375.90 69375.90 69375.90 69375.90 69375.90 3631.86 3631.86
Biomass 758.06 0.00 0.00 0.00 0.00 0.00 0.00 126.29 126.29Carbon Dioxide 0.00 0.00 0.00 0.00 0.00 0.00 0.00 0.00 0.00
Corn Steep Liquor 2374.46 7519.29 7519.29 7519.29 7519.29 7519.29 7519.29 395.59 395.59Ethanol 43794.61 0.00 0.00 0.00 0.00 0.00 0.00 7296.18 7296.18
Glycerol 0.00 298818.71 298818.71 298818.71 298818.71 298818.71 298818.71 0.00 0.00Hydrogen 0.00 0.00 0.00 0.00 0.00 0.00 0.00 0.00 0.00
Succinic Acid 1209.97 0.00 0.00 0.00 0.00 0.00 0.00 201.58 201.58Water 392724.70 1249806.82 1249806.82 1249806.82 1249806.82 1249806.82 1249806.82 65427.93 65427.93
Main Fermentation Section (Batch) (1 of 4)
Molar components (kmol/batch)
Mass components (kg/batch)
Stream number S-123 S-124 S-125 S-126 S-127 S-128 S-129 S-130 S-131Temperature °C 37.00 37.00 37.00 37.00 37.00 37.00 37.00 37.00 37.00Pressure (psi) 14.80 14.80 14.80 14.80 14.80 14.80 14.80 14.80 14.80Vapor Fraction 0.00 0.00 0.00 0.00 0.00 0.00 0.00 0.00 0.00Mass (kg/batch) 73447.58 73447.58 73447.58 73447.58 158271.24 158271.24 158271.24 158271.24 158271.24Mole (kmol/batch) 3801.03 3801.03 3801.03 3801.03 6824.67 6824.67 6824.67 6824.67 6824.67Volume (L/batch) 76141.62 76141.62 76141.62 76141.62 -- -- -- -- --Ethanol Conc. (g/L) 95.82 95.82 95.82 95.82 -- -- -- -- --State Solution Solution Solution Solution Vapor Vapor Vapor Vapor Vapor
Biomass 5.13 5.13 5.13 5.13 0.00 0.00 0.00 0.00 0.00Carbon Dioxide 0.00 0.00 0.00 0.00 3147.37 3147.37 3147.37 3147.37 3147.37
Corn Steep Liquor 3.96 3.96 3.96 3.96 0.00 0.00 0.00 0.00 0.00Ethanol 158.38 158.38 158.38 158.38 156.23 156.23 156.23 156.23 156.23
Glycerol 0.00 0.00 0.00 0.00 0.00 0.00 0.00 0.00 0.00Hydrogen 0.00 0.00 0.00 0.00 3179.82 3179.82 3179.82 3179.82 3179.82
Succinic Acid 1.71 1.71 1.71 1.71 0.00 0.00 0.00 0.00 0.00Water 3631.86 3631.86 3631.86 3631.86 341.25 341.25 341.25 341.25 341.25
Biomass 126.29 126.29 126.29 126.29 0.00 0.00 0.00 0.00 0.00Carbon Dioxide 0.00 0.00 0.00 0.00 138515.88 138515.88 138515.88 138515.88 138515.88
Corn Steep Liquor 395.59 395.59 395.59 395.59 0.00 0.00 0.00 0.00 0.00Ethanol 7296.18 7296.18 7296.18 7296.18 7197.25 7197.25 7197.25 7197.25 7197.25
Glycerol 0.00 0.00 0.00 0.00 0.00 0.00 0.00 0.00 0.00Hydrogen 0.00 0.00 0.00 0.00 6410.52 6410.52 6410.52 6410.52 6410.52
Succinic Acid 201.58 201.58 201.58 201.58 0.00 0.00 0.00 0.00 0.00Water 65427.93 65427.93 65427.93 65427.93 6147.61 6147.61 6147.61 6147.61 6147.61
Mass components (kg/batch)
Main Fermentation Section (Batch) (2 of 4)
Molar components (kmol/batch)

LeGendre, Logan, Mendel, Seedial
35
Stream number S-132 S-133 S-134 S-135 S-136 S-137 S-138Temperature °C 37.00 37.00 37.00 37.00 37.00 37.00 37.00Pressure (psi) 14.80 14.80 14.80 14.80 14.80 14.80 14.80Vapor Fraction 0.00 0.00 0.00 0.00 0.00 0.00 0.00Mass (kg/batch) 1471321.26 1471321.26 1471321.26 1471321.26 1471321.26 1471321.26 158271.24Mole (kmol/batch) 76129.39 76129.39 76129.39 76129.39 76129.39 76129.39 6824.67Volume (L/batch) 1525403.90 1525403.90 1525403.90 1525403.90 1525403.90 1525403.90 --Ethanol Conc. (g/L) 96.01 96.01 96.01 96.01 96.01 96.01 --State Solution Solution Solution Solution Solution Solution Vapor
Biomass 102.72 102.72 102.72 102.72 102.72 102.72 0.00Carbon Dioxide 0.00 0.00 0.00 0.00 0.00 0.00 3147.37
Corn Steep Liquor 79.15 79.15 79.15 79.15 79.15 79.15 0.00Ethanol 3181.97 3181.97 3181.97 3181.97 3181.97 3181.97 156.23
Glycerol 0.00 0.00 0.00 0.00 0.00 0.00 0.00Hydrogen 0.00 0.00 0.00 0.00 0.00 0.00 3179.82
Succinic Acid 34.15 34.15 34.15 34.15 34.15 34.15 0.00Water 72731.40 72731.40 72731.40 72731.40 72731.40 72731.40 341.25
Biomass 2526.88 2526.88 2526.88 2526.88 2526.88 2526.88 0.00Carbon Dioxide 0.00 0.00 0.00 0.00 0.00 0.00 138515.88
Corn Steep Liquor 7914.88 7914.88 7914.88 7914.88 7914.88 7914.88 0.00Ethanol 146590.06 146590.06 146590.06 146590.06 146590.06 146590.06 7197.25
Glycerol 0.00 0.00 0.00 0.00 0.00 0.00 0.00Hydrogen 0.00 0.00 0.00 0.00 0.00 0.00 6410.52
Succinic Acid 4033.23 4033.23 4033.23 4033.23 4033.23 4033.23 0.00Water 1310256.21 1310256.21 1310256.21 1310256.21 1310256.21 1310256.21 6147.61
Main Fermentation Section (Batch) (3 of 4)
Molar components (kmol/batch)
Mass components (kg/batch)
LeGendre, Logan, Mendel, Seedial
36
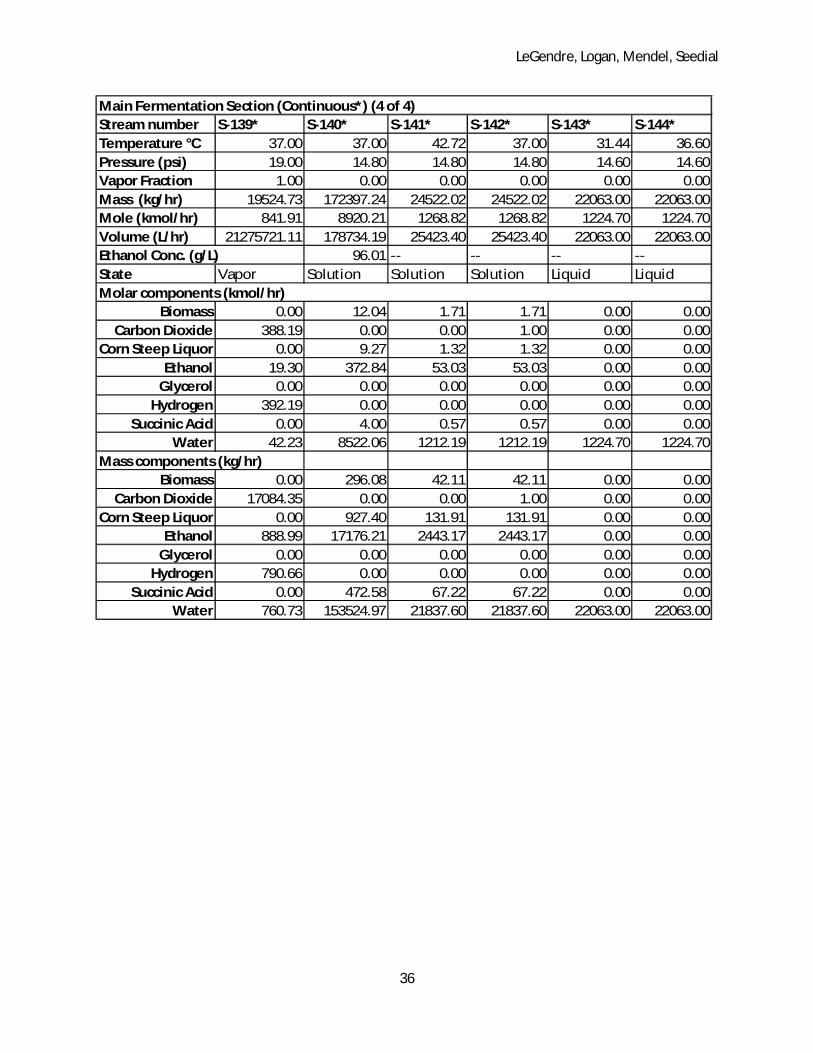
Stream number S-139* S-140* S-141* S-142* S-143* S-144*Temperature °C 37.00 37.00 42.72 37.00 31.44 36.60Pressure (psi) 19.00 14.80 14.80 14.80 14.60 14.60Vapor Fraction 1.00 0.00 0.00 0.00 0.00 0.00Mass (kg/hr) 19524.73 172397.24 24522.02 24522.02 22063.00 22063.00Mole (kmol/hr) 841.91 8920.21 1268.82 1268.82 1224.70 1224.70Volume (L/hr) 21275721.11 178734.19 25423.40 25423.40 22063.00 22063.00Ethanol Conc. (g/L) 96.01 -- -- -- --State Vapor Solution Solution Solution Liquid Liquid
Biomass 0.00 12.04 1.71 1.71 0.00 0.00Carbon Dioxide 388.19 0.00 0.00 1.00 0.00 0.00
Corn Steep Liquor 0.00 9.27 1.32 1.32 0.00 0.00Ethanol 19.30 372.84 53.03 53.03 0.00 0.00
Glycerol 0.00 0.00 0.00 0.00 0.00 0.00Hydrogen 392.19 0.00 0.00 0.00 0.00 0.00
Succinic Acid 0.00 4.00 0.57 0.57 0.00 0.00Water 42.23 8522.06 1212.19 1212.19 1224.70 1224.70
Mass components (kg/hr)Biomass 0.00 296.08 42.11 42.11 0.00 0.00
Carbon Dioxide 17084.35 0.00 0.00 1.00 0.00 0.00Corn Steep Liquor 0.00 927.40 131.91 131.91 0.00 0.00
Ethanol 888.99 17176.21 2443.17 2443.17 0.00 0.00Glycerol 0.00 0.00 0.00 0.00 0.00 0.00
Hydrogen 790.66 0.00 0.00 0.00 0.00 0.00Succinic Acid 0.00 472.58 67.22 67.22 0.00 0.00
Water 760.73 153524.97 21837.60 21837.60 22063.00 22063.00
Molar components (kmol/hr)
Main Fermentation Section (Continuous*) (4 of 4)
LeGendre, Logan, Mendel, Seedial
37

LeGendre, Logan, Mendel, Seedial
38
Stream number S-S-101 S-S-102 S-S-103 S-S-104 S-S-105 S-S-106 S-S-107 S-S-108 S-S-109 S-S-110Temperature °C 25.00 37.00 28.98 41.22 32.22 48.89 147.70 147.70 37.00 92.22Pressure (psi) 14.60 16.00 16.00 20.00 14.60 14.60 64.70 64.70 14.80 14.80Vapor Fraction 0.00 1.00 1.00 0.00 0.00 0.00 0.00 0.00 0.00 0.00Mass (kg/hr) 27,022.50 19,524.80 18,362.04 28,185.64 1,087,869.82 1,087,869.82 16,775.34 16,775.34 172,397.24 172,397.24Mole (kmol/hr) 1,500.00 841.91 807.41 1,534.51 60,386.89 60,386.89 931.19 931.19 8,920.21 8,920.21Volume (L/hr) 27,022.50 21275721.11 17,090,746.03 28,423.42 1,087,869.82 1,087,869.82 -- 16,775.34 175,294.56 175,294.56State Liquid Vapor Vapor Liquid Liquid Liquid Vapor Liquid Solution Solution
Biomass 0.00 0.00 0.00 0.00 0.00 0.00 0.00 0.00 12.04 12.04Carbon Dioxide 0.00 388.19 388.19 0.00 0.00 0.00 0.00 0.00 0.00 0.00
Corn Steep Liquor 0.00 0.00 0.00 0.00 0.00 0.00 0.00 0.00 9.27 9.27Ethanol 0.00 19.30 0.00 19.30 0.00 0.00 0.00 0.00 372.84 372.84
Gasoline -- -- -- -- -- -- -- -- -- --Methane 0.00 0.00 0.00 0.00 0.00 0.00 0.00 0.00 0.00 0.00
Oxygen 0.00 0.00 0.00 0.00 0.00 0.00 0.00 0.00 0.00 0.00Nitrogen 0.00 0.00 0.00 0.00 0.00 0.00 0.00 0.00 0.00 0.00Glycerol 0.00 0.00 0.00 0.00 0.00 0.00 0.00 0.00 0.00 0.00
Hydrogen 0.00 392.19 392.19 0.00 0.00 0.00 0.00 0.00 0.00 0.00Succinic Acid 0.00 0.00 0.00 0.00 0.00 0.00 0.00 0.00 4.00 4.00
Water 1,500.00 42.23 27.03 1,515.21 60,386.89 60,386.89 931.19 931.19 8,522.06 8,522.06
Biomass 0.00 0.00 0.00 0.00 0.00 0.00 0.00 0.00 296.08 296.08Carbon Dioxide 0.00 17,084.24 17,084.24 0.00 0.00 0.00 0.00 0.00 0.00 0.00
Corn Steep Liquor 0.00 0.00 0.00 0.00 0.00 0.00 0.00 0.00 927.40 927.40Ethanol 0.00 889.13 0.22 889.13 0.00 0.00 0.00 0.00 17,176.21 17,176.21
Gasoline 0.00 0.00 0.00 0.00 0.00 0.00 0.00 0.00 0.00 0.00Methane 0.00 0.00 0.00 0.00 0.00 0.00 0.00 0.00 0.00 0.00
Oxygen 0.00 0.00 0.00 0.00 0.00 0.00 0.00 0.00 0.00 0.00Nitrogen 0.00 0.00 0.00 0.00 0.00 0.00 0.00 0.00 0.00 0.00Glycerol 0.00 0.00 0.00 0.00 0.00 0.00 0.00 0.00 0.00 0.00
Hydrogen 0.00 790.66 790.66 0.00 0.00 0.00 0.00 0.00 0.00 0.00Succinic Acid 0.00 0.00 0.00 0.00 0.00 0.00 0.00 0.00 472.58 472.58
Water 27,022.50 760.77 486.92 27,296.51 1,087,869.82 1,087,869.82 16,775.34 16,775.34 153,524.97 153,524.97
Molar components (kmol/hr)
Mass components (kg/hr)
Separation Section Material Balance Block (1 of 4)
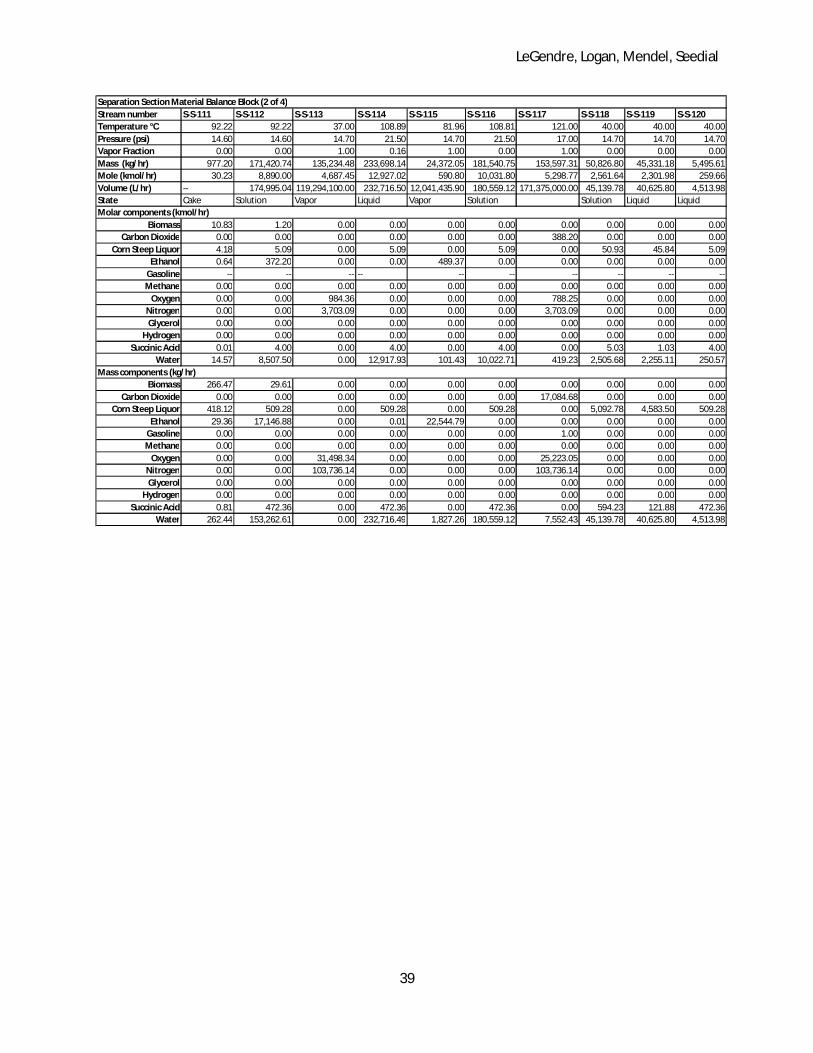
LeGendre, Logan, Mendel, Seedial
39
Stream number S-S-111 S-S-112 S-S-113 S-S-114 S-S-115 S-S-116 S-S-117 S-S-118 S-S-119 S-S-120Temperature °C 92.22 92.22 37.00 108.89 81.96 108.81 121.00 40.00 40.00 40.00Pressure (psi) 14.60 14.60 14.70 21.50 14.70 21.50 17.00 14.70 14.70 14.70Vapor Fraction 0.00 0.00 1.00 0.16 1.00 0.00 1.00 0.00 0.00 0.00Mass (kg/hr) 977.20 171,420.74 135,234.48 233,698.14 24,372.05 181,540.75 153,597.31 50,826.80 45,331.18 5,495.61Mole (kmol/hr) 30.23 8,890.00 4,687.45 12,927.02 590.80 10,031.80 5,298.77 2,561.64 2,301.98 259.66Volume (L/hr) -- 174,995.04 119,294,100.00 232,716.50 12,041,435.90 180,559.12 171,375,000.00 45,139.78 40,625.80 4,513.98State Cake Solution Vapor Liquid Vapor Solution Solution Liquid Liquid
Biomass 10.83 1.20 0.00 0.00 0.00 0.00 0.00 0.00 0.00 0.00Carbon Dioxide 0.00 0.00 0.00 0.00 0.00 0.00 388.20 0.00 0.00 0.00
Corn Steep Liquor 4.18 5.09 0.00 5.09 0.00 5.09 0.00 50.93 45.84 5.09Ethanol 0.64 372.20 0.00 0.00 489.37 0.00 0.00 0.00 0.00 0.00
Gasoline -- -- -- -- -- -- -- -- -- --Methane 0.00 0.00 0.00 0.00 0.00 0.00 0.00 0.00 0.00 0.00
Oxygen 0.00 0.00 984.36 0.00 0.00 0.00 788.25 0.00 0.00 0.00Nitrogen 0.00 0.00 3,703.09 0.00 0.00 0.00 3,703.09 0.00 0.00 0.00Glycerol 0.00 0.00 0.00 0.00 0.00 0.00 0.00 0.00 0.00 0.00
Hydrogen 0.00 0.00 0.00 0.00 0.00 0.00 0.00 0.00 0.00 0.00Succinic Acid 0.01 4.00 0.00 4.00 0.00 4.00 0.00 5.03 1.03 4.00
Water 14.57 8,507.50 0.00 12,917.93 101.43 10,022.71 419.23 2,505.68 2,255.11 250.57
Biomass 266.47 29.61 0.00 0.00 0.00 0.00 0.00 0.00 0.00 0.00Carbon Dioxide 0.00 0.00 0.00 0.00 0.00 0.00 17,084.68 0.00 0.00 0.00
Corn Steep Liquor 418.12 509.28 0.00 509.28 0.00 509.28 0.00 5,092.78 4,583.50 509.28Ethanol 29.36 17,146.88 0.00 0.01 22,544.79 0.00 0.00 0.00 0.00 0.00
Gasoline 0.00 0.00 0.00 0.00 0.00 0.00 1.00 0.00 0.00 0.00Methane 0.00 0.00 0.00 0.00 0.00 0.00 0.00 0.00 0.00 0.00
Oxygen 0.00 0.00 31,498.34 0.00 0.00 0.00 25,223.05 0.00 0.00 0.00Nitrogen 0.00 0.00 103,736.14 0.00 0.00 0.00 103,736.14 0.00 0.00 0.00Glycerol 0.00 0.00 0.00 0.00 0.00 0.00 0.00 0.00 0.00 0.00
Hydrogen 0.00 0.00 0.00 0.00 0.00 0.00 0.00 0.00 0.00 0.00Succinic Acid 0.81 472.36 0.00 472.36 0.00 472.36 0.00 594.23 121.88 472.36
Water 262.44 153,262.61 0.00 232,716.49 1,827.26 180,559.12 7,552.43 45,139.78 40,625.80 4,513.98
Separation Section Material Balance Block (2 of 4)
Molar components (kmol/hr)
Mass components (kg/hr)

LeGendre, Logan, Mendel, Seedial
40
Stream number S-S-121 S-S-122 S-S-123 S-S-124 S-S-125 S-S-126 S-S-127 S-S-128 S-S-129 S-S-130Temperature °C 40.00 78.40 81.95 50.00 25.00 50.00 33.00 81.95 81.95 81.95Pressure (psi) 14.70 14.70 14.70 14.70 14.70 14.70 14.70 17.00 17.00 17.00Vapor Fraction 0.00 0.00 0.00 0.00 0.00 0.00 0.00 0.00 0.13 1.00Mass (kg/hr) 458.81 18,035.83 6,336.03 18,035.83 360.72 18,396.55 4,513.98 165,301.18 189,673.23 189,673.23Mole (kmol/hr) 3.89 391.50 199.30 391.50 -- -- 250.57 4,046.71 4,637.51 4,637.51Volume (L/hr) 22,859.10 7,541.80 22,859.10 457.18 22,859.10 4,513.98 205,879.09 236,280.23 236,280.23State Solid Liquid Liquid Liquid Liquid Liquid Liquid Liquid Mixed Vapor
Biomass 0.00 0.00 0.00 0.00 0.00 0.00 0.00 0.00 0.00 0.00Carbon Dioxide 0.00 0.00 0.00 0.00 0.00 0.00 0.00 0.00 0.00 0.00
Corn Steep Liquor 0.00 0.00 0.00 0.00 0.00 0.00 0.00 0.00 0.00 0.00Ethanol 0.00 391.50 97.87 391.50 0.00 391.50 0.00 3,293.63 3,783.00 3,783.00
Gasoline -- -- -- -- -- -- -- -- -- --Methane 0.00 0.00 0.00 0.00 0.00 0.00 0.00 0.00 0.00 0.00
Oxygen 0.00 0.00 0.00 0.00 0.00 0.00 0.00 0.00 0.00 0.00Nitrogen 0.00 0.00 0.00 0.00 0.00 0.00 0.00 0.00 0.00 0.00Glycerol 0.00 0.00 0.00 0.00 0.00 0.00 0.00 0.00 0.00 0.00
Hydrogen 0.00 0.00 0.00 0.00 0.00 0.00 0.00 0.00 0.00 0.00Succinic Acid 3.89 0.00 0.00 0.00 0.00 0.00 0.00 0.00 0.00 0.00
Water 0.00 0.00 101.43 0.00 0.00 0.00 250.57 753.08 854.51 854.51
Biomass 0.00 0.00 0.00 0.00 0.00 0.00 0.00 0.00 0.00 0.00Carbon Dioxide 0.00 0.00 0.00 0.00 0.00 0.00 0.00 0.00 0.00 0.00
Corn Steep Liquor 0.00 0.00 0.00 0.00 0.00 0.00 0.00 0.00 0.00 0.00Ethanol 0.00 18,035.83 4,508.77 18,035.83 0.00 18,035.83 0.00 151,734.45 174,279.23 174,279.23
Gasoline 0.00 0.00 0.00 0.00 360.72 360.72 0.00 0.00 0.00 0.00Methane 0.00 0.00 0.00 0.00 0.00 0.00 0.00 0.00 0.00 0.00
Oxygen 0.00 0.00 0.00 0.00 0.00 0.00 0.00 0.00 0.00 0.00Nitrogen 0.00 0.00 0.00 0.00 0.00 0.00 0.00 0.00 0.00 0.00Glycerol 0.00 0.00 0.00 0.00 0.00 0.00 0.00 0.00 0.00 0.00
Hydrogen 0.00 0.00 0.00 0.00 0.00 0.00 0.00 0.00 0.00 0.00Succinic Acid 458.81 0.00 0.00 0.00 0.00 0.00 0.00 0.00 0.00 0.00
Water 0.00 0.00 1,827.26 0.00 0.00 0.00 4,513.98 13,566.74 15,394.00 15,394.00
Separation Section Material Balance Block (3 of 4)
Molar components (kmol/batch)
Mass components (kg/batch)
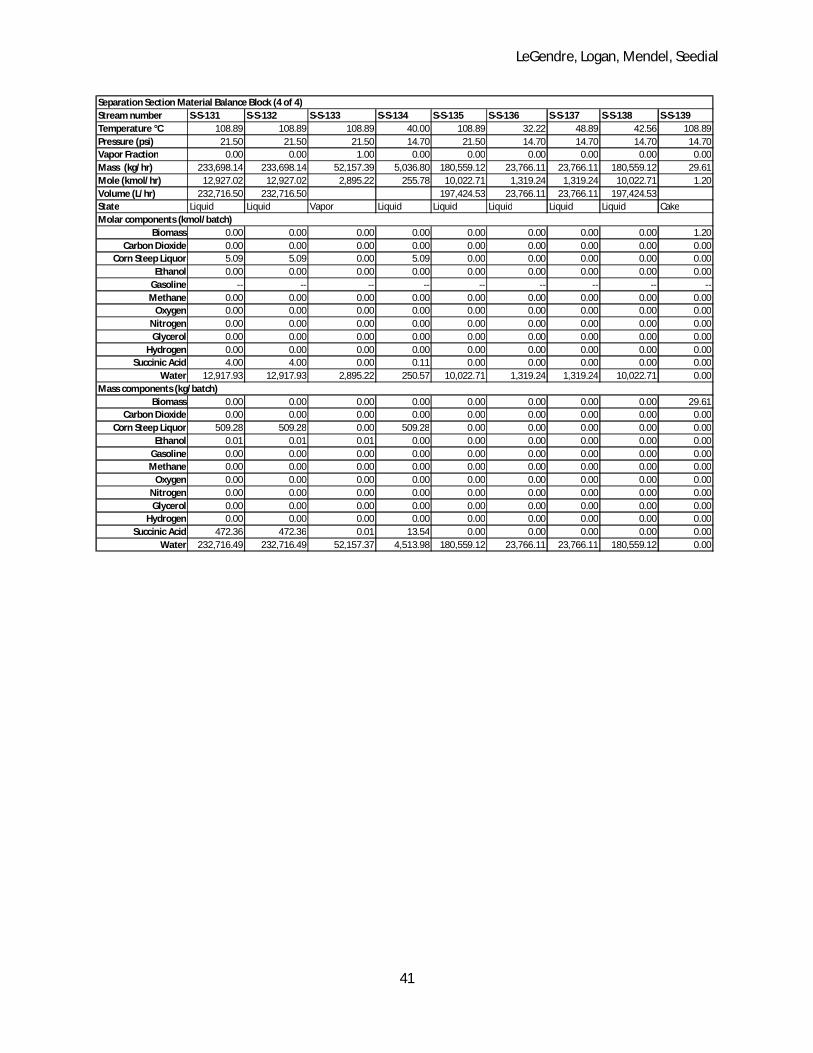
LeGendre, Logan, Mendel, Seedial
41
Stream number S-S-131 S-S-132 S-S-133 S-S-134 S-S-135 S-S-136 S-S-137 S-S-138 S-S-139Temperature °C 108.89 108.89 108.89 40.00 108.89 32.22 48.89 42.56 108.89Pressure (psi) 21.50 21.50 21.50 14.70 21.50 14.70 14.70 14.70 14.70Vapor Fraction 0.00 0.00 1.00 0.00 0.00 0.00 0.00 0.00 0.00Mass (kg/hr) 233,698.14 233,698.14 52,157.39 5,036.80 180,559.12 23,766.11 23,766.11 180,559.12 29.61Mole (kmol/hr) 12,927.02 12,927.02 2,895.22 255.78 10,022.71 1,319.24 1,319.24 10,022.71 1.20Volume (L/hr) 232,716.50 232,716.50 197,424.53 23,766.11 23,766.11 197,424.53State Liquid Liquid Vapor Liquid Liquid Liquid Liquid Liquid Cake
Biomass 0.00 0.00 0.00 0.00 0.00 0.00 0.00 0.00 1.20Carbon Dioxide 0.00 0.00 0.00 0.00 0.00 0.00 0.00 0.00 0.00
Corn Steep Liquor 5.09 5.09 0.00 5.09 0.00 0.00 0.00 0.00 0.00Ethanol 0.00 0.00 0.00 0.00 0.00 0.00 0.00 0.00 0.00
Gasoline -- -- -- -- -- -- -- -- --Methane 0.00 0.00 0.00 0.00 0.00 0.00 0.00 0.00 0.00
Oxygen 0.00 0.00 0.00 0.00 0.00 0.00 0.00 0.00 0.00Nitrogen 0.00 0.00 0.00 0.00 0.00 0.00 0.00 0.00 0.00Glycerol 0.00 0.00 0.00 0.00 0.00 0.00 0.00 0.00 0.00
Hydrogen 0.00 0.00 0.00 0.00 0.00 0.00 0.00 0.00 0.00Succinic Acid 4.00 4.00 0.00 0.11 0.00 0.00 0.00 0.00 0.00
Water 12,917.93 12,917.93 2,895.22 250.57 10,022.71 1,319.24 1,319.24 10,022.71 0.00
Biomass 0.00 0.00 0.00 0.00 0.00 0.00 0.00 0.00 29.61Carbon Dioxide 0.00 0.00 0.00 0.00 0.00 0.00 0.00 0.00 0.00
Corn Steep Liquor 509.28 509.28 0.00 509.28 0.00 0.00 0.00 0.00 0.00Ethanol 0.01 0.01 0.01 0.00 0.00 0.00 0.00 0.00 0.00
Gasoline 0.00 0.00 0.00 0.00 0.00 0.00 0.00 0.00 0.00Methane 0.00 0.00 0.00 0.00 0.00 0.00 0.00 0.00 0.00
Oxygen 0.00 0.00 0.00 0.00 0.00 0.00 0.00 0.00 0.00Nitrogen 0.00 0.00 0.00 0.00 0.00 0.00 0.00 0.00 0.00Glycerol 0.00 0.00 0.00 0.00 0.00 0.00 0.00 0.00 0.00
Hydrogen 0.00 0.00 0.00 0.00 0.00 0.00 0.00 0.00 0.00Succinic Acid 472.36 472.36 0.01 13.54 0.00 0.00 0.00 0.00 0.00
Water 232,716.49 232,716.49 52,157.37 4,513.98 180,559.12 23,766.11 23,766.11 180,559.12 0.00
Mass components (kg/batch)
Separation Section Material Balance Block (4 of 4)
Molar components (kmol/batch)

LeGendre, Logan, Mendel, Seedial
42
Process Description Section V

LeGendre, Logan, Mendel, Seedial
43
Process Description
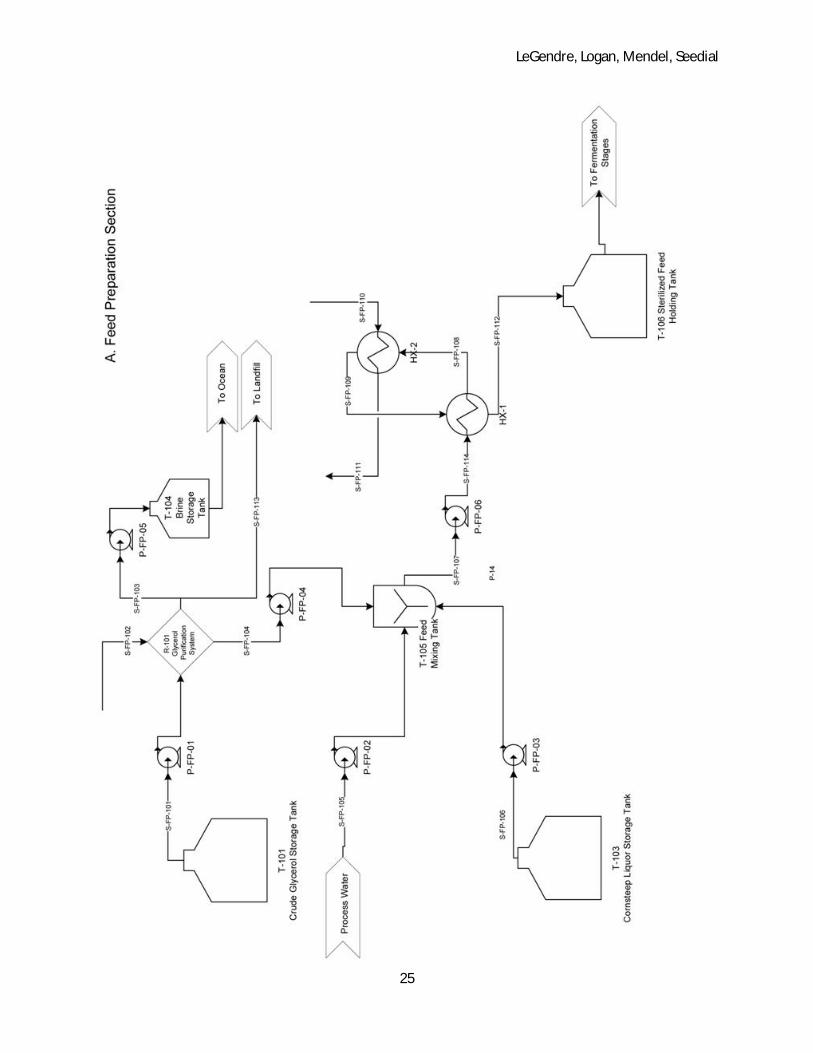
Fermentation Feed Preparation Section
In the continuous feed preparation section, crude glycerol is processed and diluted in
preparation for subsequent fermentation of glycerol to ethanol by Escherichia coli in the fermentation
plant sections.
A three day supply of crude glycerol is kept in stock in a storage tank. This glycerol feedstock is a
byproduct of biodiesel manufacturing, and its exact composition will differ based on the type of oil
(soybean, rape-seed, others) used in the upstream biodiesel process, the type of caustic solution used in
the biodiesel process, and the degree of methanol removal processing in the biodiesel plant. Methanol
is typically separated from the crude glycerol for recycle back into the biodiesel process, so the
assumption that there is no methanol in the incoming feed for the material balance calculations is
sound. However, the crude feedstock purification system is designed to remove methanol in the worst
case scenario that a small amount of methanol is contained in the feedstock and not previously
removed by the biodiesel manufacturing process. Crude glycerol feedstock is highly variable in
composition, but a typical composition according to EET Corporation (supplier of the crude glycerol
purification system) is summarized in Table PD-1, where MONG refers to Matter: Organic, Non-Glycerol,
which includes free fatty acids, monoglycerides, and diglycerides. This typical composition is in
agreement with a technical data sheet on a crude glycerol product from industrial glycerol supplier
Emergent Industrial Solutions.
Material Weight Percent Glycerol 85 Water 7 NaCl 4 MONG 4
Table PD-1. Typical composition of crude glycerol feedstock.
The crude glycerol feedstock is purified so that it contains only water and glycerol. This
purification takes place in a patent-pending, fully-contained, and licensed glycerol purification system

LeGendre, Logan, Mendel, Seedial
44
sold by company EET Corporation. The purification takes place by a parallel combination of reverse
osmosis, electro-pressure membrane technology, and electro-dialysis. The process requires an input of
process water and yields a cake of MONG and a concentrated brine stream. The MONG, at the
suggestion of industrial consultant Mr. Bruce Vrana, may be distributed to farmers as a nutrient.
The concentration of salts in the crude glycerol, although specified in the problem statement as
helpful for the E. coli, is high enough in actuality that any 304 stainless steel processing equipment
would be easily corroded according to Mr. Bruce Vrana. Additionally, it is likely that any potentially
higher quantity of salts would kill microorganisms such as E. coli. As such, the crude glycerol salts and
impurities are removed, and then a nutrient supplement, Corn Steep Liquor (CSL), an inexpensive
nutrient-rich byproduct of the wet-milling of corn, is added. A three day supply of the CSL nutrient is
stored in T-103, and it is mixed with a 10 minutes residence time with the purified glycerol and water in
mixing tank T-105 to prepare a feed with a concentration of 5 g/L CSL as suggested by Agarwal et al. CSL
is typically 50% solids and 50% water by weight. It contains variable concentrations of salts, minerals,
and amino acids to promote microorganism metabolism. The glycerol is diluted with additional process
water at this step so that the ethanol concentration in the downstream batch fermenters does not
exceed 100 g/L, as specified in the problem statement (see page 269).
The mixed glycerol feedstock solution at this point consists of 80.3% water, 19.2 % glycerol, and
0.5 % CSL (percentages by weight) at room temperature. This feedstock must be sterilized to a
temperature of 121°C (sterilization temperature for all microorganisms, including heat-resistant spores)
before it can be sent to the fermentation section of the plant. In order to minimize both hot and cold
utility requirements, the feed is sterilized in a network of two heat exchangers, HX-1 and HX-2. In the
first heat exchanger, the cold feed is pre-heated to 111 °C, using already sterilized feed at 121 °C on the
hot side of the exchanger. This sterilized feed is cooled to 37 °C, the optimal temperature for
fermentation. The second exchanger requires a 150 psig steam utility, at 4045 kg/hr, to heat the pre-

LeGendre, Logan, Mendel, Seedial
45
heated feed from 111 °C to 121 °C. The sterilized and cooled feed is then stored in the sterilized feed
holding tank, T-106, from which batch portions of sterilized feed will be fed to the seed fermentation
and main fermentation sections of the plant.
LeGendre, Logan, Mendel, Seedial
46
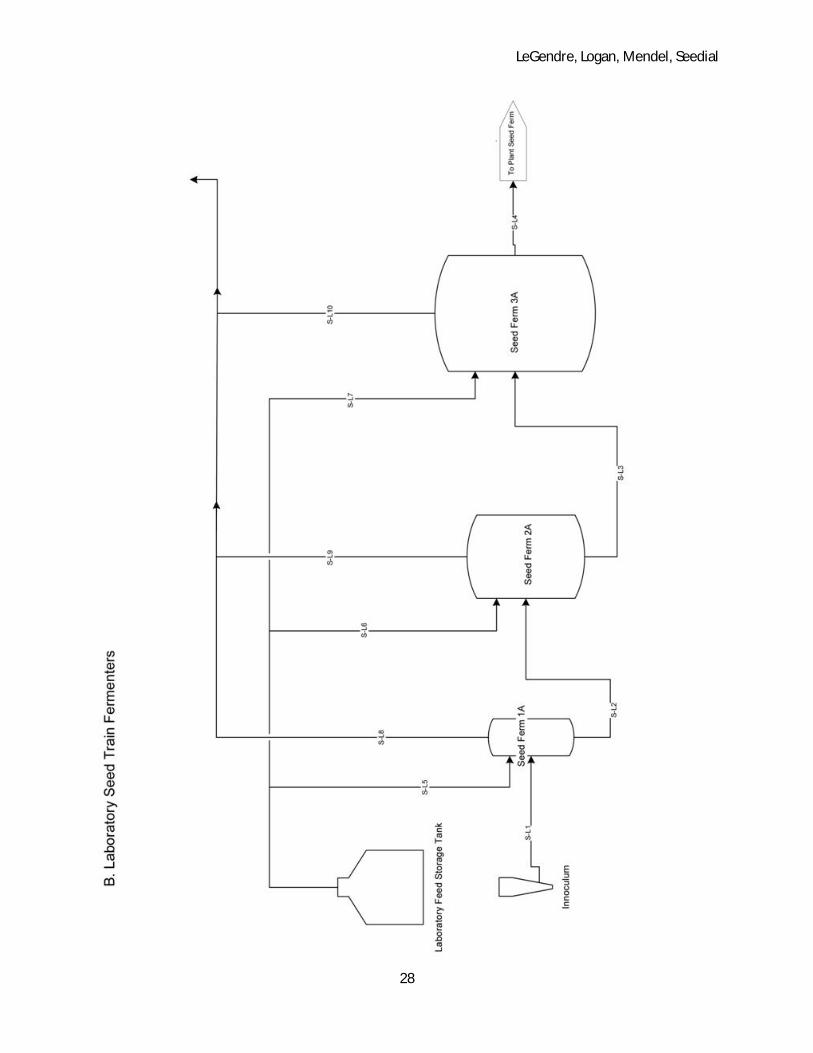
Laboratory Section
A batch seed fermentation process is designed to account for the fact that a 1 mL aliquot of cells
cannot be added to fermenter tanks of the large required volume for the 50 MM gallon/year ethanol
production rate. This seed fermentation occurs first in a laboratory, and then in the plant, before
significant enough volumes of seed fermentation broth have been produced for charging the main
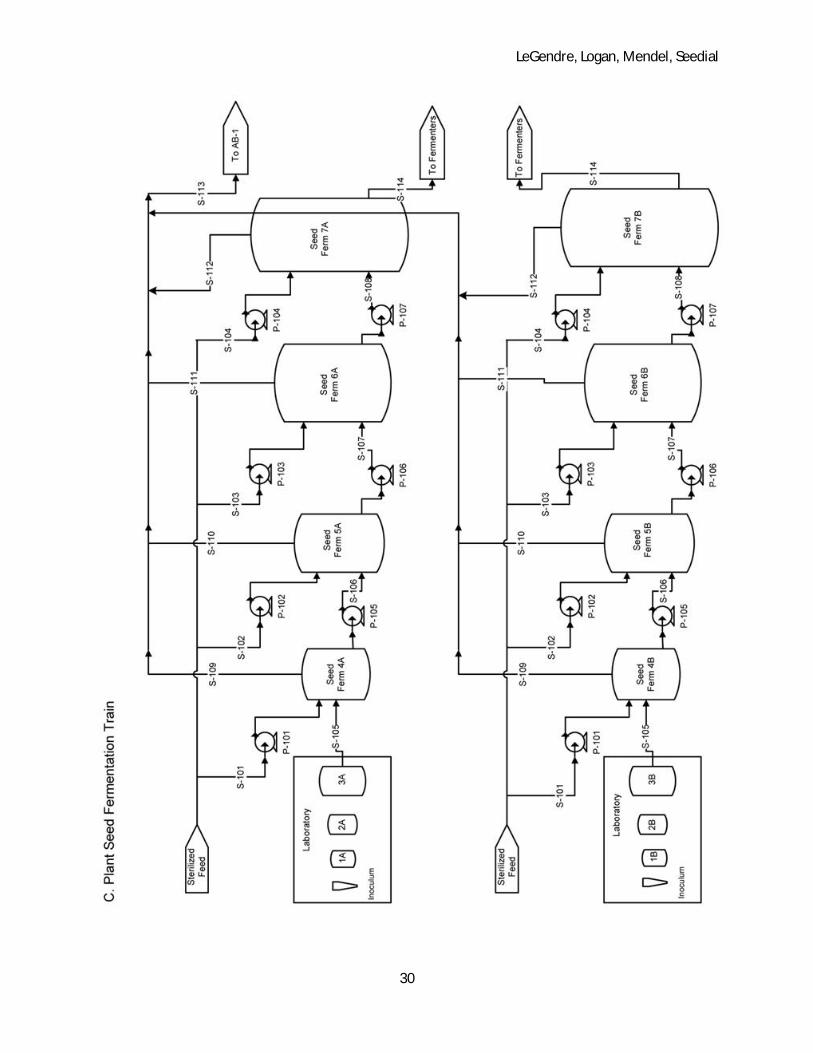
fermentation section of the plant. There are two seed fermentation trains, each of which will provide
the appropriate cell volumes for six of the twelve full-scale fermenters in the main fermentation section.
These two trains are labeled as A and B on the process flow diagrams. The laboratory process flow
diagram shows only one of these two fermentation seed trains. They occur in the process in a staggered
manner to be later described.
The laboratory section begins with a 1 mL aliquot or inoculum of E. coli, which is a hypothetical
naturally occurring strain of the microorganism that has been shown to anaerobically ferment glycerol
to ethanol (as per the problem statement). It is stored frozen in the laboratory. The reactions and
conversions of glycerol by the organism (given in the problem statement) are summarized below:
Glycerol à CO2 + H2 + Ethanol (98%)
CO2 + Glycerol à Succinic Acid + H2O (1%)
Glycerol à 3.0075(Biomass) + H2O (1%)
The problem statement specifies that a sample volume of E. coli may be grown to a volume
equal to 20 times that of the original sample in each successive scale-up step. The problem statement
additionally specifies a desired end ethanol titer of 100 g/L, and an ethanol production rate of 1.6 grams
ethanol formed per liter of reaction volume per hour. Dimensional analysis reveals that 62.5 hours are
required for the first scale-up, in which the 1 mL aliquot is added to ~19 mL of sterilized glycerol feed in
a vapor-locked 25 mL test tube (Seed Ferm 1A/1B) to provide a working volume of 20 mL. The volume of

LeGendre, Logan, Mendel, Seedial
47
the reaction changes over time, so the volume requirements are approximations. The optimal pH of 7,
temperature of 37 °C, and anaerobic conditions are maintained.
The 20 mL portion is then transferred to a second vapor-locked seed fermenter (Seed Ferm
2A/2B) with a volume of 500 mL. Sterilized glycerol feed is added to create a working volume of about
400 mL. The time for reaction is reduced to 60 hours, as the sample added to Seed Ferm 2A/2B already
contains a small portion of ethanol. This 400 mL sample is then charged to the last laboratory stage
fermenter (Seed Ferm 3A/3B), with a working volume of 8 L and an actual volume of 10 L and 304
stainless steel construction. The volume difference is made up with the sterilized glycerol feed. Another
60 hour reaction period follows. Then, the 8 L volumes of prepared cells are taken to the plant seed
fermentation section, where they are added to the first plant seed fermenters (Seed Ferm 4A/4B).
LeGendre, Logan, Mendel, Seedial
48
Plant Seed Fermentation Section
The 8 L samples from the largest lab scale fermenters (Seed Ferm 3A/3B) provide the E. coli
source for the first plant scale fermenters (Seed Ferm 4A/4B), with working volumes of 160 L. Pumped
into these 200 L, 304 stainless steel vessels, is a ~152 L portion of the sterilized glycerol feed from the
feed preparation section. The reaction proceeds for 60 hours. In this and all subsequent fermenter units,
the optimal pH of 7, temperature of 37 °C, and anaerobic conditions are maintained. A slight positive
pressure (14.8 psia) as suggested in the problem statement maintains the anaerobic condition required
for the reaction.
The total volume from Seed Ferm 4A/4B is then pumped to Seed Ferm 5A/5B, which are 4,500 L
vessels of 304 stainless steel construction. Sterilized glycerol feed from the feed preparation section is
pumped to the fermenters to provide a working volume of ~3,200 L. The reaction proceeds for 60 hours.
Then, the total volume from Seed Ferm 5A/5B is pumped to Seed Ferm 6A/6B, which are 85,000 L
vessels of 304 stainless steel construction. Sterilized glycerol feed from the feed preparation section is
pumped to the fermenters to provide a working volume of ~64,000 L. The reaction proceeds for 60
hours. The volume from Seed Ferm 6A/6B is then pumped to Seed Ferm 7A/7B, which are 650,000 L
vessels of 304 stainless steel construction. Sterilized glycerol feed from the feed preparation section is
pumped to the fermenters to provide a working volume of ~460,000 L. This volume is not a multiple of
twenty from the previous scale fermenter, but rather it is determined by the portion of E. coli solution
required for charging the twelve fermenters in the main fermentation section. After the 60 hour
fermentation period, one sixth of the solution contained in Seed Ferm 7A/7B (~77,090 L) is pumped to
one of the large fermenter (FERM1-12) units in the main fermentation section. This volume corresponds
to 1/20 of the working volume required in the large scale fermenters, which have an initial working
volume of 1,577,624 and an end working volume of 1,525,404 L.
LeGendre, Logan, Mendel, Seedial
49
The hydrogen and carbon dioxide gas evolved from these fermenters, along with the small
portions of ethanol and water vaporized (4.9% and 0.49% by mass respectively) are sent through a
blower (B-101) to the Absorber column (AB-1) in the separation section.

LeGendre, Logan, Mendel, Seedial
50
Main Fermentation Section
Twelve 2,000,000 L fermenter tanks of 304 stainless steel construction are the most important
part of the process, where the majority of the ethanol and succinic acid are produced in a fully staggered
batch processing mode. These fermenters also represent the bottleneck in the process schedule. The
schedule of charging, fermenting, and draining in these fermenters is presented in Table PD-2.
Cycle based on largest fermenters (bottleneck): time (hr)
Charge with biomass from Seed 7A/B 27 (stagger time)
Charge with glycerol feed from T-106 5
Ferment/React 60
Drain to T-107 (95%) 5
Charge with glycerol feed 5
Ferment/React 60
Drain to T-107 (95%) 5
Charge with glycerol feed 5
Ferment/React 60
Drain to T-107 (100%) 5
Clean-in-Place 60
Total 297 hours Table PD-2. Schedule for Batch Operation in Main Fermentation Section
One cycle consists of three fermentation/ reaction periods or batches, as seen above. All flow
rate values in the batch material balance blocks refer to the flow requirements for one batch within
each three-batch cycle.
Before the first fermentation period, each FERM-1 through FERM-12 tank is charged with a
volume from the smaller reactor Seed Ferm 7A/B (this volume corresponding to 1/20 of total FERM1
working volume), and then charged with sterilized glycerol feed from T-106 to reach the full working
volume of ~1,525,404 L. The fermentation proceeds for 60 hours.
After the first fermentation period, however, in FERM1 – FERM12, 5% (1/20) of the volume is
saved in the fermenter tank rather than drained to T-107. This portion remains as the seed from which
the next reaction period begins. Therefore only 95% of the material proceeds to the continuous process

LeGendre, Logan, Mendel, Seedial
51
at this point. After the second 60-hour fermentation period in FERM1-FERM12, 5% of the volume is
again retained. After the third fermentation, 100% is drained so that the tank can be cleaned.
Shuler & Kargi outline the process of cell/biomass recycle and warn against it only in the case of
genetically modified cells. Oftentimes in industrial processes, new E. coli cells are provided for every
fermentation step (all grown from separate seed trains). However, the E. coli cells are not genetically
modified, and are a wild strain, so there is little risk for genetic mutations. By recycling biomass, the cost
for the landfill of solids is greatly reduced, and the number of seed fermenters is minimized. Due to the
95% draining for the first and second fermentation periods, to convert from batch to continuous in the
mass balances, a multiplying factor of 2.9 (rather than 3) must be used, for determining the total liquid
flow rate leaving the batch section over the 297 hour cycle time.
Cleanliness dictates that eventually new biomass is used, however, as the sterilization of the
equipment and incoming feed may not have been 100% effective. The number of fermentation periods
before cleaning, three, was suggested by industrial consultant Mr. Bruce Vrana, along with the 60 hour
duration of the cleaning period. The cleaning system is designed as a clean-in-place system with a series
of spray nozzles which will apply a dilute caustic solution to the inside of the fermentation units.
The slightly exothermic fermentation reaction corresponds to an adiabatic temperature rise of
about 10.4 °F in each FERM1-12 unit, so a pump and heat exchanger (HX-FERM) are designed to
maintain the optimal temperature of 37 °C (98.6 °F) by recirculating the material in the fermentation
units for the duration of the fermentation periods.
At the end of each fermentation period, the fermentation broth in each reactor contains about
10% ethanol by mass. The “beer” or broth is pumped from each fermenter unit to the fermentation
broth holding tank, T-107. From this tank, broth is fed to the separation section, starting at HX-3.

LeGendre, Logan, Mendel, Seedial
52
The hydrogen and carbon dioxide gases evolved from these fermenters, along with the small
portions of ethanol and water vaporized (4.9% and 0.49% by mass respectively) are sent through a
blower (B-101) to the Absorber column (AB-1) in the separation section for further ethanol recovery.
A visualization of the staggered schedule time is provided in Figure PD-1. Three separate 3-
batch, 297 hour cycles are displayed in the Gantt chart. The top bands of the Gantt chart represent the
two seed fermentation trains, with seed fermenter 7A/7B represented by the bands with the gray
portions, and the bottom bands represent the twelve 2,000,000 L fermentation tanks, with three 60
hour reaction times and one 60 hour cleaning time.
Figure PD-1. Gantt Chart: Schedule for Batch Operation in Main Fermentation Section

LeGendre, Logan, Mendel, Seedial
53
Separation Section
The separation section serves several purposes: recovering ethanol from the vapor phase
leaving the fermenters, separating biomass from the fermentation broth, separating ethanol from water
and succinic acid, and finally separating succinic acid from water.
The biomass is separated in two steps, first through a rotary drum filter (RDF-1) which removes
266.5 kg/hr of biomass. The remaining 29.6 kg/hr is removed through a hopper in the bottom of the
distillation tower.
There are two ethanol feeds to the separations section of the plant. First and mainly, ethanol is
fed from the fermenters through stream S-S-109. First, HX-3 heats up the fermentation broth to 92°C,
past the deactivation temperature of E. coli, by utilizing the heat from the bottoms stream of the
distillation tower to reduce the re-boiler heat duty. After filtering out the biomass, this stream is fed
into the distillation column (D-1). The second feed comes from the vapor released from the fermenters
during the reaction period. This feed is supplied to the absorber tower AB-1 which absorbs the ethanol
from the vapor. This stream is then fed into the distillation tower. The remaining vapor from AB-1,
which contains a significant quantity of hydrogen, is fed into the furnace which supplies part of the
reboiler heat duty.
The distillation tower (D-1) is the main ethanol separation section. According to the molecular
sieve specification information from Mr. Bruce Vrana, the column top product must be at least 92% by
weight ethanol. The third feed to the tower is a recycle stream from the molecular sieves, which is used
to purge the water extracted from the azeotropic feed. There are 32 theoretical stages which correlate
to 79 internal actual stages plus the reboiler and condenser. The reboiler has a heat duty of
110.7MMBtu/hr, of which, 76.9MMBtu/hr is provided by the furnace (FN-1) which is fed by the
hydrogen from the fermenters, while the remaining 33.8MMBtu/hr is provided by steam through a
kettle vaporizer heat exchanger (HX-6). The condenser is a partial condenser because the feed to the
LeGendre, Logan, Mendel, Seedial
54
molecular sieve must be vapor. The condenser heat duty is -68.1MMBtu/hr, which is provided by cooling
water through a heat exchanger (HX-4).
The molecular sieves (MS-1) produce a stream of pure ethanol (>99.5% by weight) (S-S-112).
However, in order to desorb the water from the molecular sieves, 20% of the ethanol produced must be
used to flush the water out of the system, resulting in a steam with 37% by weight water (the remainder
ethanol) that must be recycled to the distillation column in stream S-S-123. Stream S-S-123 can vary in
composition according to the problem statement, so the distillation column was designed to produce
92.5% by weight Ethanol as the distillate so that small fluctuations do not result in lower than 92% by
weight ethanol concentrations fed to the molecular sieves.
The pure ethanol is then cooled to reduce its volatility in heat exchanger HX-5, which uses a
cooling water utility. The ethanol is then denatured with Gasoline to 5% by volume before being stored
to be sold.
The bottoms product from the distillation column feeds into the section where succinic acid is
separated. Here the feed contains water, succinic acid, and some remnants of corn steep liquor (mostly
water and any salts not consumed by growing E. coli). Succinic acid is minimally soluble in water, while
the salts in corn steep liquor are highly soluble. All solids that were part of the corn steep liquor have
already been filtered out by RDF-1 and the hopper in the distillation column. In stream S-S-116 the
concentration of succinic acid is 2.62 g/L, just below the solubility point of about 3 g/L. Electrodialysis
can increase the concentration of succinic acid by at least four times according to Meynial-Salles et al.
At 10.4 g/L or more, the succinic acid and corn steep liquor is fed into the crystallizer where the succinic
acid precipitates to 3 g/L. The liquid is then re-circulated to the concentrated steam of the electro-
dialysis unit to reduce the loss of succinic acid. 10% by volume of the electro-dialysis solution is
replenished by stream S-S-127, while 10% by volume is purged in S-S-134 to provide an outlet for the
corn steep liquor. As the exact manner in which the corn steep liquor and succinic acid will precipitate is

LeGendre, Logan, Mendel, Seedial
55
more difficult to model, excessive quantities of purging and low increases in concentration through the
electro-dialysis have been assumed to ensure the cost is lower than calculated. The specifics of this
portion will need to be found through direct experimentation with the system. The succinic acid crystals
are then dried in DR-1 before being stored and sold.
LeGendre, Logan, Mendel, Seedial
56
Energy Balance and Benchmark
Section V
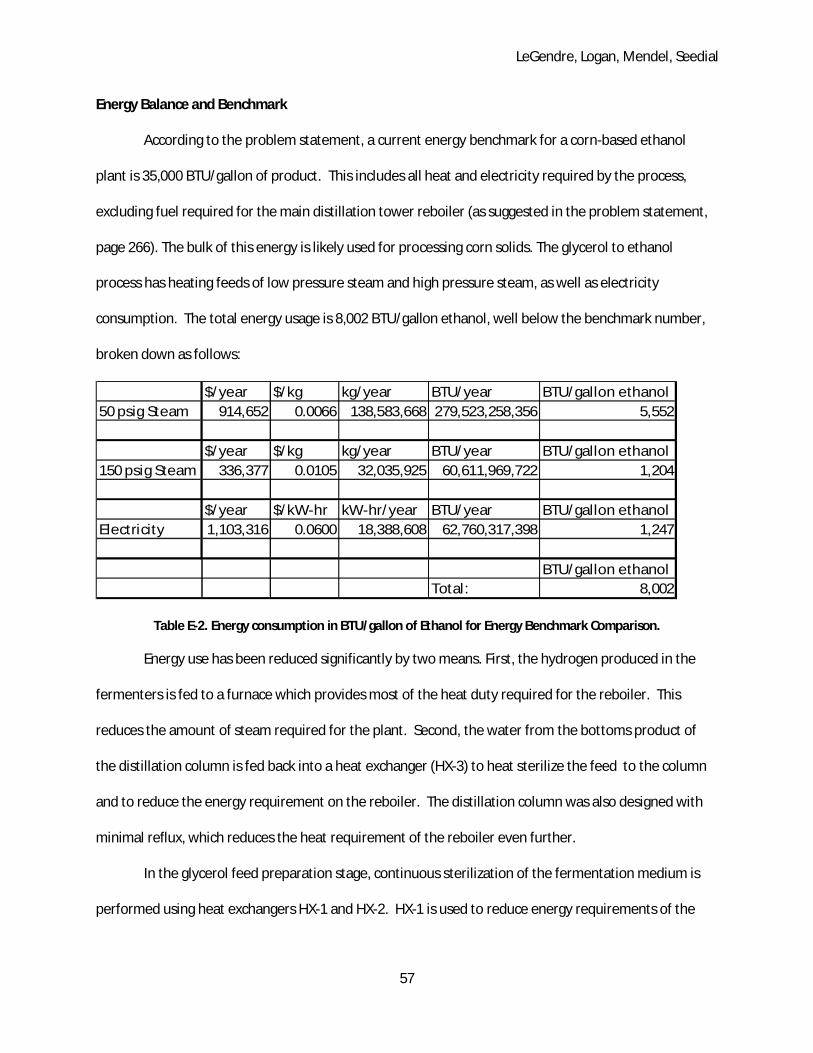
LeGendre, Logan, Mendel, Seedial
57
Energy Balance and Benchmark
According to the problem statement, a current energy benchmark for a corn-based ethanol
plant is 35,000 BTU/gallon of product. This includes all heat and electricity required by the process,
excluding fuel required for the main distillation tower reboiler (as suggested in the problem statement,
page 266). The bulk of this energy is likely used for processing corn solids. The glycerol to ethanol
process has heating feeds of low pressure steam and high pressure steam, as well as electricity
consumption. The total energy usage is 8,002 BTU/gallon ethanol, well below the benchmark number,
broken down as follows:
$/year $/kg kg/year BTU/year BTU/gallon ethanol50 psig Steam 914,652 0.0066 138,583,668 279,523,258,356 5,552
$/year $/kg kg/year BTU/year BTU/gallon ethanol150 psig Steam 336,377 0.0105 32,035,925 60,611,969,722 1,204
$/year $/kW-hr kW-hr/year BTU/year BTU/gallon ethanolElectricity 1,103,316 0.0600 18,388,608 62,760,317,398 1,247
BTU/gallon ethanolTotal: 8,002
Table E-2. Energy consumption in BTU/gallon of Ethanol for Energy Benchmark Comparison.
Energy use has been reduced significantly by two means. First, the hydrogen produced in the
fermenters is fed to a furnace which provides most of the heat duty required for the reboiler. This
reduces the amount of steam required for the plant. Second, the water from the bottoms product of
the distillation column is fed back into a heat exchanger (HX-3) to heat sterilize the feed to the column
and to reduce the energy requirement on the reboiler. The distillation column was also designed with
minimal reflux, which reduces the heat requirement of the reboiler even further.
In the glycerol feed preparation stage, continuous sterilization of the fermentation medium is
performed using heat exchangers HX-1 and HX-2. HX-1 is used to reduce energy requirements of the

LeGendre, Logan, Mendel, Seedial
58
plant. Glycerol is fed at 25°C and heated to 111°C by the sterilized glycerol, which enters at 121°C and
exits at 37°C and transfers 59.6 MMBTU/hr. See calculations on page 226.
As the broth from the fermenter is fed to the distillation column, HX-3 heats the feed to reduce
the heat requirement of the re-boiler and deactivate the E. coli in the fermentation broth. This is done
by using the water from the bottoms product of the tower. Feed enters at 37°C and is heated to 92.2°C
while cooling the water from 109°C to 43.3°C. Both HX-1 and HX-3 save the energy required to heat the
stream and the cooling water that would have been necessary to cool the other stream.
Furnace FN-1 is used to take advantage of the hydrogen energy source produced in the
fermenters. Hydrogen would be expensive to isolate and package, however the process takes
advantage of the hydrogen energy content by using it to supply heat to the reboiler. By combusting the
hydrogen, 76.9 MMBTU/hr is able to be transferred to the reboiler at no cost.
In addition to the balances discussed above, additional energy requirements are necessary to
provide cooling, heating and power during the process. Cooling is needed in the condenser of the
distillation column, in HX-5 to cool the ethanol to reduce volatility, and in HX-FERM (1-12) to cool the
fermenters during reaction times. A portion of chilled water is mixed with the cooling water to cool the
fermenters.
Low pressure steam is used in the distillation tower reboiler (HX-6) and for the molecular sieves
(MS-1). High pressure steam is used to heat the glycerol sterilizer (HX-2) due to the high temperature
required. Electricity is used to run all the agitators, pumps, blowers, rotary drum filter, electro-dialysis
system, and molecular sieves.
Shown below are the energy requirements of our process broken down by utility type. Utilities
which remove heat have been included here, such as cooling water and chilled water.
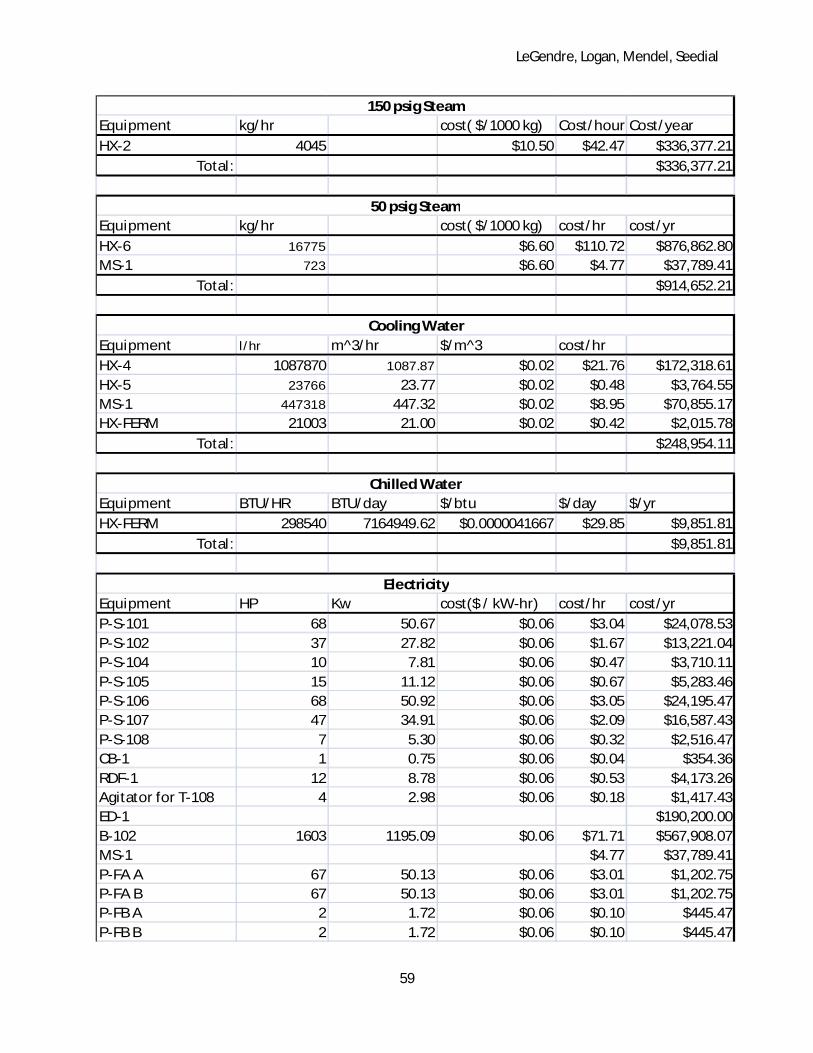
LeGendre, Logan, Mendel, Seedial
59
Equipment kg/hr cost( $/1000 kg) Cost/hour Cost/yearHX-2 4045 $10.50 $42.47 $336,377.21
Total: $336,377.21
Equipment kg/hr cost( $/1000 kg) cost/hr cost/yr HX-6 16775 $6.60 $110.72 $876,862.80MS-1 723 $6.60 $4.77 $37,789.41
Total: $914,652.21
Equipment l/hr m^3/hr $/m^3 cost/hrHX-4 1087870 1087.87 $0.02 $21.76 $172,318.61HX-5 23766 23.77 $0.02 $0.48 $3,764.55MS-1 447318 447.32 $0.02 $8.95 $70,855.17HX-FERM 21003 21.00 $0.02 $0.42 $2,015.78
Total: $248,954.11
Equipment BTU/HR BTU/day $/btu $/day $/yrHX-FERM 298540 7164949.62 $0.0000041667 $29.85 $9,851.81
Total: $9,851.81
Equipment HP Kw cost($ / kW-hr) cost/hr cost/yrP-S-101 68 50.67 $0.06 $3.04 $24,078.53P-S-102 37 27.82 $0.06 $1.67 $13,221.04P-S-104 10 7.81 $0.06 $0.47 $3,710.11P-S-105 15 11.12 $0.06 $0.67 $5,283.46P-S-106 68 50.92 $0.06 $3.05 $24,195.47P-S-107 47 34.91 $0.06 $2.09 $16,587.43P-S-108 7 5.30 $0.06 $0.32 $2,516.47CB-1 1 0.75 $0.06 $0.04 $354.36RDF-1 12 8.78 $0.06 $0.53 $4,173.26Agitator for T-108 4 2.98 $0.06 $0.18 $1,417.43ED-1 $190,200.00B-102 1603 1195.09 $0.06 $71.71 $567,908.07MS-1 $4.77 $37,789.41P-FA A 67 50.13 $0.06 $3.01 $1,202.75P-FA B 67 50.13 $0.06 $3.01 $1,202.75P-FB A 2 1.72 $0.06 $0.10 $445.47P-FB B 2 1.72 $0.06 $0.10 $445.47
150 psig Steam
50 psig Steam
Cooling Water
Chilled Water
Electricity

LeGendre, Logan, Mendel, Seedial
60
P-FC A 43 31.89 $0.06 $1.91 $4,591.53P-FC B 43 31.89 $0.06 $1.91 $4,591.53P-FD 37 27.55 $0.06 $1.65 $13,089.93B-101 416 310.51 $0.06 $18.63 $89,404.36Agitators Ferm 1-12 240 178.97 $0.06 $10.74 $51,529.89Agitator for T-107 20 14.91 $0.06 $0.89 $7,087.13P-FE(1-12) 44 32.66 $0.06 $1.96 $9,404.20P-101A 1 0.83 $0.06 $0.05 $0.13P-101B 1 0.83 $0.06 $0.05 $0.13P-102A 7 5.59 $0.06 $0.34 $8.93P-102B 7 5.59 $0.06 $0.34 $8.93P-103A 11 8.03 $0.06 $0.48 $12.84P-103B 11 8.03 $0.06 $0.48 $12.84P-104A 20 15.10 $0.06 $0.91 $96.62P-104B 20 15.10 $0.06 $0.91 $96.62P-105A 1 0.91 $0.06 $0.05 $0.15P-105B 1 0.91 $0.06 $0.05 $0.15P-106A 9 6.91 $0.06 $0.41 $1.10P-106B 9 6.91 $0.06 $0.41 $1.10P-107A 14 10.20 $0.06 $0.61 $16.32P-107B 14 10.20 $0.06 $0.61 $16.32Agitator for Ferm6A 2 1.67 $0.06 $0.10 $482.12Agitator for Ferm6B 2 1.67 $0.06 $0.10 $482.12Agitator for Ferm7A 17 12.80 $0.06 $0.77 $3,686.79Agitator for Ferm7B 17 12.80 $0.06 $0.77 $3,686.79P-FP-01 9 6.96 $0.06 $0.42 $3,308.48P-FP-02 34 25.11 $0.06 $1.51 $11,934.38P-FP-03 0 0.11 $0.06 $0.01 $51.66P-FP-04 5 3.75 $0.06 $0.22 $1,780.29P-FP-05 2 1.14 $0.06 $0.07 $542.02P-FP-06 45 33.88 $0.06 $2.03 $16,099.56Agitator for T-105 33 24.31 $0.06 $1.46 $11,552.02
Total: $1,103,316.45 Table E-2. Energy Utility Requirements for the Process.
LeGendre, Logan, Mendel, Seedial
61
Unit Descriptions Section VI
Feed Preparation Section………………….……………….……………….……………….……………….…………………… 62
Plant Seed Fermentation Section……………….……………….……………….……………….……………….…….…… 70
Main Fermentation Section……………….……………….……………….……………….……………….…………………… 77
Separation Section……………….……………….……………….……………….……………….……………….………….……. 84

LeGendre, Logan, Mendel, Seedial
62
Feed Preparation Section
Storage Tanks:
Crude Glycerol Storage Tank T-101
Base Purchase Cost: $ 564,600
T-101 is a floating roof storage vessel constructed of 304 stainless steel with a volume of
3,165,300 L. This tank holds the crude glycerol feedstock that comes as the byproduct of the biodiesel
industry. The feed is assumed to be at standard temperature and pressure conditions of 25°C and 1 atm
and will be stored at these conditions. This storage tank holds three days worth of feed and has a
working volume of 80%. Stream S-FP-101 leaves this holding tank at a flow rate of 35,170 L/hr and flows
through pump P-FP-01 then to the Glycerol Purification System, R-101. The composition of the crude
glycerol feedstock is assumed to be 85% glycerol, 7% water, 4% salts, and 4% MONG (Matter Organic,
Non-Glycerol) by weight, as per the suggested average crude glycerol feed (EET Corporation). These
percentages were used for completing the material balance, however, it should be noted that crude
glycerol is characterized by an unpredictable composition. The process has been designed to be flexible
regarding the glycerol feedstock composition. The vessel has a floating roof due the possible presence of
methanol or other volatiles in the crude glycerol feedstock.
Calculations on page 242.
Cornsteep Liquor Storage Tank T-103
Base Purchase Cost: $49,600
T-103 is a cone roof storage vessel constructed of 304 stainless steel with a volume of 83,500 L.
This vessel stores three days worth of corn steep liquor, a material that provides minerals and amino
acids for the E. Coli. Stream S-FP-106 leaves this tank at a flow rate of 927 L/hr and flows through pump

LeGendre, Logan, Mendel, Seedial
63
P-FP-03 then into mixing tank, T-105.The corn steep liquor will be stored at a temperature of 25 °C and
a pressure of 1 atm. The storage tank is assumed to have a working volume of 80%.
Calculations on page 225.
Brine Storage Tank T-104
Base Purchase Cost: $65,700
T-104 is a cone roof storage vessel constructed of 304 stainless steel with a volume of 145,000 L.
This is one day’s worth of salt solution (brine 36% by weight) extracted from the glycerol feed. It will be
stored at a temperature of 25°C and a pressure of 1 atm. Stream S-FP-103 flows into this tank via pump
P-FP-05, from the Glycerol Purification System at a flow rate of 4,832 L/hr. The storage tank is assumed
to have a working volume of 80%. Salt water will leave the process from this tank to be sent to the
ocean.
Calculations on page 242.
Mixing Tank T-105
Base Purchase Cost: $ 42,500
T-105 is a cone roof storage vessel constructed of 304 stainless steel with a volume of 61,730 L.
Streams S-FP-115 (fresh water), S-P-104 (purified glycerol/water mixture), S-FP-105 (recycle water) and
S-FP-106 (corn steep liquor) all flow into this tank for mixing. The tank is assumed to have a working
volume of 50% and a residence time of 10 minutes. It is assumed to operate at 25 °C and 1 atm. The
tank has an agitator (turbine, closed tank) for mixing that is priced at $29,900 (see page 210) including
the motor and shaft costs.
Calculations on page 242.

LeGendre, Logan, Mendel, Seedial
64
Sterilized Feed Holding Tank T-106
Base Purchase Cost: $ 338,000
T-106 is a floating roof storage vessel constructed of 304 stainless steel with a volume of
1,157,500 L. This tank is the transition point between the continuous feed preparation section and the
batch fermentation sections. Sterilized feed in stream S-FP-112 flows into this tank at a flow rate of
185,192 L/hr then out to the fermentation stage section. The sterilized feed is stored at a temperature
of 25 °C and a pressure of 1 atm. This storage tank is assumed to have a working volume of 80%.
Calculations on page 242.

LeGendre, Logan, Mendel, Seedial
65
Heat Exchangers:
HX-1
Base Purchase Cost: $132,300
HX-1 is a floating head shell and tube heat exchanger that preheats the feed from mixing tank T-
105 before it enters HX-2. This preheating reduces the amount of steam needed in HX-2 to bring the
feed to the sterilization temperature 121°C (250 °F) and cools the sterilized feed to the required
fermentation temperature. Stream S-FP-114 is heated from 25°C to 111°C (or 77 °F to 231.86 °F) by the
hot sterile feed from HX-2, S-FP-109 that is cooled from 121 °C to 37 °C (or 250 °F to 98.6 °F). The heat
duty is 59,665,811 BTU /hr. The heat exchanger is 304 stainless steel shell side/ 304 stainless steel tube
side since both sides are in contact with feed.
Calculations on page 226.
HX-2
Base Purchase Cost: $22,100
Pre heated stream Feed (S-FP-108) is heated further by steam from 111°C to 121°C (or from
231.86°F to 250° F). This is the sterilization temperature (for all organisms, spores). This is a floating
head shell and tube heat exchanger.. The heat duty is 7,738,512 BTU/hr. This exchanger is a carbon
steel shell side / 304 stainless steel tube side because the shell side material is steam.
Calculations on page 226.
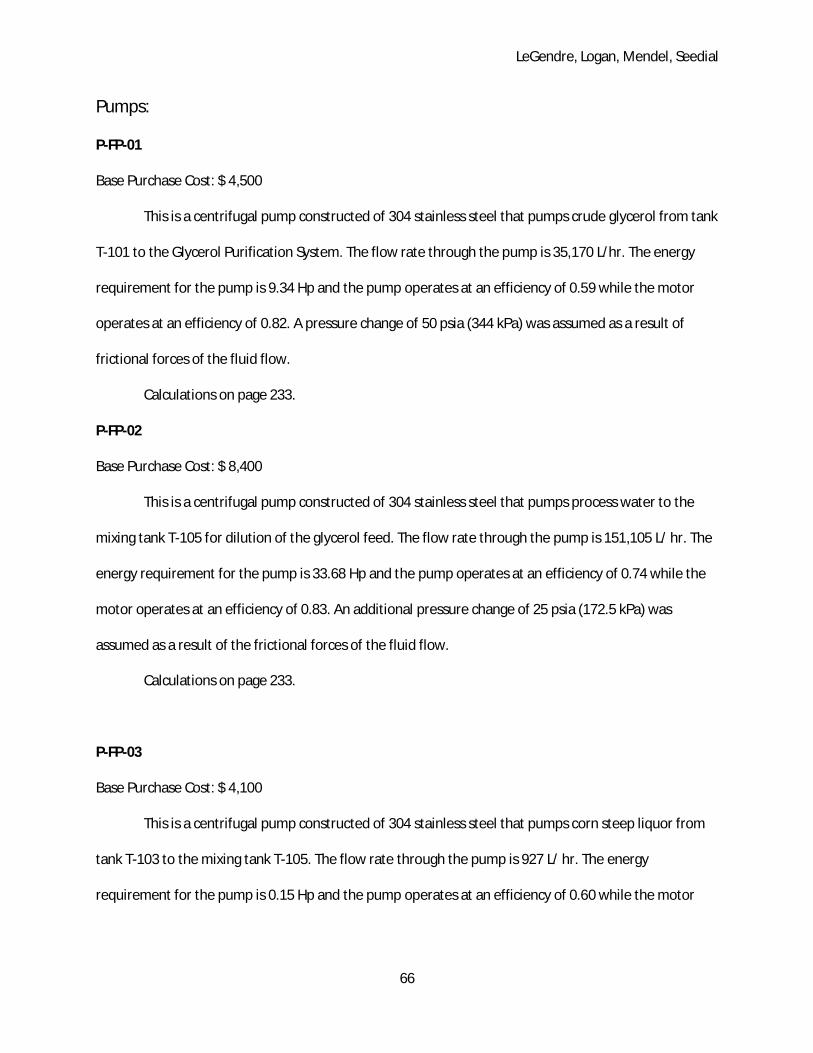
LeGendre, Logan, Mendel, Seedial
66
Pumps:
P-FP-01
Base Purchase Cost: $ 4,500
This is a centrifugal pump constructed of 304 stainless steel that pumps crude glycerol from tank
T-101 to the Glycerol Purification System. The flow rate through the pump is 35,170 L/hr. The energy
requirement for the pump is 9.34 Hp and the pump operates at an efficiency of 0.59 while the motor
operates at an efficiency of 0.82. A pressure change of 50 psia (344 kPa) was assumed as a result of
frictional forces of the fluid flow.
Calculations on page 233.
P-FP-02
Base Purchase Cost: $ 8,400
This is a centrifugal pump constructed of 304 stainless steel that pumps process water to the
mixing tank T-105 for dilution of the glycerol feed. The flow rate through the pump is 151,105 L/ hr. The
energy requirement for the pump is 33.68 Hp and the pump operates at an efficiency of 0.74 while the
motor operates at an efficiency of 0.83. An additional pressure change of 25 psia (172.5 kPa) was
assumed as a result of the frictional forces of the fluid flow.
Calculations on page 233.
P-FP-03
Base Purchase Cost: $ 4,100
This is a centrifugal pump constructed of 304 stainless steel that pumps corn steep liquor from
tank T-103 to the mixing tank T-105. The flow rate through the pump is 927 L/ hr. The energy
requirement for the pump is 0.15 Hp and the pump operates at an efficiency of 0.60 while the motor

LeGendre, Logan, Mendel, Seedial
67
operates at an efficiency of 0.76. An additional pressure change of 25 psia (172.5 kPa) was assumed as a
result of the frictional forces of fluid flow.
Calculations on page 233.
P-FP-04
Base Purchase Cost: $ 3,900
This is a centrifugal pump constructed of 304 stainless steel that pumps a glycerol/water
solution from the Glycerol Purification System R-101 to the mixing tank T-105. The flow rate through the
pump is 32,356 L/ hr. The energy requirement for the pump is 5.02 Hp and the pump operates at an
efficiency of 0.58 while the motor operates at an efficiency of 0.82. An additional pressure change of 25
psia (172.5 kPa) was assumed as a result of the frictional forces of fluid flow.
Calculations on page 233.
P-FP-05
Base Purchase Cost: $ 3,500
This is a centrifugal pump constructed of 304 stainless steel that pumps a salt solution from the
Glycerol Purification System R-101 to the Brine Storage Tank T-104. The flow rate through the pump is
4,832 L/ hr. The energy requirement for the pump is 1.53 Hp and the pump operates at an efficiency of
0.31 while the motor operates at an efficiency of 0.80. An additional pressure change of 25 psia (172.5
kPa) was assumed as a result of the frictional forces of fluid flow.
Calculations on page 233.
P-FP-06
Base Purchase Cost: $ 10,100
This is a centrifugal pump constructed of 304 stainless steel that pumps mixed feed solution
from the mixing tank T-105 through the sterilization heat exchangers and then to the Sterilized Feed
Storage Tank T-106. The flow rate through the pump is 185,192 L/ hr. The energy requirement for the

LeGendre, Logan, Mendel, Seedial
68
pump is 45.53 Hp and the pump operates at an efficiency of 0.76 while the motor operates at an
efficiency of 0.83. An additional pressure change of 25 psia (172.5 kPa) was assumed as a result of the
frictional forces of fluid flow .
Calculations on page 233.

LeGendre, Logan, Mendel, Seedial
69
Miscellaneous:
Glycerol Purification System R-101
Estimated Purchase Cost: $ 430,800
The Glycerol Purification System is a licensed unit purchased from EET Corporation that has the
ability to purify a variety of incoming crude glycerol feeds from the biodiesel industry. It removes MONG
(Matter Organic Non-Glycerol, typically monoglycerides, diglycerides, and free fatty acids), any
methanol present, chloride or phosphate salts, and any solids. The glycerol purification system uses the
patent pending (See Appendix C for patent application) HEED® (High-Efficiency Electro-Dialysis) and
HEEPM® (High-Efficiency Electro-Pressure Membrane) technologies, in parallel with reverse osmosis, to
purify the crude glycerol stream S-FP-101. The output from the process is a cake of MONG that, at the
suggestion of industrial consultant Mr. Bruce Vrana can be given to farmers for use as a nutrient (S-FP-
113), a concentrated salt water solution (S-S-103) that can be sent to the ocean, and a glycerol/water
solution (S-FP-104) that is sent to the mixing tank T-105 to be combined with water and corn steep
liquor for feed preparation. The quantity of crude glycerol purified by the system will depend on the
feed, but at the average value of 85 % by weight glycerol in the crude glycerol feed, the system will
handle 43,370 kg solution per hour, removing 1,735 kg/hr of MONG and 1,735 kg/hr of salts. Although
precise technical information was not available from EET Corporation, extensive information from the
EET Corporation website is provided in Appendix D. Operating costs for the glycerol purification system
were not estimated because technical specifications were not available.
Calculations on page 225.
LeGendre, Logan, Mendel, Seedial
70
Seed Fermentation Train (Plant and Lab)
Fermenters:
Laboratory Scale Fermenters (Seed Ferm 1A/1B, Seed Ferm 2A/2B, Seed Ferm 3A/3B) (2 each)
Every 297 hour cycle starts with two 1mL aliquots of E. Coli cells, one for seed fermentation train
A, and one for seed fermentation train B. The cells are grown to larger volumes in a train of fermenters,
where each successive fermenter working volume is 20 times the size of the initial, because 2,000,000 L
tanks cannot be charged with 1 mL portions of cells (too much dilution). Each cell aliquot is charged first
to either Seed Ferm 1A or 1B (test tubes with volumes of 25 mL), then grown up in each successive
laboratory-sized fermenter (Seed 2A/2B: 400 mL of solution in 500 mL flask, Seed 3A/3B: 8 L of solution
in 10 L tank) until the contents of Seed Ferm 3A/3B can be transferred to 200 L tanks Seed Ferm 4A/4B
in the plant-scale section. The cells are grown in these fermenters for 60 hours, until the ethanol
concentration is 100 g/L, at a temperature of 37°C, 14.8 psia and pH 7, consuming the same glycerol
feed solution that is used in the plant-scale section. The positive pressure maintains the anaerobic
condition required for fermentation. These fermenters are made of glass (test tube, flask) or 304
stainless steel (tank).
Calculations on page 220.
Seed Ferm 4A/4B (2)
This is the first vessel outside of the laboratory setting in the seed fermentation train. This vessel
is constructed of 304 stainless steel and has a capacity of 200 L, while its working volume is 78-81% of
this value. The product from Seed Ferm 3A is gravity-transferred to Seed Ferm 4A, and the product from
Seed Ferm 3B is gravity-transferred to Seed Ferm 4B. This product contains enough E. coli to grow in a
fermenter unit of this size. Sterilized feed is pumped from the Sterilized Feed Holding Tank T-106 to the
units through pumps P-101 (1 and 2). The fermenter has a height of 3.30 ft and diameter of 1.65 ft.
LeGendre, Logan, Mendel, Seedial
71
Optimal growth conditions of 37°C, 14.8 psia and pH 7 are maintained in the vessel. The positive
pressure maintains the anaerobic condition required for fermentation. The fermentation time is 60
hours since the end ethanol concentration is 100 g/L. The product from this is fed to either Seed Ferm
5A or Seed Ferm 5B.
Calculations on page 220.
Seed Ferm 5A/5B (2)
Base Purchase Cost: $30,700
This is the second vessel outside of the laboratory setting, in the plant-scale section. The vessel
is constructed of 304 stainless steel and has a capacity of 4,500 L, while its working volume is 70-72% of
this value. The product from Seed Ferm 4A is pumped to Seed Ferm 5A through pump P-105 (1) or the
product from Seed Ferm 4B is pumped to Seed Ferm 5B through pump P-105 (2). Sterilized feed is
pumped from the Sterilized Feed Holding Tank T-106 to the units through pumps P-102 (1 and 2).The
fermenter has a height of 9.31 ft and diameter of 4.66 ft. Optimal growth conditions of 37°C, 14.8 psia
and pH 7 are maintained in the vessel. The positive pressure maintains the anaerobic condition required
for fermentation. The fermentation time for this is 60 hours since the end ethanol concentration is 100
g/L. The product from this is fed to either Seed Ferm 6A or Seed Ferm 6B.
Calculations on page 220.
Seed Ferm 6A/6B (2)
Base Purchase Cost: $ 100,900
This is the third vessel outside of the laboratory setting, in the plant-scale section. The product
from Seed Ferm 5A is pumped to Seed Ferm 6A through pump P-106 (1) or the product from Seed Ferm
5B is pumped to Seed Ferm 6B through pump P-106 (2). The vessel is constructed of 304 stainless steel
and has a capacity of 85,000 liters, while its working volume is 74-77% of this value. Sterilized feed is
pumped from the Sterilized Feed Holding Tank T-106 to the units through pumps P-103 (1 and 2).The

LeGendre, Logan, Mendel, Seedial
72
fermenter has a height of 24.81 ft and diameter of 12.41 ft. Optimal growth conditions of 37°C, 14.8 psia
and pH 7 are maintained in the vessel. The positive pressure maintains the anaerobic condition required
for fermentation. The fermentation time for this is 60 hours since the end ethanol concentration is 100
g/L. The product from this is then fed to Seed Ferm 7A/7B. ). Seed fermenters 6A and 6B have 304
stainless steel agitators to maintain cell suspension and prevent adverse temperature or pH gradients.
These agitators have a base purchase cost of $6,500.
Calculations on page 220.
Seed Ferm 7A/7B (2)
Base Purchase Cost: $ 150,400.00
This is the last fermentation vessel in the seed train. The vessel is constructed of 304 stainless
steel and has a capacity of 650,000 liters. The working volume ranges from 70-72%. One sixth of the
working volume of each of these two fermenters is fed to each one of the large-scale fermenters
FERM1-12 during the cycle. One sixth of the working volume of Seed Ferm 7A is equivalent to the 1/20
by volume portion required to charge fermenters FERM1-12. The volume transferred to each large
fermenter is ~77,090 L. Therefore the working volume of these tanks is approximated to ~460,000 L. The
product from Seed Ferm 6A is pumped to Seed Ferm 7A through pump P-107 (1) or the product from
Seed Ferm 6B is pumped to Seed Ferm 7B through pump P-107 (2). Sterilized feed is pumped from the
Sterilized Feed Holding Tank T-106 to the units through pumps P-104 (1 and 2).The fermenter has a
height of 48.88 ft and diameter of 24.44 ft. Optimal growth conditions of 37°C, 14.8 psia and pH 7 are
maintained in the vessel. The positive pressure maintains the anaerobic condition required for
fermentation. The fermentation time for this is 60 hours since the end ethanol concentration is 100 g/L.
One sixth of the working volume of each 7A/7B reactor is fed to each of the fermenters FERM 1 through
FERM 6 (from Seed Ferm 7A) through pump P-FB (1) or fermenters FERM through FERM 12 (from Seed
Ferm 7B) through pump P-FB (2). Seed fermenters 7A and 7B have 304 stainless steel agitators to

LeGendre, Logan, Mendel, Seedial
73
maintain cell suspension and prevent adverse temperature or pH gradients. These agitators have a base
purchase cost of $20,700.
Calculations on page 220.
Pumps:
P-101 (2)
Base Purchase Cost: $3,700
This is a centrifugal pump constructed of 304 stainless steel that pumps sterilized feed from T-
106 to the first plant scale fermentation tank, which is either Ferm 4A or Ferm 4B. Sterilized feed flows
through the pump at a flow rate of 2600 L/ hr. The energy requirement for the pump is 1.12 Hp and the
pump operates at an efficiency of 0.20 while the motor operates at an efficiency of 0.80. The pump head
is 59.21 ft. The pressure change across the pump, neglecting friction, is 10.2 kPa. An additional pressure
change of 25 psia (172.5 kPa) was assumed as a result of the frictional forces of fluid flow. The pump
runs for 0.06 hours of the 297 hour cycle.
Calculations on page 233.
P-102 (2)
Base Purchase Cost: $4,400
This is a centrifugal pump constructed of 304 stainless steel that pumps sterilized feed from T-
106 to the second plant scale fermentation tank, which is either Ferm 5A or 5B. Sterilized feed flows
through the pump at a flow rate of 51,950 L/ hr. The energy requirement for the pump is 7.49 Hp and
the pump operates at an efficiency of 0.63 while the motor operates at an efficiency of 0.82. The pump
head is 64.97 ft. The pressure change across the pump, neglecting friction is 28.9 kPa. An additional
pressure change of 25 psia (172.5 kPa) was assumed as a result of the frictional forces of fluid flow. The
pump runs for 0.06 hours of the 297 hour cycle. Calculations on page 233.

LeGendre, Logan, Mendel, Seedial
74
P-103 (2)
Base Purchase Cost: $4,900
This is a centrifugal pump constructed of 304 stainless steel that pumps sterilized feed from T-
106 to the third plant scale fermentation tank, which is either Ferm 6A or 6B. Sterilized feed flows
through the pump at a flow rate of 62,325 L/ hr. The energy requirement for the pump is 10.76 Hp and
the pump operates at an efficiency of 0.65 while the motor operates at an efficiency of 0.82. The pump
head is 80.46 ft. The pressure change across the pump, neglecting friction is 76.9 kPa . An additional
pressure change of 25 psia (172.5 kPa) was assumed as a result of the frictional forces of fluid flow. The
pump runs 1 hour of the 297 hour cycle.
Calculations on page 233.
P-104 (2)
Base Purchase Cost: $6,400
This is a centrifugal pump constructed of 304 stainless steel that pumps sterilized feed from T-
106 to the fourth plant scale fermentation tank, which is either Ferm 7A or 7B. Sterilized feed flows
through the pump at a flow rate of 96,683 L/ hr. The energy requirement for the pump is 20.25 Hp and
the pump operates at an efficiency of 0.70 while the motor operates at an efficiency of 0.82. The pump
head is 104.5 ft. The pressure change across the pump, neglecting friction is 151.5 kPa. An additional
pressure change of 25 psia (172.5 kPa) was assumed as a result of the frictional forces of fluid flow. The
pump runs 4 hours of the 297 hour cycle.
Calculations on page 233.

LeGendre, Logan, Mendel, Seedial
75
P-105 (2)
Base Purchase Cost: $3,600
This is a centrifugal pump constructed of 304 stainless steel that pumps the volume of product
in S-106 either from seed Ferm 4A into seed Ferm 5A or seed Ferm 4B to seed Ferm 5B. It pumps liquid
at a rate of 2,628 L/ hr. The energy requirement for the pump is 1.22 Hp and the pump operates at an
efficiency of 0.20 while the motor operates at an efficiency of 0.80. The pump head is 69.1 ft. The
pressure change across the pump, neglecting friction is 26.9 kPa. An additional pressure change of 25
psia (172.5 kPa) was assumed as a result of the frictional forces of fluid flow. The pump runs 0.06 hours
of the 297 hour cycle.
Calculations on page 233.
P-106 (2)
Base Purchase Cost: $4,700
This is a centrifugal pump constructed of 304 stainless steel that pumps the volume of product
in S-107 either from Ferm 5A into Ferm 6A or seed Ferm 5B to Ferm 6B. It pumps liquid at a rate of
53,349.40 L/ hr. The energy requirement for the pump is 9.26 Hp and the pump operates at an efficiency
of 0.64 while the motor operates at an efficiency of 0.82. The pump head is 84.7 ft. The pressure change
across the pump, neglecting friction is 71.5 kPa. An additional pressure change of 25 psia (172.5 kPa)
was assumed as a result of the frictional forces of fluid flow. The pump runs 0.06 hours of the 297 hour
cycle.
Calculations on page 233.
P-107 (2)
Base Purchase Cost: $5,300
This is a centrifugal pump constructed of stainless steel 304 that pumps the volume of product
in S-108 from either Ferm 6A into Ferm 7A or seed Ferm 6B to Ferm 7B. It operates at a rate of

LeGendre, Logan, Mendel, Seedial
76
63,293.21 litres/ hr. The energy requirement for the pump is 13.68 Hp and the pump operates at an
efficiency of 0.66 while the motor operates at an efficiency of 0.82. The pump head is 108.7 ft. The
pressure change across the pump, neglecting friction is 141.0 kPa. An additional pressure change of 25
psia (172.5 kPa) was assumed as a result of the frictional forces of fluid flow. The pump runs 1 hour of
the 297 hour cycle.
Calculations on page 233.

LeGendre, Logan, Mendel, Seedial
77
Main Fermentation Section
Fermenters:
FERM 1-12 (12)
Base Purchase Cost: $341,500
The most important units in the fermentation process are the large production fermentation
vessels, each having a volume of 2,000,000 L, with a working volume ranging from 76-79%. In these
twelve tanks, E. coli cells produce the majority of the ethanol via the anaerobic fermentation of the
glycerol feedstock. Optimal growth conditions of 37°C, 14.8 psia and pH 7 are maintained in the vessel.
The positive pressure maintains the anaerobic condition required for fermentation. The fermentation
time for this is 60 hours since the end ethanol concentration is 100 g/L.
After the fermentation in Seed Ferm 7A/7B is complete, a 1/6 by volume portion of each of the
seed fermenters’ contents are charged to each of Ferm 1-12, this portion corresponding to a volume of
5% (1/20) of the total FERM 1-12 working volume. The charging time is 27 hrs to allow for a staggered
batch running of the fermenters. The contents of Seed Ferm 7A/7B are only supplied to the large
fermenters at the start of the first fermentation period of each three-fermentation-period cycle.
Sterilized feed from Sterilized Feed Holding Tank T-106 is fed to the large fermenters through pump P-FA
over the course of 5 hours at a rate of 311,228 kg/hr, at the start of all three fermentation periods per
cycle.
After the first 60-hour fermentation period, 95% of the volume is drained into the fermentation
broth storage tank T-107.The remaining 5% remains in the vessel as the seed from which the next
reaction period begins. This is done twice, and at the end of the third reaction cycle, 100% of the
contents are drained into T-107. At this point the fermenters are cleaned using the clean-in-place
technique, during which a dilute caustic solution is applied to the tank surface through spray nozzles. As
the initial stagger/ charging time is 27 hours, the feed charging time is 5 hours (x3 charging periods), the

LeGendre, Logan, Mendel, Seedial
78
reaction time is 60 hours (x3 fermentation periods), the fermenter draining time is 5 hours (x3 draining
periods), and the cleaning time is 60 hours, the resulting total cycle time, after 3 fermentation periods,
is 297 hours. The large fermenters are the equipment bottleneck in the process.
During the reaction time carbon dioxide and hydrogen gas are evolved, and 4.9% of the
produced ethanol and 0.49% of the water are vaporized. This gaseous stream leaving the fermentation
units is moved by a blower near the top of all the fermenters that sends the fermentation gases to the
Absorber unit AB-1 in the separation section. The gases leave the fermenters at a flow rate of 879.28
kg/hr.
Heat is evolved in one fermentation reactor due to the slightly exothermic reaction from
glycerol to ethanol. The adiabatic temperature rise corresponds to 5.7°C (10.4°F) A heat exchanger, HX-
Ferm, is required for each of the twelve fermenters to ensure the temperature of the reactors remain at
37°C. The fermenters are constructed from 304 stainless steel. With a 2:1 height to width ratio, the
cylindrical vessels are 71 ft tall and have a diameter of 35.5 ft. They are field fabricated.
These fermentation tanks also have 304 stainless steel agitators to prevent cell settling and
adverse concentration or pH gradients. These agitators have a base purchase cost of $44,200 (see page
210 for Agitator pricing calculations).
Calculations on page 220.
LeGendre, Logan, Mendel, Seedial
79
Storage Tanks:
Broth Storage Tank: T-107
Base Purchase Cost: $ 582,900
T-107 is a floating roof storage vessel constructed of 304 stainless steel with a volume of
3,370,600 L. Fermentation broth containing ethanol is pumped into the tank from all twelve 2,000,000 L
fermenters through pump P-FC (1 and 2) at the end of all fermentation periods. Broth leaves the storage
tank continuously at a flow rate of 178,735 L/hr and is pumped through pump P-FD to the separation
section, where it first enters HX-3. The broth is stored at a temperature of 37 °C and a pressure of 1 atm.
This storage tank is assumed to have a maximum working volume of 80%, but the working volume
changes depending on the time in the cycle. This tank has an agitator to prevent the settling of E. coli
cells at the bottom of the tank before continuous filtration. This agitator has a base price of $44,100.
Calculations on page 220.
Heat Exchangers:
HX-FERM (12)
Base Purchase Cost: $4,200
This is the heat exchanger that is used to cool the contents of each 2,000,000 L fermentation
tank FERM1-12. One heat exchanger and accompanying pump is provided for each fermenter, so as to
prevent total contamination in the case that one fermenter unit is somehow contaminated. The solution
from stream S-141 flows through the heat exchanger at a flow rate of 25,423 L/hr. The fluid is circulated
over a period of 60 hours (fermentation time) and the heat duty corresponds to the amount of heat
required to cool the contents of one reactor from 109 °F to 98.6 °F (42.7 °C to 37 °C), determined from
the adiabatic temperature rise associated with the slightly exothermic fermentation reaction. The
fermentation solution is cooled using a mixture of cooling water and chilled water (where cooling water

LeGendre, Logan, Mendel, Seedial
80
makes up 95% of the heat duty) at a mass flow rate of 22,063 kg/hr, which is heated from 87.6 °F to 99
°F (30.9 °C to 37.2 °C). This is a Double Pipe Heat Exchanger due to the smaller exchanger area
requirements. The heat duty is 518,297 BTU/hr. This exchanger is carbon steel shell side / stainless steel
tube side because the shell side material is water.
Calculations on page 226.
Pumps:
P-FA (2)
Base Purchase Cost: $19,400
This is a centrifugal pump constructed of 304 stainless steel that pumps sterilized feed from T-
106 to the 6 fermenter tanks that are operating in each fermentation train. It pumps sterilized feed at a
rate of 300,300 L/ hr. The energy requirement for the pump is 67.22 Hp and the pump operates at an
efficiency of 0.79 while the motor operates at an efficiency of 0.83. The pump head is 126.8 ft. The
pressure change across the pump, neglecting friction is 220 kPa. An additional pressure change of 25
psia was assumed as a result of the frictional forces of fluid flow. The pump is operational for 15 hours
of the 297 hour cycle time.
Calculations on page 233.
P-FB (2)
Base Purchase Cost: $3,600
This is a centrifugal pump constructed of 304 stainless steel that pumps seed feed from the Seed
Fermentation Train A/B to each of the fermenters Ferm 1-12. It pumps the volume of Seed 7A/7B to the
main fermentation section at a rate of 2,820 L/ hr. The energy requirement for the pump is 2.31 Hp and
the pump operates at an efficiency of 0.21 while the motor operates at an efficiency of 0.81. The pump
head is 130.9 ft. The pressure change across the pump, neglecting friction is 205 kPa. An additional

LeGendre, Logan, Mendel, Seedial
81
pressure change of 25 psia (17.2 kPa) was assumed as a result of the frictional forces of fluid flow. The
pump is operational for 162 hours of the 297 hour cycle time.
Calculations on page 233.
P-FC (2)
Base Purchase Cost: $ 15,700
This is a centrifugal pump constructed of 304 stainless steel that pumps the broth product from
the fermenters Ferm 1-12 into Broth Storage Tank T-107. It operates at a rate of 1,525,403 L/ hr. The
energy requirement for the pump is 42.77 Hp and the pump operates at an efficiency of 0.79 while the
motor operates at an efficiency of 0.83. The pump head is 85.4ft. The pressure change across the pump,
neglecting friction is 73.9 kPa. An additional pressure change of 25 psia (17.2 kPa) was assumed as a
result of the frictional forces of fluid flow. The pump is operational for 90 hours of the 297 hour cycle
time.
Calculations on page 233.
P-FD
Base Purchase Cost: $9,000
This is a centrifugal pump constructed of 304 stainless steel that pumps the fermentation
product from the broth storage tank, T-107 to the separation process section. It pumps fermentation
broth continuously at a rate of 178,734 L/ hr. The energy requirement for the pump is 36.94 Hp and the
pump operates at an efficiency of 0.75 while the motor operates at an efficiency of 0.83. The pump head
is 120 ft. The pressure change across the pump, neglecting friction is 205 kPa. An additional pressure
change of 25 psia (17.2 kPa) was assumed as a result of the frictional forces of fluid flow.
Calculations on page 233.
P-FE (12)
Base Purchase Cost: $6,600
LeGendre, Logan, Mendel, Seedial
82
This is a centrifugal pump constructed of 304 stainless steel that continuously pumps the
solution in each fermenter tank through a heat exchanger, HX FERM, to maintain the fermentation
temperature of 37°C. It pumps fermentation solution at a flow rate of 25,423 L/hr in a closed circuit
through HX FERM and back to the FERM1-12. The energy requirement for the pump is 3.65 Hp and the
pump operates at an efficiency of 0.55 while the motor operates at an efficiency of 0.81. The pump head
is 59.8 ft. The pressure change across the pump, neglecting friction is 205 kPa. An additional pressure
change of 25 psia (172.5 kPa) was assumed as a result of the frictional forces of fluid flow.
Calculations on page 233.
LeGendre, Logan, Mendel, Seedial
83
Blowers:
B-101
Base Purchase Cost: $70,500
This centrifugal blower facilitates the transport of the fermentation gases and vapors from the
fermentation seed fermenters and the large 2,000,000 L fermentation tanks to the absorber in the
separation section so that the vaporized ethanol can be saved and the effluent hydrogen gas can be
burned to fuel the distillation tower reboiler. The flow rate of gases through the blower is 10,614
ft3/min. The blower efficiency is 0.75, and the motor that powers the blower has an efficiency of 0.92.
The power consumption is 300 HP. The blower is made of aluminum.
Calculations on page 213.

LeGendre, Logan, Mendel, Seedial
84
Separation Section
Storage Tanks:
Mixing Tank T-108
Base Purchase Cost: $26,800
T-108 is a floating roof storage vessel constructed of 304 stainless steel with a volume of 8,021
L. Streams S-S-124 (ethanol) and S-S-125(gasoline) flow into this tank for mixing. The tank is assumed to
have a working volume of 50% and a residence time of 10 minutes. It is assumed to operate at 50 °C and
1 atm. The tank has an agitator (turbine, closed tank) for mixing that is priced at $9,100 including the
motor and shaft costs.
Calculations on page 242.
Gasoline Storage Tank T-109
Base Purchase Cost $ 101,000
T-109 is a floating roof storage vessel constructed of 304 stainless steel with a volume of
108,278 L. This vessel stores three days worth of gasoline, a material that is added to denature the
ethanol that is produced. Stream S-S-125 leaves this tank at a flow rate of 475 L/hr and flows into mixing
tank, T-108.The gasoline will be stored at a temperature of 25 °C and a pressure of 1 atm. The storage
tank is assumed to have a working volume of 80%.
Calculations on page 242.
Succinic Acid Storage TankT-110
Base Purchase Cost $ 27,600
T-110 is a cone roof storage vessel constructed of 304 stainless steel with a volume 26,478 L.
This vessel stores three days worth of succinic acid . Stream S-S-121 flows into this tank via a conveyor
belt at a rate of 459 kg/hr. The solid succinic acid will be stored at a temperature of 25 °C and a pressure
of 1 atm. The storage tank is assumed to have a working volume of 80%.
LeGendre, Logan, Mendel, Seedial
85
Calculations on page 242.
Denatured Ethanol Holding Tank T-111
Base Purchase Cost $ 453,300
T-111 is a floating roof storage vessel constructed of 304 stainless steel with a volume of
2,057,287 L. This vessel stores three days worth of denatured ethanol. This stream (S-S-126) enters the
tank after being denatured in the mixing tank T-108. Stream S-S-126 enters this tank at a flow rate of
22,859 L/hr. The ethanol will be stored at a temperature of 50 °C and a pressure of 1 atm. The storage
tank is assumed to have a working volume of 80%.
Calculations on page 242.
Heat Exchangers:
HX-3
Base Purchase Cost: $113,900
The waste water from the electro-dialysis unit, Stream S-S-135, is used to sterilize the
fermentation product (S-S-109). The sterilized stream then flows into the Rotary Drum Filter (RDF-1).
The heat duty is 48,041,600 BTU/hr. Stream S-S-109 is heated from 37 °C to 92.2 °C, past the
deactivation temperature for E. coli of 62.2°C, (or from 98.6 °F to 198 °F) while the 21 psi water (S-S-135)
leaving ED-1 (Electrodialysis) is cooled from 100 °C to 43.3 °C (or from 228 °F to 110.4 °F). HX-3 is a
Floating Head Shell/Tube heat exchanger and is modeled as a carbon steel shell side/ stainless steel tube
side since the shell side material is hot water. The heat exchanger area is 9997 ft2.
Calculations on page 226.

LeGendre, Logan, Mendel, Seedial
86
Partial Condenser: HX-4
Base Purchase Cost: $ 65,900
This is a partial condenser for the distillation tower D-1.The top product from the tower(S-S-130)
flows through this heat exchanger before entering the reflux accumulator, RA-1. The heat duty is
68,130,000 BTU/hr. Stream S-S-130 has a flow rate of 189,673 kg/hr and is partially condensed at 82 °C
(179.5 °F) using cooling water (S-S-106) that is heated from 32.2 °C to 48.9 °C (90 °F to 120 °F). The
cooling water has a flow rate of 1,087,869 kg/hr. HX-4 is a Floating Head Shell/Tube heat exchanger and
is a carbon steel on the shell side and stainless steel on the tube side since the shell side material is
water. The exchanger area is 4,636 ft2.
Calculations on page 226.
HX-5
Base Purchase Cost: $21,200
The ethanol product stream (S-S-122) from the molecular sieve (MS-1) is cooled before entering
the mixing tank to be denatured. The ethanol is cooled from its atmospheric boiling point of 78.4 °C to
50 °C (173 °F to 122 °F) using cooling water. The flow rate of the cooling water(S-S-136) IS 23,766 kg/hr
and it is warmed from 32.2 °C to 48.9 °C (90 °F to 120 °F). The heat duty is 1,488,726 BTU/hr. HX-5 is a
Floating Head Shell/Tube heat exchanger and is modeled as a carbon steel shell side/ stainless steel tube
side since the shell side material is cooling water. The heat exchanger area is 239 ft2.
Calculations on page 226.
Reboiler: HX-6
Base Purchase Cost: $60,300
The remaining 33.78MMBtu/hr of the heat duty for the reboiler is provided by a kettle reboiler
heat exchanger which is heated with 16,775 kg/hr of condensing 50 psig steam. A heat transfer
coefficient of 200 Btu/hr-ft2-°F was used to calculate a heat transfer area of 2,412 ft3. The heat

LeGendre, Logan, Mendel, Seedial
87
exchanger is 304 stainless steel on the tube side, and carbon steel on the shell side. The vapor stream
leaving the reboiler (S-S-133) is sent back to the distillation column, while the liquid stream leaving the
reboiler is sent to the electro-dialysis (ED-1) system.
Calculations on page 226.
Pumps:
P-S-101
Base Purchase Cost: $13,100
This is a centrifugal pump constructed of 304 stainless steel that pumps the liquid fermentation
product from the rotary drum filter, RDF-1 to the distillation tower, D-1. The flow rate through the pump
is 174,995 L/ hr. The energy requirement for the pump is 67.9 Hp and the pump operates at an
efficiency of 0.75 while the motor operates at an efficiency of 0.83. The pump head is 221 ft. The
pressure change across the pump, neglecting friction is 475 kPa. An additional pressure change of 25
psia (172.5 kPa) was assumed as a result of the frictional forces of fluid flow.
Calculations on page 233.
P-S-102
Base Purchase Cost: $9,000
This is a centrifugal pump constructed of 304 stainless steel that pumps the stream containing
the succinic acid product, S-S-116 from the furnace (FN-1) to the electro-dialysis system (ED-1). The flow
rate through the pump is 180,559 L/ hr. The energy requirement for the pump is 37.3 Hp and the pump
operates at an efficiency of 0.75 while the motor operates at an efficiency of 0.83. A pressure change of
50 psia (344 kPa) was assumed as a result of frictional forces of the fluid flow.
Calculations on page 233.
LeGendre, Logan, Mendel, Seedial
88
P-S-104
Base Purchase Cost: $4,700
This is a centrifugal pump constructed of 304 stainless steel that pumps the product stream S-S-
119 from the crystallizer C-1 back to the electro dialysis unit. The flow rate through the pump is 40,625
L/ hr. The energy requirement for the pump is 10.5 Hp and the pump operates at an efficiency of 0.61
while the motor operates at an efficiency of 0.82. A pressure change of 50 psia (344 kPa) was assumed
as a result of frictional forces of the fluid flow.
Calculations on page 233.
P-S-105
Base Purchase Cost: $ 5,200
This is a centrifugal pump constructed of 304 stainless steel that pumps the liquid stream S-S-
104 scrubbed out in the absorber AB-1 to the distillation tower D-1. The flow rate through the pump is
29,396 L/ hr. The energy requirement for the pump is 14.9 Hp and the pump operates at an efficiency of
0.57 while the motor operates at an efficiency of 0.83. The pump head is 222 ft. The pressure change
across the pump, neglecting friction is 464 kPa. An additional pressure change of 25 psia (172.5kPa) was
assumed as a result of the frictional forces of fluid flow.
Calculations on page 233.
P-S-106
Base Purchase Cost: $ 13,500
This is a centrifugal pump constructed of 304 stainless steel that pumps the stream S-S-128 from
the reflux accumulator RA-1 to the distillation tower D-1. It operates continuously at a rate of 205,879 L/
hr. The energy requirement for the pump is 68.28 Hp and the pump operates at an efficiency of 0.76
while the motor operates at an efficiency of 0.83. The pump head is 234 ft. The pressure change across

LeGendre, Logan, Mendel, Seedial
89
the pump, neglecting friction is 389 kPa. An additional pressure change of 25 psia (172.5 kPa) was
assumed as a result of the frictional forces of fluid flow.
Calculations on page 233.
P-S-107
Base Purchase Cost: $15,700
This is a centrifugal pump constructed of 304 stainless steel that pumps the bottoms product of
the distillation column D-1 to the furnace FN-1 via stream S-131. The flow rate through the pump is
232,717 L/ hr. The energy requirement for the pump is 46.81 Hp and the pump operates at an efficiency
of 0.77 while the motor operates at an efficiency of 0.83. A pressure change of 50 psia (344 kPa) was
assumed as a result of frictional forces of the fluid flow.
Calculations on page 233.
P-S-108
Base Purchase Cost: $7,200
This is a centrifugal pump constructed of stainless steel 304 that pumps process water to the
absorber. It operates continuously at a rate of 27,023 L/ hr. The energy requirement for the pump is 7.1
Hp and the pump operates at an efficiency of 0.56 while the motor operates at an efficiency of 0.82. The
pump head is 108 ft. The pressure change across the pump, neglecting friction is 150 kPa. An additional
pressure change of 25 psia (172.5 kPa) was assumed as a result of the frictional forces of fluid flow.
Calculations on page 223320.

LeGendre, Logan, Mendel, Seedial
90
Blowers:
B-102
Base Purchase Cost: $ 264,200
This centrifugal blower facilitates the transport of air to the furnace (FN-1) in the separation
section so that the effluent gases can be burned to fuel the distillation tower reboiler. The flow rate of
air through the blower is 70,214 ft3/min. The blower efficiency is 0.75, and the motor that powers the
blower has an efficiency of 0.94. The power consumption is 1602 HP. The blower is made of aluminum.
Calculations on page 213.

LeGendre, Logan, Mendel, Seedial
91
Columns:
Distillation Column : D-1
Base Purchase Cost: $ 798,000
The distillation column serves to remove a majority of the water and all the succinic acid from
the feed streams (S-S-104 & S-S-112) and recycle stream (S-S-123) which together have a flow rate of
205,972 kg/hr and are composed of water, succinic acid, corn steep liquor, biomass, and ethanol.
Streams S-S-104, S-S-112 and S-S-123 enter the column at stages 16, 12, and 11 respectively. By this
point, the corn steep liquor has had all solids filtered out, and is a selection of water and salts which do
not vaporize and therefore leave as bottoms product. It is necessary that the top product be 92%
ethanol by weight for the subsequent processing by molecular sieves, so 179,000 kg/hr of water, along
with all the corn steep liquor and succinic acid must leave as bottoms product. The small quantity of
remaining biomass is filtered out by a hopper, and leaves as a separate stream (S-S-139, 29.6 kg/hr)
from the bottom of the tower as suggested by industrial consultant Mr. Bruce Vrana. The tower was
modeled in Aspen, with components of succinic acid, water, and ethanol. Biomass and Corn Steep
Liquor were added separately due to their unknown composition, but known properties; both absolutely
will not vaporize at the tower temperatures. The top of the tower has a pressure of 18 psia and
operates at 81.95 °C while the bottom operates at 25 psia and 108.89 °C. In order to achieve the
desired separation, 32 theoretical stages are required. At a stage efficiency of 0.40 as suggested by
Bruce Vrana, there are a total of 79 stages plus the re-boiler and partial condenser. Aspen calculated a
diameter of 12 ft for the column and with 2 ft spacing between the stages, the column is 172 ft tall. The
trays in use are baffle trays, as suggested by Bruce Vrana, for distillation columns with small solids
content. The column is constructed of 304 stainless steel, as some salts and succinic acid remain in
solution.
Calculations on page 215.

LeGendre, Logan, Mendel, Seedial
92
Absorber Column: AB-1
Base Purchase Cost: $117,100
The absorber column receives the effluent vapors from the seed and main fermentation plant
sections, which enter at the bottom stage of the tower at a mass flow rate of 19,525 kg/hr. Process
water is supplied to the top stage at a flow rate of 27,022 L/hr to remove the ethanol and water from
the vapor phase. All of the ethanol is removed from the vapor phase and sent to the distillation tower in
the absorber exit stream S-S-104. A hydrogen-rich gas stream leaves the absorber column from the top
stage, and is sent to the furnace for subsequent burning to fuel the distillation tower D-1 reboiler. The
absorber tower has no energy requirement. The tower has 7 stages calculated by Aspen. Assuming a
tray efficiency of 0.40, 18 trays are used. The diameter calculated by Aspen is 5.5 ft. The height of the
tower is 50 ft, and it uses sieve trays. The tower is made of 304 stainless steel. The pressure at the top of
the tower is 16 psia and the pressure at the bottom of the tower is 20 psia.
Calculations on page 215.
LeGendre, Logan, Mendel, Seedial
93
Miscellaneous:
Reflux Accumulator: RA-1
Base Purchase Cost: $47,000
The reflux accumulator collects the liquid and vapor that have exited the distillation tower D-1
top stage condenser. The liquid collected is returned to the column in stream S-S-128 at a flow rate of
57,526 L/hr through pump P-S-106, and the hot vapor at 92% ethanol by mass (8% water) is sent to the
molecular sieves for subsequent dehydration at a mass flow rate of 19,595 kg/hr. The volume of the
reflux accumulator is 605 ft3. The diameter is 11.6 ft and the height is 5.8 ft, for an aspect ratio (L/D) of
½. The residence time is 5 minutes.
Calculations on page 238.
FN-1 (Furnace)
Base Purchase Cost: $1,717,600
Re-boiling the bottoms of the distillation column is one of the largest energy consumptions of
our process. In order to cut the cost of heating this stream, we designed a furnace to use the hydrogen
being produced in the fermenters. This constitutes a heat duty of 76.9MMBTU/hr. The feed from the
fermenters carries 392.2 kmol/hr of hydrogen. To reduce the burning temperature to 1100°F (the limit
of the furnace) air is mixed in to this stream at a rate of 4687.4 kmol/hr. The temperature of the flue
gas exiting is 121°C to maintain a 10°C temperature difference. The furnace is a fire heater made of 304
stainless steel.
Calculations on page 224.
Rotary Drum Vacuum Filter: RDF-1
Base Purchase Cost: $184,400

LeGendre, Logan, Mendel, Seedial
94
The rotary drum vacuum filter removes 90% of the deactivated biomass and corn steep liquor
solids after the fermentation broth has been sterilized. The cake leaving the filter is 70% solids by mass,
with a flow rate of 977 kg/hr. This cake is then sent to a landfill, as suggested by the problem statement.
The remaining solution is then pumped to the distillation tower D-1 through pump P-S-101 at a flow rate
of 174,995 L/hr. The filter uses a 2-4 inch pre-coating of diatomaceous earth as a filtration aid. The filter
area is 113 ft2 and the energy consumption is on average 11.8 HP.
Calculations on page 239.
Molecular Sieve : MS-1
Base Purchase Cost: $ 2,746,200
The molecular sieves system serves to separate the last 8% by weight of water from the ethanol
vapor stream leaving the distillation tower. The system does this by absorbing the water into a resin. In
order to purge this water, periodically 20% of the pure ethanol stream must be recirculated back to the
molecular sieves to pull the water out of the resin. This regeneration results in an exit stream of 37% by
weight water, the remainder ethanol, that must be fed back to the distillation tower (stream S-S-123).
The pricing is based on flow rate of 99.5 % pure ethanol exiting the system, which is 18,036 kg/hr
(39,800 lb/hr). The pricing and method of modeling were given to us by industrial consultant Mr. Bruce
Vrana in the problem statement. The ethanol leaving the molecular sieves is at 78.4°C because ethanol
is a liquid at this temperature at atmospheric pressure. Steam, electricity, and cooling water are used by
the process, as described in the problem statement.
Calculations on page 232.
Electro-Dialysis : ED-1
Base Purchase Cost : $ 2,700,000.
Electro-dialysis is a system by which charged particles are transferred from low to high
concentration by an applied electric field. Specific information pertaining to the design such as voltage

LeGendre, Logan, Mendel, Seedial
95
necessary and transfer area were not available. Pricing was calculated by a general correlation from
Perry’s Chemical Engineering Handbook. For the modeling, an assumption of zero heat transfer with the
mass transfer was used. This assumption will of course not be true, but it is used as a starting point. The
effect of transferred heat is twofold, first it would decrease the temperature of the feed to HX-3.
However, we anticipate there to be plenty of heat to preheat the distillation stream even with
significant heat transfer. Additionally, an increase in the temperature of S-S-118 will increase the
solubility of succinic acid. Depending how significant this effect is, chilled water may be needed to cool
the crystallizer. In an article (Meynial-Salles et al.) on succinic acid separation by electro-dialysis,
concentrations were increased from 20 g/L to 80 g/L by electro-dialysis. Because electro-dialysis is
driven by electric potential, it is expected to be possible to achieve 80 g/L concentrations of succinic
acid. However, as a conservative estimate, a much lower number of 10.4 g/L correlating to 4 fold
concentration, similar to that in the report was used. From both Perry’s and Meynial-Salles et al.,
electro-dialysis is used to completely remove ionic components, so no succinic acid is modeled as
leaving in stream S-S-135. Accordingly, this hot stream can be sent to the ocean after being cooled in
HX-3. Stream S-S-118, a concentrated stream of succinic acid in water, is sent to the crystallizer.
Calculations on page 218.
Crystallizer : C-1
Base Purchase Cost: $ 154,500
The crystallizer allows for the precipitation of the succinic acid out of the super-saturated
solution down to the succinic acid solubility limit of 3 g/L, while recycling the succinic acid solution back
to the electro dialysis as the feed for the concentrated stream so as to reduce loss of this valuable
specialty chemical. As a very small quantity of corn steep liquor will also recirculate (primarily water,
however), a water purge is performed in the amount of 10% by volume, exiting with the crystals. This is
expected to be higher than necessary, however this purge stream was designed conservatively so as to

LeGendre, Logan, Mendel, Seedial
96
predict the loss of the greatest amount of product. Process water of the volume of water purged is
added in the feed to the concentrated stream of the electro-dialysis to make up for this. In the case that
heat transfer is found to be significant in the electro dialysis, the crystallizer may need to be cooled. The
purge stream contains a small quantity of organics, so it is sent for waste water treatment.
Calculations on page 214.
Dryer: DR-1
Base Purchase Cost: $ 22,200
The dryer takes the crystal product from C-1 and removes the water necessarily present. The
amount of water is unknown, however we assumed no more than 25% by weight of the crystals could
be water. This corresponds to 4.5 square feet of drying area. Because of the low cost and the highly
unknown nature of this process, we have assumed a worst case scenario drying area of 45 square feet.
Utility costs will depend on the amount of water that sticks to the crystals, however this calculates to 90
cents per hour at 25 mass percent water and therefore is nearly inconsequential. We have left this out
and count the change in pricing as part of the sensitivity analysis.
Calculations on page 217.
Screw Conveyor: CB-1
Base Purchase Cost: $13,000
The Screw conveyor moves the solid succinic acid crystals in stream S-S-121 ( 459 kg/hr) to the
succinic acid holding tank, T-110. The conveyor is made of 304 stainless steel. The conveyor is 24 feet
long with a motor and power requirement of less than 1 HP.
Calculations on page 240.

LeGendre, Logan, Mendel, Seedial
97
Unit Specification Sheets
Section VIII
Feed Preparation Section………………….……………….……………….……………….……………….…………………… 98
Plant Seed Fermentation Section……………….……………….……………….……………….……………….…….…… 113
Main Fermentation Section……………….……………….……………….……………….……………….…………………… 126
Separation Section……………….……………….……………….……………….……………….……………….………….……. 137
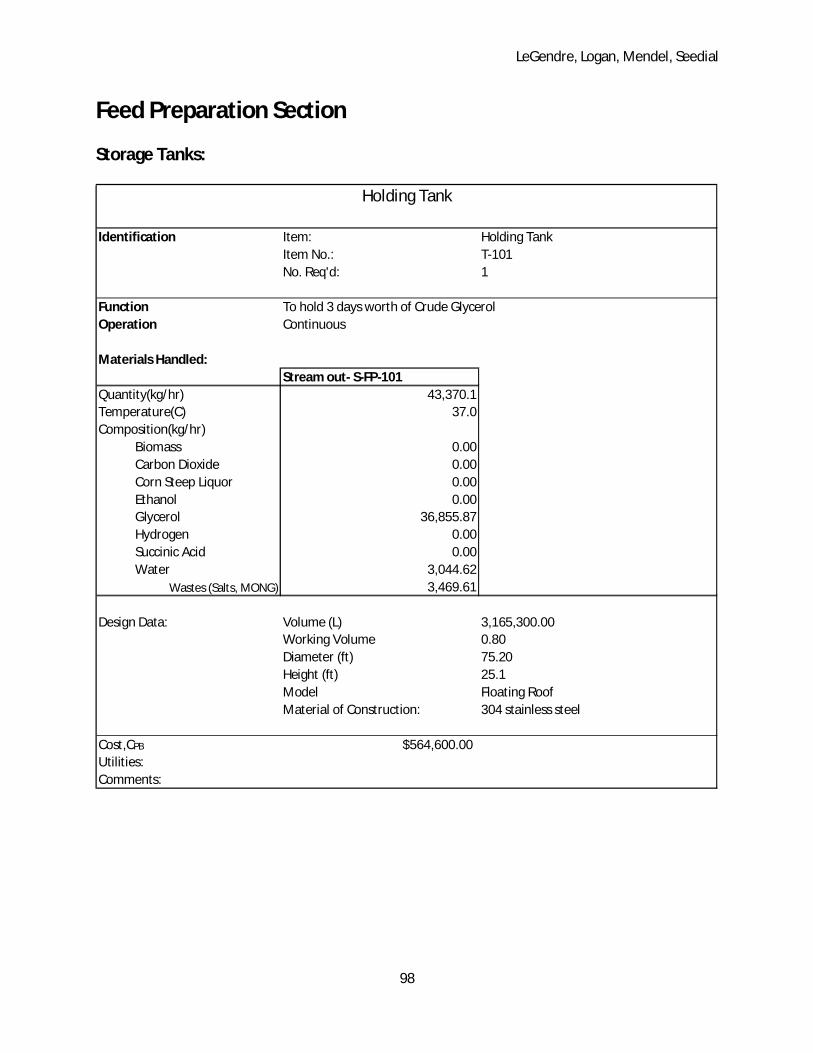
LeGendre, Logan, Mendel, Seedial
98
Feed Preparation Section
Storage Tanks:
Identification Item: Holding TankItem No.: T-101No. Req'd: 1
Function To hold 3 days worth of Crude Glycerol Operation Continuous
Materials Handled:Stream out- S-FP-101
Quantity(kg/hr) 43,370.1Temperature(C) 37.0Composition(kg/hr)
Biomass 0.00Carbon Dioxide 0.00Corn Steep Liquor 0.00Ethanol 0.00Glycerol 36,855.87Hydrogen 0.00Succinic Acid 0.00Water 3,044.62
Wastes (Salts, MONG) 3,469.61
Design Data: Volume (L) 3,165,300.00Working Volume 0.80Diameter (ft) 75.20Height (ft) 25.1Model Floating RoofMaterial of Construction: 304 stainless steel
Cost,CPB $564,600.00Utilities:Comments:
Holding Tank

LeGendre, Logan, Mendel, Seedial
99
Identification Item: Holding TankItem No.: T-103No. Req'd: 1
Function To hold 3 days worth of Corn Steep LiquorOperation Continuous
Materials Handled:Stream out- S-FP-106
Quantity(kg/hr) 927.4Temperature(C) 37.0Composition(kg/hr)
Biomass 0.0Carbon Dioxide 0.0Corn Steep Liquor 927.4Ethanol 0.0Glycerol 0.0Hydrogen 0.0Succinic Acid 0.0Water 0.0
Wastes (Salts, MONG) 0
Design Data: Volume (L) 83,500.00Working Volume 0.80Diameter (ft) 22.40Height (ft) 7.58Model Cone RoofMaterial of Construction: 304 stainless steel
Cost,CPB $49,600.00Utilities:Comments:
Holding Tank
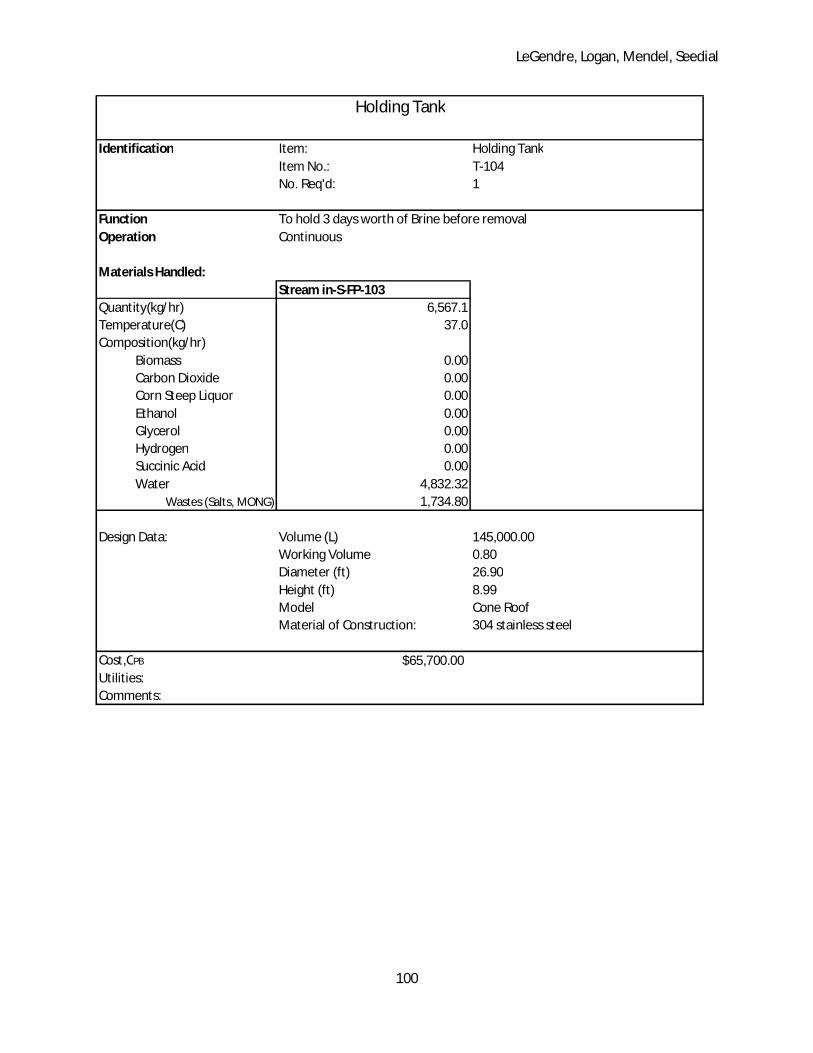
LeGendre, Logan, Mendel, Seedial
100
Identification Item: Holding TankItem No.: T-104No. Req'd: 1
Function To hold 3 days worth of Brine before removalOperation Continuous
Materials Handled:Stream in-S-FP-103
Quantity(kg/hr) 6,567.1Temperature(C) 37.0Composition(kg/hr)
Biomass 0.00Carbon Dioxide 0.00Corn Steep Liquor 0.00Ethanol 0.00Glycerol 0.00Hydrogen 0.00Succinic Acid 0.00Water 4,832.32
Wastes (Salts, MONG) 1,734.80
Design Data: Volume (L) 145,000.00Working Volume 0.80Diameter (ft) 26.90Height (ft) 8.99Model Cone RoofMaterial of Construction: 304 stainless steel
Cost,CPB $65,700.00Utilities:Comments:
Holding Tank
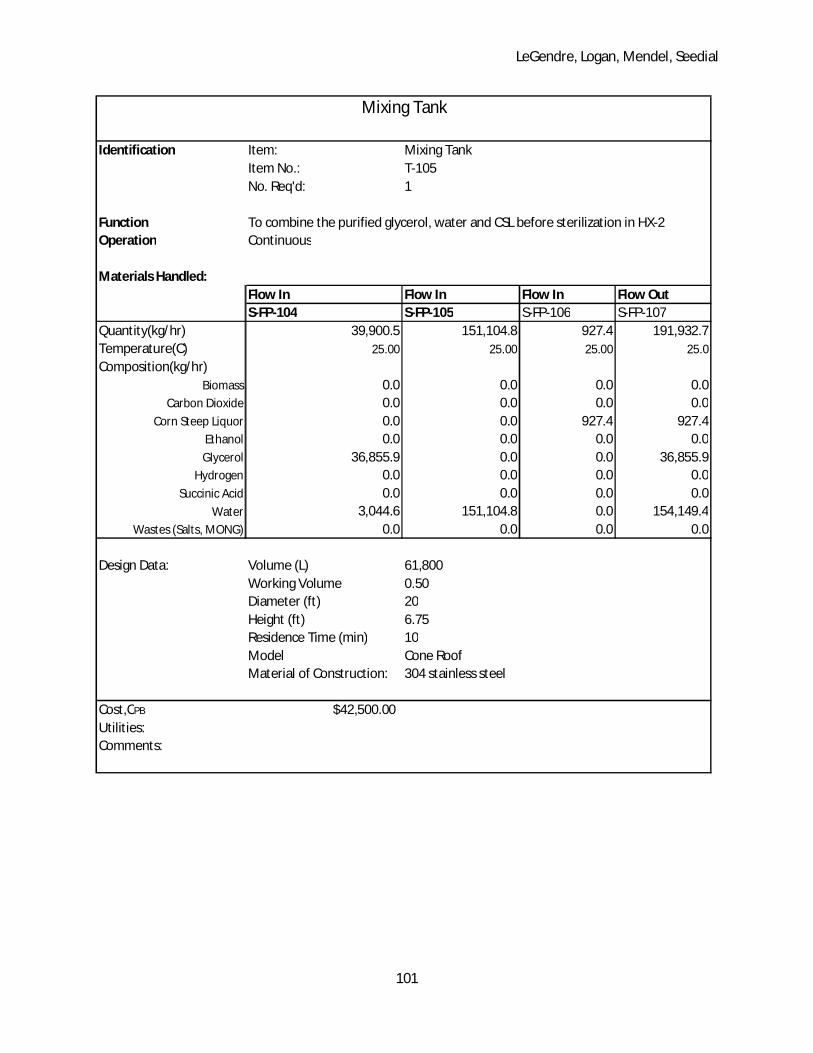
LeGendre, Logan, Mendel, Seedial
101
Identification Item: Mixing TankItem No.: T-105No. Req'd: 1
Function To combine the purified glycerol, water and CSL before sterilization in HX-2Operation Continuous
Materials Handled:Flow In Flow In Flow In Flow OutS-FP-104 S-FP-105 S-FP-106 S-FP-107
Quantity(kg/hr) 39,900.5 151,104.8 927.4 191,932.7Temperature(C) 25.00 25.00 25.00 25.0
Composition(kg/hr) Biomass 0.0 0.0 0.0 0.0
Carbon Dioxide 0.0 0.0 0.0 0.0Corn Steep Liquor 0.0 0.0 927.4 927.4
Ethanol 0.0 0.0 0.0 0.0Glycerol 36,855.9 0.0 0.0 36,855.9
Hydrogen 0.0 0.0 0.0 0.0Succinic Acid 0.0 0.0 0.0 0.0
Water 3,044.6 151,104.8 0.0 154,149.4Wastes (Salts, MONG) 0.0 0.0 0.0 0.0
Design Data: Volume (L) 61,800Working Volume 0.50Diameter (ft) 20Height (ft) 6.75Residence Time (min) 10Model Cone RoofMaterial of Construction: 304 stainless steel
Cost,CPB $42,500.00Utilities:Comments:
Mixing Tank
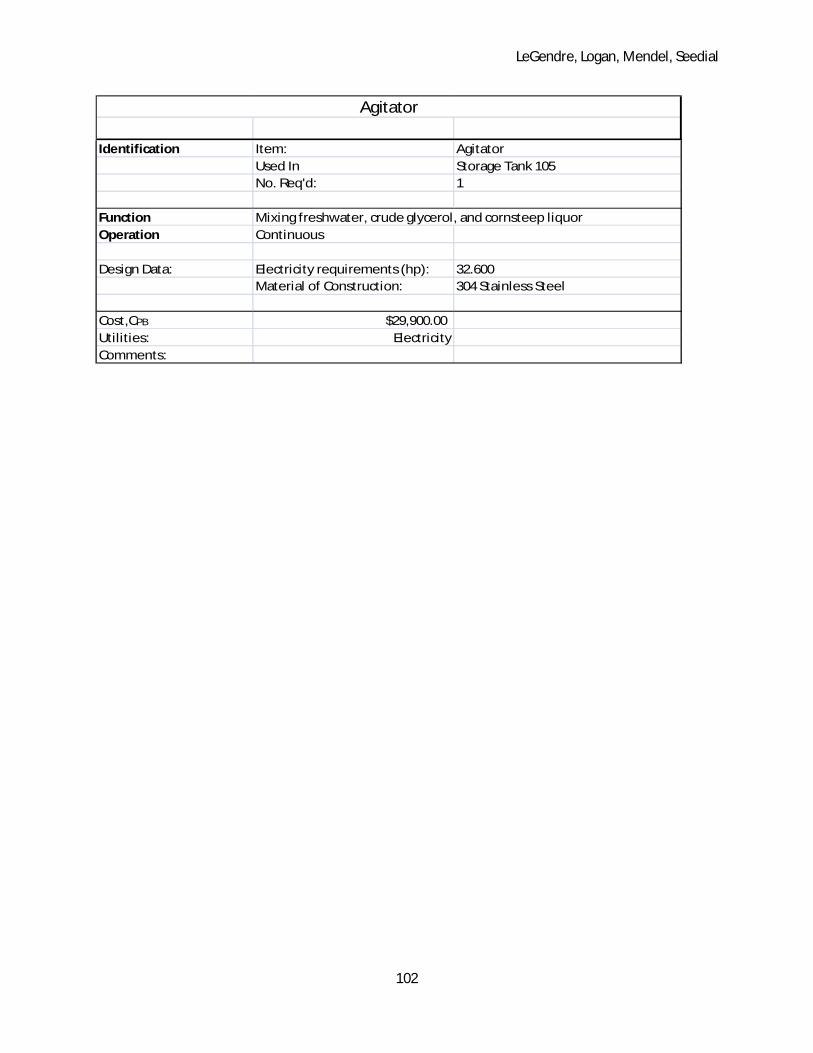
LeGendre, Logan, Mendel, Seedial
102
Identification Item: AgitatorUsed In Storage Tank 105No. Req'd: 1
FunctionOperation Continuous
Design Data: Electricity requirements (hp): 32.600Material of Construction: 304 Stainless Steel
Cost,CPB $29,900.00Utilities: ElectricityComments:
Agitator
Mixing freshwater, crude glycerol, and cornsteep liquor
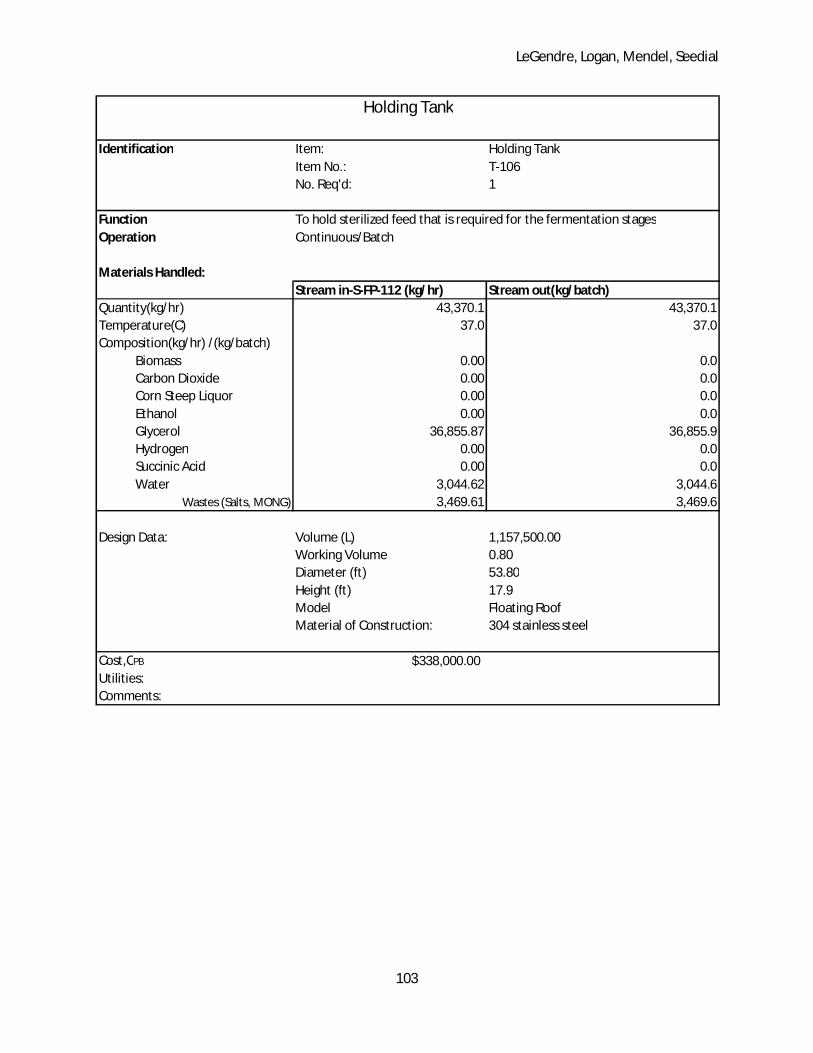
LeGendre, Logan, Mendel, Seedial
103
Identification Item: Holding TankItem No.: T-106No. Req'd: 1
Function To hold sterilized feed that is required for the fermentation stagesOperation Continuous/Batch
Materials Handled:Stream in-S-FP-112 (kg/hr) Stream out(kg/batch)
Quantity(kg/hr) 43,370.1 43,370.1Temperature(C) 37.0 37.0Composition(kg/hr) /(kg/batch)
Biomass 0.00 0.0Carbon Dioxide 0.00 0.0Corn Steep Liquor 0.00 0.0Ethanol 0.00 0.0Glycerol 36,855.87 36,855.9Hydrogen 0.00 0.0Succinic Acid 0.00 0.0Water 3,044.62 3,044.6
Wastes (Salts, MONG) 3,469.61 3,469.6
Design Data: Volume (L) 1,157,500.00Working Volume 0.80Diameter (ft) 53.80Height (ft) 17.9Model Floating RoofMaterial of Construction: 304 stainless steel
Cost,CPB $338,000.00Utilities:Comments:
Holding Tank

LeGendre, Logan, Mendel, Seedial
104
Heat Exchangers:
Identification Item: Heat ExchangerItem No.: HX-1No. Req'd: 1
Function To preheat the feed S-FP-114 before sterilization and cool the hot sterilized feed(S-FP-109) to the fermentation temperature
Operation Continuous
Materials Handled:Stream In Stream out Stream in Stream outS-FP-109 S-FP-112 S-FP-114 S-FP-108
Quantity(kg/hr) 191,932.7 191,932.7 191,932.7 191,932.7Temperature(C) 121.0 37.0 25.0 111.0Composition(kg/hr)
Biomass 0.0 0.0 0.0 0.0Carbon Dioxide 0.0 0.0 0.0 0.0Corn Steep Liquor 927.4 927.4 927.4 927.4Ethanol 0.0 0.0 0.0 0.0Glycerol 36,855.9 36,855.9 36,855.9 36,855.9Hydrogen 0.0 0.0 0.0 0.0Succinic Acid 0.0 0.0 0.0 0.0Water 154,149.4 154,149.4 154,149.4 154,149.4Wastes (Salts, MONG) 0.0 0.0 0.0 0.0
Design Data:Heat Duty(BTU) 59,665,811.0
Overall Heat Coefficient (BTU/hr-ft2°F) 250.0
Heat Transfer Area (ft2) 12,042.0Type Floating Head Shell/Tube Materials of Construction
Shell: Tube:304 Stainless steel 304 Stainless steel
Cost,CPB $132,300.00Utilities:Comments: On start up, duty is provided by 50 psig steam
2470 kg of steam is required.
Shell Side Tube Side
Heat Exchanger
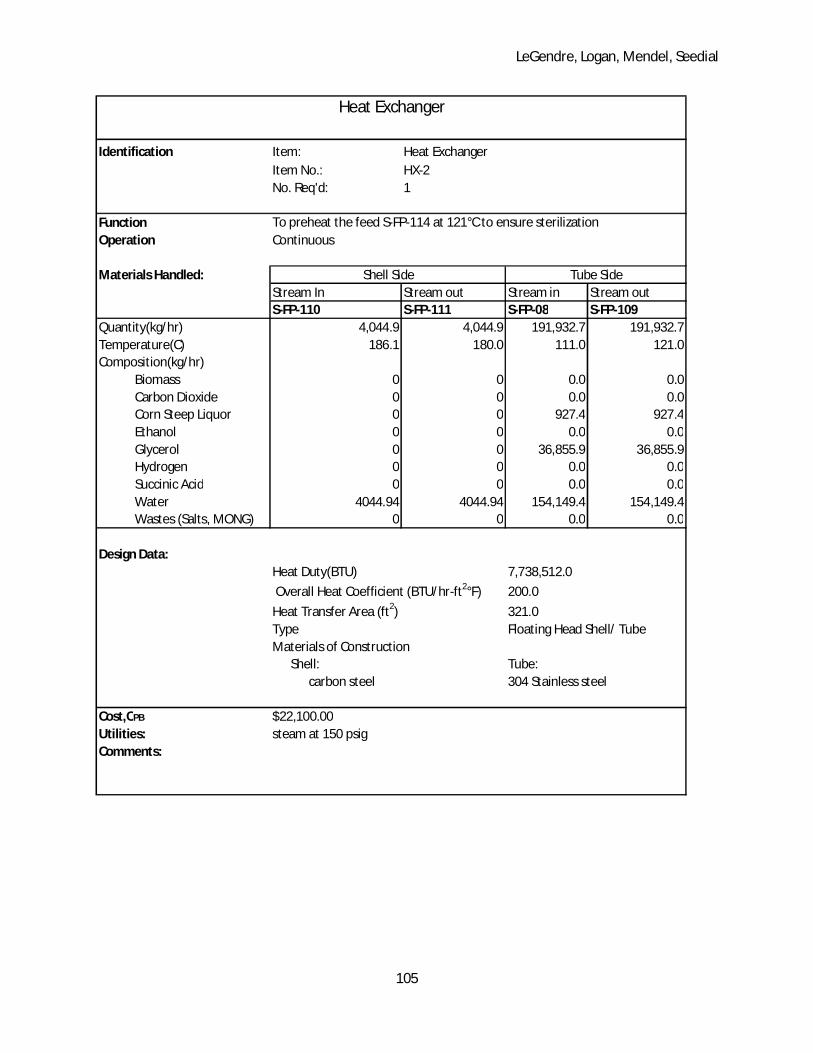
LeGendre, Logan, Mendel, Seedial
105
Identification Item: Heat ExchangerItem No.: HX-2No. Req'd: 1
Function To preheat the feed S-FP-114 at 121°C to ensure sterilizationOperation Continuous
Materials Handled:Stream In Stream out Stream in Stream outS-FP-110 S-FP-111 S-FP-08 S-FP-109
Quantity(kg/hr) 4,044.9 4,044.9 191,932.7 191,932.7Temperature(C) 186.1 180.0 111.0 121.0Composition(kg/hr)
Biomass 0 0 0.0 0.0Carbon Dioxide 0 0 0.0 0.0Corn Steep Liquor 0 0 927.4 927.4Ethanol 0 0 0.0 0.0Glycerol 0 0 36,855.9 36,855.9Hydrogen 0 0 0.0 0.0Succinic Acid 0 0 0.0 0.0Water 4044.94 4044.94 154,149.4 154,149.4Wastes (Salts, MONG) 0 0 0.0 0.0
Design Data:Heat Duty(BTU) 7,738,512.0
Overall Heat Coefficient (BTU/hr-ft2°F) 200.0
Heat Transfer Area (ft2) 321.0Type Floating Head Shell/ TubeMaterials of Construction
Shell: Tube:carbon steel 304 Stainless steel
Cost,CPB $22,100.00Utilities: steam at 150 psigComments:
Shell Side Tube Side
Heat Exchanger

LeGendre, Logan, Mendel, Seedial
106
Pumps:
Identification Item: PumpItem No.: P-FP-01No. Req'd: 1
FunctionOperation Continuous
Materials Handled:Feed: S-FP-101 Exit: S-FP-101
Quantity(kg/hr) 43,370.1 43,370.1Temperature(C) 25.0 25.0Composition(kg/hr)
Biomass 0.000 0.000Carbon Dioxide 0.000 0.000Corn Steep Liquor 0.000 0.000Ethanol 0.000 0.000Glycerol 36855.871 36855.871Hydrogen 0.000 0.000Succinic Acid 0.000 0.000Water 3044.615 3044.615Wastes 3469.608 3469.608
Design Data: Density of Fluid (kg/l): 1.233Brake Power (hp): 7.663Pump Head (ft): 93.637Electricity requirements( kW): 6.962Material of Construction: 304 stainless steel
Cost,CPB $4,500.00Utilities: ElectricityComments:
Pump
To bring crude glycerol form storage tank to the glycerol purification system

LeGendre, Logan, Mendel, Seedial
107
Identification Item: PumpItem No.: P-FP-02No. Req'd: 1
FunctionOperation Continuous
Materials Handled:Feed: S-FP-105 Exit: S-FP-105
Quantity(kg/hr) 151,104.8 151,104.8Temperature(C) 25.0 25.0Composition(kg/hr)
Biomass 0.000 0.000Carbon Dioxide 0.000 0.000Corn Steep Liquor 0.000 0.000Ethanol 0.000 0.000Glycerol 0.000 0.000Hydrogen 0.000 0.000Succinic Acid 0.000 0.000Water 151104.765 151104.765Wastes 0.000 0.000
Design Data: Density of Fluid (kg/l): 1.000Brake Power (hp): 27.820Pump Head (ft): 122.106Electricity requirements( kW): 25.110Material of Construction: 304 stainless steel
Cost,CPB $8,400.00Utilities: ElectricityComments:
Pump
To bring fresh water to mix with cornsteep liquor

LeGendre, Logan, Mendel, Seedial
108
Identification Item: PumpItem No.: P-FP-03No. Req'd: 1
FunctionOperation Continuous
Materials Handled:Feed: S-FP-106 Exit: S-FP-106
Quantity(kg/hr) 927.4 927.4Temperature(C) 25.0 25.0Composition(kg/hr)
Biomass 0.000 0.000Carbon Dioxide 0.000 0.000Corn Steep Liquor 927.419 927.419Ethanol 0.000 0.000Glycerol 0.000 0.000Hydrogen 0.000 0.000Succinic Acid 0.000 0.000Water 0.000 0.000Wastes 0.000 0.000
Design Data: Density of Fluid (kg/l): 1.000Brake Power (hp): 0.111Pump Head (ft): 64.430Electricity requirements( kW): 0.109Material of Construction: 304 stainless steel
Cost,CPB $4,100.00Utilities: ElectricityComments:
Pump
To bring cornsteep liquor to mix with fresh water

LeGendre, Logan, Mendel, Seedial
109
Identification Item: PumpItem No.: P-FP-04No. Req'd: 1
FunctionOperation Continuous
Materials Handled:Feed: S-FP-104 Exit: S-FP-104
Quantity(kg/hr) 39,900.5 39,900.5Temperature(C) 25.0 25.0Composition(kg/hr)
Biomass 0.000 0.000Carbon Dioxide 0.000 0.000Corn Steep Liquor 0.000 0.000Ethanol 0.000 0.000Glycerol 36855.871 36855.871Hydrogen 0.000 0.000Succinic Acid 0.000 0.000Water 3044.615 3044.615Wastes 0.000 0.000
Design Data: Density of Fluid (kg/l): 1.233Brake Power (hp): 4.100Pump Head (ft): 53.525Electricity requirements( kW): 3.746Material of Construction: 304 stainless steel
Cost,CPB $3,900.00Utilities: ElectricityComments:
Pump
To bring purified glycerol to mix with cornsteep liquor and fresh water

LeGendre, Logan, Mendel, Seedial
110
Identification Item: PumpItem No.: P-FP-05No. Req'd: 1
FunctionOperation Continuous
Materials Handled:Feed: S-FP-103 Exit: S-FP-103
Quantity(kg/hr) 6,567.1 6,567.1Temperature(C) 25.0 25.0Composition(kg/hr)
Biomass 0.000 0.000Carbon Dioxide 0.000 0.000Corn Steep Liquor 0.000 0.000Ethanol 0.000 0.000Glycerol 0.000 0.000Hydrogen 0.000 0.000Succinic Acid 0.000 0.000Water 4832.322 4832.322Wastes 1734.804 1734.804
Design Data: Density of Fluid (kg/l): 1.359Brake Power (hp): 1.228Pump Head (ft): 51.418Electricity requirements( kW): 1.141Material of Construction: 304 stainless steel
Cost,CPB $3,500.00Utilities: ElectricityComments:
Pump
To bring waste brine from glycerol purification system to storage

LeGendre, Logan, Mendel, Seedial
111
Identification Item: PumpItem No.: P-FP-06No. Req'd: 1
FunctionOperation Continuous
Materials Handled:Feed: S-FP-107 Exit: S-FP-114
Quantity(kg/hr) 191,932.7 191,932.7Temperature(C) 25.0 25.0Composition(kg/hr)
Biomass 0.000 0.000Carbon Dioxide 0.000 0.000Corn Steep Liquor 927.419 927.419Ethanol 0.000 0.000Glycerol 36855.871 36855.871Hydrogen 0.000 0.000Succinic Acid 0.000 0.000Water 154149.381 154149.381Wastes 0.000 0.000
Design Data: Density of Fluid (kg/l): 1.036Brake Power (hp): 37.549Pump Head (ft): 132.665Electricity requirements( kW): 33.880Material of Construction: 304 stainless steel
Cost,CPB $10,100.00Utilities: ElectricityComments:
Pump
To bring glycerol/water/cornsteep liquor mixture through heat exchangers to holding tank

LeGendre, Logan, Mendel, Seedial
112
Miscellaneous:
Identification Item: Glycerol Purification SystemItem No.: R-101No. Req'd: 1
Function To purify the crude glycerol feed so that it only contains waterand glycerol
Operation Continuous
Materials Handled:Stream In Stream in Stream out Stream out Stream outS-FP-101 S-FP-102 S-FP-103 S-FP-104 S-FP-113
Quantity(kg/hr) 43,370.1 4,832.3 6,567.1 39,900.5 1,734.8Temperature(C) 25.0 25.0 25.0 25.0 25.0Composition(kg/hr)
Biomass 0.0 0.0 0.0 0.0 0Carbon Dioxide 0.0 0.0 0.0 0.0 0.00Corn Steep Liquor 0.0 0.0 0.0 0.0 0.00Ethanol 0.0 0.0 0.0 0.0 0.00Glycerol 36,855.9 0.0 0.0 36,855.9 0.00Hydrogen 0.0 0.0 0.0 0.0 0.00Succinic Acid 0.0 0.0 0.0 0.0 0.00Water 3,044.6 4,832.3 4,832.3 3,044.6 0.00Wastes (Salts, MONG) 3,469.6 0.0 1,734.8 0.0 1,734.80
Design Data:Processes : Reverse Osmosis
Electro-pressure membrane technologyElectro-dialysis
Cost,CBM $430,800.00
Utilities:Comments:
Glycerol Purification System

LeGendre, Logan, Mendel, Seedial
113
Seed Fermentation Section (Plant and Lab):
Fermenters:
Identification Item: FermenterItem No.: Seed 4A/4BNo. Req'd: 2
Function To grow up Ecoli cells for 60 hours for innoculation in seed fermenter, Seed Ferm 5A or 5B
Operation Batch
Materials Handled: Stream In Stream in Stream out Stream outS-105 S-101 S-109 S-106
Quantity(kg/hr) 7.6 160.9 16.4 152.1Temperature(C) 37.00 37.00 37.00 37.00Composition(kg/hr)
Biomass 0.01 0.00 0.00 0.26Carbon Dioxide 0.00 0.00 14.32 0.00Corn Steep Liquor 0.04 0.78 0.00 0.82Ethanol 0.76 0.00 0.74 15.17Glycerol 0.00 30.90 0.00 0.00Hydrogen 0.00 0.00 0.66 0.00Succinic Acid 0.02 0.00 0.00 0.42Water 6.79 129.25 0.71 135.45
Design Data: Volume(L): 200Working Vol initial (L) : 163.9 (82%)Working Vol at end(L) : 157.7 (79%)Height (ft) 3.3Diameter (ft) 1.65Material of Construction: 304 Stainless Steel
Cost: InsignificantUtilities:Comments:
Seed Fermenter
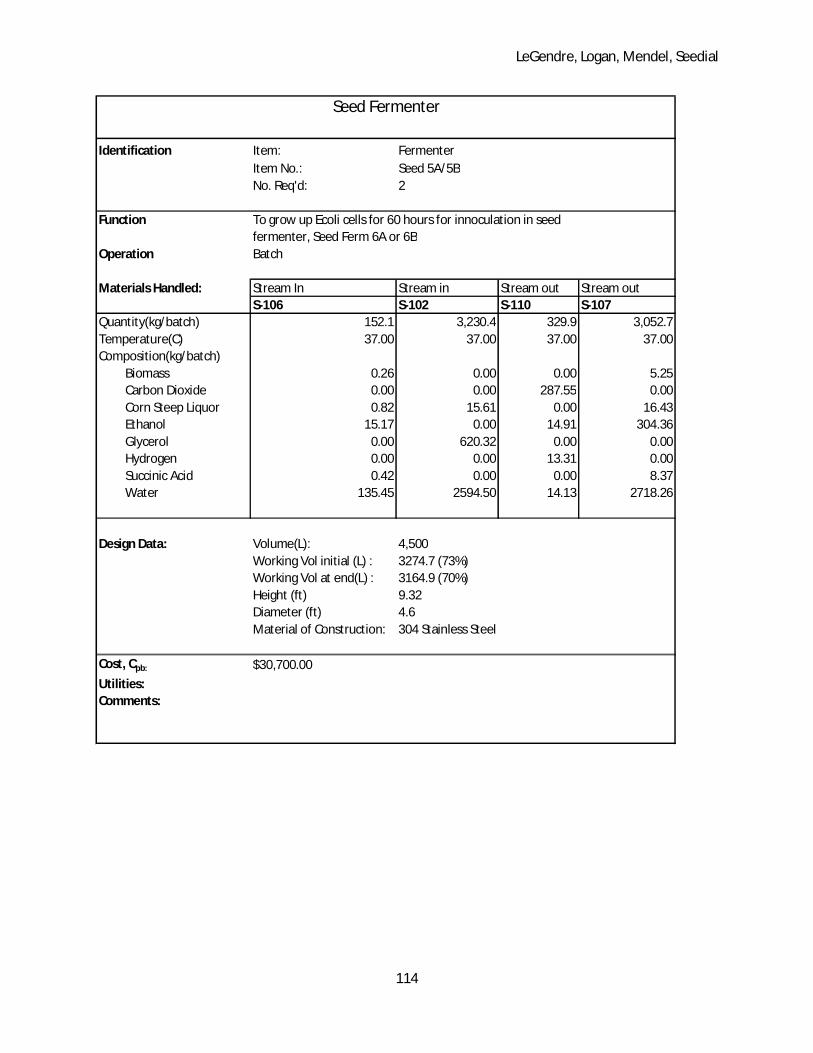
LeGendre, Logan, Mendel, Seedial
114
Identification Item: FermenterItem No.: Seed 5A/5BNo. Req'd: 2
Function To grow up Ecoli cells for 60 hours for innoculation in seed fermenter, Seed Ferm 6A or 6B
Operation Batch
Materials Handled: Stream In Stream in Stream out Stream outS-106 S-102 S-110 S-107
Quantity(kg/batch) 152.1 3,230.4 329.9 3,052.7Temperature(C) 37.00 37.00 37.00 37.00Composition(kg/batch)
Biomass 0.26 0.00 0.00 5.25Carbon Dioxide 0.00 0.00 287.55 0.00Corn Steep Liquor 0.82 15.61 0.00 16.43Ethanol 15.17 0.00 14.91 304.36Glycerol 0.00 620.32 0.00 0.00Hydrogen 0.00 0.00 13.31 0.00Succinic Acid 0.42 0.00 0.00 8.37Water 135.45 2594.50 14.13 2718.26
Design Data: Volume(L): 4,500Working Vol initial (L) : 3274.7 (73%)Working Vol at end(L) : 3164.9 (70%)Height (ft) 9.32Diameter (ft) 4.6Material of Construction: 304 Stainless Steel
Cost, Cpb: $30,700.00
Utilities:Comments:
Seed Fermenter
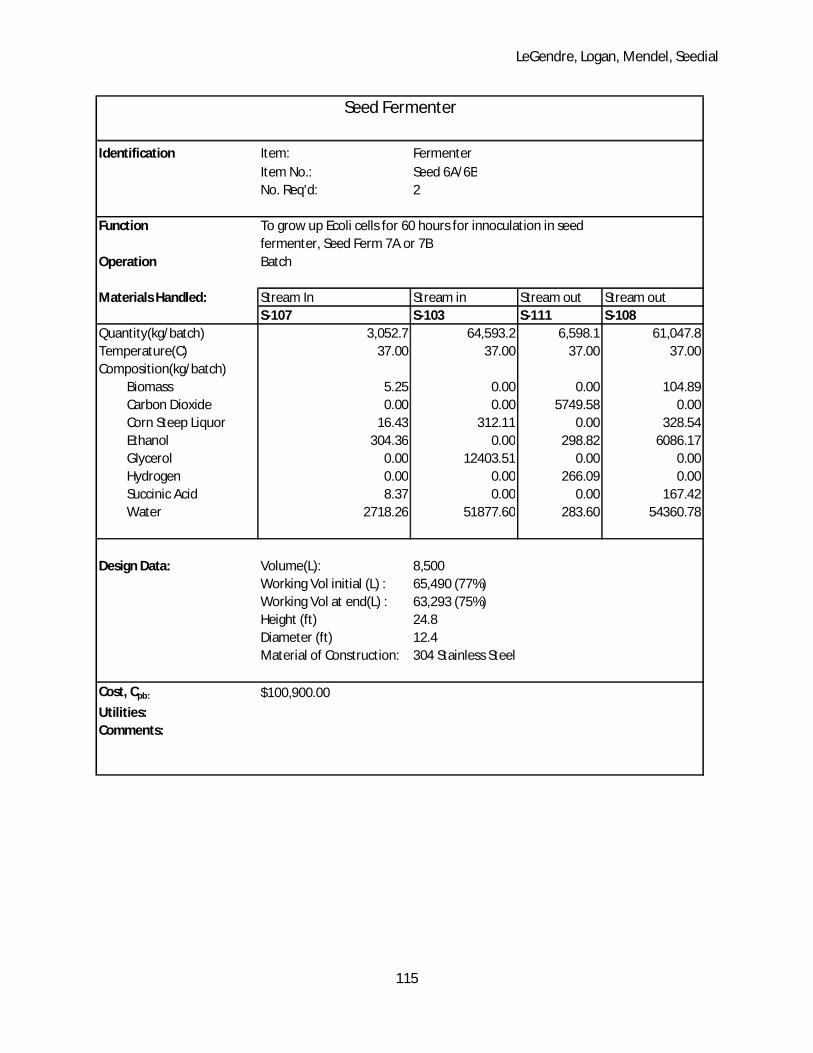
LeGendre, Logan, Mendel, Seedial
115
Identification Item: FermenterItem No.: Seed 6A/6BNo. Req'd: 2
Function To grow up Ecoli cells for 60 hours for innoculation in seed fermenter, Seed Ferm 7A or 7B
Operation Batch
Materials Handled: Stream In Stream in Stream out Stream outS-107 S-103 S-111 S-108
Quantity(kg/batch) 3,052.7 64,593.2 6,598.1 61,047.8Temperature(C) 37.00 37.00 37.00 37.00Composition(kg/batch)
Biomass 5.25 0.00 0.00 104.89Carbon Dioxide 0.00 0.00 5749.58 0.00Corn Steep Liquor 16.43 312.11 0.00 328.54Ethanol 304.36 0.00 298.82 6086.17Glycerol 0.00 12403.51 0.00 0.00Hydrogen 0.00 0.00 266.09 0.00Succinic Acid 8.37 0.00 0.00 167.42Water 2718.26 51877.60 283.60 54360.78
Design Data: Volume(L): 8,500Working Vol initial (L) : 65,490 (77%)Working Vol at end(L) : 63,293 (75%)Height (ft) 24.8Diameter (ft) 12.4Material of Construction: 304 Stainless Steel
Cost, Cpb: $100,900.00
Utilities:Comments:
Seed Fermenter
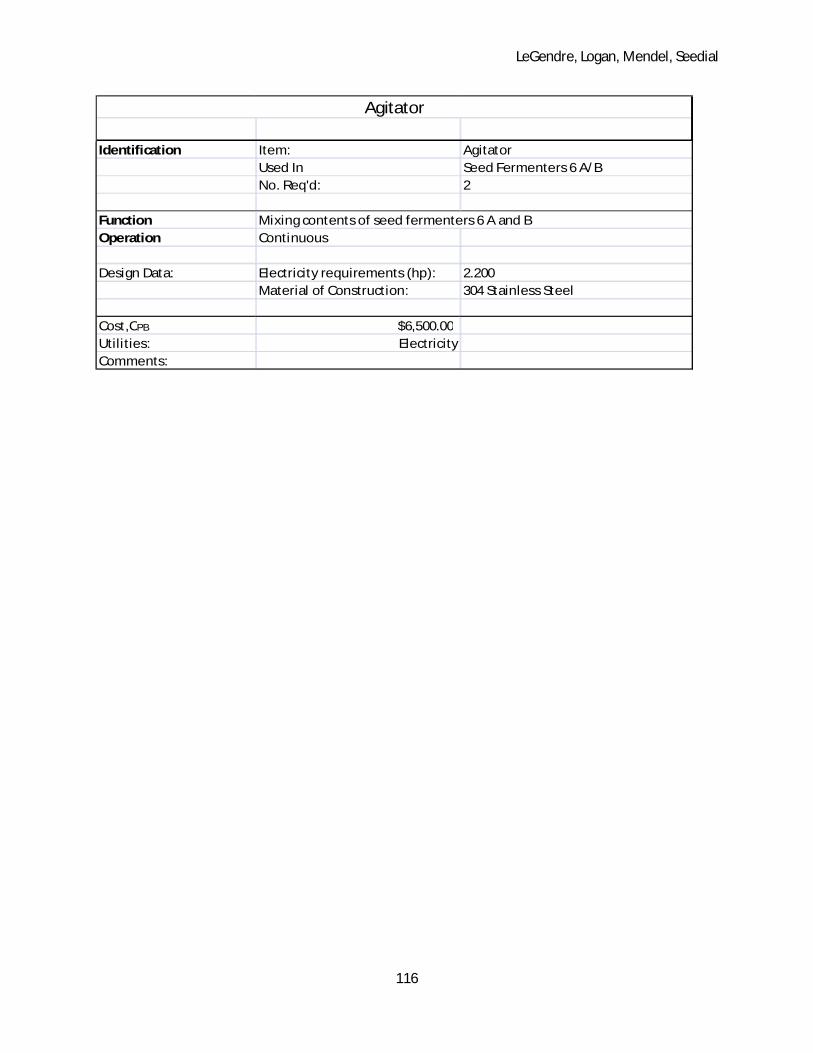
LeGendre, Logan, Mendel, Seedial
116
Identification Item: AgitatorUsed In Seed Fermenters 6 A/BNo. Req'd: 2
FunctionOperation Continuous
Design Data: Electricity requirements (hp): 2.200Material of Construction: 304 Stainless Steel
Cost,CPB $6,500.00Utilities: ElectricityComments:
Agitator
Mixing contents of seed fermenters 6 A and B

LeGendre, Logan, Mendel, Seedial
117
Identification Item: FermenterItem No.: Seed 7A/7BNo. Req'd: 2
Function To grow up Ecoli cells for 60 hours for innoculation in main fermenters, Ferm 1-12
Operation Batch
Materials Handled: Stream In Stream in Stream out Stream outS-108 S-104 S-112 S-114
Quantity(kg/batch) 61,047.8 423,410.3 43,596.3 440,861.8Temperature(C) 37.00 37.00 37.00 37.00Composition(kg/batch)
Biomass 104.89 0.00 0.00 758.06Carbon Dioxide 0.00 0.00 37688.68 0.00Corn Steep Liquor 328.54 2045.92 0.00 2374.46Ethanol 6086.17 0.00 2150.22 43794.61Glycerol 0.00 81305.36 0.00 0.00Hydrogen 0.00 0.00 1744.23 0.00Succinic Acid 167.42 0.00 0.00 1209.97Water 54360.78 340058.99 2013.16 392724.70
Design Data: Volume(L): 650,000Working Vol initial (L) : 471,835(73%)Working Vol at end(L) : 457,030 (70%)Height (ft) 48.9Diameter (ft) 24.4Material of Construction: 304 Stainless Steel
Cost, Cpb: $150,400.00
Utilities:Comments:
Seed Fermenter
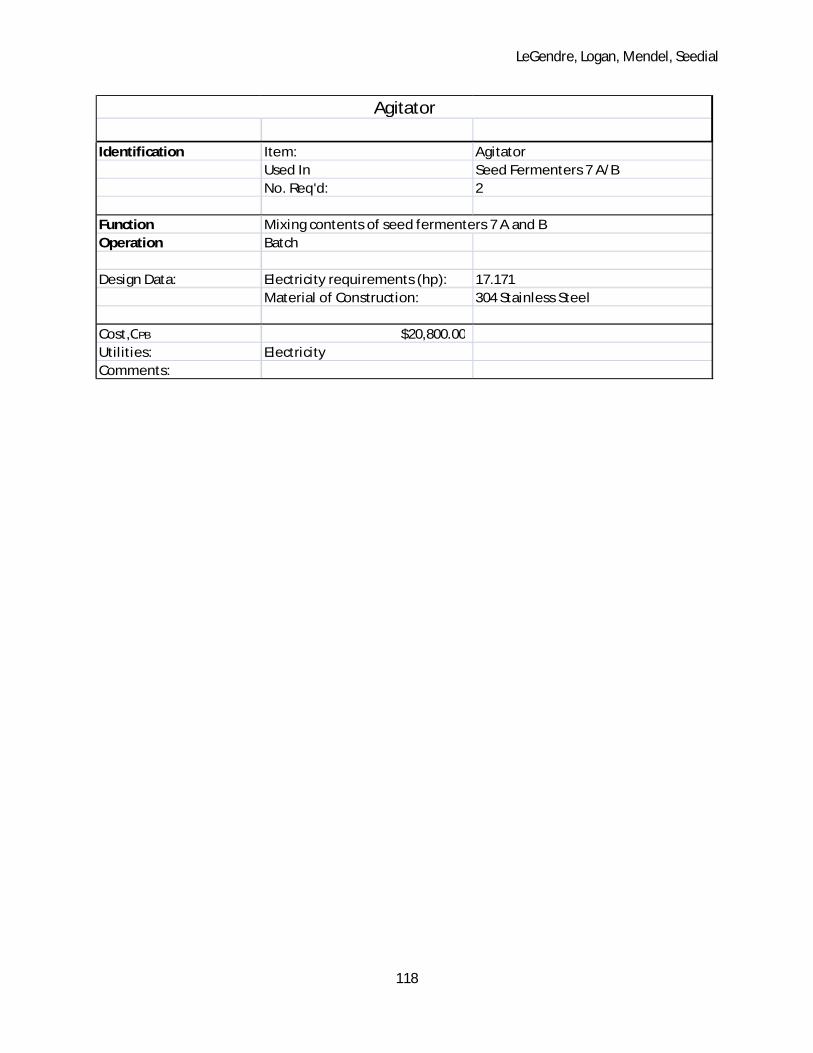
LeGendre, Logan, Mendel, Seedial
118
Identification Item: AgitatorUsed In Seed Fermenters 7 A/BNo. Req'd: 2
FunctionOperation Batch
Design Data: Electricity requirements (hp): 17.171Material of Construction: 304 Stainless Steel
Cost,CPB $20,800.00Utilities: ElectricityComments:
Agitator
Mixing contents of seed fermenters 7 A and B

LeGendre, Logan, Mendel, Seedial
119
Pumps:
Identification Item: PumpItem No.: P-101No. Req'd: 1
Function To move sterilized feed from tank T-106 to either Seed Ferm 4A or 4BOperation Batch
Materials Handled:Feed: S-101 Exit: S-101
Quantity(kg/hr) 2,682.08 2,682.08Temperature(C) 37 37Composition(kg/hr)
Biomass 0.00 0.00Carbon Dioxide 0.00 0.00Corn Steep Liquor 12.96 12.96Ethanol 0.00 0.00Glycerol 515.03 515.03Hydrogen 0.00 0.00Succinic Acid 0.00 0.00Water 2,154.09 2,154.09
Design Data: Density of Fluid (kg/l): 1.03Brake Power (hp): 0.89Pump Head (ft): 59.21Electricity requirements( kW): 0.83Material of Construction: 304 stainless steel
Cost: $3,700.00Utilities: ElectricityComments:
Pump
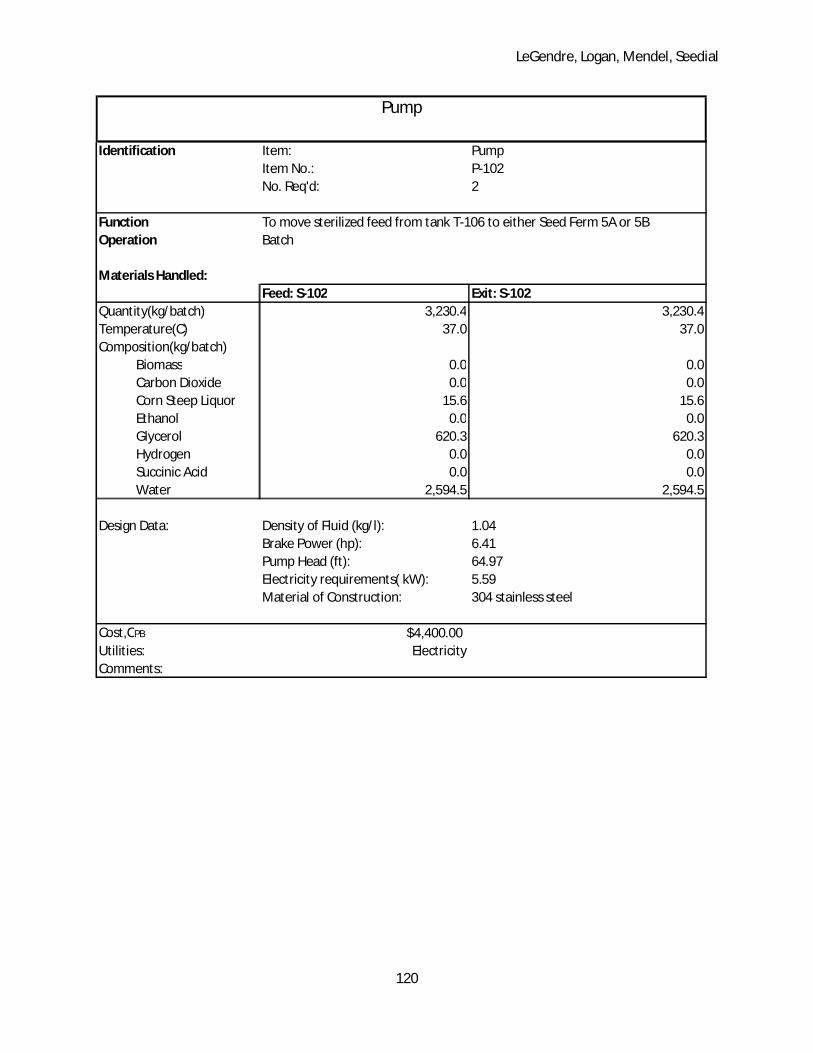
LeGendre, Logan, Mendel, Seedial
120
Identification Item: PumpItem No.: P-102No. Req'd: 2
Function To move sterilized feed from tank T-106 to either Seed Ferm 5A or 5BOperation Batch
Materials Handled:Feed: S-102 Exit: S-102
Quantity(kg/batch) 3,230.4 3,230.4Temperature(C) 37.0 37.0Composition(kg/batch)
Biomass 0.0 0.0Carbon Dioxide 0.0 0.0Corn Steep Liquor 15.6 15.6Ethanol 0.0 0.0Glycerol 620.3 620.3Hydrogen 0.0 0.0Succinic Acid 0.0 0.0Water 2,594.5 2,594.5
Design Data: Density of Fluid (kg/l): 1.04Brake Power (hp): 6.41Pump Head (ft): 64.97Electricity requirements( kW): 5.59Material of Construction: 304 stainless steel
Cost,CPB $4,400.00Utilities: ElectricityComments:
Pump
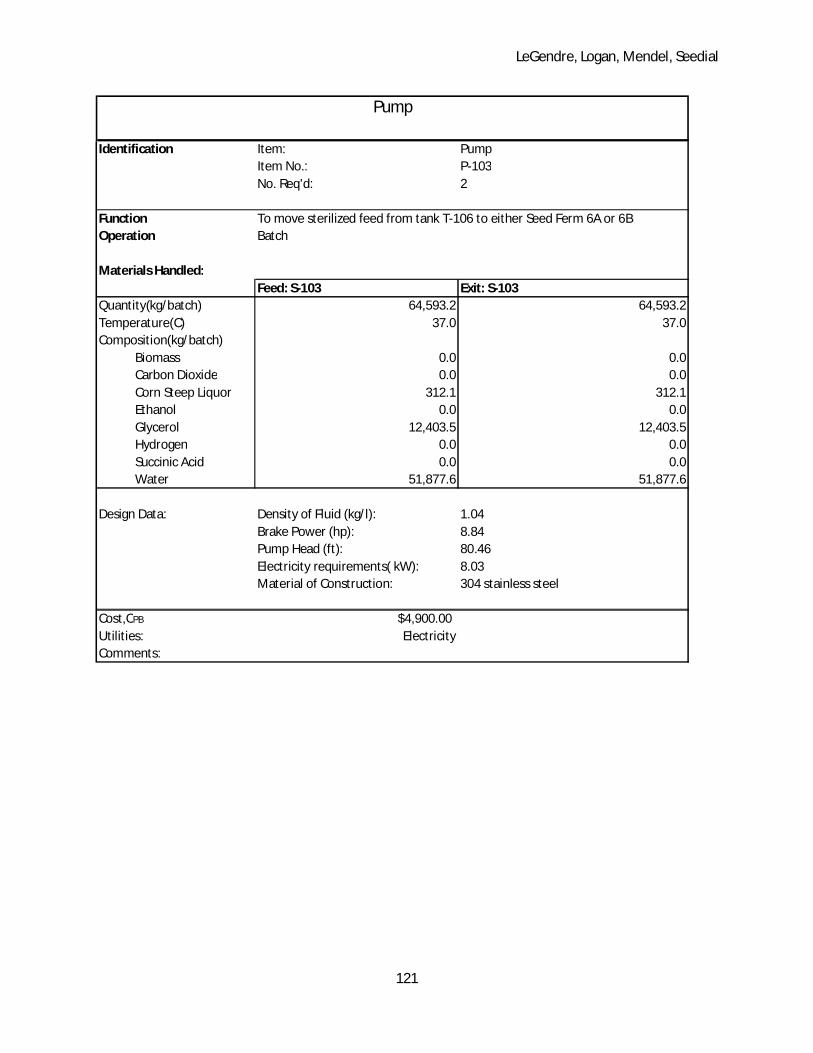
LeGendre, Logan, Mendel, Seedial
121
Identification Item: PumpItem No.: P-103No. Req'd: 2
Function To move sterilized feed from tank T-106 to either Seed Ferm 6A or 6BOperation Batch
Materials Handled:Feed: S-103 Exit: S-103
Quantity(kg/batch) 64,593.2 64,593.2Temperature(C) 37.0 37.0Composition(kg/batch)
Biomass 0.0 0.0Carbon Dioxide 0.0 0.0Corn Steep Liquor 312.1 312.1Ethanol 0.0 0.0Glycerol 12,403.5 12,403.5Hydrogen 0.0 0.0Succinic Acid 0.0 0.0Water 51,877.6 51,877.6
Design Data: Density of Fluid (kg/l): 1.04Brake Power (hp): 8.84Pump Head (ft): 80.46Electricity requirements( kW): 8.03Material of Construction: 304 stainless steel
Cost,CPB $4,900.00Utilities: ElectricityComments:
Pump

LeGendre, Logan, Mendel, Seedial
122
Identification Item: PumpItem No.: P-104No. Req'd: 2
Function To move sterilized feed from tank T-106 to either Seed Ferm 7A or 7BOperation Batch
Materials Handled:Feed: S-104 Exit: S-104
Quantity(kg/batch) 423,410.3 423,410.3Temperature(C) 37.0 37.0Composition(kg/batch)
Biomass 0.0 0.0Carbon Dioxide 0.0 0.0Corn Steep Liquor 2,045.9 2,045.9Ethanol 0.0 0.0Glycerol 81,305.4 81,305.4Hydrogen 0.0 0.0Succinic Acid 0.0 0.0Water 340,059.0 340,059.0
Design Data: Density of Fluid (kg/l): 1.04Brake Power (hp): 16.7Pump Head (ft): 104.53Electricity requirements( kW): 15.10Material of Construction: 304 stainless steel
Cost,CPB $6,400.00Utilities: ElectricityComments:
Pump

LeGendre, Logan, Mendel, Seedial
123
Identification Item: PumpItem No.: P-105No. Req'd: 2
FunctionOperation Batch
Materials Handled:Feed: S-106 Exit: S-106
Quantity(kg/batch) 152.12 152.1Temperature(C) 37.0 37.0Composition(kg/batch)
Biomass 10.667 10.667Carbon Dioxide 0.000 0.000Corn Steep Liquor 8.186 8.186Ethanol 329.217 329.217Glycerol 0.000 0.000Hydrogen 0.000 0.000Succinic Acid 3.533 3.533Water 7518.970 7518.970
Design Data: Density of Fluid (kg/l): 0.965Brake Power (hp): 0.975Pump Head (ft): 69.114Electricity requirements( kW): 0.909Material of Construction: 304 stainless steel
Cost,CPB $3,600.00Utilities: ElectricityComments:
Pump
To move products form seed fermenter 4A or 4B to seed fermenter 5A or 5B

LeGendre, Logan, Mendel, Seedial
124
Identification Item: PumpItem No.: P-106No. Req'd: 2
FunctionOperation Batch
Materials Handled:Feed: S-107 Exit: S-107
Quantity(kg/batch) 3,052.7 3,052.7Temperature(C) 37.0 37.0Composition(kg/batch)
Biomass 5.246 5.246Carbon Dioxide 0.000 0.000Corn Steep Liquor 16.428 16.428Ethanol 304.361 304.361Glycerol 0.000 0.000Hydrogen 0.000 0.000Succinic Acid 8.371 8.371Water 2718.259 2718.259
Design Data: Density of Fluid (kg/l): 0.963Brake Power (hp): 7.600Pump Head (ft): 84.677Electricity requirements( kW): 6.905Material of Construction: 304 stainless steel
Cost,CPB $4,700.00Utilities: ElectricityComments:
Pump
To move products form seed fermenter 5A or 5B to seed fermenter 6A or 6B

LeGendre, Logan, Mendel, Seedial
125
Identification Item: PumpItem No.: P-107No. Req'd: 2
FunctionOperation Batch
Materials Handled:Feed: S-108 Exit: S-108
Quantity(kg/batch) 61,047.8 61,047.8Temperature(C) 37.0 37.0Composition(kg/batch)
Biomass 104.891 104.891Carbon Dioxide 0.000 0.000Corn Steep Liquor 328.543 328.543Ethanol 6086.169 6086.169Glycerol 0.000 0.000Hydrogen 0.000 0.000Succinic Acid 167.417 167.417Water 54360.776 54360.776
Design Data: Density of Fluid (kg/l): 0.965Brake Power (hp): 11.262Pump Head (ft): 108.681Electricity requirements( kW): 10.204Material of Construction: 304 stainless steel
Cost,CPB $5,300.00Utilities:Comments:
Pump
To move products form seed fermenter 5A or 5B to seed fermenter 6A or 6B

LeGendre, Logan, Mendel, Seedial
126
Main Fermentation Section:
Fermenters:
Identification Item: FermenterItem No.: Ferm 1-Ferm 12No. Req'd: 12
Function To produce ethanol through fermentation of glycerol in 60 hours .Operation Batch
Materials Handled: Stream In Stream in Stream out Stream outSterilized Feed Prod of Seed Ferm Broth Vapor
Quantity(kg/batch) 1,556,144.8 73,447.6 1,471,321.3 158,271.2Temperature(C) 37.00 37.00 37.00 37.00Composition(kg/batch)
Biomass 0.00 126.29 2526.88 0.00Carbon Dioxide 0.00 0.00 0.00 138515.88Corn Steep Liquor 7519.29 395.59 7914.88 0.00Ethanol 0.00 7296.18 146590.06 7197.25Glycerol 298818.71 0.00 0.00 0.00Hydrogen 0.00 0.00 0.00 6410.52Succinic Acid 0.00 201.58 4033.23 0.00Water 1249806.82 65427.93 1310256.21 6147.61
Design Data: Volume(L): 341,500Working Vol initial (L) : 1,577,642 (79%)Working Vol at end(L) : 1,525,404 (76%)Height (ft) 71.1Diameter (ft) 35Material of Construction: 304 Stainless Steel
Cost, Cpb: $341,500.00
Utilities:Comments:
Main Fermenter

LeGendre, Logan, Mendel, Seedial
127
Identification Item: AgitatorUsed In Fermenters 1-12No. Req'd: 12
FunctionOperation Continuous
Design Data: Electricity requirements (hp): 20.000Material of Construction: 304 Stainless Steel
Cost,CPB $44,200.00Utilities: ElectricityComments:
Agitator
Denaturing ethanol with gasoline

LeGendre, Logan, Mendel, Seedial
128
Storage Tanks:
Identification Item: Holding TankItem No.: T-107No. Req'd: 1
Function To hold the product after the Main fermentation ProcessOperation Batch
Materials Handled:Flow In
Quantity(kg/batch) 1,471,321.3Temperature(C) 37.0Composition(kg/batch)
Biomass 2,526.88Carbon Dioxide 0.00Corn Steep Liquor 7,914.88Ethanol 146,590.06Glycerol 0.00Hydrogen 0.00Succinic Acid 4,033.23Water 1,310,256.21
Design Data: Volume (L) 3,370,526.00Working Volume 0.80Diameter (ft) 76.90Height (ft) 25.6Model Floating RoofMaterial of Construction: 304 stainless steel
Cost,CPB $582,900.00Utilities:Comments:
Holding Tank

LeGendre, Logan, Mendel, Seedial
129
Identification Item: AgitatorUsed In Storage Tank 107No. Req'd: 1
FunctionOperation Continuous
Design Data: Electricity requirements (hp): 20.000Material of Construction: 304 Stainless Steel
Cost,CPB $44,200.00Utilities: ElectricityComments:
Agitator
Stir contents of broth storage tank

LeGendre, Logan, Mendel, Seedial
130
Heat Exchangers:
Identification Item: Heat ExchangerItem No.: HX-FERMNo. Req'd: 12
Function To cool the contents of each 2,000,000 L fermentation tanksOperation Continuous
Materials Handled:Stream In Stream out Stream in Stream outS-143 S-FP-144 S-141 S-142
Quantity(kg/hr) 22,063.0 22,063.0 24,522.0 24,523.0Temperature(C) 31.44 36.60 42.72 37.00Composition(kg/hr) Biomass 0.00 0.00 42.11 42.11Carbon Dioxide 0.00 0.00 0.00 1.00Corn Steep Liquor 0.00 0.00 131.91 131.91Ethanol 0.00 0.00 2443.17 2443.17Glycerol 0.00 0.00 0.00 0.00Hydrogen 0.00 0.00 0.00 0.00Succinic Acid 0.00 0.00 67.22 67.22Water 22063.00 22063.00 21837.60 21837.60
Design Data:Heat Duty(BTU) 518,300.0
Overall Heat Coefficient (BTU/hr-ft2°F) 250.0
Heat Transfer Area (ft2) 197.6Type Double PipeMaterials of Construction
Shell: Tube:carbon steel 304 Stainless steel
Cost,CPB $4,200.00Utilities: A mixture of 95% cooling water is used in the shellComments: 5% chilled water
Shell Side Tube Side
Heat Exchanger
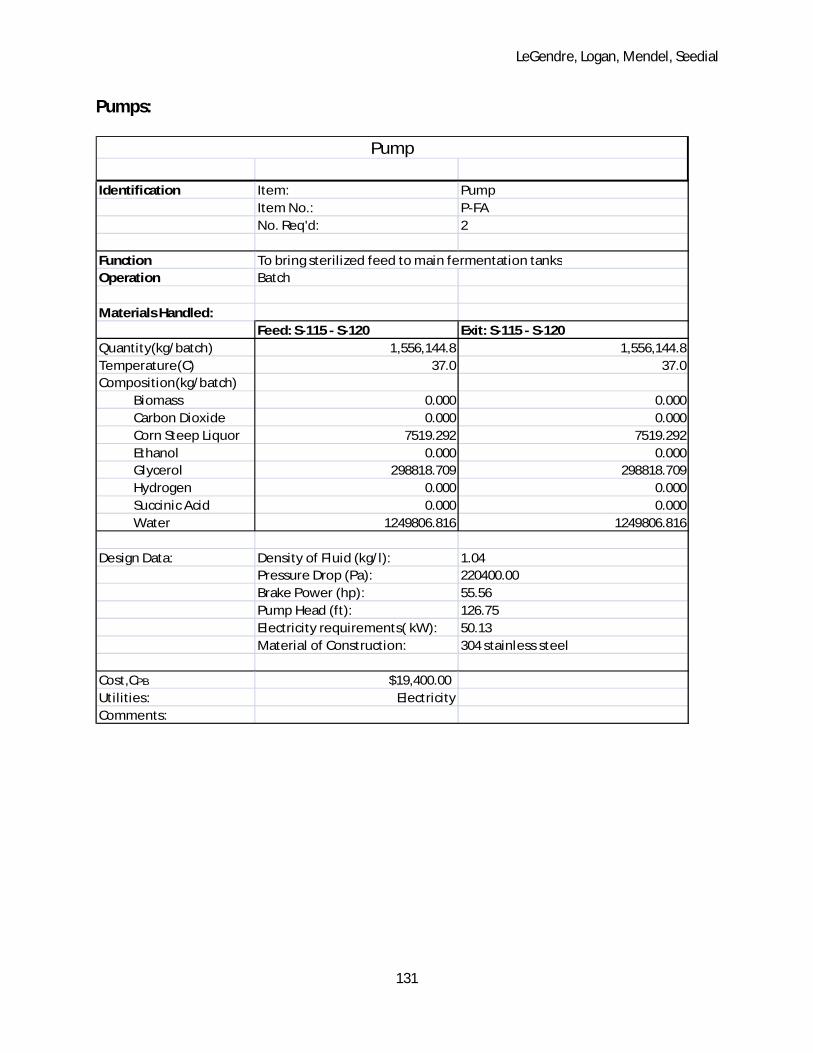
LeGendre, Logan, Mendel, Seedial
131
Pumps:
Identification Item: PumpItem No.: P-FANo. Req'd: 2
FunctionOperation Batch
Materials Handled:Feed: S-115 - S-120 Exit: S-115 - S-120
Quantity(kg/batch) 1,556,144.8 1,556,144.8Temperature(C) 37.0 37.0Composition(kg/batch)
Biomass 0.000 0.000Carbon Dioxide 0.000 0.000Corn Steep Liquor 7519.292 7519.292Ethanol 0.000 0.000Glycerol 298818.709 298818.709Hydrogen 0.000 0.000Succinic Acid 0.000 0.000Water 1249806.816 1249806.816
Design Data: Density of Fluid (kg/l): 1.04Pressure Drop (Pa): 220400.00Brake Power (hp): 55.56Pump Head (ft): 126.75Electricity requirements( kW): 50.13Material of Construction: 304 stainless steel
Cost,CPB $19,400.00Utilities: ElectricityComments:
Pump
To bring sterilized feed to main fermentation tanks
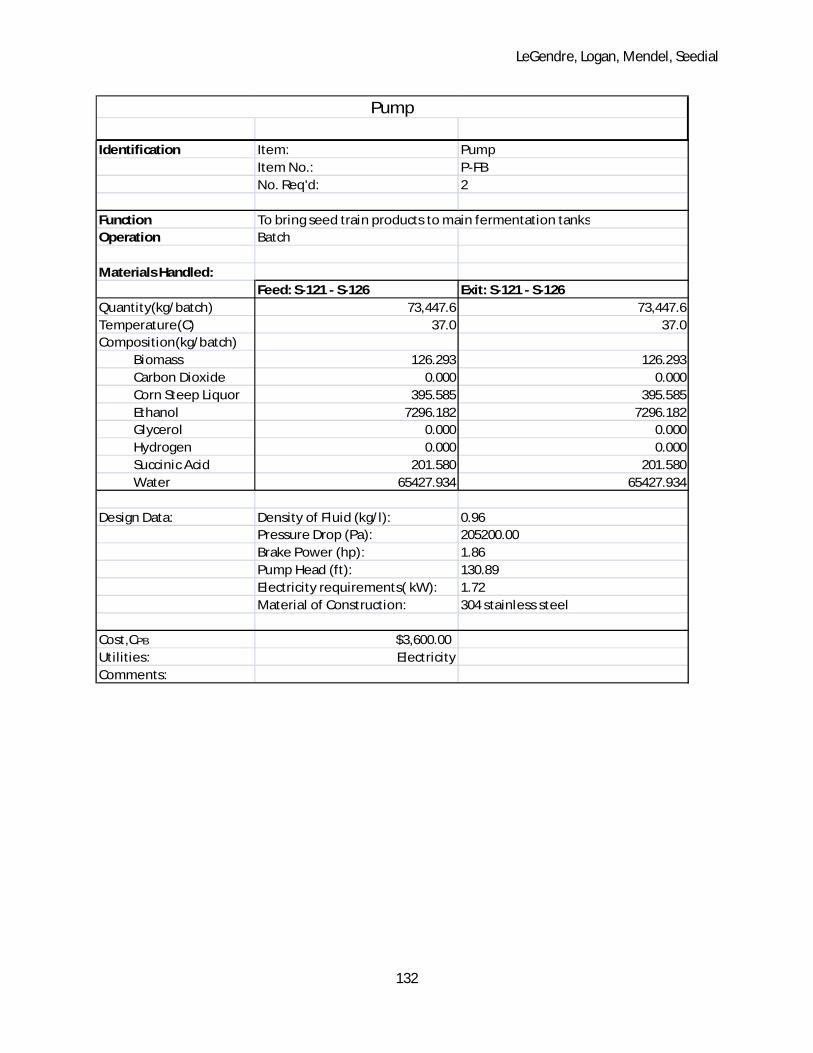
LeGendre, Logan, Mendel, Seedial
132
Identification Item: PumpItem No.: P-FBNo. Req'd: 2
FunctionOperation Batch
Materials Handled:Feed: S-121 - S-126 Exit: S-121 - S-126
Quantity(kg/batch) 73,447.6 73,447.6Temperature(C) 37.0 37.0Composition(kg/batch)
Biomass 126.293 126.293Carbon Dioxide 0.000 0.000Corn Steep Liquor 395.585 395.585Ethanol 7296.182 7296.182Glycerol 0.000 0.000Hydrogen 0.000 0.000Succinic Acid 201.580 201.580Water 65427.934 65427.934
Design Data: Density of Fluid (kg/l): 0.96Pressure Drop (Pa): 205200.00Brake Power (hp): 1.86Pump Head (ft): 130.89Electricity requirements( kW): 1.72Material of Construction: 304 stainless steel
Cost,CPB $3,600.00Utilities: ElectricityComments:
Pump
To bring seed train products to main fermentation tanks

LeGendre, Logan, Mendel, Seedial
133
Identification Item: PumpItem No.: P-FCNo. Req'd: 2
FunctionOperation Batch
Materials Handled:Feed: S-132 - S-137 Exit: S-132 - S-137
Quantity(kg/batch) 1,471,321.3 1,471,321.3Temperature(C) 37.0 37.0Composition(kg/batch)
Biomass 2526.879 2526.879Carbon Dioxide 0.000 0.000Corn Steep Liquor 7914.877 7914.877Ethanol 146590.059 146590.059Glycerol 0.000 0.000Hydrogen 0.000 0.000Succinic Acid 4033.232 4033.232Water 1310256.215 1310256.215
Design Data: Density of Fluid (kg/l): 0.96Pressure Drop (Pa): 73900.00Brake Power (hp): 35.35Pump Head (ft): 85.41Electricity requirements( kW): 31.89Material of Construction: 304 stainless steel
Cost,CPB $15,700.00Utilities: ElectricityComments:
Pump
To bring main fermentation tank products to broth storage tank

LeGendre, Logan, Mendel, Seedial
134
Identification Item: PumpItem No.: P-FDNo. Req'd: 1
FunctionOperation Continuous
Materials Handled:Feed: S-140 Exit: S-140
Quantity(kg/hr) 172,397.2 172,397.2Temperature(C) 37.0 37.0Composition(kg/hr)
Biomass 296.079 296.079Carbon Dioxide 0.000 0.000Corn Steep Liquor 927.400 927.400Ethanol 17176.209 17176.209Glycerol 0.000 0.000Hydrogen 0.000 0.000Succinic Acid 472.581 472.581Water 153524.971 153524.971
Design Data: Density of Fluid (kg/l): 0.96Pressure Drop (Pa): 205200.00Brake Power (hp): 30.52Pump Head (ft): 119.59Electricity requirements( kW): 27.55Material of Construction: 304 stainless steel
Cost,CPB $9,000.00Utilities: ElectricityComments:
Pump
To bring broth from broth storage tank to separations section

LeGendre, Logan, Mendel, Seedial
135
Identification Item: PumpItem No.: P-FENo. Req'd: 12
FunctionOperation Continuous
Materials Handled:Feed: S-141 Exit: S-141
Quantity(kg/hr) 24522.02 24,522.0Temperature(C) 37.0 37.0Composition(kg/hr)
Biomass 42.115 42.115Carbon Dioxide 0.000 0.000Corn Steep Liquor 131.915 131.915Ethanol 2443.168 2443.168Glycerol 0.000 0.000Hydrogen 0.000 0.000Succinic Acid 67.221 67.221Water 21837.604 21837.604
Design Data: Density of Fluid (kg/l): 0.96Pressure Drop (Pa): 205200.00Brake Power (hp): 2.97Pump Head (ft): 59.80Electricity requirements( kW): 32.66Material of Construction: 304 stainless steel
Cost,CPB $6,600.00Utilities: ElectricityComments:
Pump
To bring main fermenter contents through heat exchanger
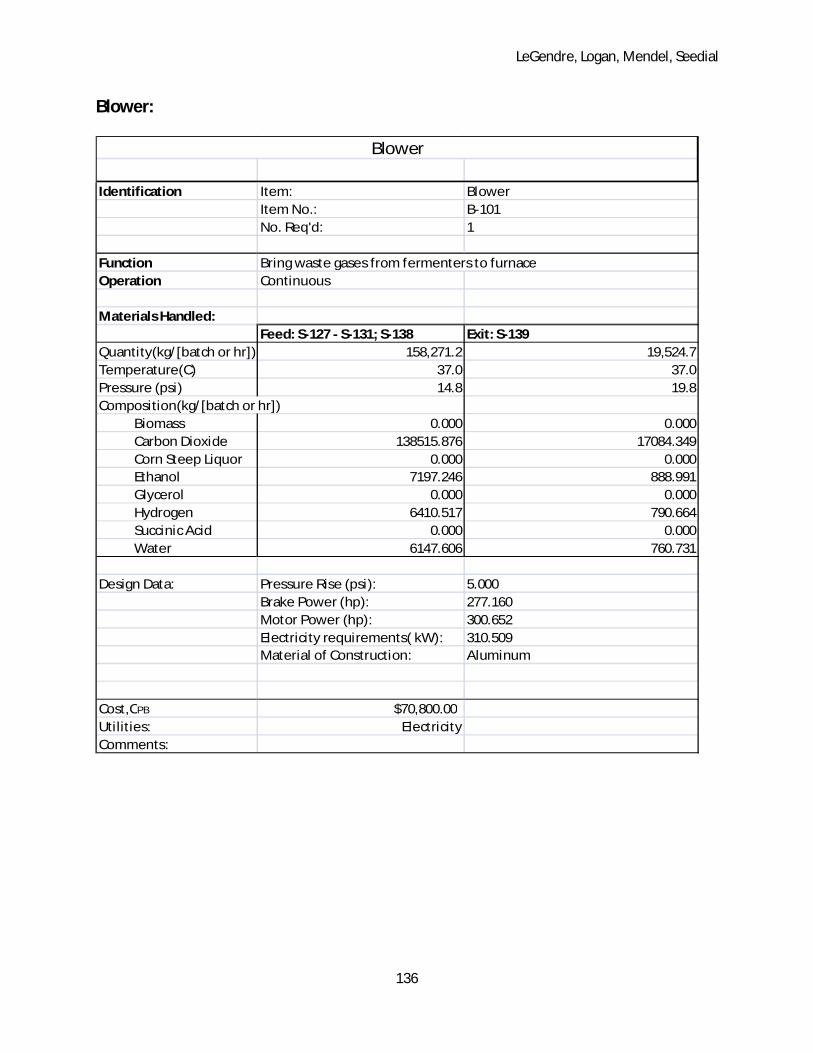
LeGendre, Logan, Mendel, Seedial
136
Blower:
Identification Item: BlowerItem No.: B-101No. Req'd: 1
FunctionOperation Continuous
Materials Handled:Feed: S-127 - S-131; S-138 Exit: S-139
Quantity(kg/[batch or hr]) 158,271.2 19,524.7Temperature(C) 37.0 37.0Pressure (psi) 14.8 19.8Composition(kg/[batch or hr])
Biomass 0.000 0.000Carbon Dioxide 138515.876 17084.349Corn Steep Liquor 0.000 0.000Ethanol 7197.246 888.991Glycerol 0.000 0.000Hydrogen 6410.517 790.664Succinic Acid 0.000 0.000Water 6147.606 760.731
Design Data: Pressure Rise (psi): 5.000Brake Power (hp): 277.160Motor Power (hp): 300.652Electricity requirements( kW): 310.509Material of Construction: Aluminum
Cost,CPB $70,800.00Utilities: ElectricityComments:
Blower
Bring waste gases from fermenters to furnace
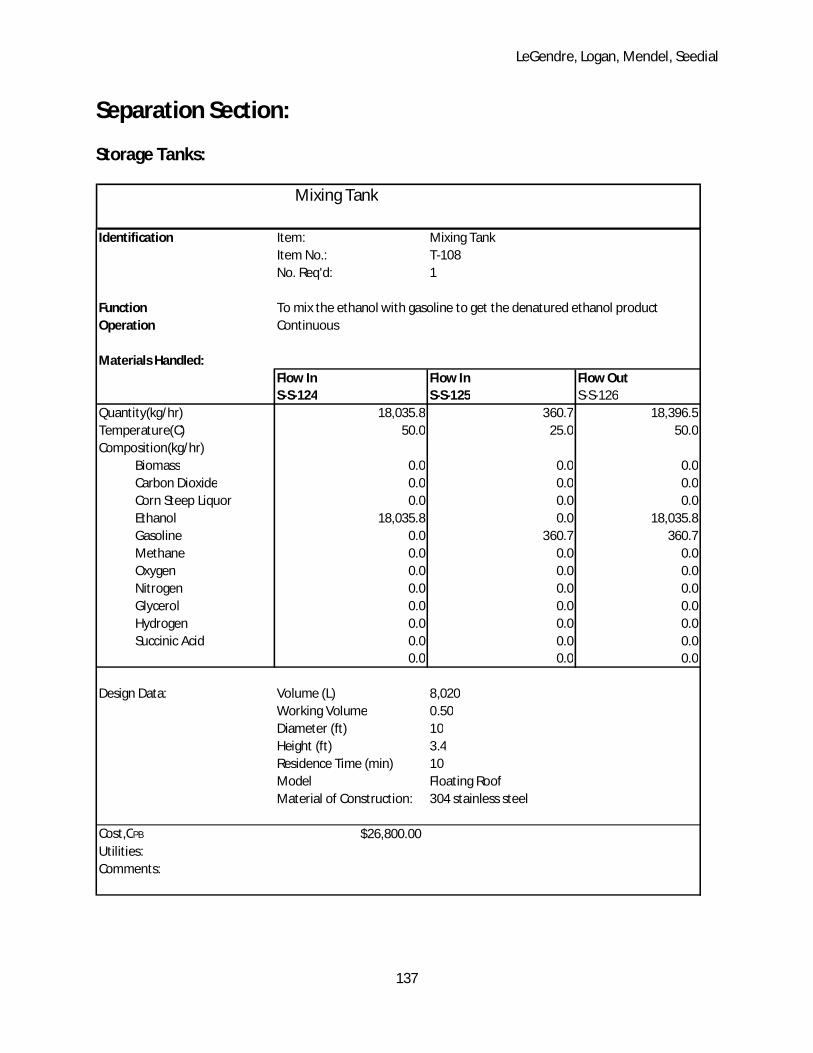
LeGendre, Logan, Mendel, Seedial
137
Separation Section:
Storage Tanks:
Identification Item: Mixing TankItem No.: T-108No. Req'd: 1
Function To mix the ethanol with gasoline to get the denatured ethanol productOperation Continuous
Materials Handled:Flow In Flow In Flow OutS-S-124 S-S-125 S-S-126
Quantity(kg/hr) 18,035.8 360.7 18,396.5Temperature(C) 50.0 25.0 50.0Composition(kg/hr)
Biomass 0.0 0.0 0.0Carbon Dioxide 0.0 0.0 0.0Corn Steep Liquor 0.0 0.0 0.0Ethanol 18,035.8 0.0 18,035.8Gasoline 0.0 360.7 360.7Methane 0.0 0.0 0.0Oxygen 0.0 0.0 0.0Nitrogen 0.0 0.0 0.0Glycerol 0.0 0.0 0.0Hydrogen 0.0 0.0 0.0Succinic Acid 0.0 0.0 0.0
0.0 0.0 0.0
Design Data: Volume (L) 8,020Working Volume 0.50Diameter (ft) 10Height (ft) 3.4Residence Time (min) 10Model Floating RoofMaterial of Construction: 304 stainless steel
Cost,CPB $26,800.00Utilities:Comments:
Mixing Tank
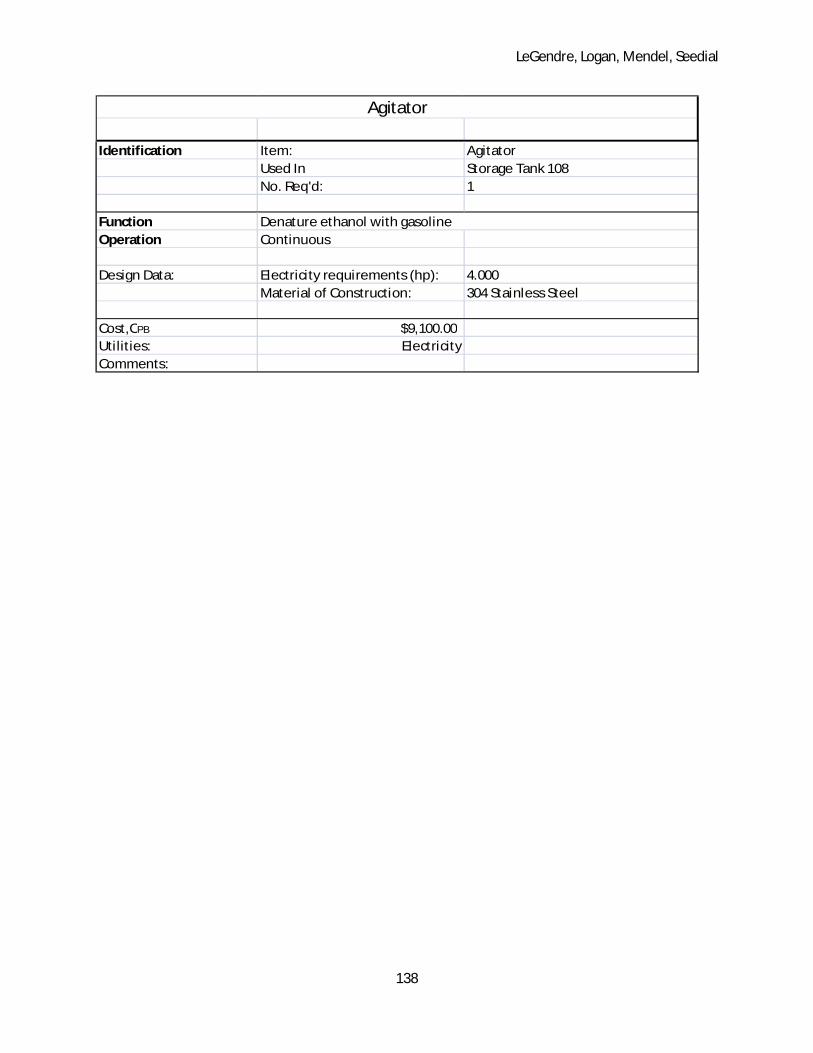
LeGendre, Logan, Mendel, Seedial
138
Identification Item: AgitatorUsed In Storage Tank 108No. Req'd: 1
FunctionOperation Continuous
Design Data: Electricity requirements (hp): 4.000Material of Construction: 304 Stainless Steel
Cost,CPB $9,100.00Utilities: ElectricityComments:
Agitator
Denature ethanol with gasoline

LeGendre, Logan, Mendel, Seedial
139
Identification Item: Holding TankItem No.: T-109No. Req'd: 1
Function To hold 3 days worth of GasolineOperation Continuous
Materials Handled:Stream out- S-S-125
Quantity(kg/hr) 360.7Temperature(C) 37.0Composition(kg/hr)
Biomass 0.0Carbon Dioxide 0.0Corn Steep Liquor 0.0Ethanol 0.0Glycerol 0.0Hydrogen 0.0Succinic Acid 0.0Water 0.0
Gasoline 360.72
Design Data: Volume (L) 108,300.00Working Volume 0.80Diameter (ft) 24.59Height (ft) 8.20Model Cone RoofMaterial of Construction: 304 stainless steel
Cost,CPB $101,000.00Utilities:Comments:
Holding Tank
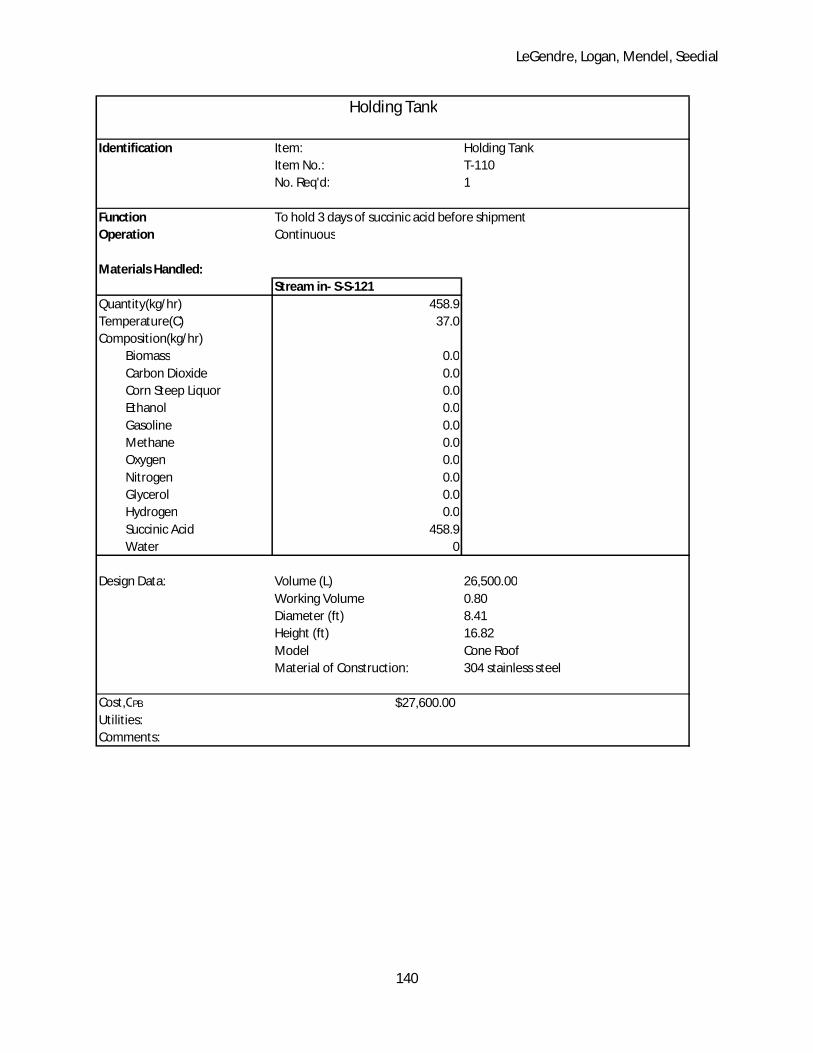
LeGendre, Logan, Mendel, Seedial
140
Identification Item: Holding TankItem No.: T-110No. Req'd: 1
Function To hold 3 days of succinic acid before shipmentOperation Continuous
Materials Handled:Stream in- S-S-121
Quantity(kg/hr) 458.9Temperature(C) 37.0Composition(kg/hr)
Biomass 0.0Carbon Dioxide 0.0Corn Steep Liquor 0.0Ethanol 0.0Gasoline 0.0Methane 0.0Oxygen 0.0Nitrogen 0.0Glycerol 0.0Hydrogen 0.0Succinic Acid 458.9Water 0
Design Data: Volume (L) 26,500.00Working Volume 0.80Diameter (ft) 8.41Height (ft) 16.82Model Cone RoofMaterial of Construction: 304 stainless steel
Cost,CPB $27,600.00Utilities:Comments:
Holding Tank
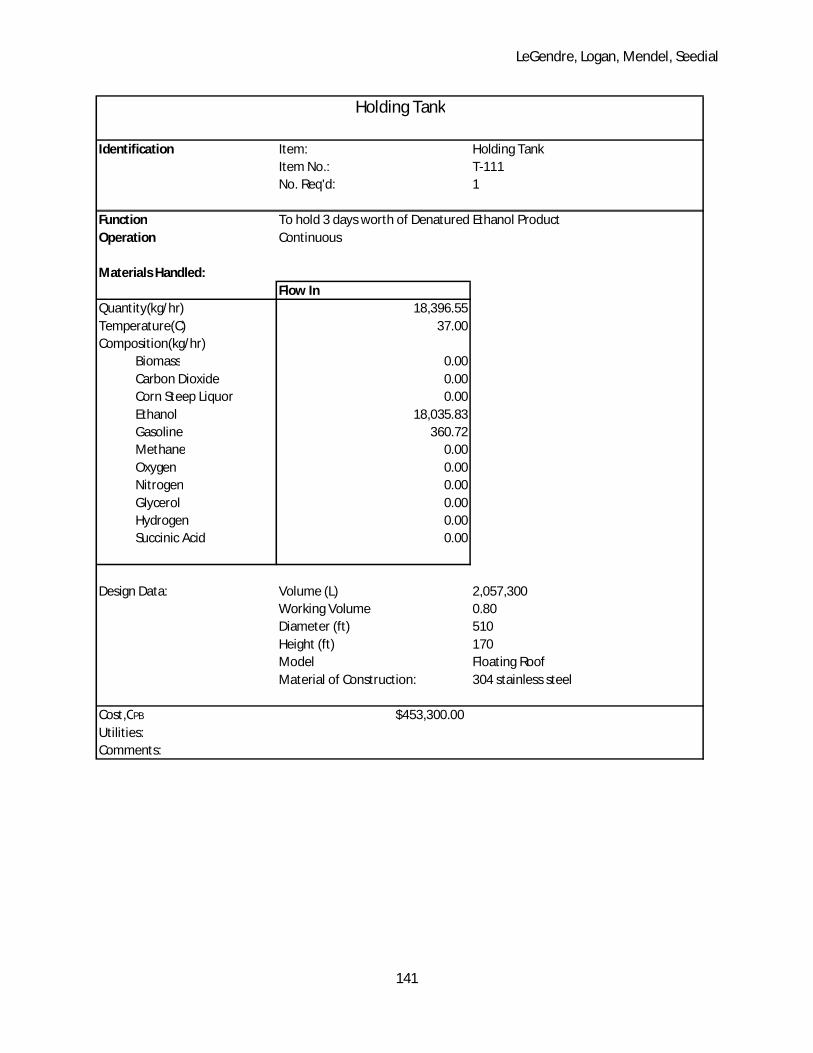
LeGendre, Logan, Mendel, Seedial
141
Identification Item: Holding TankItem No.: T-111No. Req'd: 1
Function To hold 3 days worth of Denatured Ethanol ProductOperation Continuous
Materials Handled:Flow In
Quantity(kg/hr) 18,396.55Temperature(C) 37.00Composition(kg/hr)
Biomass 0.00Carbon Dioxide 0.00Corn Steep Liquor 0.00Ethanol 18,035.83Gasoline 360.72Methane 0.00Oxygen 0.00Nitrogen 0.00Glycerol 0.00Hydrogen 0.00Succinic Acid 0.00
Design Data: Volume (L) 2,057,300Working Volume 0.80Diameter (ft) 510Height (ft) 170Model Floating RoofMaterial of Construction: 304 stainless steel
Cost,CPB $453,300.00Utilities:Comments:
Holding Tank
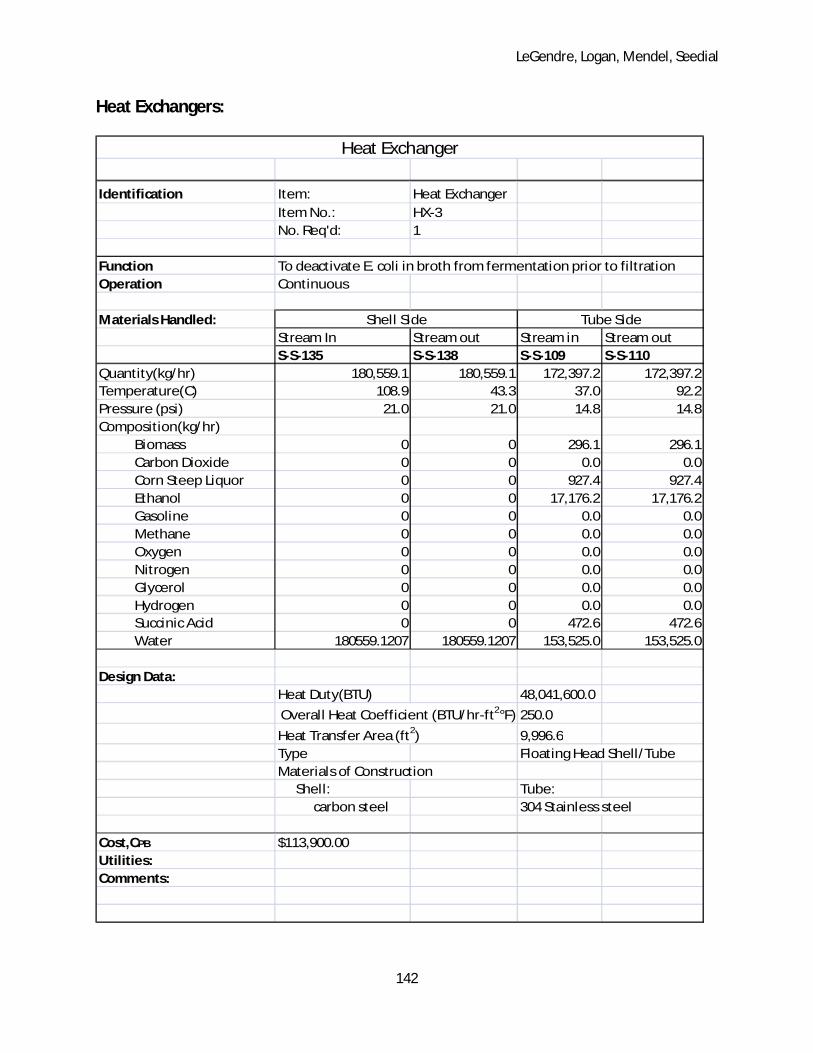
LeGendre, Logan, Mendel, Seedial
142
Heat Exchangers:
Identification Item: Heat ExchangerItem No.: HX-3No. Req'd: 1
Function To deactivate E. coli in broth from fermentation prior to filtrationOperation Continuous
Materials Handled:Stream In Stream out Stream in Stream outS-S-135 S-S-138 S-S-109 S-S-110
Quantity(kg/hr) 180,559.1 180,559.1 172,397.2 172,397.2Temperature(C) 108.9 43.3 37.0 92.2Pressure (psi) 21.0 21.0 14.8 14.8Composition(kg/hr)
Biomass 0 0 296.1 296.1Carbon Dioxide 0 0 0.0 0.0Corn Steep Liquor 0 0 927.4 927.4Ethanol 0 0 17,176.2 17,176.2Gasoline 0 0 0.0 0.0Methane 0 0 0.0 0.0Oxygen 0 0 0.0 0.0Nitrogen 0 0 0.0 0.0Glycerol 0 0 0.0 0.0Hydrogen 0 0 0.0 0.0Succinic Acid 0 0 472.6 472.6Water 180559.1207 180559.1207 153,525.0 153,525.0
Design Data:Heat Duty(BTU) 48,041,600.0
Overall Heat Coefficient (BTU/hr-ft2°F) 250.0
Heat Transfer Area (ft2) 9,996.6Type Floating Head Shell/TubeMaterials of Construction
Shell: Tube:carbon steel 304 Stainless steel
Cost,CPB $113,900.00Utilities:Comments:
Shell Side Tube Side
Heat Exchanger

LeGendre, Logan, Mendel, Seedial
143
Identification Item: Heat ExchangerItem No.: HX-4No. Req'd: 1
Function Partial condenser for Distillation ColumnOperation Continuous
Materials Handled:Stream In Stream out Stream in Stream outS-S-105 S-S-106 S-S-130 S-S-129
Quantity(kg/hr) 1,087,869.8 1,087,869.8 172,397.2 172,397.2Temperature(C) 32.2 48.9 82.0 82.0Pressure (psi) 25.0 20.0 17.0 17.0Composition(kg/hr)
Biomass 0 0 0.0 0.0Carbon Dioxide 0 0 0.0 0.0Corn Steep Liquor 0 0 0.0 0.0Ethanol 0 0 174,279.2 174,279.2Gasoline 0 0 0.0 0.0Methane 0 0 0.0 0.0Oxygen 0 0 0.0 0.0Nitrogen 0 0 0.0 0.0Glycerol 0 0 0.0 0.0Hydrogen 0 0 0.0 0.0Succinic Acid 0 0 0.0 0.0Water 1087869.823 1087869.823 15,394.0 15,394.0
Design Data:Heat Duty(BTU) 68,130,000
Overall Heat Coefficient (BTU/hr-ft2°F) 200.0
Heat Transfer Area (ft2) 4,635.8Type Floating Head Shell/TubeMaterials of Construction
Shell: Tube:carbon steel 304 Stainless steel
Cost,CPB $65,900.00Utilities: 1087870 l/hr cooling waterComments:
Shell Side Tube Side
Heat Exchanger

LeGendre, Logan, Mendel, Seedial
144
Identification Item: Heat ExchangerItem No.: HX-5No. Req'd: 1
Function Cooling ethanol productOperation Continuous
Materials Handled:Stream In Stream out Stream in Stream outS-S-136 S-S-137 S-S-122 S-S-124
Quantity(kg/hr) 23,766.1 23,766.1 18,035.8 18,035.8Temperature(C) 32.2 48.9 78.4 50.0Composition(kg/hr)
Biomass 0 0 0.0 0.0Carbon Dioxide 0 0 0.0 0.0Corn Steep Liquor 0 0 0.0 0.0Ethanol 0 0 18,035.8 18,035.8Gasoline 0 0 0.0 0.0Methane 0 0 0.0 0.0Oxygen 0 0 0.0 0.0Nitrogen 0 0 0.0 0.0Glycerol 0 0 0.0 0.0Hydrogen 0 0 0.0 0.0Succinic Acid 0 0 0.0 0.0Water 23766.1086 23766.1086 0.0 0.0
Design Data:Heat Duty(BTU) 1,488,800
Overall Heat Coefficient (BTU/hr-ft2°F) 150.0
Heat Transfer Area (ft2) 238.2Type Floating Head Shell/TubeMaterials of Construction
Shell: Tube:carbon steel 304 Stainless steel
Cost,CPB $21,200.00Utilities: 23766.11 l/hr cooling waterComments:
Shell Side Tube Side
Heat Exchanger
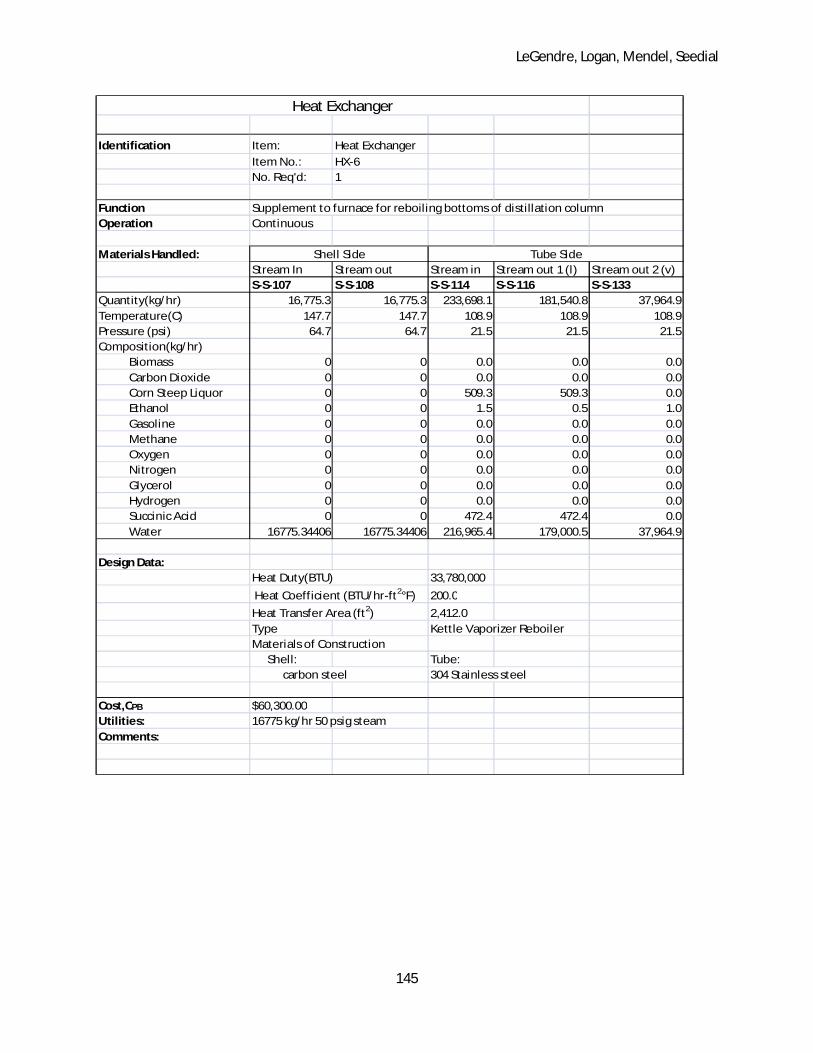
LeGendre, Logan, Mendel, Seedial
145
Identification Item: Heat ExchangerItem No.: HX-6No. Req'd: 1
Function Supplement to furnace for reboiling bottoms of distillation columnOperation Continuous
Materials Handled:Stream In Stream out Stream in Stream out 1 (l) Stream out 2 (v)S-S-107 S-S-108 S-S-114 S-S-116 S-S-133
Quantity(kg/hr) 16,775.3 16,775.3 233,698.1 181,540.8 37,964.9Temperature(C) 147.7 147.7 108.9 108.9 108.9Pressure (psi) 64.7 64.7 21.5 21.5 21.5Composition(kg/hr)
Biomass 0 0 0.0 0.0 0.0Carbon Dioxide 0 0 0.0 0.0 0.0Corn Steep Liquor 0 0 509.3 509.3 0.0Ethanol 0 0 1.5 0.5 1.0Gasoline 0 0 0.0 0.0 0.0Methane 0 0 0.0 0.0 0.0Oxygen 0 0 0.0 0.0 0.0Nitrogen 0 0 0.0 0.0 0.0Glycerol 0 0 0.0 0.0 0.0Hydrogen 0 0 0.0 0.0 0.0Succinic Acid 0 0 472.4 472.4 0.0Water 16775.34406 16775.34406 216,965.4 179,000.5 37,964.9
Design Data:Heat Duty(BTU) 33,780,000
Heat Coefficient (BTU/hr-ft2°F) 200.0
Heat Transfer Area (ft2) 2,412.0Type Kettle Vaporizer ReboilerMaterials of Construction
Shell: Tube:carbon steel 304 Stainless steel
Cost,CPB $60,300.00Utilities: 16775 kg/hr 50 psig steamComments:
Shell Side
Heat Exchanger
Tube Side
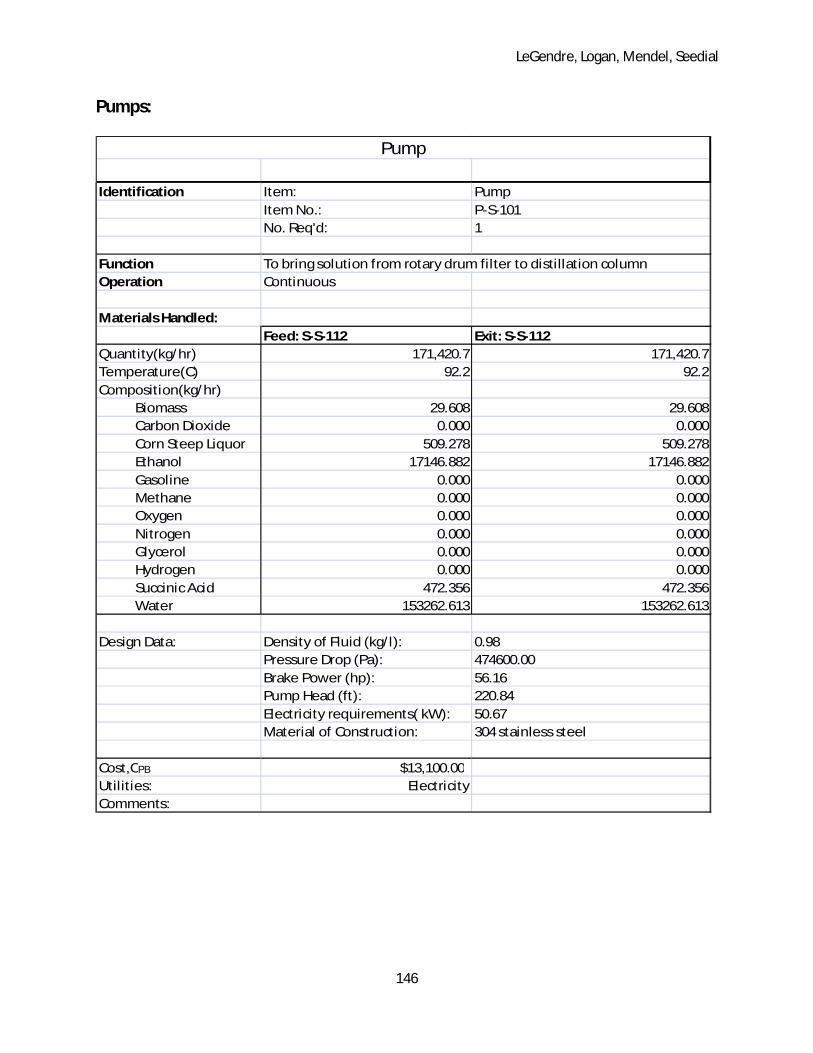
LeGendre, Logan, Mendel, Seedial
146
Pumps:
Identification Item: PumpItem No.: P-S-101No. Req'd: 1
FunctionOperation Continuous
Materials Handled:Feed: S-S-112 Exit: S-S-112
Quantity(kg/hr) 171,420.7 171,420.7Temperature(C) 92.2 92.2Composition(kg/hr)
Biomass 29.608 29.608Carbon Dioxide 0.000 0.000Corn Steep Liquor 509.278 509.278Ethanol 17146.882 17146.882Gasoline 0.000 0.000Methane 0.000 0.000Oxygen 0.000 0.000Nitrogen 0.000 0.000Glycerol 0.000 0.000Hydrogen 0.000 0.000Succinic Acid 472.356 472.356Water 153262.613 153262.613
Design Data: Density of Fluid (kg/l): 0.98Pressure Drop (Pa): 474600.00Brake Power (hp): 56.16Pump Head (ft): 220.84Electricity requirements( kW): 50.67Material of Construction: 304 stainless steel
Cost,CPB $13,100.00Utilities: ElectricityComments:
Pump
To bring solution from rotary drum filter to distillation column

LeGendre, Logan, Mendel, Seedial
147
Identification Item: PumpItem No.: P-S-102No. Req'd: 1
FunctionOperation Continuous
Materials Handled:Feed: S-S-116 Exit: S-S-116
Quantity(kg/hr) 181,540.8 181,540.8Temperature(C) 111.3 111.3Composition(kg/hr)
Biomass 0.000 0.000Carbon Dioxide 0.000 0.000Corn Steep Liquor 509.278 509.278Ethanol 0.000 0.000Gasoline 0.000 0.000Methane 0.000 0.000Oxygen 0.000 0.000Nitrogen 0.000 0.000Glycerol 0.000 0.000Hydrogen 0.000 0.000Succinic Acid 472.356 472.356Water 180559.121 180559.121
Design Data: Density of Fluid (kg/l): 1.005Pressure Drop (Pa): 50.000Brake Power (hp): 30.828Pump Head (ft): 114.845Electricity requirements( kW): 27.822Material of Construction: 304 stainless steel
Cost,CPB $9,000.00Utilities: ElectricityComments:
Pump
To bring bottoms product from furnace to electrodialysis

LeGendre, Logan, Mendel, Seedial
148
Identification Item: PumpItem No.: P-S-104No. Req'd: 1
FunctionOperation Continuous
Materials Handled:Feed: S-S-119 Exit: S-S-119
Quantity(kg/hr) 45,331.2 45,331.2Temperature(C) 40.0 40.0Composition(kg/hr)
Biomass 0.000 0.000Carbon Dioxide 0.000 0.000Corn Steep Liquor 4583.503 4583.503Ethanol 0.000 0.000Gasoline 0.000 0.000Methane 0.000 0.000Oxygen 0.000 0.000Nitrogen 0.000 0.000Glycerol 0.000 0.000Hydrogen 0.000 0.000Succinic Acid 121.877 121.877Water 40625.802 40625.802
Design Data: Density of Fluid (kg/l): 1.116Pressure Drop (Pa): 50.000Brake Power (hp): 8.605Pump Head (ft): 103.484Electricity requirements( kW): 7.807Material of Construction: 304 stainless steel
Cost,CPB $4,700.00Utilities:Comments:
Pump
To bring liquid from crystallizer to electrodialysis

LeGendre, Logan, Mendel, Seedial
149
Identification Item: PumpItem No.: P-S-105No. Req'd: 1
FunctionOperation Continuous
Materials Handled:Feed: S-S-104 Exit: S-S-104
Quantity(kg/hr) 28,185.6 28,185.6Temperature(C) 41.2 41.2Composition(kg/hr)
Biomass 0.000 0.000Carbon Dioxide 0.000 0.000Corn Steep Liquor 0.000 0.000Ethanol 889.132 889.132Gasoline 0.000 0.000Methane 0.000 0.000Oxygen 0.000 0.000Nitrogen 0.000 0.000Glycerol 0.000 0.000Hydrogen 0.000 0.000Succinic Acid 0.000 0.000Water 27296.508 27296.508
Design Data: Density of Fluid (kg/l): 0.959Pressure Drop (Pa): 50.000Brake Power (hp): 12.278Pump Head (ft): 222.340Electricity requirements( kW): 11.118Material of Construction: 304 stainless steel
Cost,CPB $5,200.00Utilities: ElectricityComments:
Pump
To bring ethanol from absorber to distillation column

LeGendre, Logan, Mendel, Seedial
150
Identification Item: PumpItem No.: P-S-106No. Req'd: 1
FunctionOperation Continuous
Materials Handled:Feed: S-S-128 Exit: S-S-128
Quantity(kg/hr) 165,301.2 165,301.2Temperature(C) 82.0 82.0Composition(kg/hr)
Biomass 0.000 0.000Carbon Dioxide 0.000 0.000Corn Steep Liquor 0.000 0.000Ethanol 151734.448 151734.448Gasoline 0.000 0.000Methane 0.000 0.000Oxygen 0.000 0.000Nitrogen 0.000 0.000Glycerol 0.000 0.000Hydrogen 0.000 0.000Succinic Acid 0.000 0.000Water 13566.737 13566.737
Design Data: Density of Fluid (kg/l): 0.80Pressure Drop (Pa): 389000.00Brake Power (hp): 56.43Pump Head (ft): 234.03Electricity requirements( kW): 50.92Material of Construction: 304 stainless steel
Cost,CPB $13,500.00Utilities: ElectricityComments:
Pump
To bring reflux from distillate back to column
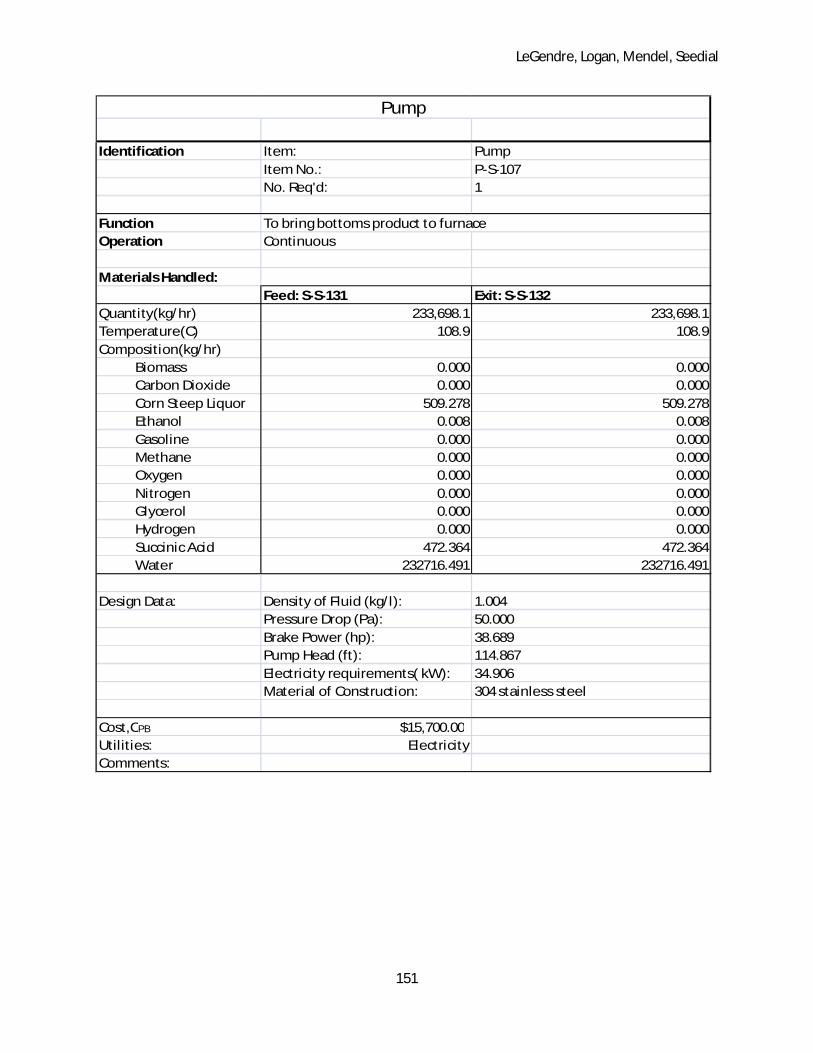
LeGendre, Logan, Mendel, Seedial
151
Identification Item: PumpItem No.: P-S-107No. Req'd: 1
FunctionOperation Continuous
Materials Handled:Feed: S-S-131 Exit: S-S-132
Quantity(kg/hr) 233,698.1 233,698.1Temperature(C) 108.9 108.9Composition(kg/hr)
Biomass 0.000 0.000Carbon Dioxide 0.000 0.000Corn Steep Liquor 509.278 509.278Ethanol 0.008 0.008Gasoline 0.000 0.000Methane 0.000 0.000Oxygen 0.000 0.000Nitrogen 0.000 0.000Glycerol 0.000 0.000Hydrogen 0.000 0.000Succinic Acid 472.364 472.364Water 232716.491 232716.491
Design Data: Density of Fluid (kg/l): 1.004Pressure Drop (Pa): 50.000Brake Power (hp): 38.689Pump Head (ft): 114.867Electricity requirements( kW): 34.906Material of Construction: 304 stainless steel
Cost,CPB $15,700.00Utilities: ElectricityComments:
Pump
To bring bottoms product to furnace

LeGendre, Logan, Mendel, Seedial
152
Identification Item: PumpItem No.: P-S-108No. Req'd: 1
FunctionOperation Continuous
Materials Handled:Feed: S-S-101 Exit: S-S-101
Quantity(kg/hr) 27,022.5 27,022.5Temperature(C) 25.0 25.0Composition(kg/hr)
Biomass 0.000 0.000Carbon Dioxide 0.000 0.000Corn Steep Liquor 0.000 0.000Ethanol 0.000 0.000Gasoline 0.000 0.000Methane 0.000 0.000Oxygen 0.000 0.000Nitrogen 0.000 0.000Glycerol 0.000 0.000Hydrogen 0.000 0.000Succinic Acid 0.000 0.000Water 27022.500 27022.500
Design Data: Density of Fluid (kg/l): 1.00Pressure Drop (Pa): 149700.00Brake Power (hp): 5.81Pump Head (ft): 107.81Electricity requirements( kW): 5.30Material of Construction: 304 stainless steel
Cost,CPB $7,200.00Utilities: ElectricityComments:
Pump
To bring clean water to absorber

LeGendre, Logan, Mendel, Seedial
153
Blowers:
Identification Item: BlowerItem No.: B-102No. Req'd: 1
FunctionOperation Continuous
Materials Handled:Feed: S-S-113 Exit: S-S-113
Quantity(kg/[batch or hr]) 135,234.5 135,234.5Temperature(C) 37.0 37.0Pressure (psi) 14.7 18.7Composition(kg/[batch or hr])
Biomass 0.000 0.000Carbon Dioxide 0.000 0.000Corn Steep Liquor 0.000 0.000Ethanol 0.000 0.000Gasoline 0.000 0.000Methane 0.000 0.000Oxygen 31498.339 31498.339Nitrogen 103736.141 103736.141Glycerol 0.000 0.000Hydrogen 0.000 0.000Succinic Acid 0.000 0.000Water 0.000 0.000
Design Data: Pressure Rise (psi): 4.000Brake Power (hp): 1500.000Motor Power (hp): 1602.646Electricity requirements( kW): 1195.093Material of Construction: Aluminum
Cost,CPB $264,200.00Utilities: ElectricityComments:
Blower
Bring waste gases from fermenters to furnace

LeGendre, Logan, Mendel, Seedial
154
Columns:
Identification Item: Distillation ColumnItem No.: D-1No. Req'd: 1
Function Separate ethanol to it's azeotrope with water from water and succinic acidOperation Continuous
Materials Handled:Stream In 1 Stream In 2 Stream In 3 Distillate BottomsS-S-104 S-S-123 S-S-112 S-S-115 S-S-116
Quantity(kg/hr) 28,185.6 6,336.0 171,420.7 24,372.1 181,540.8Temperature(C) 41.2 82.0 37.0 82.0 108.9Pressure (psi) 20.0 14.7 14.7 14.7 21.5Composition(kg/hr)
Biomass 0 0.0 29.6 0.0 0.0Carbon Dioxide 0 0.0 0.0 0.0 0.0Corn Steep Liquor 0 0.0 509.3 0.0 509.3Ethanol 889.13 4,508.8 17,146.9 22,544.8 0.0Gasoline 0 0.0 0.0 0.0 0.0Methane 0 0.0 0.0 0.0 0.0Oxygen 0 0.0 0.0 0.0 0.0Nitrogen 0 0.0 0.0 0.0 0.0Glycerol 0 0.0 0.0 0.0 0.0Hydrogen 0 0.0 0.0 0.0 0.0Succinic Acid 0 0.0 472.4 0.0 472.4Water 27296.51 1,827.3 153,262.6 1,827.3 180,559.1
Design Data:Stages 80.0Diameter (ft) 12Height (ft) 172.0Shell Thickness (in) 0.5Tray Type Baffle trayMaterials of Construction 304 Stainless steel
Cost,CPB $798,000.00Utilities:Comments: Biomass is periodically removed from a hopper in the bottom of the tower.
Products
Distillation Column
Feeds
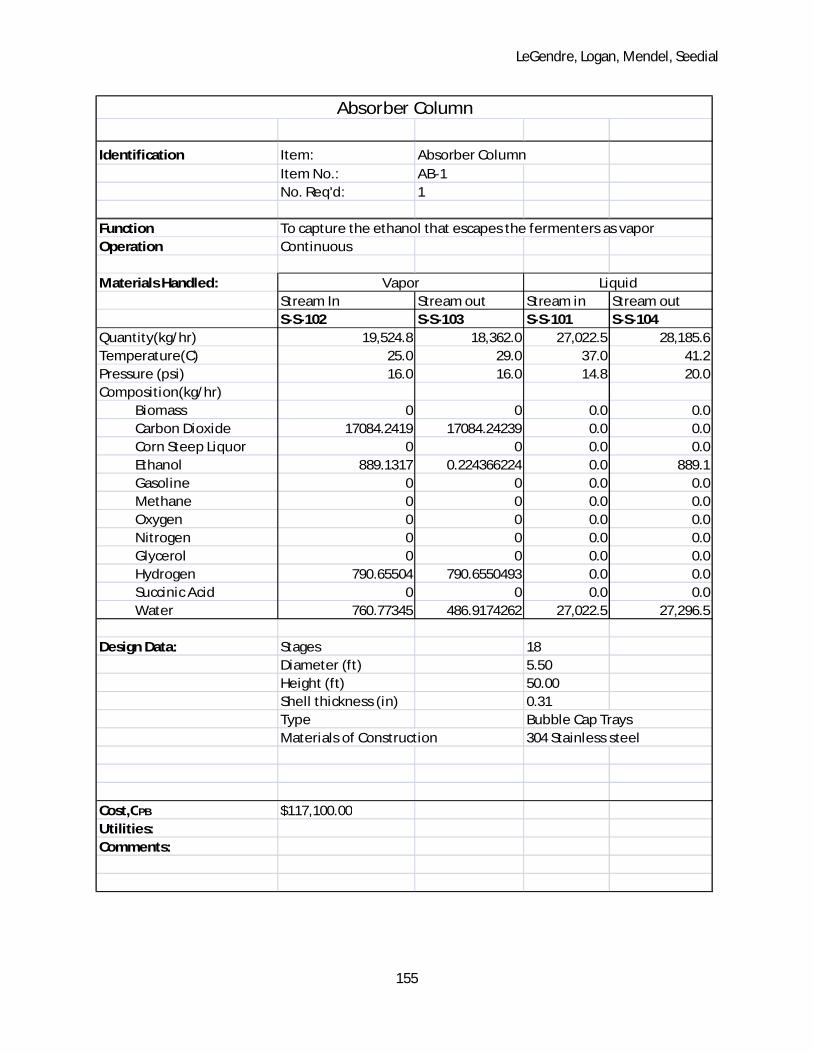
LeGendre, Logan, Mendel, Seedial
155
Identification Item: Absorber ColumnItem No.: AB-1No. Req'd: 1
Function To capture the ethanol that escapes the fermenters as vaporOperation Continuous
Materials Handled:Stream In Stream out Stream in Stream outS-S-102 S-S-103 S-S-101 S-S-104
Quantity(kg/hr) 19,524.8 18,362.0 27,022.5 28,185.6Temperature(C) 25.0 29.0 37.0 41.2Pressure (psi) 16.0 16.0 14.8 20.0Composition(kg/hr)
Biomass 0 0 0.0 0.0Carbon Dioxide 17084.2419 17084.24239 0.0 0.0Corn Steep Liquor 0 0 0.0 0.0Ethanol 889.1317 0.224366224 0.0 889.1Gasoline 0 0 0.0 0.0Methane 0 0 0.0 0.0Oxygen 0 0 0.0 0.0Nitrogen 0 0 0.0 0.0Glycerol 0 0 0.0 0.0Hydrogen 790.65504 790.6550493 0.0 0.0Succinic Acid 0 0 0.0 0.0Water 760.77345 486.9174262 27,022.5 27,296.5
Design Data: Stages 18Diameter (ft) 5.50Height (ft) 50.00Shell thickness (in) 0.31Type Bubble Cap TraysMaterials of Construction 304 Stainless steel
Cost,CPB $117,100.00Utilities:Comments:
Vapor Liquid
Absorber Column

LeGendre, Logan, Mendel, Seedial
156
Miscellaneous:
Identification Item: Reflux AccumulatorItem No.: RA-1No. Req'd: 1
Function Separates the Distillate vapor product from the liquid refluxOperation Continuous
Materials Handled:Feed Recycle ProductS-S-129 S-S-128 S-S-115
Quantity(kg/hr) 189,673.2 165,301.2 24,372.0Temperature(C) 82.0 82.0 82.0Pressure (psi) 17.0 17.0 17.0Composition(kg/hr)
Biomass 0 0 0.0Carbon Dioxide 0 0 0.0Corn Steep Liquor 0 0 0.0Ethanol 174279.2349 151734.4484 22,544.8Gasoline 0 0 0.0Methane 0 0 0.0Oxygen 0 0 0.0Nitrogen 0 0 0.0Glycerol 0 0 0.0Hydrogen 0 0 0.0Succinic Acid 0 0 0.0Water 15393.99797 13566.73652 1,827.3
Design Data: Diameter (ft) 11.6Length (ft) 6Volume (cuft) 606.0
Materials of Construction 304 Stainless Steel
Cost,CPB $47,000.00Utilities:Comments:
Reflux Accumulator

LeGendre, Logan, Mendel, Seedial
157
Identification Item: FurnaceItem No.: FN-1No. Req'd: 1
Function Burn hydrogen waste gas and reboil bottoms of distillation columnOperation Continuous
Materials Handled:Stream In 1 Stream In 2 Stream out Stream in Stream outS-S-113 S-S-103 S-S-117 S-S-132 S-S-114
Quantity(kg/hr) 135,234.5 18,362.0 153,597.3 217,948.5 217,948.5Temperature(C) 37.0 29.0 121.0 108.9 108.9Pressure (psi) 14.7 16.0 14.7 21.5 21.5Composition(kg/hr)
Biomass 0 0.0 0.0 0.0 0.0Carbon Dioxide 0 17,084.2 17,084.7 0.0 0.0Corn Steep Liquor 0 0.0 0.0 509.3 509.3Ethanol 0 0.2 0.0 1.5 1.5Gasoline 0 0.0 1.0 0.0 0.0Methane 0 0.0 0.0 0.0 0.0Oxygen 31498.33877 0.0 25,223.1 0.0 0.0Nitrogen 103736.1414 0.0 103,736.1 0.0 0.0Glycerol 0 0.0 0.0 0.0 0.0Hydrogen 0 790.7 0.0 0.0 0.0Succinic Acid 0 0.0 0.0 472.4 472.4Water 0 486.9 7,552.4 216,965.4 216,965.4
Design Data:Heat Duty(BTU) 76,910,000.0
Reactions 2H2 + O2 → 2H2O
2C2H6 + 7O2 →4CO2 + 6H2O
Type Fired HeaterMaterials of Construction
Shell: Tube:304 Stainless steel 304 Stainless steel
Cost,CPB $1,717,600.00Utilities:Comments:
Tube Side
Furnace
Shell Side

LeGendre, Logan, Mendel, Seedial
158
Identification Item: Rotary Drum FilterItem No.: RDF-1No. Req'd: 1
Function Separates Biomass from Distillation Column FeedOperation Continuous
Materials Handled: WasteFeed Product BiomassS-S-110 S-S-112 S-S-111
Quantity(kg/hr) 172,397.2 171,420.7 977.2Temperature(C) 92.2 92.2 92.2Pressure (psi) 14.7 14.7 14.7Composition(kg/hr)
Biomass 296.0787557 29.60787557 266.5Carbon Dioxide 0 0 0.0Corn Steep Liquor 927.3997293 509.2781511 418.1Ethanol 17176.20898 17146.8818 29.4Gasoline 0 0 0.0Methane 0 0 0.0Oxygen 0 0 0.0Nitrogen 0 0 0.0Glycerol 0 0 0.0Hydrogen 0 0 0.0Succinic Acid 472.5806935 472.356 0.8Water 153524.9706 153262.6125 262.4
Design Data:
Materials of Construction 316 Stainless Steel
Cost,CPB $184,400.00Utilities: ElectricityComments:
Solutions
Rotary Drum Filter

LeGendre, Logan, Mendel, Seedial
159
Identification Item: Molecular SieveItem No.: MS-1No. Req'd: 1
Function Separate Water from azeotropic water ethanol mixtureOperation Continuous
Materials Handled: Shell Side Tube SideFeed Ethanol RecirculationS-S-115 S-S-122 S-S-123
Quantity(kg/hr) 24,372.0 18,035.8 6,336.0Temperature(C) 82.0 78.4 82.0Pressure (psi) 17.0 17.0 17.0Composition(kg/hr)
Biomass 0 0 0.0Carbon Dioxide 0 0 0.0Corn Steep Liquor 0 0 0.0Ethanol 22544.78653 18035.82922 4,508.8Gasoline 0 0 0.0Methane 0 0 0.0Oxygen 0 0 0.0Nitrogen 0 0 0.0Glycerol 0 0 0.0Hydrogen 0 0 0.0Succinic Acid 0 0 0.0Water 1827.26145 0 1,827.3
Design Data:Type Molecular SieveMaterials of Construction Unknown
Cost,CPB $2,746,200.00Utilities: Electricity 79.52318 kW
Low P Steam 1590.4636 lb/hrCooling Water 119284.77 gal/hr
Comments: Black box design provided by Bruce Vrana
Molecular Sieve

LeGendre, Logan, Mendel, Seedial
160
Identification Item: Electro DialysisItem No.: ED-1No. Req'd: 1
Function Transfer Succinic acid from the bottoms product to succinic acid recovery systemOperation Continuous
Materials Handled:Fresh Water Feed Recirc Feed Conc. Stream From Tower Clean OutS-S-127 S-S-119 S-S-118 S-S-116 S-S-135
Quantity(kg/hr) 4,514.0 45,331.2 50,826.8 181,540.8 180,559.1Temperature(C) 25.0 25.0 25.0 108.9 108.9Pressure (psi) 14.7 14.7 14.7 21.5 21.5Composition(kg/hr)
Biomass 0 0.0 0.0 0.0 0.0Carbon Dioxide 0 0.0 0.0 0.0 0.0Corn Steep Liquor 0 4,583.5 5,092.8 509.3 0.0Ethanol 0 0.0 0.0 0.0 0.0Gasoline 0 0.0 0.0 0.0 0.0Methane 0 0.0 0.0 0.0 0.0Oxygen 0 0.0 0.0 0.0 0.0Nitrogen 0 0.0 0.0 0.0 0.0Glycerol 0 0.0 0.0 0.0 0.0Hydrogen 0 0.0 0.0 0.0 0.0Succinic Acid 0 121.9 594.2 472.4 0.0Water 4513.978016 40,625.8 45,139.8 180,559.1 180,559.1
Design Data:
Type Electro DialysisMaterials of Construction Unknown
Cost,CPB $2,700,000.00Utilities: $190,200.00 /yearComments:
Purifying Side
Electro Dialysis
Concentrating Side
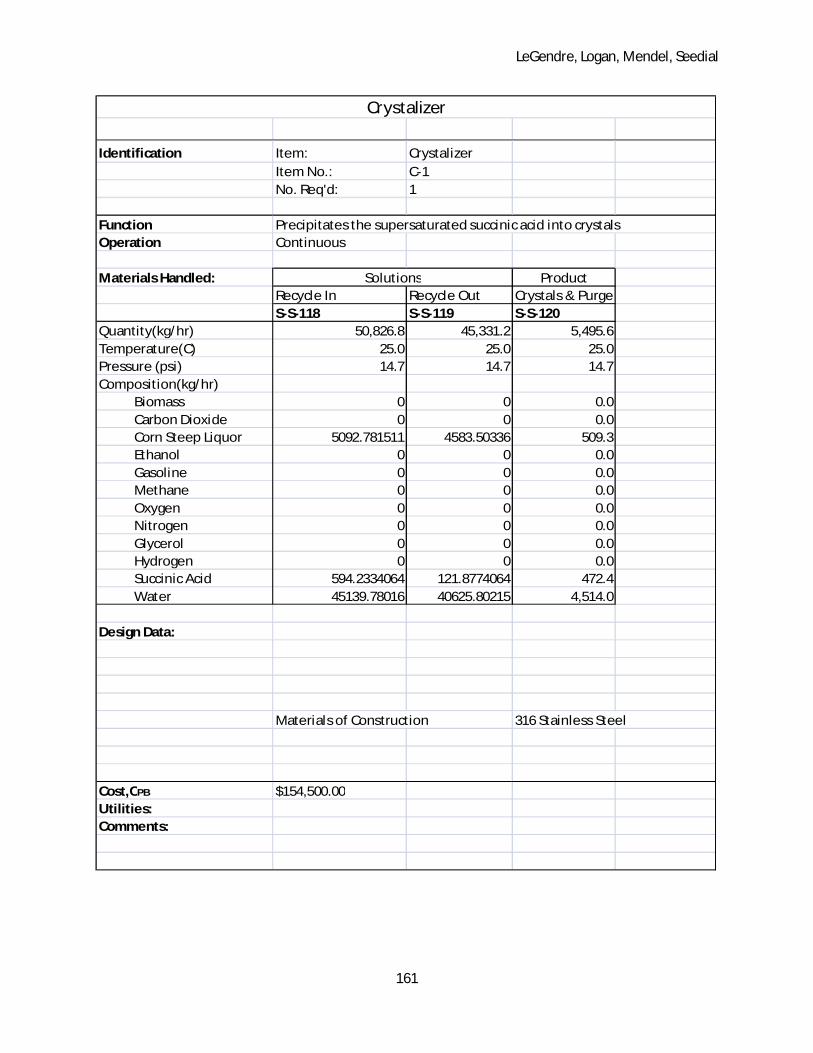
LeGendre, Logan, Mendel, Seedial
161
Identification Item: CrystalizerItem No.: C-1No. Req'd: 1
Function Precipitates the supersaturated succinic acid into crystalsOperation Continuous
Materials Handled: ProductRecycle In Recycle Out Crystals & PurgeS-S-118 S-S-119 S-S-120
Quantity(kg/hr) 50,826.8 45,331.2 5,495.6Temperature(C) 25.0 25.0 25.0Pressure (psi) 14.7 14.7 14.7Composition(kg/hr)
Biomass 0 0 0.0Carbon Dioxide 0 0 0.0Corn Steep Liquor 5092.781511 4583.50336 509.3Ethanol 0 0 0.0Gasoline 0 0 0.0Methane 0 0 0.0Oxygen 0 0 0.0Nitrogen 0 0 0.0Glycerol 0 0 0.0Hydrogen 0 0 0.0Succinic Acid 594.2334064 121.8774064 472.4Water 45139.78016 40625.80215 4,514.0
Design Data:
Materials of Construction 316 Stainless Steel
Cost,CPB $154,500.00Utilities:Comments:
Solutions
Crystalizer

LeGendre, Logan, Mendel, Seedial
162
Identification Item: DryerItem No.: DR-1No. Req'd: 1
Function Dryes the crystals from C-1Operation Batch
Materials Handled: ProductFeed Waste Succinic AcidS-S-120 S-S-134 S-S-121
Quantity(kg/hr) 5,495.6 5,036.8 458.8Temperature(C) 25.0 25.0 100.0Pressure (psi) 14.7 14.7 14.7Composition(kg/hr)
Biomass 0 0 0.0Carbon Dioxide 0 0 0.0Corn Steep Liquor 509.2781511 509.2781511 0.0Ethanol 0 0 0.0Gasoline 0 0 0.0Methane 0 0 0.0Oxygen 0 0 0.0Nitrogen 0 0 0.0Glycerol 0 0 0.0Hydrogen 0 0 0.0Succinic Acid 472.356 13.54193405 458.8Water 4513.978016 4513.978016 0.0
Design Data:
Materials of Construction 316 Stainless Steel
Cost,CPB $22,200.00Utilities:Comments:
Solutions
Dryer
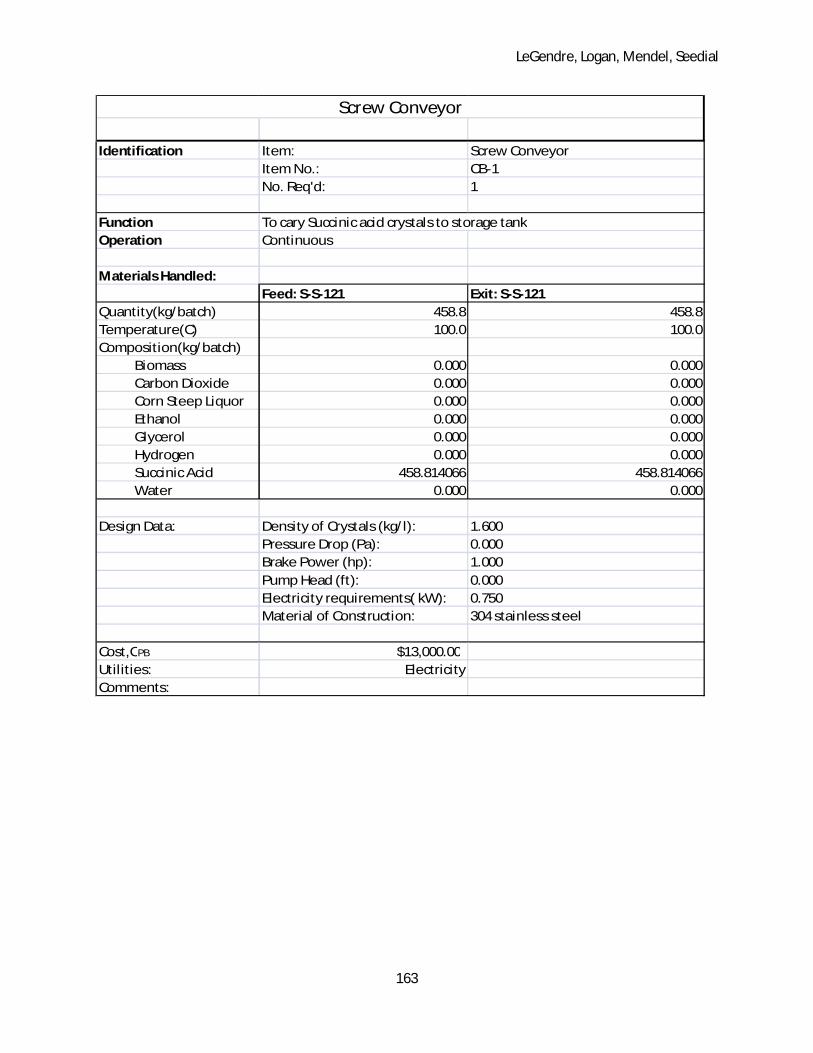
LeGendre, Logan, Mendel, Seedial
163
Identification Item: Screw ConveyorItem No.: CB-1No. Req'd: 1
FunctionOperation Continuous
Materials Handled:Feed: S-S-121 Exit: S-S-121
Quantity(kg/batch) 458.8 458.8Temperature(C) 100.0 100.0Composition(kg/batch)
Biomass 0.000 0.000Carbon Dioxide 0.000 0.000Corn Steep Liquor 0.000 0.000Ethanol 0.000 0.000Glycerol 0.000 0.000Hydrogen 0.000 0.000Succinic Acid 458.814066 458.814066Water 0.000 0.000
Design Data: Density of Crystals (kg/l): 1.600Pressure Drop (Pa): 0.000Brake Power (hp): 1.000Pump Head (ft): 0.000Electricity requirements( kW): 0.750Material of Construction: 304 stainless steel
Cost,CPB $13,000.00Utilities: ElectricityComments:
Screw Conveyor
To cary Succinic acid crystals to storage tank
LeGendre, Logan, Mendel, Seedial
164
Alternate Units and Considerations
Section IX

LeGendre, Logan, Mendel, Seedial
165
Alternate Process Units and Considerations
Succinic Acid Separation:
Numerous methods of separation were considered for succinic acid, the most promising of
which was ion exchange chromatography. During the initial investigation phase, however, it was noted
that the resin exhibited significant loss of functionality over time, as some succinic acid would not
desorb during washing. The loss of useful resin would have cost $14MM per year minimum, as a small
quantity of resin would have to be continually replenished. Electrodialysis was found to be a cost
effective alternative, even before pricing equipment.
Absorber Column vs. Ethanol Burning:
At 37 ⁰C, the vapor pressure of ethanol is high enough for a significant portion to escape as
vapor with the hydrogen and carbon dioxide gases emitted during fermentation. Since the hydrogen-
rich stream is sent to the furnace in order to recover the heat of combustion for use in the reboiler,
burning the vaporized ethanol rather than absorbing it was considered. Steam, however, has a cost of
3.3 cents per 10,000 BTU, while burning ethanol would result in a 33 cent loss per 10,000 BTU. It was
therefore financially advantageous to capture the vaporized ethanol and recover it in an absorption
column.
Natural Gas vs. Steam for Reboiler Heat Duty:
Natural gas and steam were the two main choices for supplying the remainder of the heat duty
for the reboiler not supplied by the hydrogen combustion. The cost of energy from natural gas was
$3.69 per MMBTU while steam cost $3.30 per MMBTU. Furthermore, the installation cost of a steam-
powered heat exchanger is significantly lower than the installation cost of another furnace, or the
redesigning of the furnace for higher heat duty. Ultimately steam heat was more cost effective.

LeGendre, Logan, Mendel, Seedial
166
Glycerol Feed Purchase:
Glycerol feedstock from the biodiesel industry is available in two main forms: crude and partially
refined. Although the partially refined glycerol feed would have eliminated the need for the glycerol
purification system, suppliers could not confirm the availability of the partially refined product for the
quantity of glycerol required for the process. Additionally, the partially refined glycerol is typically
$0.15/lb more expensive than the crude glycerol (Gallagher et al.), which, given the sensitivity of the
process to glycerol, would be prohibitively expensive. The choice was made to use the crude glycerol
feedstock, although a purification unit operation is now required. The added benefit of the glycerol
purification system from EET Corporation is its ability to process a feedstock with a variety of
compositions. The plant flexibility is advantageous, because the least expensive glycerol can be
purchased at a given time.
Clarifying/Settling Tank vs. Storage Tank with Agitator
The broth leaving the fermenters to be stored in T-107 must be continually agitated to prevent
the settling of cells in the storage tank prior to transportation to the separation process. As an
alternative to agitation, a settling clarifier tank similar to those used in waste water treatment was
researched and priced. According to Perry’s Chemical Engineering Handbook, clarifiers with dilute
concentrations of solids typically have underflow solids weight percents of 8-15%. At this percentage,
two streams with low solids mass percentages would need to be sterilized and filtered rather than one
(the overflow and the underflow from the clarifier). The clarifier does not work in this case to separate
any solids, so it has no benefit, and essentially functions as an agitator.
LeGendre, Logan, Mendel, Seedial
167
Other
Considerations
Section X
LeGendre, Logan, Mendel, Seedial
168
Other Considerations
Plant Layout
The few interconnected steps in the process should be placed near each other. The molecular
sieve regeneration stream recirculates into the distillation column, and therefore these units should be
placed near one another. The electro-dialysis feeds water into HX-3 and therefore, these units should
be placed together. The furnace should be placed far away from the succinic acid separation section as
well as the pure ethanol and gasoline streams due to flammability.
Storage tanks (T-101, T-103, T-109, T-110, T-111) should be placed outside the plant for easy
loading and unloading, preferably next to railroad tracks for easy transport.
Health and Safety Considerations
The presence of hydrogen in this process posses the largest safety concern. The process has
been designed with this in mind, so 304 stainless steel has been used for all components coming into
contact with hydrogen to protect against hydrogen embrittlement (Gallagher et al.). Positive pressure is
used to decrease the likelihood of oxygen seeping into the system. Special care will be taken with
regard to sealing the system in the presence of hydrogen. Special fittings will be designed for this
purpose.
Several of the process components are flammable. The explosion limits on hydrogen, ethanol,
and gasoline are 4-75%, 3.3-19% and 1.4-7.6% respectively. Oxygen sensors will be necessary within
hydrogen containing vessels and piping, and sensors will be necessary to ensure that no buildup of
hydrogen, ethanol, or gasoline occurs.
The fermentation is exothermic, but reactor runaway is not a large concern. Due to the high
volume of the reactors, even under adiabatic conditions, there is only a small 5.8°C temperature
increase over the course of the fermentation cycle. Automatic shut down will be necessary within the

LeGendre, Logan, Mendel, Seedial
169
furnace. Should there be a breakdown of blower B-102, the combustion temperature could skyrocket to
higher than 2000°F, which would damage the furnace and possibly lead to explosion.
There will also be large quantities of succinic acid in some areas of the plant. Succinic acid is a
hazardous chemical which can cause skin and eye irritation, as well as breathing difficulties in the case of
ingestion. Showers and eyewash stations will be placed frequently around the plant in case of human
contact with succinic acid.
Basic safety equipment such as eye protection and hard hats will be worn at all times around the
plant. The MSDS sheets for all of the components in our process have been included in the appendix of
the report.
The E. coli to be used in this process is not a genetically modified organism, and poses no health
threats to humans as per the design problem statement. As such, it does not fall under governmental
regulation. Nonetheless, it is prudent to deactivate the organisms before disposal, and this is completed
in HX-3 for the broth stream and in the furnace FN-1 for the vapor stream. Any small spills can be sent to
an empty (off-line) seed fermentation train unit for sterilization with caustic solution.
Plant Start-Up Considerations
The main start-up considerations are heat related, as the heat exchangers HX-1 (in the feed
preparation section) and HX-3 (in the separation section) require streams that have already been heated
in the process. Steam can be used in both heat exchangers for the start-up period. By the time the
separation processing section is reached, after ~100 hours, enough hydrogen will have been generated
to fuel the reboiler, which has the largest heat requirement.
Process Control
The major section of the plant that must be monitored and controlled is the main large-scale
fermentation section. The 14.8 psia positive pressure must be maintained in the fermenters at all times.
This can be accomplished with a pressure-monitoring system and a valve controlling the release of
LeGendre, Logan, Mendel, Seedial
170
fermentation gases to the piping connected to the blower system. Additionally, the temperature of the
fermentation units must be controlled. The temperature must be monitored, and a valve is installed to
control the amount of the cooling water/chilled water mixture that is sent to the twelve HX-FERM units
to control the amount of heat transferred from the fermentation broth to the cooling water during
fermentation.
Additionally, level controllers should be installed in the tanks T-106 and T-107, which are the
intermediate sterilized feed and fermentation broth holding tanks, functioning as the transition point
from continuous to batch processing and vice versa. These tanks have been designed with a working
volume of 80%, and the levels should be monitored to prevent any overflows or empty tanks. With the
current schedule, these problems should be avoided, but these tanks need to be monitored for the
duration of the process to ensure safety and steady-state processing in the continuous sections of the
plant.

LeGendre, Logan, Mendel, Seedial
171
Environmental Considerations
Section XI
LeGendre, Logan, Mendel, Seedial
172
Environmental Considerations
The main impact on the environment is from the waste carbon dioxide that is released from the
fermentation process. The chemical reaction produces approximately 150,000 tons/year of carbon
dioxide waste. The disposal of carbon dioxide has become a controversial topic in recent years as the
exact environmental impact of a certain amount of carbon dioxide is still unknown. There are three
options for dealing with this waste in accordance with the main systems in place and with pending
legislation in the different government systems around the world.
One option that is popular within industry is carbon offsetting. A carbon offset program
attempts to make up for carbon dioxide waste produced, by taking a secondary action that consumes
carbon dioxide. In that case, this plant would have to invest in a reforestation plan that would consume,
once fully mature, the same amount of CO2 per year that is produced by the plant. The plant will
produce 150,000 tons of Carbon Dioxide per year. Approximately 120 fully-mature trees can sequester 5
tons of CO2 per year (Botanical Society of America). The average cost to plant an acre of trees is $500,
and in the current climate conditions the one can expect 35% of the planted trees to survive to maturity.
Therefore for the reforestation plan, if 200 pine trees are planted per acre, 70 will survive, so to be safe,
for every 5 tons of CO2, two acres of trees need to be planted. Therefore, to offset all of the carbon
output from the plant, it will take 60,000 acres of pine trees, costing $30 million (SRP.net).
Recent research has looked into carbon capture and sequestration technologies as a means of
lowering carbon dioxide emissions. Carbon sequestering is an expensive option that can at best
eliminate 80% of the carbon dioxide produced (National Mining Association). The best method seems to
be with a solid absorbent-magnesium oxide absorber to capture the carbon dioxide and then using a 3
stage compressor to bring it to its supercritical phase so as to be transported (Czarniak et al). Besides
the cost of bringing the carbon dioxide into a supercritical phase and pumping into storage, sequestering
would also require the extra step of separating the gaseous carbon dioxide and hydrogen gas wastes.
LeGendre, Logan, Mendel, Seedial
173
However, while this process incurs large startup costs, the cost of capturing and sequestering the CO2 is
on the order of $31.80 per ton of CO2 (Czarniak et al). Since in 2030, it is likely that some sort of CCS
(carbon capture and storage) technology will be required of all industries that produce large amounts of
CO2, it may be required that the plant add in this process when it is necessary (McKinsey). With 150,000
tons being produced per year, the annual cost of CO2 capture and sequester is $4,741,300.
However, since the process of producing the ethanol uses a feed of glycerol which is produced
from biodiesel production, this process can be considered to be carbon neutral. Biofuels are carbon
neutral even though the production of them produces carbon dioxide. This is because the carbon in the
biofuel comes from a plant source. As such, the carbon dioxide produced can be released to the
atmosphere without any carbon offsetting or sequestration technologies.
This release may be legal for only a few years depending on United States governmental policy
regarding CO2 emissions. Many of the potential laws set the maximum allowable emissions levels at 250
tons per year (Efstathiou Jr.) (See Carbon Dioxide Legislation Appendix E on page 265). Whenever this
happens, the CCS technology option will have to be reexamined and, at that point, the cost will be lower
since a lot of research is currently focusing in that area.

LeGendre, Logan, Mendel, Seedial
174
Economic Analysis Section XII
LeGendre, Logan, Mendel, Seedial
175
Economic Analysis
Equipment Cost Estimates
The equipment purchase costs were computed using the specifications and correlations outlined
in Product and Process Design Prinicples by Seider, Seader, Lewin, and Widagdo. The base purchase
costs included with the unit descriptions, CPB for the Method of Guthrie equation for installation cost,
are based on carbon steel construction. However, most of our plant equipment is made of 304 stainless
steel . To account for the difference in material, the Guthrie correlation was used to determine the bare
module cost of the equipment, where the Guthrie material factors FM for 304 Stainless Steel were
obtained from Perry’s Chemical Engineering Handbook.
Guthrie correlation: CBM= CPB(I/IB)[FBM+ ( FdFPFM-1)],
Where: FBM= bare module factor
Fd= equipment design factor
Fp= pressure factor
Fm= material factor
The material factors from Perry’s Handbook for 304 stainless steel construction were 1.7 for pumps and
2.8 for other equipment. For heat exchangers, the factor was 1.67 if the tubes were 304 stainless and
the shell was carbon steel, and 2.86 if both shell and tubes were 304 stainless steel.
The summary of the calculated equipment costs is shown below in Table E-1.
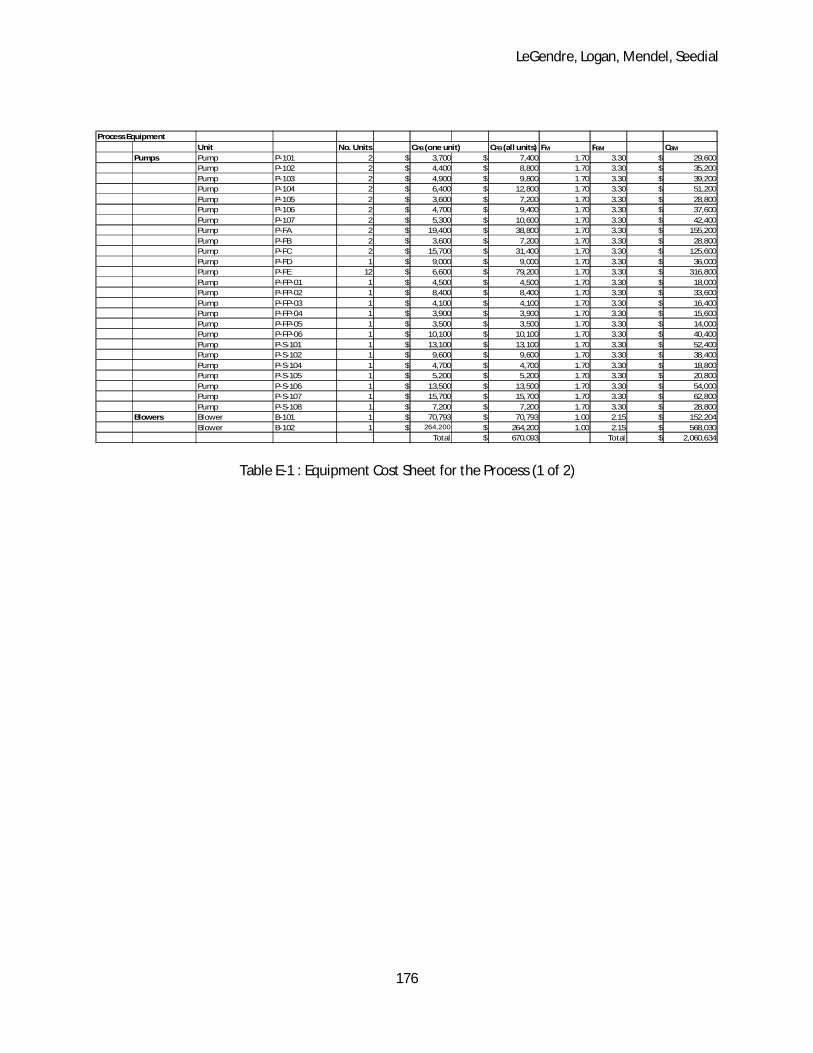
LeGendre, Logan, Mendel, Seedial
176
Process EquipmentUnit No. Units CPB (one unit) CPB (all units) FM FBM CBM
Pumps Pump P-101 2 $ 3,700 $ 7,400 1.70 3.30 $ 29,600Pump P-102 2 $ 4,400 $ 8,800 1.70 3.30 $ 35,200Pump P-103 2 $ 4,900 $ 9,800 1.70 3.30 $ 39,200Pump P-104 2 $ 6,400 $ 12,800 1.70 3.30 $ 51,200Pump P-105 2 $ 3,600 $ 7,200 1.70 3.30 $ 28,800Pump P-106 2 $ 4,700 $ 9,400 1.70 3.30 $ 37,600Pump P-107 2 $ 5,300 $ 10,600 1.70 3.30 $ 42,400Pump P-FA 2 $ 19,400 $ 38,800 1.70 3.30 $ 155,200Pump P-FB 2 $ 3,600 $ 7,200 1.70 3.30 $ 28,800Pump P-FC 2 $ 15,700 $ 31,400 1.70 3.30 $ 125,600Pump P-FD 1 $ 9,000 $ 9,000 1.70 3.30 $ 36,000Pump P-FE 12 $ 6,600 $ 79,200 1.70 3.30 $ 316,800Pump P-FP-01 1 $ 4,500 $ 4,500 1.70 3.30 $ 18,000Pump P-FP-02 1 $ 8,400 $ 8,400 1.70 3.30 $ 33,600Pump P-FP-03 1 $ 4,100 $ 4,100 1.70 3.30 $ 16,400Pump P-FP-04 1 $ 3,900 $ 3,900 1.70 3.30 $ 15,600Pump P-FP-05 1 $ 3,500 $ 3,500 1.70 3.30 $ 14,000Pump P-FP-06 1 $ 10,100 $ 10,100 1.70 3.30 $ 40,400Pump P-S-101 1 $ 13,100 $ 13,100 1.70 3.30 $ 52,400Pump P-S-102 1 $ 9,600 $ 9,600 1.70 3.30 $ 38,400Pump P-S-104 1 $ 4,700 $ 4,700 1.70 3.30 $ 18,800Pump P-S-105 1 $ 5,200 $ 5,200 1.70 3.30 $ 20,800Pump P-S-106 1 $ 13,500 $ 13,500 1.70 3.30 $ 54,000Pump P-S-107 1 $ 15,700 $ 15,700 1.70 3.30 $ 62,800Pump P-S-108 1 $ 7,200 $ 7,200 1.70 3.30 $ 28,800
Blowers Blower B-101 1 $ 70,793 $ 70,793 1.00 2.15 $ 152,204Blower B-102 1 $ 264,200 $ 264,200 1.00 2.15 $ 568,030
Total $ 670,093 Total $ 2,060,634
Table E-1 : Equipment Cost Sheet for the Process (1 of 2)

LeGendre, Logan, Mendel, Seedial
177
Fabricated Equipment Unit No. Units Cpb (one unit) Cpb (all units) FM FBM CBM
Vessels Fermenter Ferm 1 12 $ 341,500 $ 4,098,000 2.80 4.16 $ 24,424,080Fermenter Seed Ferm 5A/B 2 $ 30,700 $ 61,400 2.80 4.16 $ 365,944Fermenter Seed Ferm 6A/B 2 $ 100,900 $ 201,800 2.80 4.16 $ 1,202,728Fermenter Seed Ferm 7A/B 2 $ 150,400 $ 300,800 2.80 4.16 $ 1,792,768Distillation Column D-1 1 $ 798,000 $ 798,000 2.80 4.16 $ 4,756,080Absorber Column AB-1 1 $ 117,100 $ 117,100 2.80 4.16 $ 697,916Reflux Accumulator RA-1 1 $ 47,000 $ 47,000 2.80 3.05 $ 227,950
Agitators Agitator for Ferm 1 12 $ 44,200 $ 530,400 2.80 3.21 $ 2,657,304Agitator for T-107 1 $ 44,200 $ 44,200 2.80 3.21 $ 221,442Agitator for Seed 6A/B 2 $ 6,500 $ 13,000 2.80 3.21 $ 65,130Agitator for Seed 7A/B 2 $ 20,800 $ 41,600 2.80 3.21 $ 208,416Agitator for T-105 1 $ 29,900 $ 29,900 2.80 3.21 $ 149,799Agitator for T-108 1 $ 9,100 $ 9,100 2.80 3.21 $ 45,591
Heat Exchangers HX-FERM for Ferm 1 12 $ 4,200 $ 50,400 1.67 1.80 $ 124,488Heat Exchanger HX-1 1 $ 132,300 $ 132,300 2.86 3.17 $ 665,469Heat Exchanger HX-2 1 $ 22,049 $ 22,049 1.67 1.80 $ 54,461Heat Exchanger HX-3 1 $ 113,900 $ 113,900 1.67 3.17 $ 437,376Heat Exchanger HX-4 1 $ 65,900 $ 65,900 1.67 3.17 $ 253,056Heat Exchanger HX-5 1 $ 21,200 $ 21,200 1.67 3.17 $ 81,408Heat Exchanger HX-6 1 $ 60,237 $ 60,237 1.67 3.17 $ 231,310
Furnace Furnace FN-1 1 $ 1,717,600 $ 1,717,600 2.80 1.86 $ 6,286,416Total $ 8,475,886 Total $ 44,949,132
StorageUnit No. Units Cpb (one unit) Cpb (all units) FM FBM CBM
Storage Tanks Broth Storage Tank T-107 1 $ 582,900 $ 582,900 2.80 3.05 $ 2,827,065Glycerol Storage T-101 1 $ 564,600 $ 564,600 2.80 3.05 $ 2,738,310CSL Storage T-103 1 $ 49,600 $ 49,600 2.80 3.05 $ 240,560Brine Storage T-104 1 $ 65,700 $ 65,700 2.80 3.05 $ 318,645Feed Mixing Tank T-105 1 $ 42,500 $ 42,500 2.80 3.05 $ 206,125Sterilized Feed Tank T-106 1 $ 338,000 $ 338,000 2.80 3.05 $ 1,639,300Denatured Ethanol Holding TankT-111 1 $ 453,300 $ 453,300 2.80 3.05 $ 2,198,505Succinic Acid Storage TankT-110 1 $ 27,600 $ 27,600 2.80 4.16 $ 164,496Mixing Tank T-108 1 $ 26,800 $ 26,800 2.80 3.05 $ 129,980Gasoline Storage TankT-109 1 $ 101,000 $ 101,000 1.00 3.05 $ 308,050
Total $ 2,252,000.00 Total $ 10,771,036.00Miscellaneous
Unit No. Units Cpb (one unit) Cpb (all units) FM FBM CBM
Spray Nozzles Spray Nozzles For FERM 1-12 48 $ 10,000 $ 480,000 1.00 1.00 $ 480,000Spray Nozzles for Seed 7A/B 6 $ 10,000 $ 60,000 1.00 1.00 $ 60,000
Reverse Osmosis Glycerol Pur. Sys. R-101 1 $ -- $ -- $ 430,800Rotary Drum FilterRotary Drum Filter RDF-1 1 $ 184,400 $ 184,400 1.00 2.32 $ 427,808Electrodialysis Electrodialysis ED-1 1 -- -- $ 2,700,000Crystallizer Crystallizer C-1 1 $ 154,500 $ 154,500 1.00 2.06 $ 318,270Dryer Dryer DR-1 1 $ 22,200 $ 22,200 1.00 2.06 $ 45,732Screw Conveyor Screw Conveyor CB-1 1 $ 13,000 $ 13,000 1.00 1.61 $ 20,930Molecular Sieves Molecular Sieves MS-1 1 $ 2,746,200 $ 2,746,200 1.00 1.00 $ 2,746,200
Total $ 3,660,300.00 Total $ 7,229,740.00
$ 65,010,542
Table E-1 : Equipment Cost Sheet for the Process (2 of 2)

LeGendre, Logan, Mendel, Seedial
178
Utility Requirements
The utility cost for the entire plant includes costs for electricity, steam, water (cooling and
process), waste water treatment, and landfill. These costs are summarized in Table E-2. Prices for utilites
were obtained using the 3rd Edition of Product and Process Design Principles by Seider, Seader, Lewin,
and Widagdo.

LeGendre, Logan, Mendel, Seedial
179
UtilityProcess Water Stream L/hr m^3/ hr cost ($/ m^3) cost/hr cost/yr
S-FP-102 4832.30 4.83 $0.20 $0.97 $7,654.36S-FP-105 151105.00 151.11 $0.20 $30.22 $239,350.32S-S-127 4514 4.51 $0.20 $0.90 $7,150.18S-S-101 27022.50 27.02 $0.20 $5.40 $42,803.64
$296,958.50
Waste Water Stream kg/hr cost ($/kg) cost/yr S-S-134 13.40 $0.33 $4.42 $35,022.24
$35,022.24
Steam - 150 psig Equipment kg/hr cost( $/1000 kg) cost/yr HX-2 4044.94 $10.50 $42.47 $336,377.21
$336,377.21
Steam - 50 psig Equipment kg/hr cost( $/1000 kg) cost/hr cost/yr HX-6 16775 $6.60 $110.72 $876,862.80MS-1 $4.77 $37,789.41
$914,652.21
cooling water Stream l/hr m^3/hr $/m^3 cost/hr cost/yr HX-4 1087870.00 1087.87 $0.02 $21.76 $172,318.61HX-5 23766.11 23.77 $0.02 $0.48 $3,764.55MS-1 $8.95 $70,855.17HX-FERM 21003.00 21.00 $0.02 $0.42 $2,015.78
$248,954.11
chilled water Stream BTU/HR BTU/day $/btu $/day $/yrHX-FERM 298539.57 7164949.62 $0.00 $29.85 $9,851.81
$9,851.81
Landfill Stream kg/hr cost ($/kg)Biomass cake 505.47 $0.17 $85.93 $680,564.81
$680,564.81
Electricity Stream HP Kw cost($ / kW-hr) cost/hr cost/yrP-S-101 67.95 50.67 $0.06 $3.04 $24,078.53P-S-102 37.31 27.82 $0.06 $1.67 $13,221.04P-S-104 10.47 7.81 $0.06 $0.47 $3,710.11P-S-105 14.91 11.12 $0.06 $0.67 $5,283.46P-S-106 68.28 50.92 $0.06 $3.05 $24,195.47P-S-107 46.81 34.91 $0.06 $2.09 $16,587.43P-S-108 7.10 5.30 $0.06 $0.32 $2,516.47CB-1 1.00 0.75 $0.06 $0.04 $354.36RDF-1 11.78 8.78 $0.06 $0.53 $4,173.26Agitator for T-108 4.00 2.98 $0.06 $0.18 $1,417.43ED-1 $190,200.00B-102 1602.65 1195.09 $0.06 $71.71 $567,908.07MS-1 $4.77 $37,789.41P-FA A 67.22 50.13 $0.06 $3.01 $1,202.75P-FA B 67.22 50.13 $0.06 $3.01 $1,202.75
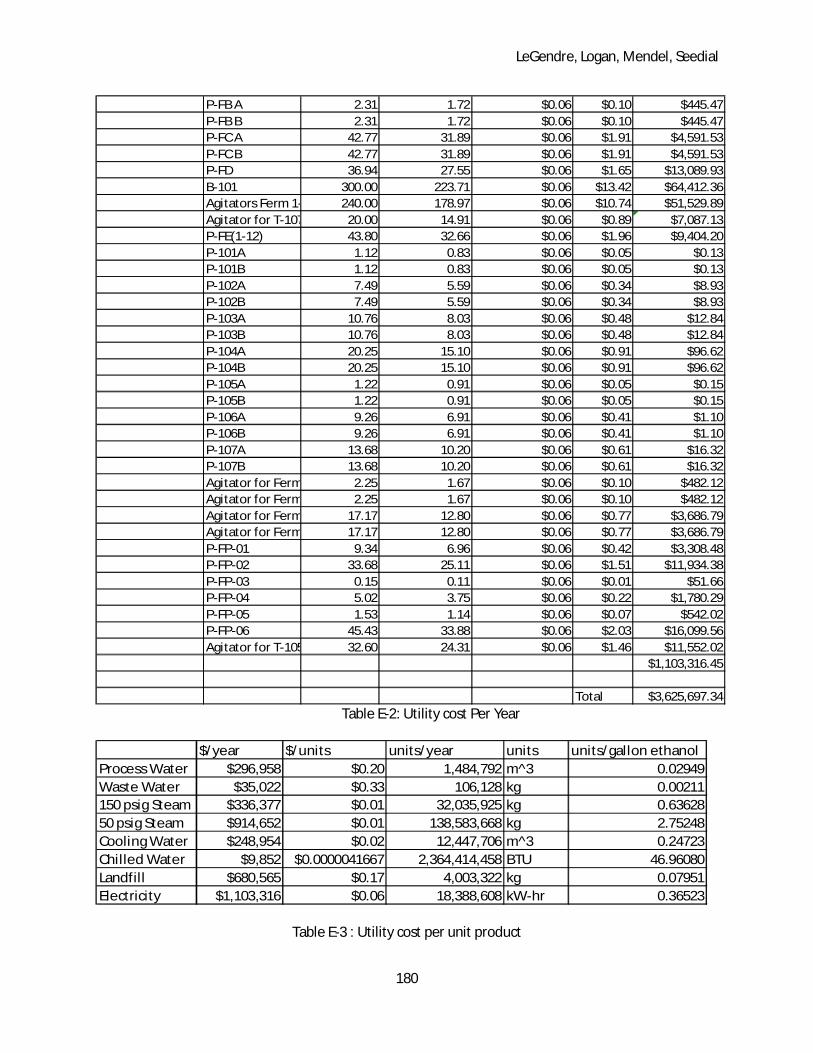
LeGendre, Logan, Mendel, Seedial
180
P-FB A 2.31 1.72 $0.06 $0.10 $445.47P-FB B 2.31 1.72 $0.06 $0.10 $445.47P-FC A 42.77 31.89 $0.06 $1.91 $4,591.53P-FC B 42.77 31.89 $0.06 $1.91 $4,591.53P-FD 36.94 27.55 $0.06 $1.65 $13,089.93B-101 300.00 223.71 $0.06 $13.42 $64,412.36Agitators Ferm 1-12 240.00 178.97 $0.06 $10.74 $51,529.89Agitator for T-107 20.00 14.91 $0.06 $0.89 $7,087.13P-FE(1-12) 43.80 32.66 $0.06 $1.96 $9,404.20P-101A 1.12 0.83 $0.06 $0.05 $0.13P-101B 1.12 0.83 $0.06 $0.05 $0.13P-102A 7.49 5.59 $0.06 $0.34 $8.93P-102B 7.49 5.59 $0.06 $0.34 $8.93P-103A 10.76 8.03 $0.06 $0.48 $12.84P-103B 10.76 8.03 $0.06 $0.48 $12.84P-104A 20.25 15.10 $0.06 $0.91 $96.62P-104B 20.25 15.10 $0.06 $0.91 $96.62P-105A 1.22 0.91 $0.06 $0.05 $0.15P-105B 1.22 0.91 $0.06 $0.05 $0.15P-106A 9.26 6.91 $0.06 $0.41 $1.10P-106B 9.26 6.91 $0.06 $0.41 $1.10P-107A 13.68 10.20 $0.06 $0.61 $16.32P-107B 13.68 10.20 $0.06 $0.61 $16.32Agitator for Ferm6A 2.25 1.67 $0.06 $0.10 $482.12Agitator for Ferm6B 2.25 1.67 $0.06 $0.10 $482.12Agitator for Ferm7A 17.17 12.80 $0.06 $0.77 $3,686.79Agitator for Ferm7B 17.17 12.80 $0.06 $0.77 $3,686.79P-FP-01 9.34 6.96 $0.06 $0.42 $3,308.48P-FP-02 33.68 25.11 $0.06 $1.51 $11,934.38P-FP-03 0.15 0.11 $0.06 $0.01 $51.66P-FP-04 5.02 3.75 $0.06 $0.22 $1,780.29P-FP-05 1.53 1.14 $0.06 $0.07 $542.02P-FP-06 45.43 33.88 $0.06 $2.03 $16,099.56Agitator for T-105 32.60 24.31 $0.06 $1.46 $11,552.02
$1,103,316.45
Total $3,625,697.34
Table E-2: Utility cost Per Year
$/year $/units units/year units units/gallon ethanolProcess Water $296,958 $0.20 1,484,792 m^3 0.02949Waste Water $35,022 $0.33 106,128 kg 0.00211150 psig Steam $336,377 $0.01 32,035,925 kg 0.6362850 psig Steam $914,652 $0.01 138,583,668 kg 2.75248Cooling Water $248,954 $0.02 12,447,706 m^3 0.24723Chilled Water $9,852 $0.0000041667 2,364,414,458 BTU 46.96080Landfill $680,565 $0.17 4,003,322 kg 0.07951Electricity $1,103,316 $0.06 18,388,608 kW-hr 0.36523
Table E-3 : Utility cost per unit product
LeGendre, Logan, Mendel, Seedial
181
Operating Costs
The process has three main sections, glycerol purification, fermentation, and separation. For
continuous processes with solids, it is advised to have 2 operators on hand (Seider) while 3 are
recommended for batch systems with solids. Therefore, we have assumed 7 operators at all times, paid
$35/hour.
It is assumed that the plant will be in operation for 15 years after construction, and that design
and construction take one year each. The plant will be located on the Gulf Coast and will operate 330
days per year as recommended in Product and Process Design Prinicples by Seider, Seader and Lewin.
The working capital assumes 3 days of inventory and 30 days of receivables.
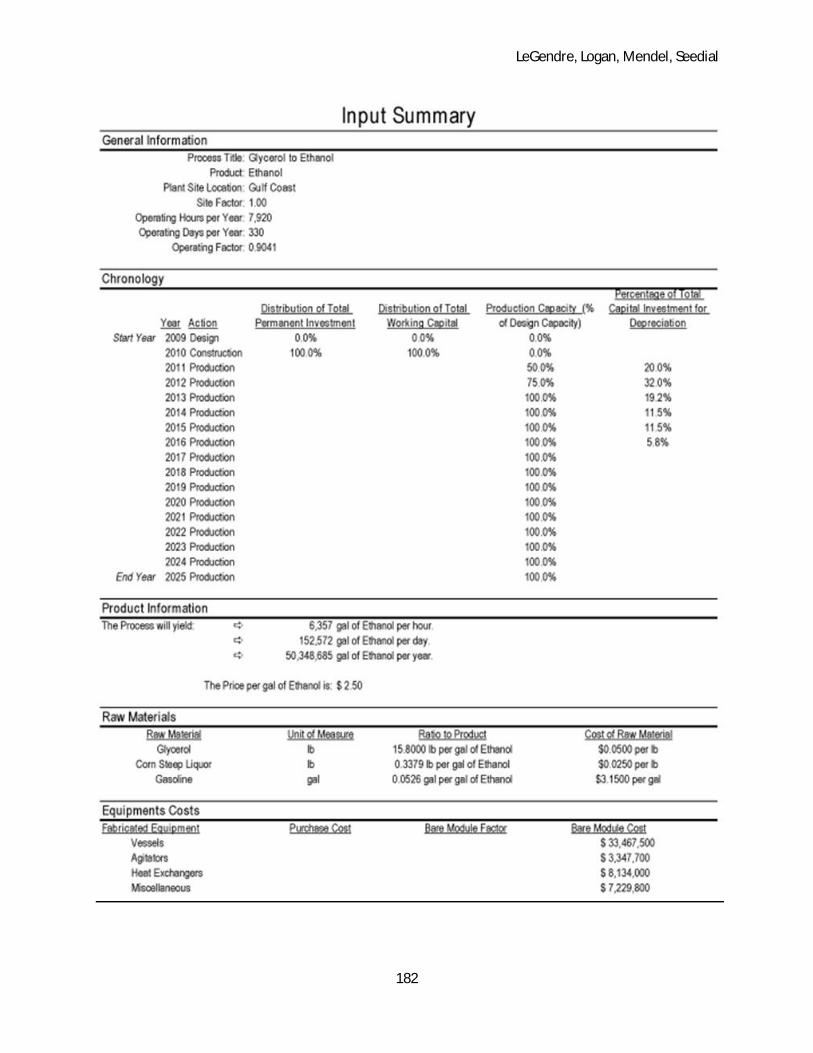
LeGendre, Logan, Mendel, Seedial
182
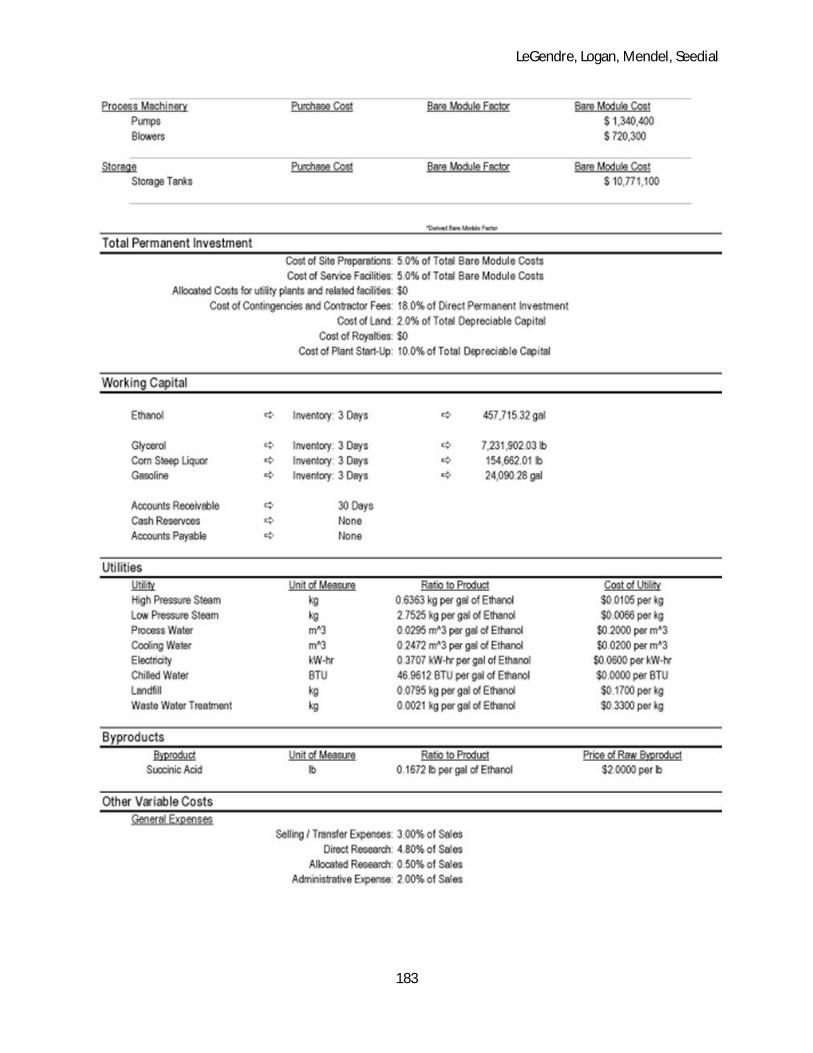
LeGendre, Logan, Mendel, Seedial
183
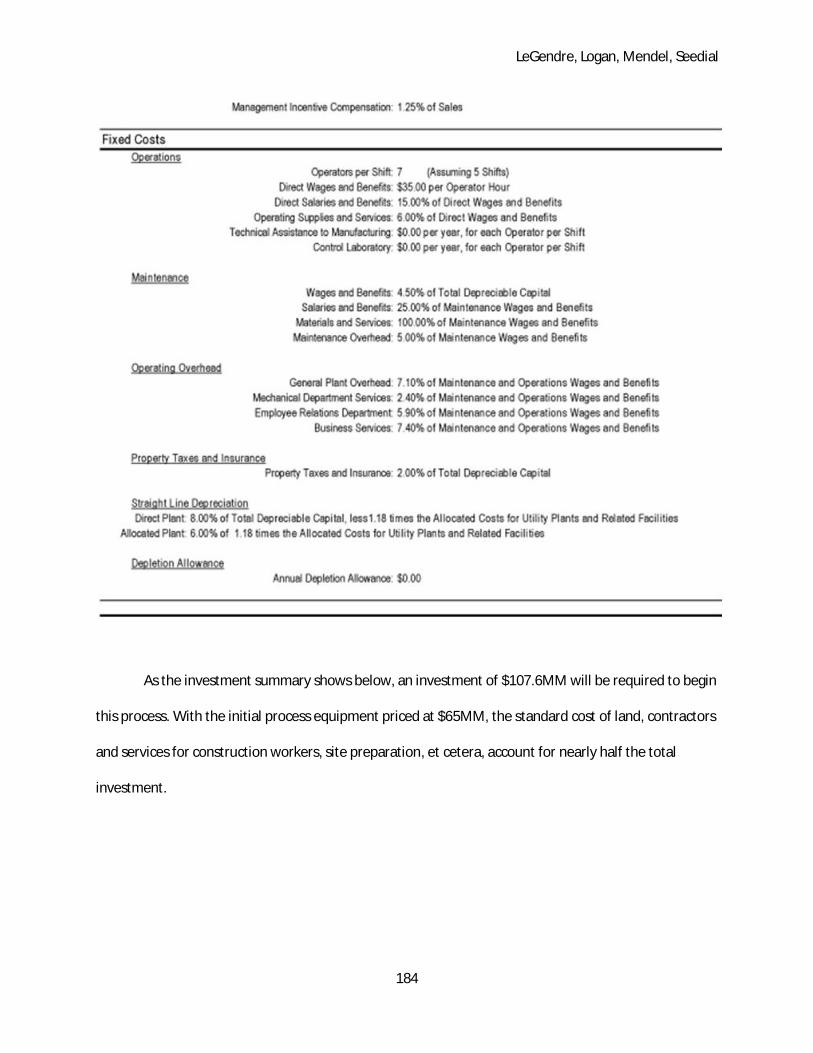
LeGendre, Logan, Mendel, Seedial
184
As the investment summary shows below, an investment of $107.6MM will be required to begin
this process. With the initial process equipment priced at $65MM, the standard cost of land, contractors
and services for construction workers, site preparation, et cetera, account for nearly half the total
investment.
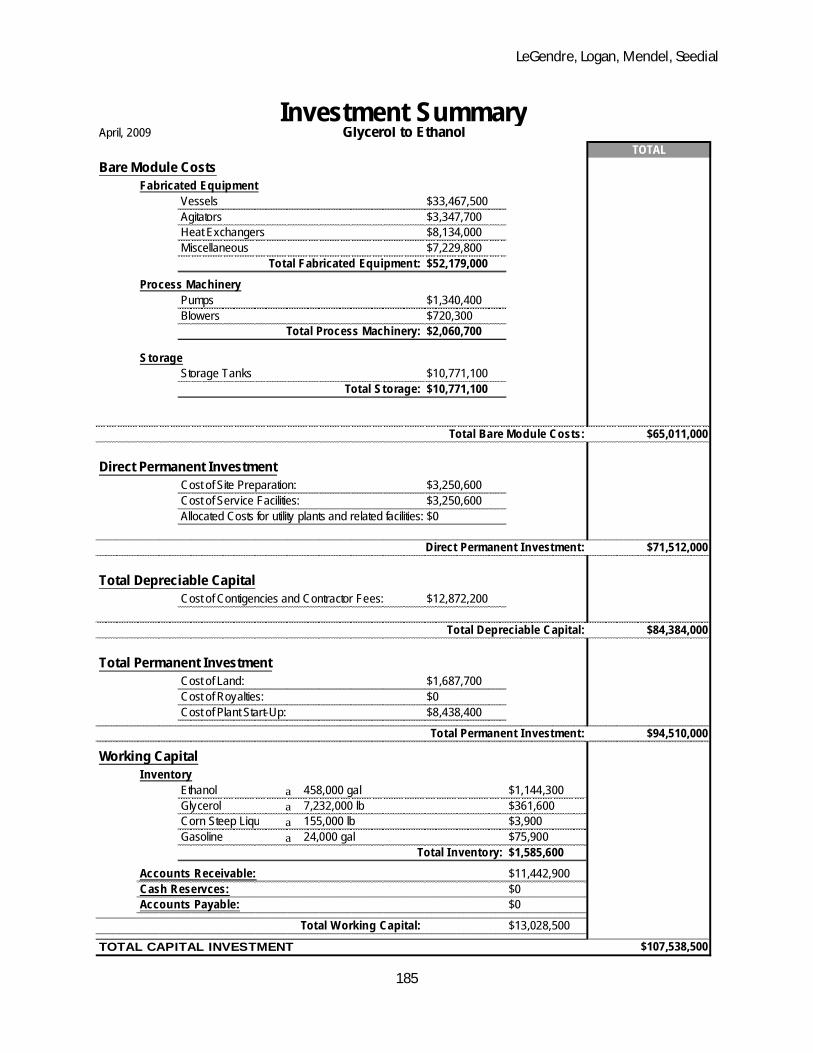
LeGendre, Logan, Mendel, Seedial
185
April, 2009
Bare Module CostsFabricated Equipment
Vessels $33,467,500Agitators $3,347,700Heat Exchangers $8,134,000Miscellaneous $7,229,800
Total Fabricated Equipment: $52,179,000
Process MachineryPumps $1,340,400Blowers $720,300
Total Process Machinery: $2,060,700
StorageStorage Tanks $10,771,100
Total Storage: $10,771,100
Total Bare Module Costs:
Direct Permanent InvestmentCost of Site Preparation: $3,250,600Cost of Service Facilities: $3,250,600Allocated Costs for utility plants and related facilities: $0
Direct Permanent Investment:
Total Depreciable CapitalCost of Contigencies and Contractor Fees: $12,872,200
Total Depreciable Capital:
Total Permanent InvestmentCost of Land: $1,687,700Cost of Royalties: $0Cost of Plant Start-Up: $8,438,400
Total Permanent Investment:
Working CapitalInventory
Ethanol a 458,000 gal $1,144,300Glycerol a 7,232,000 lb $361,600Corn Steep Liquor a 155,000 lb $3,900Gasoline a 24,000 gal $75,900
Total Inventory: $1,585,600
Accounts Receivable: $11,442,900Cash Reservces: $0Accounts Payable: $0
Total Working Capital: $13,028,500
TOTAL CAPITAL INVESTMENT
$94,510,000
$107,538,500
Investment SummaryGlycerol to Ethanol
TOTAL
$65,011,000
$71,512,000
$84,384,000

LeGendre, Logan, Mendel, Seedial
186
April, 2009
Raw MaterialsGlycerolCorn Steep LiquorGasolineTotal Raw Materials:
UtiltiesHigh Pressure SteamLow Pressure SteamProcess WaterCooling WaterElectricityChilled WaterLandfillWaste Water TreatmentTotal Raw Materials:
ByproductsSuccinic AcidTotal Byproducts:
General ExpensesSelling / Transfer:Direct Research:Allocated Research:Administrative Expense:Management Incentives:Total Byproducts:
TOTAL $0.99 per gal of Ethanol $49,893,200 $49,893,200
$0.12 per gal of Ethanol $6,041,800$0.01 per gal of Ethanol $629,400$0.05 per gal of Ethanol $2,517,400$0.03 per gal of Ethanol $1,573,400
$0.29 per gal of Ethanol $14,538,200 $49,893,200
-$0.33 per gal of Ethanol -$16,835,400 $35,355,000
$0.08 per gal of Ethanol $3,776,200
-$0.33 per gal of Ethanol -$16,835,400
$0.07 per gal of Ethanol $3,642,300 $52,190,400$0.00 per gal of Ethanol $35,000
$0.02 per gal of Ethanol $1,119,900$0.00 per gal of Ethanol $9,900$0.01 per gal of Ethanol $680,600
$0.01 per gal of Ethanol $297,000$0.00 per gal of Ethanol $249,000
$48,548,100
$0.01 per gal of Ethanol $336,400$0.02 per gal of Ethanol $914,700
$0.96 per gal of Ethanol $48,548,100$0.17 per gal of Ethanol $8,347,300
Variable Cost SummaryGlycerol to Ethanol
Per gal Ethanol TOTAL
$0.79 per gal of Ethanol $39,775,500$0.01 per gal of Ethanol $425,300
From the Variable Cost Summary, we can see that this process has a low utility cost and suggests
that we have optimized the utility usage. Glycerol makes up 60% of the variable costs when counting
succinic acid as revenue. (On the above spreadsheet, succinic acid revenue is shown as negative cost
rather than as revenue, so glycerol appears to make up 80% of the variable cost.) Succinic acid produces
revenues of $16.8MM per year, composing 12% of total revenue. Total variable costs per gallon of
ethanol are $1.32, and total revenues are $2.83 at the base case.

LeGendre, Logan, Mendel, Seedial
187
April, 2009
OperationsDirect Wages and Benefits: $2,548,000Direct Salaries and Benefits: $382,200Operating Supplies and Services: $152,880Technical Assistance to Manufacturing: $0Control Laboratory: $0
Total Operations: $3,083,080
Maintenance Wages and Benefits: $3,797,280Salaries and Benefits: $949,320Materials and Services: $3,797,280Maintenance Overhead: $189,864
Total Maintenance: $8,733,744
Operating OverheadGeneral Plant Overhead: $545,053Mechanical Department Services: $184,243Employee Relations Department: $452,931Business Services: $568,083
Total Operating Overhead: $1,750,310
Property Insurance and TaxesTotal Property Insurance and Taxes: $1,687,680
TOTAL
$15,254,814
$15,254,814
Fixed Cost SummaryGlycerol to Ethanol
TOTAL
$3,083,080
$11,816,824
$13,567,134
The largest fixed cost the plant will have is maintenance. Maintenance is calculated as a
percentage of installed costs, and therefore, changes in installed costs will affect profitability two fold in
the investment, and in increased fixed costs. Seven operators cost $2.5MM and require $400K in
management.
April, 2009
The Investor's Rate of Return (IRR) for this Project is: 32.24%
The Net Present Value (NPV) at 15% for this Project is: $95,172,000
Profitability MeasuresGlycerol to Ethanol

LeGendre, Logan, Mendel, Seedial
188
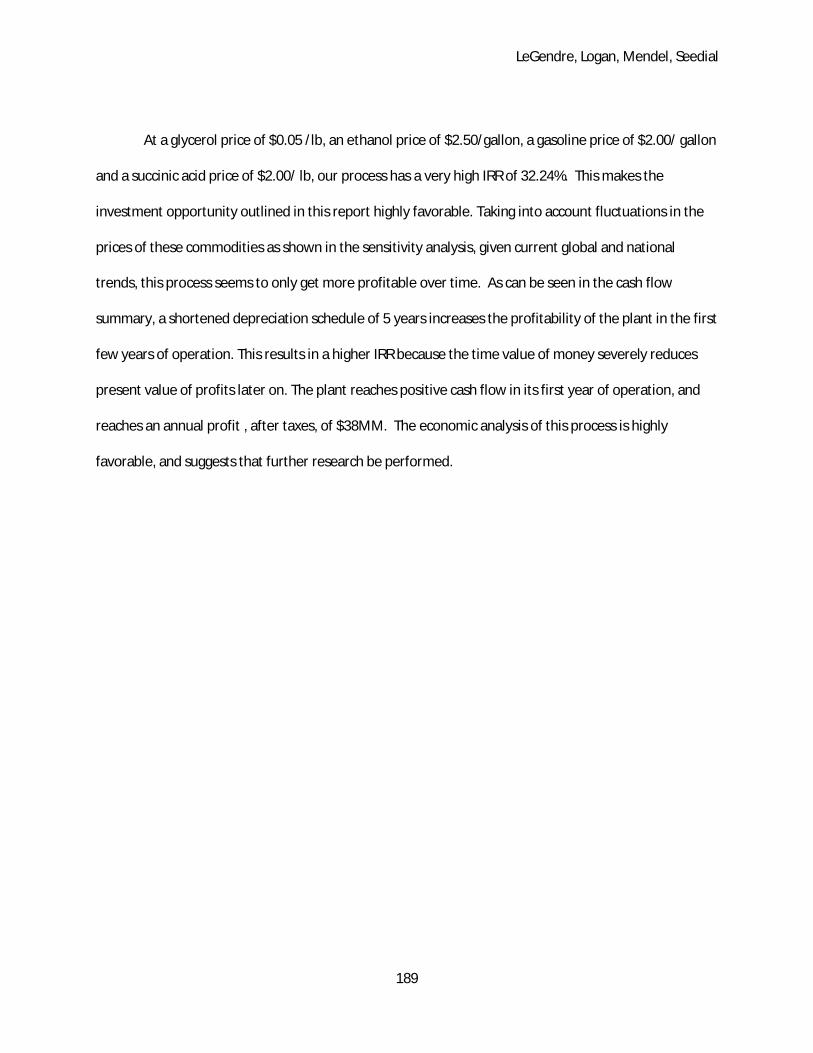
LeGendre, Logan, Mendel, Seedial
189
At a glycerol price of $0.05 /lb, an ethanol price of $2.50/gallon, a gasoline price of $2.00/ gallon
and a succinic acid price of $2.00/ lb, our process has a very high IRR of 32.24%. This makes the
investment opportunity outlined in this report highly favorable. Taking into account fluctuations in the
prices of these commodities as shown in the sensitivity analysis, given current global and national
trends, this process seems to only get more profitable over time. As can be seen in the cash flow
summary, a shortened depreciation schedule of 5 years increases the profitability of the plant in the first
few years of operation. This results in a higher IRR because the time value of money severely reduces
present value of profits later on. The plant reaches positive cash flow in its first year of operation, and
reaches an annual profit , after taxes, of $38MM. The economic analysis of this process is highly
favorable, and suggests that further research be performed.

LeGendre, Logan, Mendel, Seedial
190
Sensitivity Analysis Section XIII

LeGendre, Logan, Mendel, Seedial
191
Sensitivity Analysis
Because the process is connected with the price of oil, both by the price of the feedstock
gasoline (for denaturing) and through the prices of ethanol and glycerol (the connections of which will
be covered shortly), the economics of the plant will likely vary significantly over the projected 15 years
of operation. This likelihood necessitates analyzing the effect of projected trends on the profitability of
the plant. Furthermore, it is important to know what costs and prices significantly affect profitability,
and which affect it less.
The process’s main factors for determining profitability are the price of glycerol, the price of
succinic acid, the price of ethanol, and the price of gasoline. In the base case of $0.05/lb for glycerol,
$2.00/lb for succinic acid, $2.50/gallon ethanol, and $3.15/gallon gasoline, glycerol comprises 60% of
the variable costs of the process while gasoline comprises another 12%. 88% of revenues are provided
by ethanol while the remaining 12% are from succinic acid. Interestingly, there is a significant
correlation between ethanol prices and crude oil prices, along with the more obvious correlation
between gasoline prices and crude oil prices. For this reason a sensitivity analysis was performed on
crude oil instead of both gasoline and ethanol to reduce the number of independent variables. Glycerol
prices are indirectly dependent on crude oil prices because higher crude oil prices drive up biodiesel
production, which increases the glycerol supply, reducing glycerol prices. Quantitative analysis of this
relationship however is not reliable so this correlation is not taken into account in this analysis.
Crude Oil
At the base case, ethanol sales amount to $125MM per year, which is 88% of the annual
revenue. Naturally, profitability is closely related to the price of ethanol. Today wholesale ethanol is
priced at $1.59/gallon. Oil shortages similar to those in the summer of 2008 are predicted by the United
States Department of Energy to drive the price of oil up to close to $125/barrel by 2025. At this price of
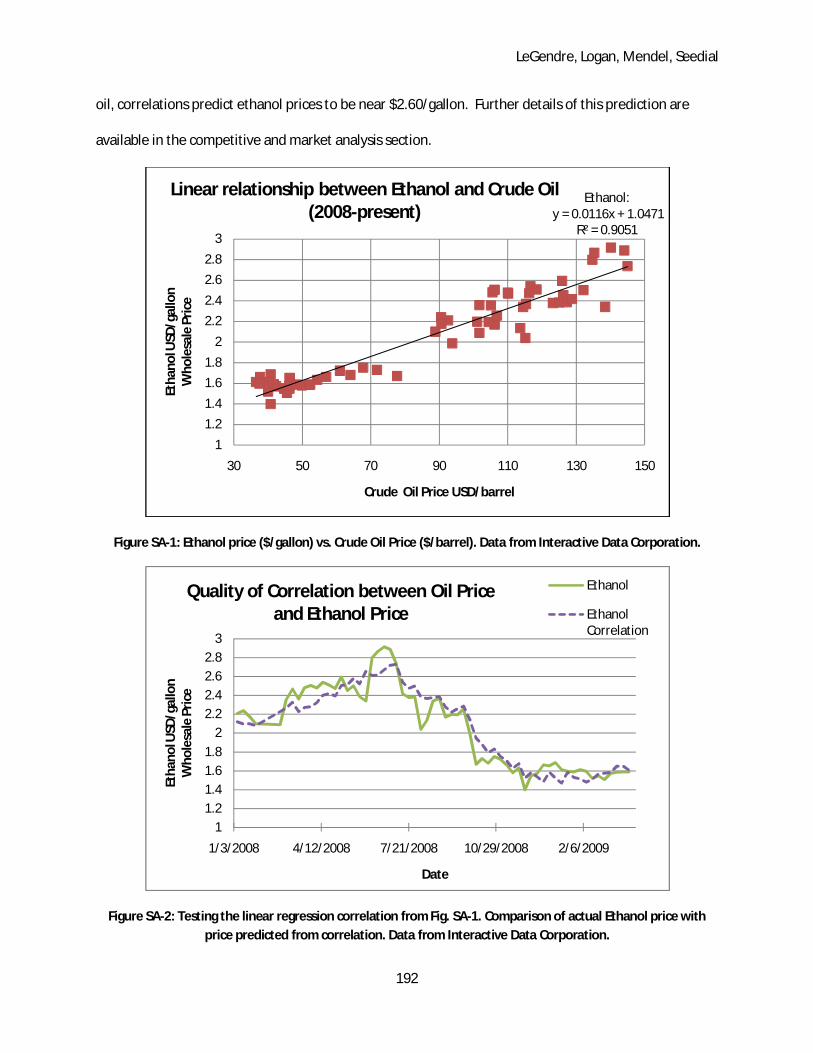
LeGendre, Logan, Mendel, Seedial
192
oil, correlations predict ethanol prices to be near $2.60/gallon. Further details of this prediction are
available in the competitive and market analysis section.
Figure SA-1: Ethanol price ($/gallon) vs. Crude Oil Price ($/barrel). Data from Interactive Data Corporation.
Figure SA-2: Testing the linear regression correlation from Fig. SA-1. Comparison of actual Ethanol price with price predicted from correlation. Data from Interactive Data Corporation.
Ethanol:y = 0.0116x + 1.0471
R² = 0.9051
1
1.2
1.4
1.6
1.8
2
2.2
2.4
2.6
2.8
3
30 50 70 90 110 130 150
Etha
nol U
SD/g
allo
nW
hole
sale
Pri
ce
Crude Oil Price USD/barrel
Linear relationship between Ethanol and Crude Oil (2008-present)
11.21.41.61.8
22.22.42.62.8
3
1/3/2008 4/12/2008 7/21/2008 10/29/2008 2/6/2009
Etha
nol U
SD/g
allo
nW
hole
sale
Pri
ce
Date
Quality of Correlation between Oil Price and Ethanol Price
Ethanol
Ethanol Correlation

LeGendre, Logan, Mendel, Seedial
193
While this correlation between ethanol prices and gasoline prices does show imperfections, it is
significant. This correlation is valid for the time period since ethanol has been significantly used as a
retail fuel (2008) and is caused by the substitute role of ethanol for gasoline. We anticipate the
correlation to remain relevant so long as both gasoline and ethanol share the fuel market.
A similar, but much stronger, correlation exists between oil and gasoline, as would be expected.
Oil is the feed for gasoline and therefore, oil almost completely predicts the price of gasoline.
Furthermore, to ensure that the correlation is not changing, in Figure SA-3, a correlation was calculated
for the prices of oil and gasoline between 1995 and 2000 then projected forward. As can be seen below,
there is almost no difference between this earlier correlation and the long term correlation, suggesting
this correlation will hold for some time.
At the base case, gasoline costs for denaturing ethanol are $8.3MM/year and constitute 12% of
the variable costs of the plant. Variations in the price of gasoline have less effect on the profitability of
the plant than ethanol or glycerol prices; however they are still significant. According to the
correlations, at $2.50/gallon ethanol, gasoline will cost $3.15/gallon. In the crude oil sensitivity analysis,
both the gasoline price and the ethanol price are varied with the use of these correlations with crude oil.
SA-3: Gasoline Price vs. Crude Oil Price. Data for linear regression pricing correlation. Data from Interactive Data Corporation.
y = 0.02552x + 0.10982R² = 0.96828
0
0.5
1
1.5
2
2.5
3
3.5
4
0 50 100 150
Gas
olin
e $/
gallo
n
Crude $/barrel
Gas Price vs. Crude Oil Price for Correlation,Data from 1995-2009
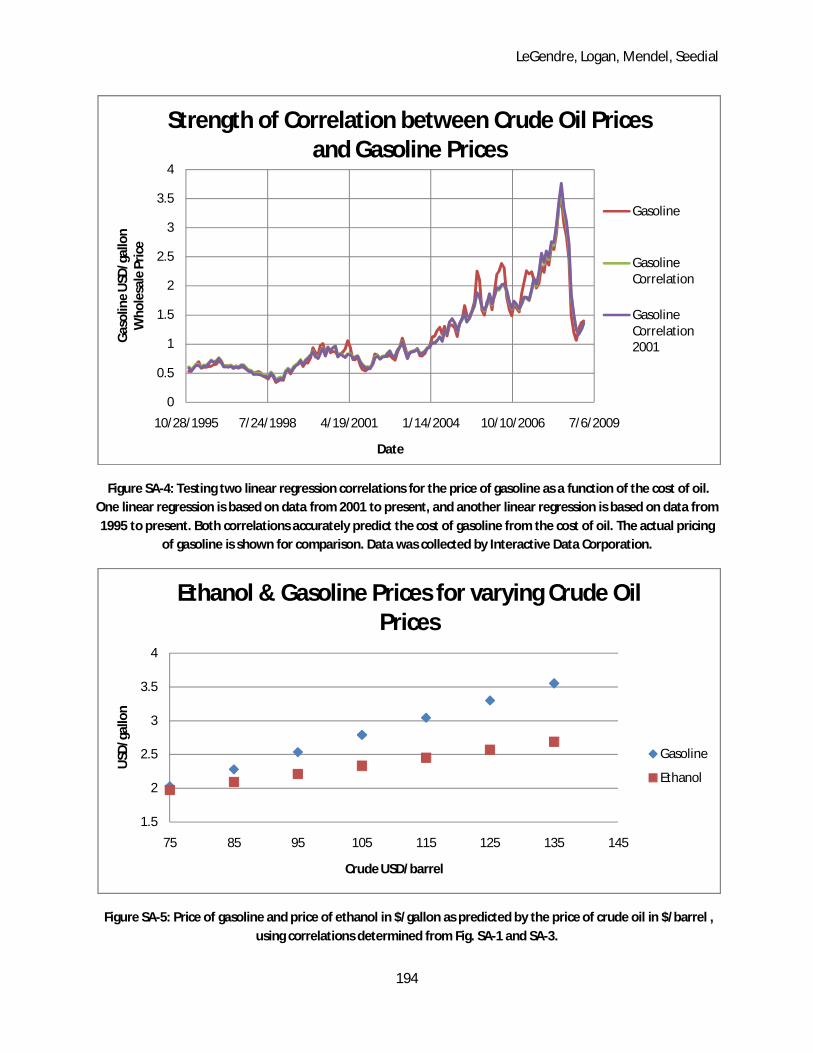
LeGendre, Logan, Mendel, Seedial
194
Figure SA-4: Testing two linear regression correlations for the price of gasoline as a function of the cost of oil. One linear regression is based on data from 2001 to present, and another linear regression is based on data from 1995 to present. Both correlations accurately predict the cost of gasoline from the cost of oil. The actual pricing
of gasoline is shown for comparison. Data was collected by Interactive Data Corporation.
Figure SA-5: Price of gasoline and price of ethanol in $/gallon as predicted by the price of crude oil in $/barrel , using correlations determined from Fig. SA-1 and SA-3.
0
0.5
1
1.5
2
2.5
3
3.5
4
10/28/1995 7/24/1998 4/19/2001 1/14/2004 10/10/2006 7/6/2009
Gas
olin
e U
SD/g
allo
nW
hole
sale
Pri
ce
Date
Strength of Correlation between Crude Oil Prices and Gasoline Prices
Gasoline
Gasoline Correlation
Gasoline Correlation 2001
1.5
2
2.5
3
3.5
4
75 85 95 105 115 125 135 145
USD
/gal
lon
Crude USD/barrel
Ethanol & Gasoline Prices for varying Crude Oil Prices
Gasoline
Ethanol
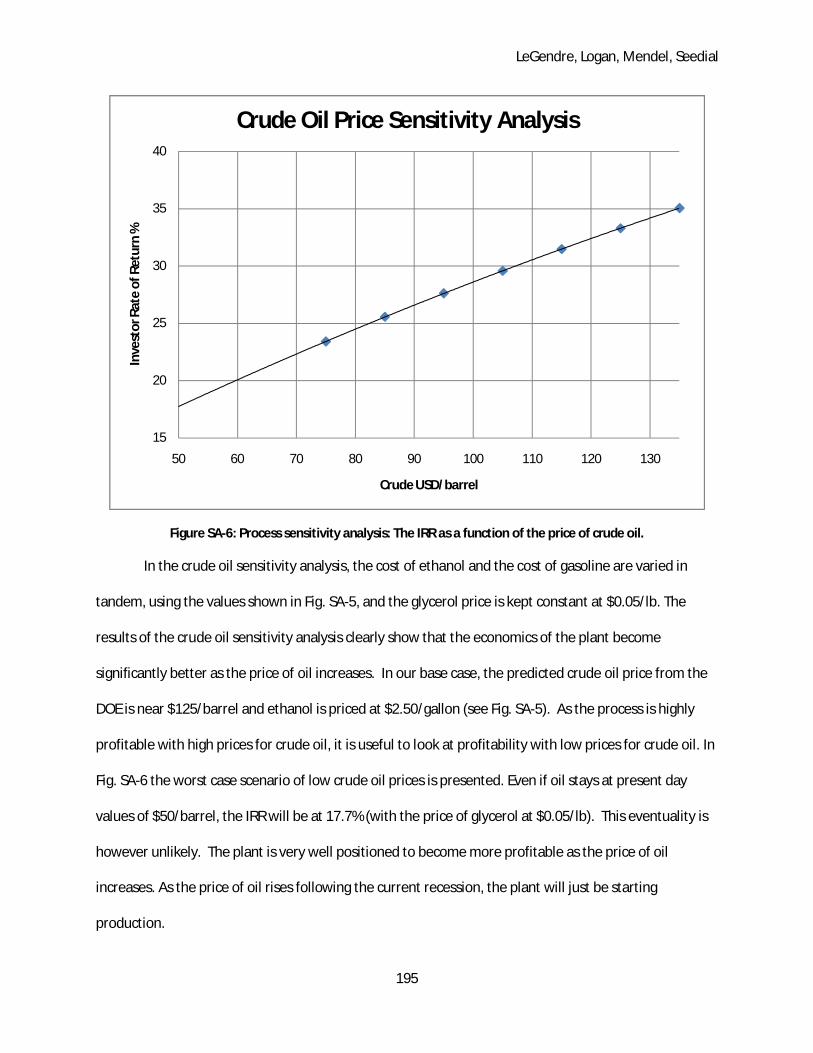
LeGendre, Logan, Mendel, Seedial
195
Figure SA-6: Process sensitivity analysis: The IRR as a function of the price of crude oil.
In the crude oil sensitivity analysis, the cost of ethanol and the cost of gasoline are varied in
tandem, using the values shown in Fig. SA-5, and the glycerol price is kept constant at $0.05/lb. The
results of the crude oil sensitivity analysis clearly show that the economics of the plant become
significantly better as the price of oil increases. In our base case, the predicted crude oil price from the
DOE is near $125/barrel and ethanol is priced at $2.50/gallon (see Fig. SA-5). As the process is highly
profitable with high prices for crude oil, it is useful to look at profitability with low prices for crude oil. In
Fig. SA-6 the worst case scenario of low crude oil prices is presented. Even if oil stays at present day
values of $50/barrel, the IRR will be at 17.7% (with the price of glycerol at $0.05/lb). This eventuality is
however unlikely. The plant is very well positioned to become more profitable as the price of oil
increases. As the price of oil rises following the current recession, the plant will just be starting
production.
15
20
25
30
35
40
50 60 70 80 90 100 110 120 130
Inve
stor
Rat
e of
Ret
urn
%
Crude USD/barrel
Crude Oil Price Sensitivity Analysis

LeGendre, Logan, Mendel, Seedial
196
Glycerol
The price of glycerol has been steadily decreasing over the last few years as the production of
glycerol increases in the biodiesel industry. At the moment, very few processes are able to take
advantage of the glycerol glut. As new processes like this process start up and demand begins to
increase, price may vary significantly until the market reaches equilibrium. Profitability is highly
dependent on glycerol price, if the price of glycerol is above 9.4 cents/lb, the process IRR decreases to
below 15%. If however glycerol continues to be overproduced in comparison to demand, we have the
opportunity to earn an IRR of above 40% at low glycerol prices. The plant is designed to handle crude
glycerol, the cheapest possible glycerol source, to improve profitability. The plant is well placed, as
biodiesel production is growing rapidly (meaning that glycerol production is increasing rapidly as well).
We anticipate a continued glut in the glycerol market making this plant highly profitable.
Figure SA-7: Process sensitivity analysis: The IRR as a function of the price of crude glycerol.
15
20
25
30
35
40
45
50
55
0 1 2 3 4 5 6 7 8 9 10
Inve
stor
Rat
e of
Ret
urn
%
Glycerol cents/lb
Glycerol Sensitivity Analysis
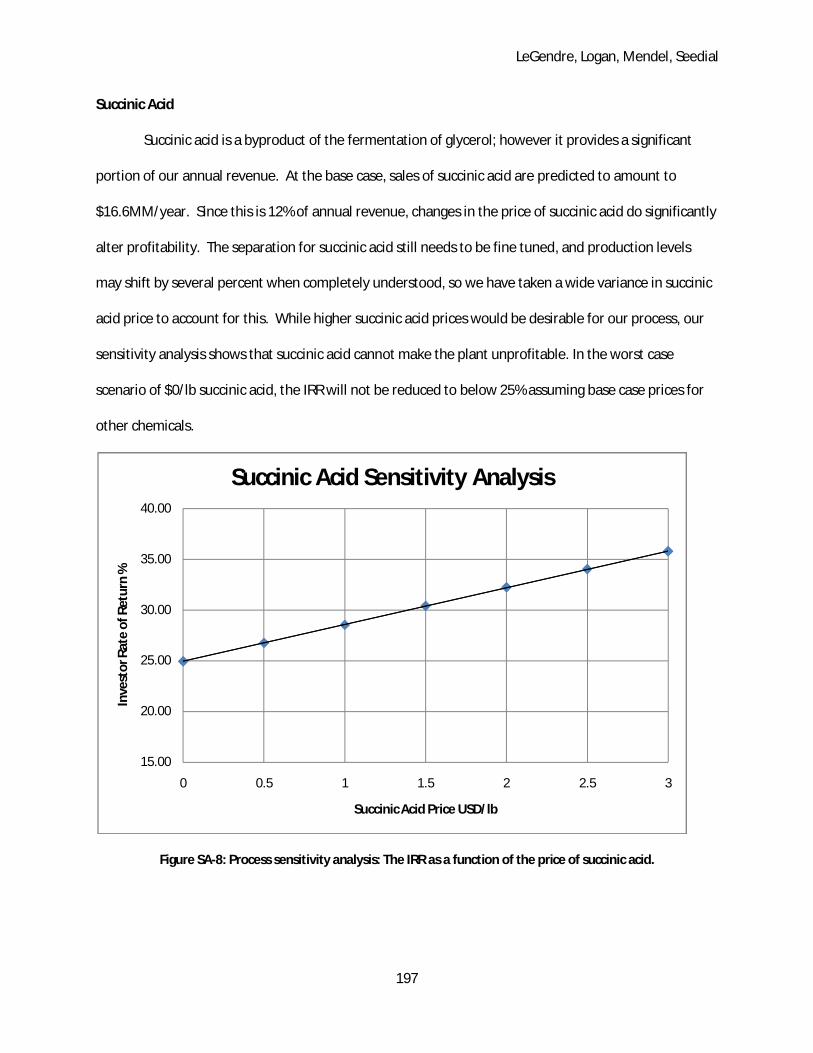
LeGendre, Logan, Mendel, Seedial
197
Succinic Acid
Succinic acid is a byproduct of the fermentation of glycerol; however it provides a significant
portion of our annual revenue. At the base case, sales of succinic acid are predicted to amount to
$16.6MM/year. Since this is 12% of annual revenue, changes in the price of succinic acid do significantly
alter profitability. The separation for succinic acid still needs to be fine tuned, and production levels
may shift by several percent when completely understood, so we have taken a wide variance in succinic
acid price to account for this. While higher succinic acid prices would be desirable for our process, our
sensitivity analysis shows that succinic acid cannot make the plant unprofitable. In the worst case
scenario of $0/lb succinic acid, the IRR will not be reduced to below 25% assuming base case prices for
other chemicals.
Figure SA-8: Process sensitivity analysis: The IRR as a function of the price of succinic acid.
15.00
20.00
25.00
30.00
35.00
40.00
0 0.5 1 1.5 2 2.5 3
Inve
stor
Rat
e of
Ret
urn
%
Succinic Acid Price USD/lb
Succinic Acid Sensitivity Analysis

LeGendre, Logan, Mendel, Seedial
198
Conclusion Section XIV

LeGendre, Logan, Mendel, Seedial
199
Conclusions The report contained herein is an exciting and comprehensive first look at the economic viability
and design of an ethanol plant with a succinic acid byproduct. The economics of this process appear
exceedingly favorable at this time with an IRR of 32.24% and NPV of $95MM in our base case, and with
possibility to be even more lucrative. Furthermore, the process has little risk of being unprofitable, with
the only concern being the unlikely scenario that the price of crude glycerol rises above $0.094/lb.
Further research is needed in laboratory experimentation with the succinic acid separation, as
well as arranging for use of the patent-pending licensed glycerol purification system. Both of these non-
traditional separation systems will require further information, and it is likely that the purchase and
utilities costs will change based on further information and study. Utilities for the glycerol purification
system have been ignored, with the exception of estimation for process water usage. Due to the highly
profitable nature of this plant, the further research and necessary clarifications to the design have little
chance of turning the proposal unprofitable. We find that this is an exciting opportunity deserving of
further resources and attention, particularly with the insight that although our process design made use
of a hypothetical microorganism, existing E. coli have been grown in favorable conditions to ferment
glycerol to ethanol.

LeGendre, Logan, Mendel, Seedial
200
Bibliography Section XV
LeGendre, Logan, Mendel, Seedial
201
Aden, A., et al. “Lignocellulosic Biomass for Ethanol Process Design and Economics Utilizing Co-Current Dilute Acid Prehydrolysis and Enzymatic Hydrolysis for Corn Stover.” NREL/TP-510-32438. (2002).
Agarwal, L. et al. “A cost effective fermentative production of succinic acid from cane molasses and corn steep liquor by Escherichia coli.” Journal of Applied Microbiology. 2 April 2005. Bingaman, Sen. Jeff. "S. 1766 [110th]: Low Carbon Economy Act of 2007 ." govtrack.us. 11 July 2007.
United States Senate. 5 April 2009 <http://www.govtrack.us/congress/bill.xpd?bill=s110-1766>.
Bowen, Diana, Michael Persson, and Felicia Tsaur. 1,3-propanediol from Corn Syrup. Philadelphia: Penn Press, 2008.
Boyd, Jade. "Research yields pricey chemicals from biodiesel waste." 30 June 2008. Bio-Medicine. 5 April 2009 <http://www.bio-medicine.org/biology-news-1/Research-yields-pricey-chemicals-from-biodiesel-waste-3823-2/>.
"Biofuels and Glycerol." The Glycerol Challenge. 30 Mar 2009 <http://theglycerolchallenge.org/>.
"Cap and Trade 101." 16 January 2008. Center for American Progress. 5 April 2009 <http://www.americanprogress.org/issues/2008/01/capandtrade101.html>.
"Chemical Economics Handbook." SRI Consulting. 2009. 5 April 2009 <http://www.sriconsulting.com/CEH/>.
Czarniak, Michelle, Elisa Lau and Candice McLeod. The Capture and Sequestration of Carbon Dioxide. Philadelphia: Penn Press, 2008.
"Disposables in Bioprocessing, Corn to Ethanol Conversion, Biodiesel Production, etc." 2008. Intelligen, Inc. 5 April 2009 <http://www.intelligen.com/literature.shtml>.
Dharmadi, Y., A. Murarka, and R. Gonzalez. “Anaerobic Fermentation of Glycerol by Escherichia Coli: A New Platform for Metabolic Engineering.” Wiley InterScience; New York. 20 May 2006.
"Economy-wide Cap-and-Trade Proposals in the 110th Congress." 30 January 2008. Pew Center on Global Climate Change. 5 April 2009 <http://www.pewclimate.org/docUploads/110th%20Congress%20Economy-wide%20Cap&Trade%20Proposals%2001-30-2008%20-%20Chart.pdf>.
"EERE News." Energy Efficiency and Renewable Energy. 01 April 2009. U.S. Department of Energy. 5 April 2009 <http://apps1.eere.energy.gov/news/enn.cfm>.
Efstathiou, Jim. "Obama to Declare Carbon Dioxide Dangerous Pollutant ." Bloomberg.com. 16 October 2008. Bloomberg L.P.. 5 April 2009 <http://www.bloomberg.com/apps/news?pid=20601082&sid=alHWVvGnkcd4&refer=canada>.

LeGendre, Logan, Mendel, Seedial
202
"Energy Prices." Bloomberg.com. 5 April 2009. Bloomberg L.P.. 5 April 2009 <http://www.bloomberg.com/energy/>.
"Ethanol." 2009. Renewable Fuels Association. 5 April 2009 <http://www.ethanolrfa.org/>.
"Frequently Asked Questions About Trees for Change." SPR 2009. SPR. 5 April 2009 <http://www.srpnet.com/environment/trees/faq.aspx>.
Gallagher, Dan, Janelle Johnson, Andrea Loayza, and Martin Rogers. Glycerol to Propylene glycol. Philadelphia: Penn Press, 2008.
Gonzalez, Ramon and Syed Sham Yazdani. "Anaerobic fermentation of glycerol: a path to economic viability for the biofuels industry." Current Opinion in Biotechnology June 2007, 213-219. 2 April 2009.
Kidwell, Huw. “Bio-succinic acid to go commercial.” 14 January 2008. <http://www.in-pharmatechnologist.com/Materials-Formulation/Bio-succinic-acid-to-go-commerical>
Kwiatkowski et al. “Modeling the Process and Costs of Fuel Ethanol Production by the Corn Dry-Grind Process.” U.S. Department of Agriculture. <www. Intelligen.com/literature.shtml>.
Lefebvre, Ben. "Glycerine (US Gulf) Price Report." Chemical Pricing Information. 3 September 2008. ICIS Pricing. 30 March 2009 <http://www.icispricing.com/il_shared/Samples/SubPage170.asp>.
Lieberman, Sen. Joseph. "S. 2191:[110th] Lieberman-Warner Climate Security Act of 2007." govtrack.us. 5 December 2007. United States Senate. 5 April 2009 <http://www.govtrack.us/congress/bill.xpd?bill=s110-2191>.
McCoy, Michael. "Glycerine Surplus." Chemical and Engineering News February 2006 7. 2 April 2009 <http://pubs.acs.org/cen/news/84/i06/8406notw3.html>.
Meynial-Salles, Isabelle, Sophie Dorotyn, and Philippe Soucaille. “A New Process for the Continuous Production of Succinic Acid From Glucose at High Yield, Titer, and Productivity.” Biotechnology and Engineering 21 May 2007 129-135. 5 April 2009.
Mufson, Steven. "Europe's Problems Color U.S. Plans to Curb Carbon Gases." The Washington Post 9 April 2007 A1. 5 April 2009 <http://www.washingtonpost.com/wp-dyn/content/article/2007/04/08/AR2007040800758_pf.html>.
"National Mining Association." 2008. National Mining Association. 5 April 2009 <http://www.nma.org/>.
OECD - FAO, "Chapter 4. Biofuels." OECD-FAO Agricultural Outlook 2008-2017 14th Ed.(2008) 67-81. 30 Mar 2009 <http://www.oecd.org/pages/0,3417,en_36774715_36775671_1_1_1_1_1,00.html>.
Olver, Rep. John. "H.R. 620 [110th]: Climate Stewardship Act of 2007 ." govtrack.us. 22 January 2007. United States House of Representatives. 5 April 2009 <http://www.govtrack.us/congress/bill.xpd?bill=h110-620>.
LeGendre, Logan, Mendel, Seedial
203
Paster, Mark. “Succinic Acid Fermentation Platform.” U.S. Department of Energy Office of Energy Efficiency and Renewable Energy, Office of the Biomass Program. July 2003. <http://www.productcenter.msu.edu/documents/roa/bio/bio_succinic.pdf>.
Perry, R.H.; Green, D.W. (1997). Perry's Chemical Engineers' Handbook (7th Edition). McGraw-Hill.
"Reducing U.S. Greenhouse Gas Emissions: How Much will it Cost?." DEC 2008. McKinsey & Company. 5 April 2009 <http://www.mckinsey.com/clientservice/ccsi/pdf/US_ghg_final_report.pdf>.
Sanders, Sen. Bernard. "S. 309 [110th] Global Warming Pollution Reduction Act." govtrack.us. 16 January 2007. United States Senate. 5 Apr 2009 <http://www.govtrack.us/congress/bill.xpd?bill=s110-309>.
Schweitzer, Philip A. Handbook of Separation Techniques for Chemical Engineers. 3rd. New York: McGraw-Hill, 1997.
Seider, Warren D., J.D. Seader, and Daniel R. Lewin. Product and Process Design Principles. 2nd ed. New York: John Wiley and Sons, Inc., 2004.
Seider, Warren D., J.D. Seader, and Daniel R. Lewin. Product and Process Design Principles. 3rd ed. New York: John Wiley and Sons, Inc., 2008.
Shuler, Michael L. and Fikret Kargi. Bioprocess Engineering. Upper Saddle River, NJ: Prentice Hall, 1991.
Song et al. “Production of succinic acid by bacterial fermentation.” Enzyme and Microbial Technology. 3 July 2006, Pages 352-361.
"Trees, You, and CO2." The Botanical Society of America. 2008. 5 April 2009 <http://www.botany.org/PlantTalkingPoints/CO2andTrees.php>.
Ulrich, Gael D.. A guide to chemical engineering process design and economics. New York: Wiley, 1984.
Voegele, Erin. "Glycerin's Role in 2009." Biodiesel Magazine December 2008 <http://www.biodieselmagazine.com/article.jsp?article_id=2976&q=&page=1>.

LeGendre, Logan, Mendel, Seedial
204
Acknowledgements Section XVI

LeGendre, Logan, Mendel, Seedial
205
Acknowledgements
We would like to thank Professor Warren D. Seider for the direction he gave our group, his
ideas, and his patience over the course of this project. To Professor Leonard Fabiano, we thank you for
your assistance with the design of agitators and distillation columns, as well as the ideas and support
you provided.
We would like to thank all the industrial consultants, especially Mr. Bruce Vrana, who not only
provided the problem statement, but who served as a sounding board for all our ideas (whether smart
or not).
To our entire class who suffered with us, we thank you for the late nights, the support you
provided, the food and drinks we shared, and the memories of the late nights in the fishbowl. We will
look back on one day with unfounded nostalgia.

LeGendre, Logan, Mendel, Seedial
206
Appendices Section XVII

LeGendre, Logan, Mendel, Seedial
207
Appendix A.
Sensitivity Analysis
Correlation Example
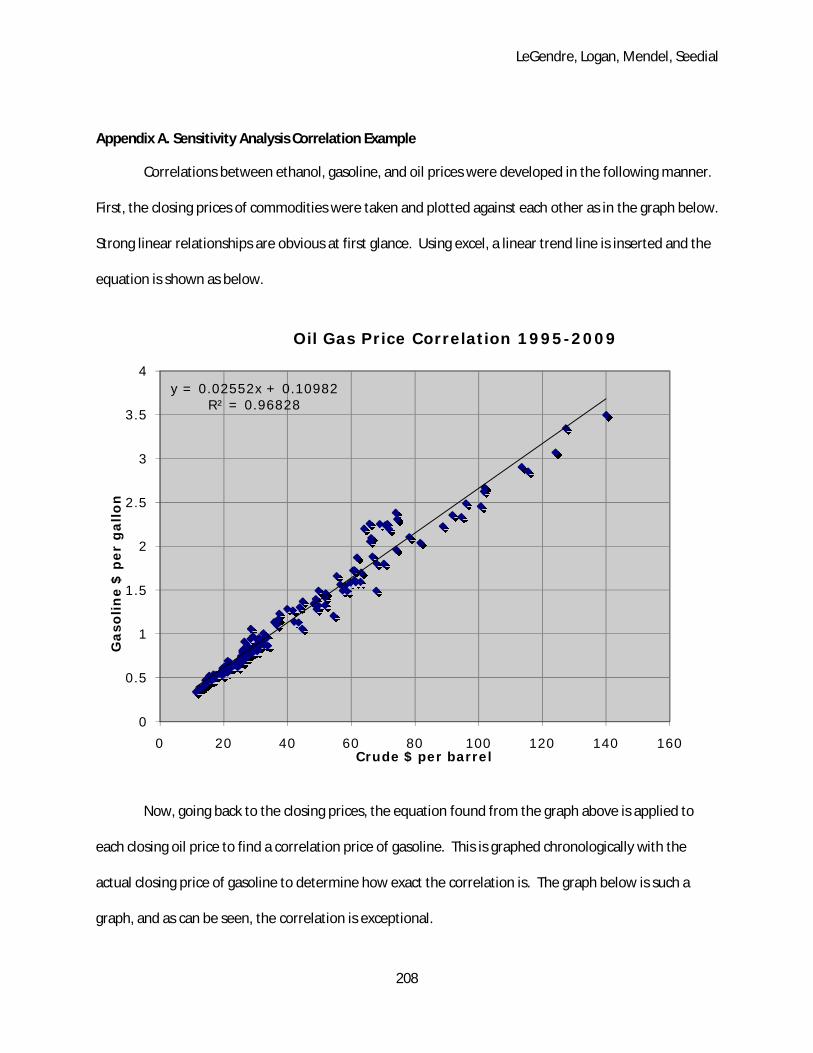
LeGendre, Logan, Mendel, Seedial
208
Appendix A. Sensitivity Analysis Correlation Example
Correlations between ethanol, gasoline, and oil prices were developed in the following manner.
First, the closing prices of commodities were taken and plotted against each other as in the graph below.
Strong linear relationships are obvious at first glance. Using excel, a linear trend line is inserted and the
equation is shown as below.
Now, going back to the closing prices, the equation found from the graph above is applied to
each closing oil price to find a correlation price of gasoline. This is graphed chronologically with the
actual closing price of gasoline to determine how exact the correlation is. The graph below is such a
graph, and as can be seen, the correlation is exceptional.
y = 0.02552x + 0.10982R² = 0.96828
0
0.5
1
1.5
2
2.5
3
3.5
4
0 20 40 60 80 100 120 140 160
Gaso
lin
e $
per
gallo
n
Crude $ per barrel
Oil Gas Price Correlation 1995-2009

LeGendre, Logan, Mendel, Seedial
209
0
0.5
1
1.5
2
2.5
3
3.5
4
10/28/1995 7/24/1998 4/19/2001 1/14/2004 10/10/2006 7/6/2009
Gas
olin
e U
SD/g
allo
nW
hole
sale
Pri
ce
Date
Correlation Strength between Crude Prices and Gasoline Prices
Gasoline
Gasoline Correlation
LeGendre, Logan, Mendel, Seedial
210
Appendix B.
Equipment Costing and Sizing Calculations

LeGendre, Logan, Mendel, Seedial
211
Appendix B. Equipment Costing and Sizing Calculations
Agitators:
Agitators for 2,000,000 L tanks FERM1 (through FERM12) and Broth Storage Tank T-107 are priced and designed based on quotes from supplier The Kahl Company, Inc. (See following page).
Industrial consultant Mr. Bruce Vrana recommended the power requirement factor of 0.1 HP/1,000 gallons of fluid in the tank for the specific application, and this factor was applied to determine the energy requirements and costs of agitators for Seed Ferm 6A/B and Seed Ferm 7A/B. For the mixing agitators (for T-105 and T-108), 2 HP/1,000 gallons of fluid is estimated as an approximation (in range provided in Seider 537). These power requirements are used in tandem with the following equation (for turbine-powered agitators on enclosed tanks) for pricing, including the costs of the motors and shafts (Seider 553). Since the price quote for the agitators is given for 304 stainless steel and the Method of Guthrie for determining installation cost assumes a base cost of equipment in carbon steel, a materials factor of 1.7 was used to determine the carbon steel cost of agitators for Ferm 1-12 and T-107.
= 566394 2850 .
Where S is the motor power requirement, in HP.
Agitator for use in:
Ferm 1-12 T-107 T-105 Seed Ferm 7A/B
Seed Ferm 6A/B T-108
Volume (L) 2,000,000 3,254,965 62,731 650,000 85,000 7,619
Volume (gal) 528,344 859,870 16,307 171,711 22,454 2,012
Power req. (HP) 20.0 20.0 32.6 17.2 2.2 4.0
CP (CE = 394) -- -- $13,992 $14,410 $4,519 $6,303
CP (2009) $75,000 $75,000 $29,900 $20,800 $6,500 $9,100
CPB (2009, for Guthrie)
$ 44,200 $ 44,200 $29,900 $20,800 $6,500 $9,100

LeGendre, Logan, Mendel, Seedial
212
E-mail communication:
Hello Mr. Kahl, I am a chemical engineering student at the University of Pennsylvania designing a chemical plant for my senior design project that uses 2,000,000 L fermenter tanks. Professor Len Fabiano recommended that I ask you about the costs and energy requirements associated with the agitation to be used in these tanks. We are looking for mild agitation, our volume of liquid in the tank is about 1,500,000 L/batch, and the fluid is mostly water. We want to suspend E coli (~0.5 um particles) in the solution and ensure an even temperature distribution in the tanks. The solids content is about .4 % by mass. We are also generating gas in the anaerobic fermentation reaction, at a flow rate of 2415 kg/hr, which we believe will aid in the agitation process. The tanks have a 2:1 aspect ratio, with a height of ~72 ft and a diameter of ~36 ft. I would greatly appreciate any suggestions or help you may be able to provide. Thank you for your time, Chloe LeGendre
Chloe,
I got some information for you for your project that I hope helps.
For this application, using some similar agitators we have sold in the past, you would be looking at a mixer with a 20hp motor, running at about 30 RPM. It would use three 88” hydrofoil impellers. If the shaft and impellers were made out of 304 stainless steel, a rough price of about 75000/each would be right in the ballpark. I hope this helps!
Best Regards,
Nicholas Clucas
The Kahl Company, Inc
Tel: 302-478-8450
Cell: 302-353-7317
Fax: 302-478-4826
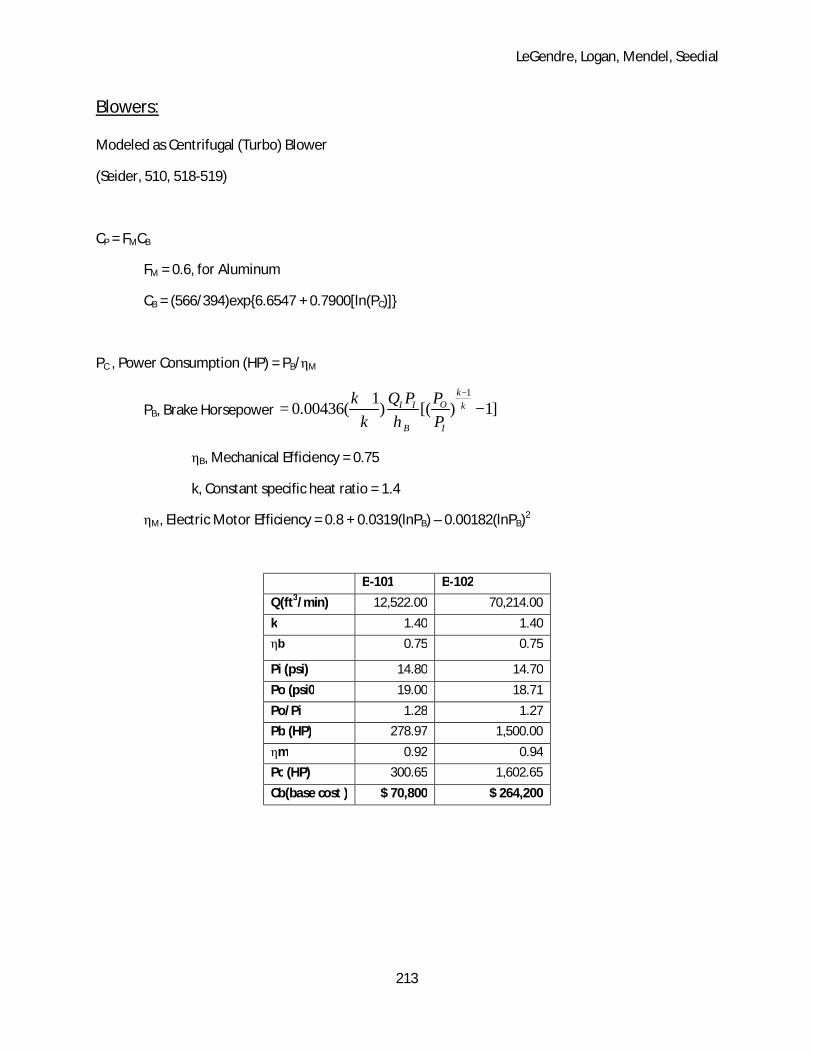
LeGendre, Logan, Mendel, Seedial
213
Blowers:
Modeled as Centrifugal (Turbo) Blower
(Seider, 510, 518-519)
CP = FMCB
FM = 0.6, for Aluminum
CB = (566/394)exp{6.6547 + 0.7900[ln(PC)]}
PC , Power Consumption (HP) = PB/ηM
PB, Brake Horsepower 110.00436( ) [( ) 1]
kOI I k
B I
PQ Pkk Pη
−+= −
ηB, Mechanical Efficiency = 0.75
k, Constant specific heat ratio = 1.4
ηM, Electric Motor Efficiency = 0.8 + 0.0319(lnPB) – 0.00182(lnPB)2
B-101 B-102
Q(ft3/min) 12,522.00 70,214.00
k 1.40 1.40
ηb 0.75 0.75
Pi (psi) 14.80 14.70
Po (psi0 19.00 18.71
Po/Pi 1.28 1.27
Pb (HP) 278.97 1,500.00
ηm 0.92 0.94
Pc (HP) 300.65 1,602.65
Cb(base cost ) $ 70,800 $ 264,200

LeGendre, Logan, Mendel, Seedial
214
Crystallizer (C-1)
Crystallizers are sized by the amount of crystals produced. The process produces 12.23367 tons per day. Price is calculated by the equation from Table 16.32 in Seider (Draft-tube baffled crystallizer), where W is tons of crystals produced per day:
= 566394 $22,200( ) .
CP= $ 107,526
CPB(2009) = $154,500
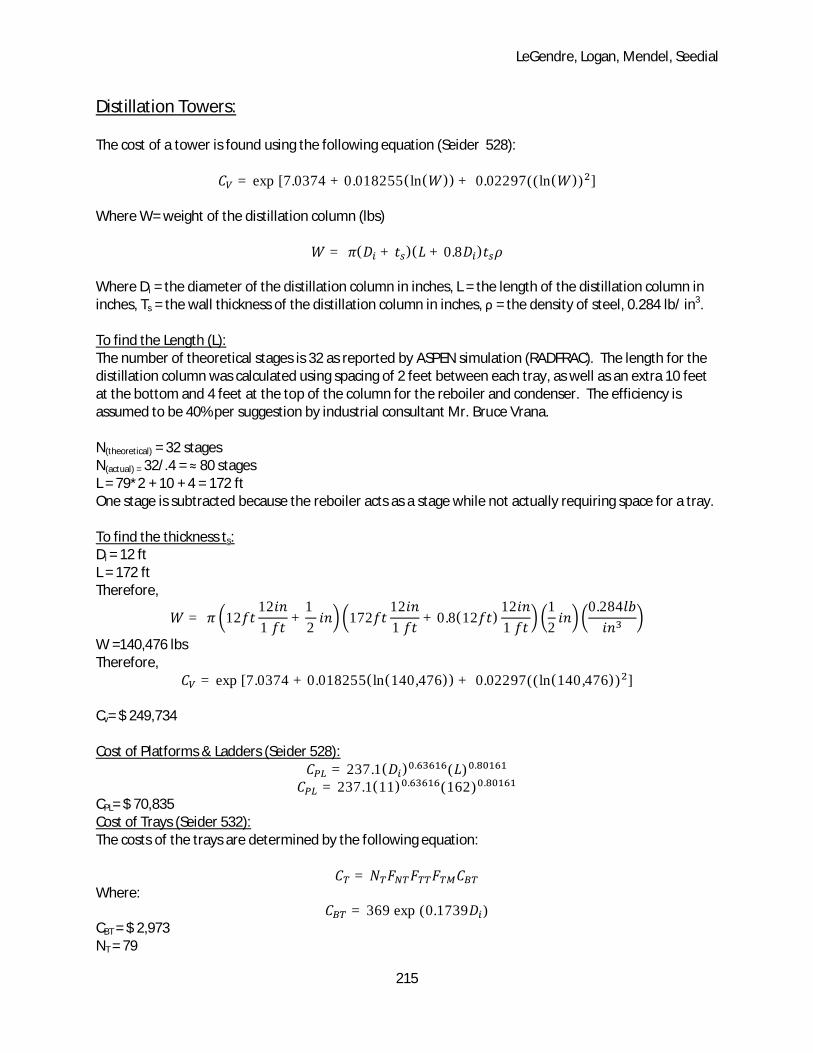
LeGendre, Logan, Mendel, Seedial
215
Distillation Towers:
The cost of a tower is found using the following equation (Seider 528): = exp [7.0374 + 0.018255(ln( )) + 0.02297((ln( )) ] Where W= weight of the distillation column (lbs) = ( + )( + 0.8 ) Where Di = the diameter of the distillation column in inches, L = the length of the distillation column in inches, Ts = the wall thickness of the distillation column in inches, ρ = the density of steel, 0.284 lb/ in3. To find the Length (L): The number of theoretical stages is 32 as reported by ASPEN simulation (RADFRAC). The length for the distillation column was calculated using spacing of 2 feet between each tray, as well as an extra 10 feet at the bottom and 4 feet at the top of the column for the reboiler and condenser. The efficiency is assumed to be 40% per suggestion by industrial consultant Mr. Bruce Vrana. N(theoretical) = 32 stages N(actual) = 32/.4 = ≈ 80 stages L = 79*2 + 10 + 4 = 172 ft One stage is subtracted because the reboiler acts as a stage while not actually requiring space for a tray. To find the thickness ts: Di = 12 ft L = 172 ft Therefore, = 12 12 1 + 1 2 172 12 1 + 0.8(12 ) 12 1 12 0.284
W =140,476 lbs Therefore, = exp [7.0374 + 0.018255(ln(140,476)) + 0.02297((ln(140,476)) ] Cv= $ 249,734 Cost of Platforms & Ladders (Seider 528): = 237.1( ) . ( ) . = 237.1(11) . (162) . CPL= $ 70,835 Cost of Trays (Seider 532): The costs of the trays are determined by the following equation: = Where: = 369 exp (0.1739 ) CBT = $ 2,973 NT = 79

LeGendre, Logan, Mendel, Seedial
216
FNT = 1 (for > 20 trays) FTT = 1 (for Sieve Trays. Industrial Consultant Mr. Bruce Vrana recommends Baffle Trays for the distillation tower, but indicated that this pricing correlation would be conservative, as Baffle Trays are mechanically simpler than Sieve Trays) = 1 ( ) = 74(1)(1)(2.197)($2973) = $234,930 CT= $234,930 CP = total cost of column = 566394 ( + + )
FM=Function of Materials FM= 1 for Carbon Steel CP(2009) = $ 798,000
Distillation Column D-1 Absorber AB-1
Theoretical Stages 32 7
Efficiency 0.4 0.4
Actual Stages 80 17.5
Stages used 80 18
Diameter (Aspen) 12 5.46
Diameter Used (ft) 12 5.5
Length (ft) 172 50
Shell Thickness (in) 0.5 0.3125
Weight (lb) 140,476 12,069
Cost of Vessel $249,734 $48,148
Cost of Platforms & Ladders $70,835 $16,055
Base Cost of Trays $2,973 $960
FTM 1 1
CT $234,930 $17,285
CPB (2009, for Guthrie) $798,000 $117,100
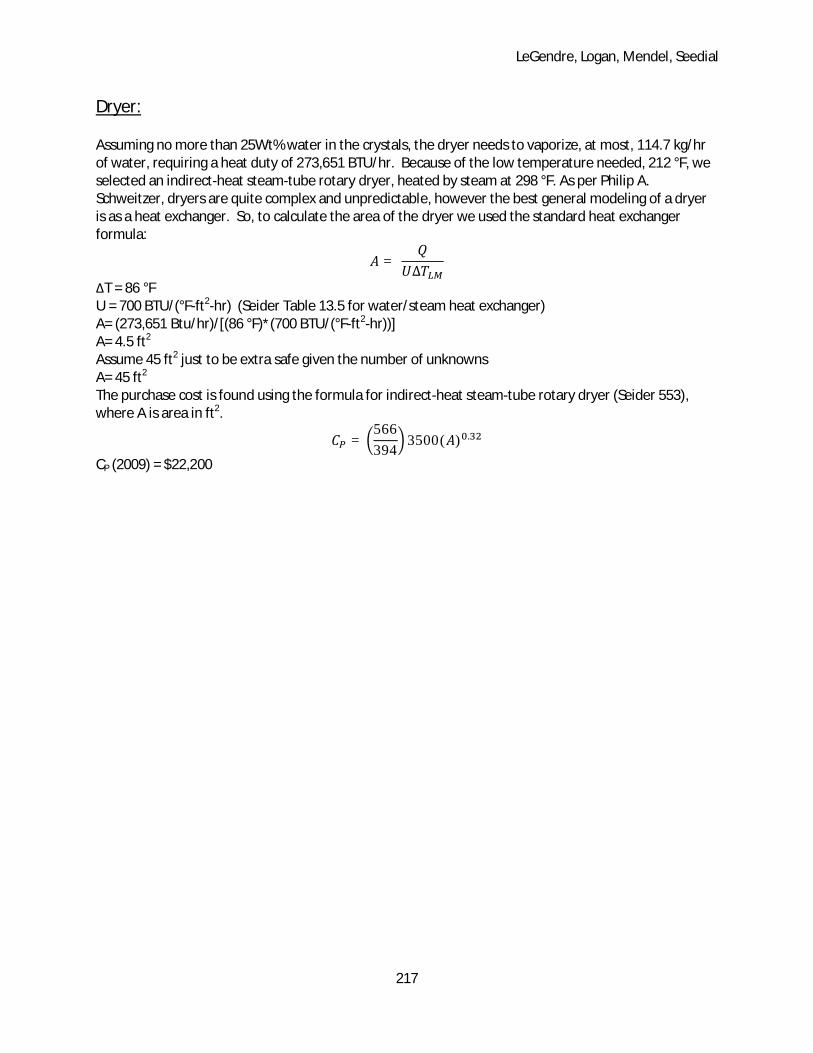
LeGendre, Logan, Mendel, Seedial
217
Dryer:
Assuming no more than 25Wt% water in the crystals, the dryer needs to vaporize, at most, 114.7 kg/hr of water, requiring a heat duty of 273,651 BTU/hr. Because of the low temperature needed, 212 °F, we selected an indirect-heat steam-tube rotary dryer, heated by steam at 298 °F. As per Philip A. Schweitzer, dryers are quite complex and unpredictable, however the best general modeling of a dryer is as a heat exchanger. So, to calculate the area of the dryer we used the standard heat exchanger formula: = ∆
ΔT = 86 °F U = 700 BTU/(°F-ft2-hr) (Seider Table 13.5 for water/steam heat exchanger) A= (273,651 Btu/hr)/[(86 °F)*(700 BTU/(°F-ft2-hr))] A= 4.5 ft2
Assume 45 ft2 just to be extra safe given the number of unknowns A= 45 ft2 The purchase cost is found using the formula for indirect-heat steam-tube rotary dryer (Seider 553), where A is area in ft2. = 566394 3500( ) .
CP (2009) = $22,200

LeGendre, Logan, Mendel, Seedial
218
Electro-dialysis:
According to Perry’s Chemical Engineering Handbook, the price of an electro dialysis plant with a flow rate of 2000 m3/day has a cost of $665,000 in 1993, and that this price is scalable at a 0.7 power. According to the plant cited, the equipment price was $1,210,000 while installation was $600,000, yielding a Bare Module factor of 1.5. Flow rate for electro-dialysis is based on the volume of clean water produced in m3/day. CED=(4,333 m3/2000 m3) (0.7) *$665,000 CED=$1,142,500 Adjusted by the CE index: CED (2009) =CED (1993)/CE (1993)*CE (2009) = $1,142,500/359*566 CED (2009)=$1,801,000 CBM (2009) = $1,801,000 * 1.5 = $2,700,000 Daily Incremental Cost: Perry’s cites typical operating costs of electro dialysis as $133 per 1000 m3 in 1993 dollars Operating Cost = ($133/1000 m3)*(4,333 m3/day)*(330 days/year) Operating Cost = $190,200/year

LeGendre, Logan, Mendel, Seedial
219
External Heat Losses from FERM1-12
Since the majority of the plant equipment will be outdoors, additional calculations need to be done to estimate the heat required to replace any heat lost to the atmosphere by the fermentation tanks. The average temperature of the Gulf Coast was approximated to be the average temperature of Louisiana which is 58 °F .The air velocity was also estimated to be that of Louisiana and that was reported to be 10 MPH. The heat loss from one of the 2,000,000 L fermenters was approximated to be that of a cylinder in cross flow. The Reynolds number was calculated using tabulated values for air at the reported temperatures and velocities using
μ
D V ρReD =
Where ρ- density of the fluid (kg/m3) D - diameter of the cylinder (m)
V - average velocity of the fluid (m/s) μ- viscosity of the fluid (Pa-s)
The heat transfer coefficients may be determined by correlations obtained from dimensional analysis (Incropera & Dewitt).
= ℎ = 0.3 + 0.62 / / 1 + 0.4Pr 1 + 28200
Where h-heat transfer coefficient (SI units: W/(m2K)) d-Diameter of the cylinder (m) Pr-Prandtl number k- thermal conductivity, (SI units : W/(m-K) ) With the heat transfer coefficient calculated the heat dissipation can be calculated from Newton’s Law of cooling. That is Q= h AS(Ts-Tinf) Where As – Surface Area of Cylinder(πDL )( in m2) Tinf –Temperature of Air
Air Temp (K) Film
Temp(K) Density (kg/m^3)
μ x 107(N/m2) k x 103
(W/m-K) Pr
287.4 298.7 1.1614 184.6 26.3 0.707 Diameter Length Re Nu h Q(kW) Q(BTU/hr) Ferm 1 10.820 21.671 3043875.897 3272.024 7.953 58.588 55.529 Seed 6 3.781 7.563 1063748.065 1297.874 9.027 8.110 7.687 Seed 7 7.450 14.900 2095737.894 2339.798 8.260 28.805 27.301
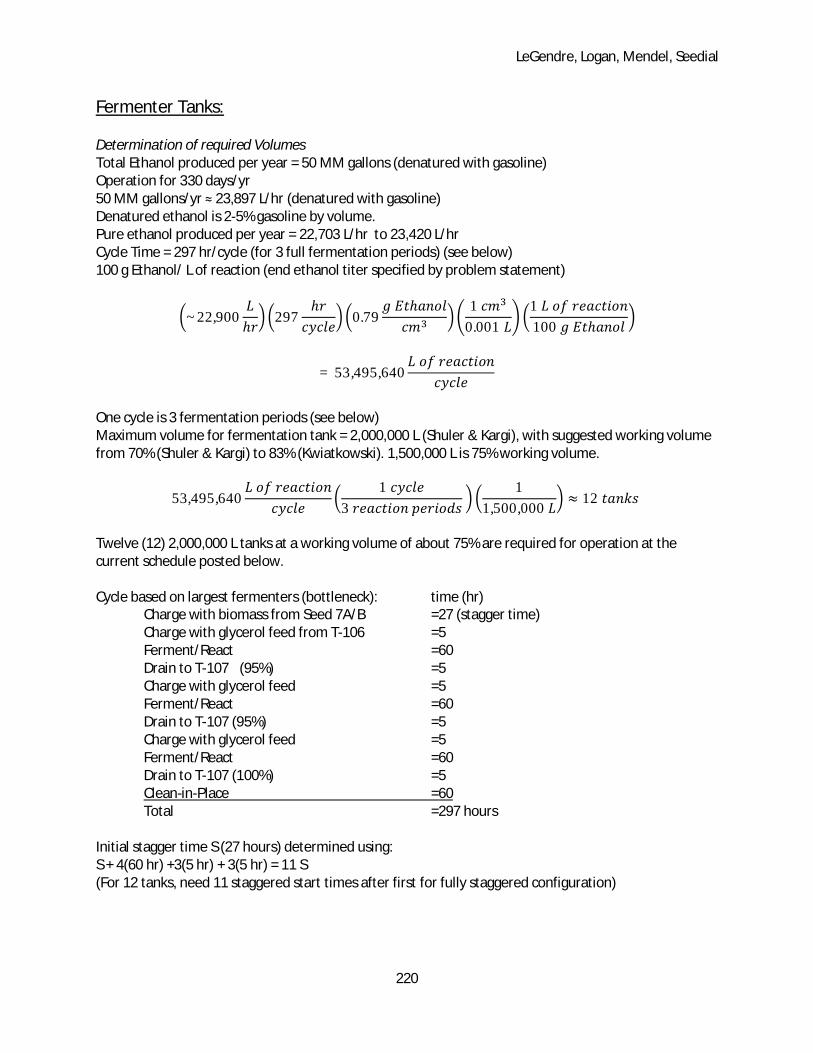
LeGendre, Logan, Mendel, Seedial
220
Fermenter Tanks:
Determination of required Volumes Total Ethanol produced per year = 50 MM gallons (denatured with gasoline) Operation for 330 days/yr 50 MM gallons/yr ≈ 23,897 L/hr (denatured with gasoline) Denatured ethanol is 2-5% gasoline by volume. Pure ethanol produced per year = 22,703 L/hr to 23,420 L/hr Cycle Time = 297 hr/cycle (for 3 full fermentation periods) (see below) 100 g Ethanol/ L of reaction (end ethanol titer specified by problem statement) ~22,900 ℎ 297 ℎ 0.79 ℎ 1 0.001 1 100 ℎ
= 53,495,640
One cycle is 3 fermentation periods (see below) Maximum volume for fermentation tank = 2,000,000 L (Shuler & Kargi), with suggested working volume from 70% (Shuler & Kargi) to 83% (Kwiatkowski). 1,500,000 L is 75% working volume. 53,495,640 1 3 11,500,000 ≈ 12 Twelve (12) 2,000,000 L tanks at a working volume of about 75% are required for operation at the current schedule posted below. Cycle based on largest fermenters (bottleneck): time (hr)
Charge with biomass from Seed 7A/B =27 (stagger time) Charge with glycerol feed from T-106 =5
Ferment/React =60 Drain to T-107 (95%) =5 Charge with glycerol feed =5 Ferment/React =60 Drain to T-107 (95%) =5 Charge with glycerol feed =5 Ferment/React =60 Drain to T-107 (100%) =5 Clean-in-Place =60 Total =297 hours Initial stagger time S (27 hours) determined using: S + 4(60 hr) +3(5 hr) + 3(5 hr) = 11 S (For 12 tanks, need 11 staggered start times after first for fully staggered configuration)

LeGendre, Logan, Mendel, Seedial
221
One cycle consists of three fermentation/ reaction periods or batches, as seen above. All flow rate values in the batch material balance blocks refer to the flow requirements for one batch within each three-batch cycle. The problem statement gives 1.6 g Ethanol formed per L reaction volume per hour, with an end concentration of 100 g Ethanol / L. The 60 hour fermentation time was determined by dimensional analysis: (100 g/L)/(1.6 g/L-hr) = 62.5 hours. However, a small portion of ethanol is fed to each reactor during the seed fermentation seed (5%, or 1/20), and 62.5 * 0.95 ≈ 60 hours. The exception to this is the first stage seed fermenter 1A/B, which is fed only biomass (containing no ethanol) and therefore requires 62.5 hours to reach the required ethanol titer. Glycerol added beyond what could stoichimetrically react to form 100 g ethanol /L would not be consumed, because at higher ethanol concentrations, E. Coli are killed. Accordingly, the design problem statement required that a stoichiometric amount of glycerol be added to form 100 g Ethanol / L of solution. Some of the ethanol produced is vaporized and leaves in the vapor exit streams. The quantity of water and ethanol leaving as vapor are determined using Aspen in a Flash calculation at 37 °C. Approximately 4.9% by mass of the ethanol produced is vaporized, and 0.49 % by mass of the water contents is vaporized, using NRTL property estimations. These figures are calculated using the final contents of the reactions, so they represent a worst case scenario of ethanol and water removed from the liquid phase (as less ethanol exists in solution for the majority of the reaction time). Accordingly, dilute glycerol feed was added to stoichiometrically react to form the 100 g Ethanol / L of solution as if none were to evaporate, since the evaporation quantity was an estimate. The liquid exit streams, as a result of the evaporation calculations, appear to have ~95 g Ethanol/ L. The process begins with 1 mL of biomass/ E. coli cells, specified in the design problem statement, referred to as the inoculum from the laboratory. The problem states that each successive reactor can be 20 times as large as the previous reactor, so the first stage of fermentation (Seed Ferm. 1A/1B) has a working volume of about 20 mL. (19.1 mL of glycerol feedstock is added to the 1 mL inoculum, but the volume at the end of the 62.5 hour period is ~ 19.4 mL). Seed Ferm 1A is charged with a 1 mL inoculum sample, as is Seed Ferm 1B. Each starts a separate seed fermentation train (Train A and Train B). The reaction occurs, and as per the problem statement, 98% of the glycerol reacts to form ethanol, while 1% reacts to form succinic acid and 1% reacts to form biomass. The reactions were entered into SuperPro designer for the mass balance information, with 98% glycerol conversion for the ethanol reaction. This reaction was first in series with the two parallel reactions of 50% conversion of the remaining glycerol to succinic acid and 50% conversion of the glycerol to biomass. Glycerol à CO2 + H2 + Ethanol CO2 + Glycerol à Succinic Acid + H2O Glycerol à 3.0075(Biomass) + H2O (Biomass has a molecular weight of 24.63 g/mol) The contents of Seed Fermenter 1A is then transferred to Seed Fermeter 2A. Seed Fermenters 2A/B have working volumes of approximately (20 mL *20) = 400 mL. The appropriate stoichiometric quantity of glycerol was determined using SuperPro designer for all stages. After the next 60 hours of reaction, the contents of Seed Ferm 2A/B are transferred to Seed Ferm 3A/B, with a working volume of about (400 L)*20 = 8 L. Following this trend, seed Fermenters 4A/B have working volumes of about (8 L *20) =

LeGendre, Logan, Mendel, Seedial
222
160 L, seed Fermenters 5A/B have working volumes of about (160 L *20) = 3200 L, and seed Fermenters 6A/B have working volumes of about (3,200 L *20) = 64,000 L. The precise working volume of the final large scale fermenter is 1,577,642 L upon charging, and 1,525,404 L at the end of the reaction. The portion of seed volume required to charge these large scale fermentation tanks (1/20) of this volume, is therefore between 76,270 and 78,882 L. A value of 77,090 L was chosen to represent the required charging volume per tank, and 12 seed portions of this size were required, six for each fermentation train. Accordingly, 77,090 x 6 = 460,000 L was chosen as the approximate working volume of seed fermenters 7A/B, even though this volume only represents a multiplication factor of about 7 from the scaling up to 7A/B from 6A/B. (The initial working volume of seed fermenters 7A/B is 471,800 L, and the final working volume is 457,000 L). The alternative of having one fermentation train with Seed 7A as 77,090 L x 12 portions was not selected, as the draining from this tank to the twelve larger tanks followed by a significant cleaning time of ~60 hours represented a bottleneck in the process. The addition of a second seed fermentation train, with the final volume of seed fermenter 7A/B split into six portions for charging the main fermenters, removed this bottleneck.

LeGendre, Logan, Mendel, Seedial
223
Fermenter Tank Costs
Tanks Seed 1A/B, Seed 2A/B, Seed 3A/B, and Seed 4A/B are considered too small to contribute to the overall cost estimate. L/D Aspect Ratio for all tanks = 2:1 (Shuler & Kargi). L and D are determined by volume requirement (formula for volume of cylinder is used). The SuperPro Designer “Ethanol Dry Grind Process Model” (Kwiatkowski et al.) includes cost estimates “based on equipment and operating costs and descriptions obtained from industry sources” for 304 Stainless Steel Fermentation tanks of 1.9 MM L volume (≈ volume of FERM1) and 650,000 L (≈ volume of Seed Ferm 7A/B) volumes with 3:1 or 2:1 aspect ratios. These figures are used to estimate the costs of units FERM1 (through FERM-12) and Seed Ferm 7A/B, as the heights and diameters of these vessels are outside the boundaries for applying cost estimation formulas found in many resources. The value for (FMCV) from the Kwiatkowski model for the 1.9 MM L 304 Stainless steel tank was $470,000 (CE index = 526). The value for (FMCV) for the 650,000 L 304 Stainless steel tank was $197,000 (CE index = 526). The carbon steel value for the base cost of the vessels (for input into the Guthrie Model to determine the installation cost) was determined by dividing the cost of the stainless tower by 1.7, the materials factor for 304 Stainless Steel for vertical vessels. Tanks Seed Ferm 5A/B and Seed Ferm 6A/B were estimated by methods in Seider (527-529) as vertical pressure vessels: = + = exp [7.0374 + 0.018255(ln( )) + 0.02297((ln( )) ] = ( + )( + 0.8 ) = 237.1( ) . ( ) . ( 3 < < 24 , 27 < < 170 , ) = 285.1( ) . ( ) . ( 3 < < 21 , 12 < < 40 , ) Where W is weight of the vessel in lb, Di is the diameter of the vessel, and L is the height or length of the vessel. ρ was taken as 0.284 lb/in3 for steel, and ts was found using the table for minimum wall thickness at the top of page 530 (Seider). FM was taken as 1, as the Guthire Model requires costs of vessels made of carbon steel. Ferm 1 (-- Ferm 12) Seed Ferm 7A/B Seed Ferm 6A/B Seed Ferm 5A/B
Diameter Used (ft) 35.55 24.44 12.41 4.66
Length (ft) 71.10 48.88 24.81 9.32
Shell Thickness (in) -- -- 0.25 0.25
Weight (lb) -- -- 13,865.04 1,960.18
Cost of Vessel $470,000.00 $197,000.00 $52,453.33 $17,006.02
CPL $69,397.61 $40,541.47 $17,768.47 $4,308.41
Cost of Tower (Stainless Steel)
$539,397.61 $237,541.47 -- --
CP (2009, for Guthrie) $341,500 $150,400 $100,900 $30,700
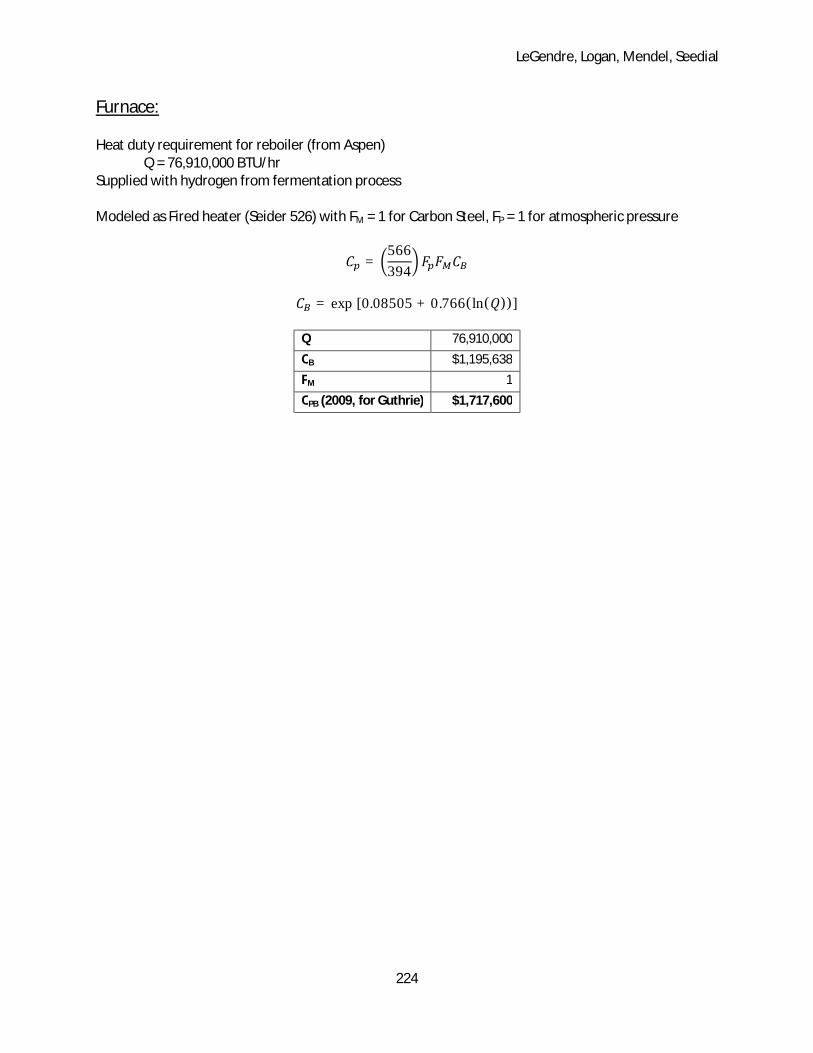
LeGendre, Logan, Mendel, Seedial
224
Furnace:
Heat duty requirement for reboiler (from Aspen) Q = 76,910,000 BTU/hr Supplied with hydrogen from fermentation process Modeled as Fired heater (Seider 526) with FM = 1 for Carbon Steel, FP = 1 for atmospheric pressure = 566394
= exp [0.08505 + 0.766(ln( ))]
Q 76,910,000
CB $1,195,638
FM 1
CPB (2009, for Guthrie) $1,717,600

LeGendre, Logan, Mendel, Seedial
225
Glycerol Purification System:
Although the glycerol purification system is a combination of reverse osmosis, electro/pressure membrane separation, and electro-dialysis, and is a licensed unit available for purchase from EET Corporation, a price is estimated for the system first as reverse osmosis and then as electro-dialysis. A price quote from the company was unavailable. As Reverse Osmosis: Stream S-FP-104 is the “purified stream” with flow rate = 32,356 L/hr = 205,142 gal/day Approximated as Brackish Water purification (Seider 554): CBM = 2.1*Q With Q in gal/day. CBM = $ 430,800 As Electro-dialysis (using equations above): Stream S-FP-104 Q = 205,142 gal/day = 776 m3/day CED= $ 178,300 CED (2009)=$281,100 CBM (2009)=$421,700 The larger of the costs, that for Reverse Osmosis, was chosen as a starting value for the glycerol purification system installation cost. However, these correlations are provided for purifying water, not a glycerol/water solution.
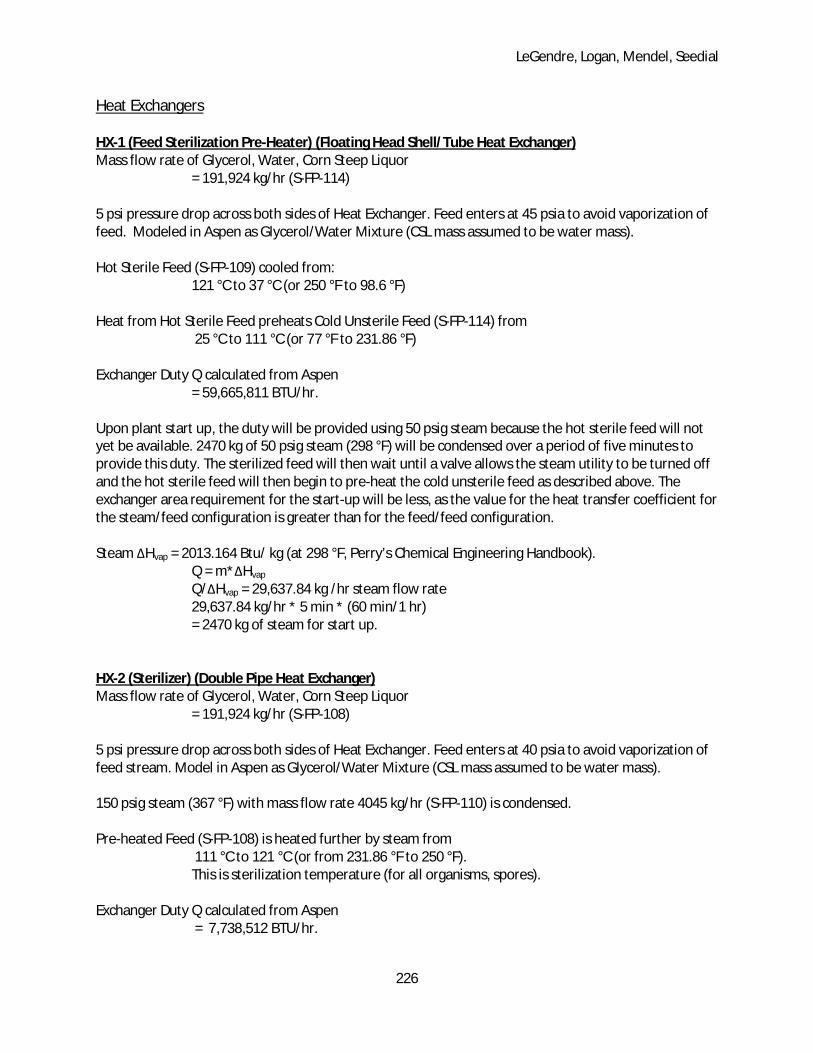
LeGendre, Logan, Mendel, Seedial
226
Heat Exchangers
HX-1 (Feed Sterilization Pre-Heater) (Floating Head Shell/Tube Heat Exchanger) Mass flow rate of Glycerol, Water, Corn Steep Liquor
= 191,924 kg/hr (S-FP-114) 5 psi pressure drop across both sides of Heat Exchanger. Feed enters at 45 psia to avoid vaporization of feed. Modeled in Aspen as Glycerol/Water Mixture (CSL mass assumed to be water mass). Hot Sterile Feed (S-FP-109) cooled from:
121 °C to 37 °C (or 250 °F to 98.6 °F) Heat from Hot Sterile Feed preheats Cold Unsterile Feed (S-FP-114) from
25 °C to 111 °C (or 77 °F to 231.86 °F) Exchanger Duty Q calculated from Aspen
= 59,665,811 BTU/hr. Upon plant start up, the duty will be provided using 50 psig steam because the hot sterile feed will not yet be available. 2470 kg of 50 psig steam (298 °F) will be condensed over a period of five minutes to provide this duty. The sterilized feed will then wait until a valve allows the steam utility to be turned off and the hot sterile feed will then begin to pre-heat the cold unsterile feed as described above. The exchanger area requirement for the start-up will be less, as the value for the heat transfer coefficient for the steam/feed configuration is greater than for the feed/feed configuration. Steam ∆Hvap = 2013.164 Btu/ kg (at 298 °F, Perry’s Chemical Engineering Handbook).
Q = m*∆Hvap Q/∆Hvap = 29,637.84 kg /hr steam flow rate 29,637.84 kg/hr * 5 min * (60 min/1 hr) = 2470 kg of steam for start up.
HX-2 (Sterilizer) (Double Pipe Heat Exchanger) Mass flow rate of Glycerol, Water, Corn Steep Liquor
= 191,924 kg/hr (S-FP-108) 5 psi pressure drop across both sides of Heat Exchanger. Feed enters at 40 psia to avoid vaporization of feed stream. Model in Aspen as Glycerol/Water Mixture (CSL mass assumed to be water mass). 150 psig steam (367 °F) with mass flow rate 4045 kg/hr (S-FP-110) is condensed. Pre-heated Feed (S-FP-108) is heated further by steam from
111 °C to 121 °C (or from 231.86 °F to 250 °F). This is sterilization temperature (for all organisms, spores).
Exchanger Duty Q calculated from Aspen
= 7,738,512 BTU/hr.
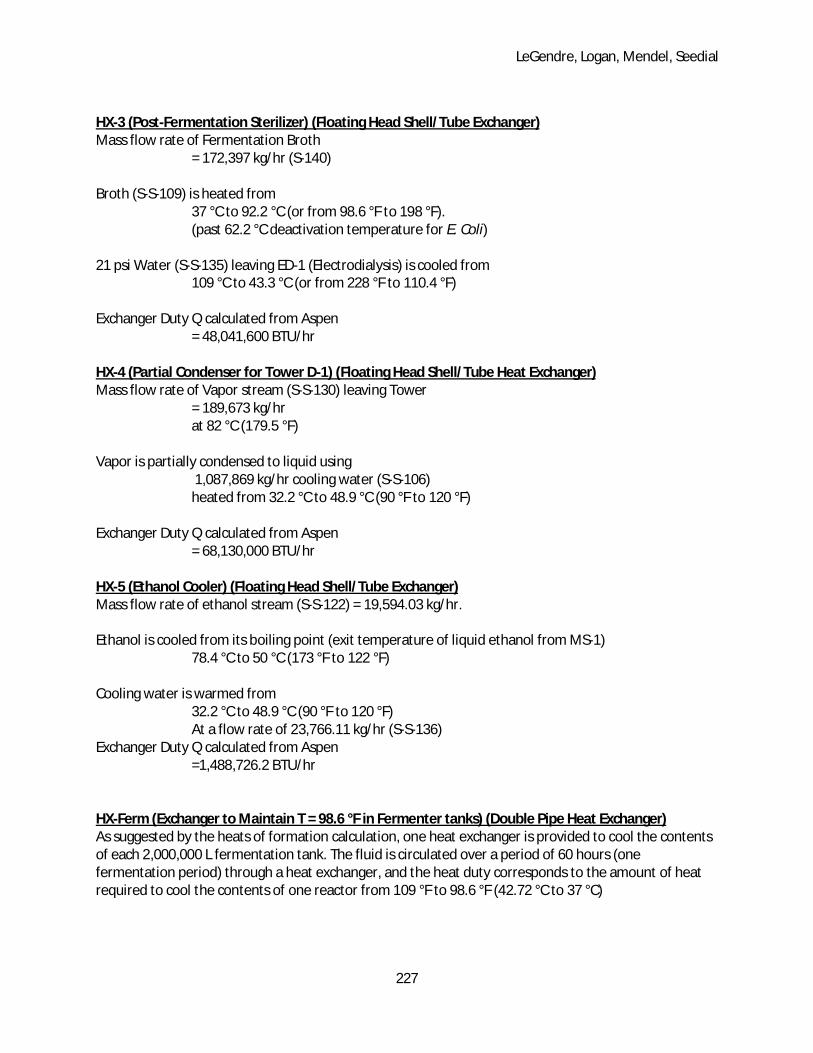
LeGendre, Logan, Mendel, Seedial
227
HX-3 (Post-Fermentation Sterilizer) (Floating Head Shell/Tube Exchanger) Mass flow rate of Fermentation Broth
= 172,397 kg/hr (S-140) Broth (S-S-109) is heated from
37 °C to 92.2 °C (or from 98.6 °F to 198 °F). (past 62.2 °C deactivation temperature for E. Coli)
21 psi Water (S-S-135) leaving ED-1 (Electrodialysis) is cooled from 109 °C to 43.3 °C (or from 228 °F to 110.4 °F) Exchanger Duty Q calculated from Aspen
= 48,041,600 BTU/hr HX-4 (Partial Condenser for Tower D-1) (Floating Head Shell/Tube Heat Exchanger) Mass flow rate of Vapor stream (S-S-130) leaving Tower
= 189,673 kg/hr at 82 °C (179.5 °F)
Vapor is partially condensed to liquid using
1,087,869 kg/hr cooling water (S-S-106) heated from 32.2 °C to 48.9 °C (90 °F to 120 °F)
Exchanger Duty Q calculated from Aspen = 68,130,000 BTU/hr
HX-5 (Ethanol Cooler) (Floating Head Shell/Tube Exchanger) Mass flow rate of ethanol stream (S-S-122) = 19,594.03 kg/hr. Ethanol is cooled from its boiling point (exit temperature of liquid ethanol from MS-1)
78.4 °C to 50 °C (173 °F to 122 °F) Cooling water is warmed from 32.2 °C to 48.9 °C (90 °F to 120 °F) At a flow rate of 23,766.11 kg/hr (S-S-136) Exchanger Duty Q calculated from Aspen =1,488,726.2 BTU/hr HX-Ferm (Exchanger to Maintain T = 98.6 °F in Fermenter tanks) (Double Pipe Heat Exchanger) As suggested by the heats of formation calculation, one heat exchanger is provided to cool the contents of each 2,000,000 L fermentation tank. The fluid is circulated over a period of 60 hours (one fermentation period) through a heat exchanger, and the heat duty corresponds to the amount of heat required to cool the contents of one reactor from 109 °F to 98.6 °F (42.72 °C to 37 °C)
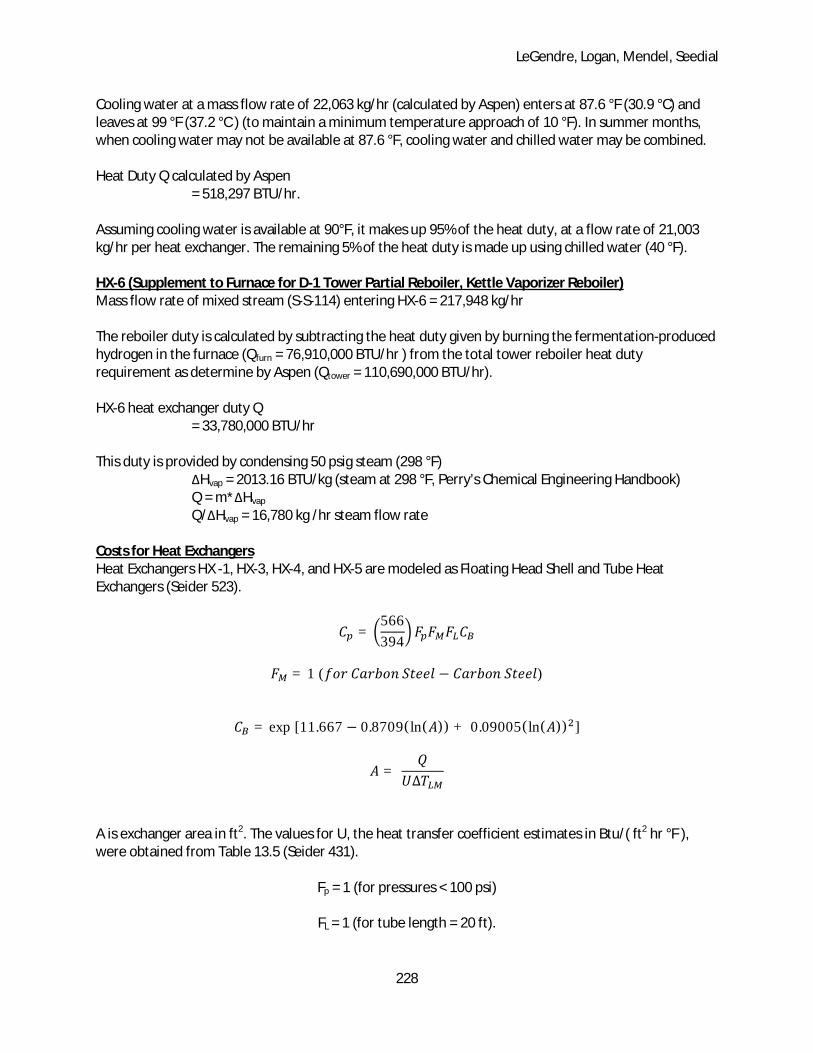
LeGendre, Logan, Mendel, Seedial
228
Cooling water at a mass flow rate of 22,063 kg/hr (calculated by Aspen) enters at 87.6 °F (30.9 °C) and leaves at 99 °F (37.2 °C ) (to maintain a minimum temperature approach of 10 °F). In summer months, when cooling water may not be available at 87.6 °F, cooling water and chilled water may be combined. Heat Duty Q calculated by Aspen = 518,297 BTU/hr. Assuming cooling water is available at 90°F, it makes up 95% of the heat duty, at a flow rate of 21,003 kg/hr per heat exchanger. The remaining 5% of the heat duty is made up using chilled water (40 °F). HX-6 (Supplement to Furnace for D-1 Tower Partial Reboiler, Kettle Vaporizer Reboiler) Mass flow rate of mixed stream (S-S-114) entering HX-6 = 217,948 kg/hr The reboiler duty is calculated by subtracting the heat duty given by burning the fermentation-produced hydrogen in the furnace (Qfurn = 76,910,000 BTU/hr ) from the total tower reboiler heat duty requirement as determine by Aspen (Qtower = 110,690,000 BTU/hr). HX-6 heat exchanger duty Q
= 33,780,000 BTU/hr This duty is provided by condensing 50 psig steam (298 °F)
∆Hvap = 2013.16 BTU/kg (steam at 298 °F, Perry’s Chemical Engineering Handbook) Q = m*∆Hvap Q/∆Hvap = 16,780 kg /hr steam flow rate
Costs for Heat Exchangers Heat Exchangers HX -1, HX-3, HX-4, and HX-5 are modeled as Floating Head Shell and Tube Heat Exchangers (Seider 523). = 566394
= 1 ( − ) = exp [11.667 − 0.8709(ln( )) + 0.09005(ln( )) ] = ∆
A is exchanger area in ft2. The values for U, the heat transfer coefficient estimates in Btu/( ft2 hr °F ), were obtained from Table 13.5 (Seider 431).
Fp = 1 (for pressures < 100 psi)
FL = 1 (for tube length = 20 ft).

LeGendre, Logan, Mendel, Seedial
229
Heat Exchangers HX-1 HX-2 HX-3 HX-4 HX-5
Q (BTU/hr) 59,665,811 7,738,512 48,041,600 68,130,000 1,488,726
U (BTU/(hr-ft2-°F) 250 200 250 200 150
∆TLM (°F) 19.82 120 19.22 73.48 41.66
A (ft2) 12,042 321 9,997 4,636 239
CB $ 92,061 $ 15,348 $ 79,269 $45,808 $ 14,734
FM 1 1 1 1 1
CPB ( 2009, for Guthrie) $ 132,300 $ 22,100 $ 113,900 $ 65,900 $ 21,200
Heat Exchanger HX-Ferm is modeled as a Double Pipe Heat Exchanger (Seider 524) due to smaller exchanger area requirements. It is modeled as carbon steel shell side / carbon steel tube side for placement into the Guthrie method. This gives FM = 1. For pressures less than 600 psig, FP = 1. The value for U is given in Table 13.5 (Seider 431). = 566394
= exp [7.1248 + 0.16(ln( ))] = ∆
Heat Exchangers HX-FERM
Q (BTU/hr) 518,297
U (BTU/(hr-ft2-°F) 250.00
∆TLM (°F) 10.49
A (ft2) 197.635
CB $ 2,894
FM 1
CPB (2009, for Guthrie) $4,200
Heat Exchanger HX-6 is modeled as a Kettle Vaporizer type Heat Exchanger (Seider 523) due to its functionality as the supplement to the partial reboiler for the distillation column D-1. The value for U, the heat transfer coefficient estimates in Btu/( ft2 hr °F ), was obtained from Table 13.5 (Seider 431). = 566394
= 1 ( − ) = exp [11.967 − 0.8709(ln( )) + 0.09005(ln( )) ]
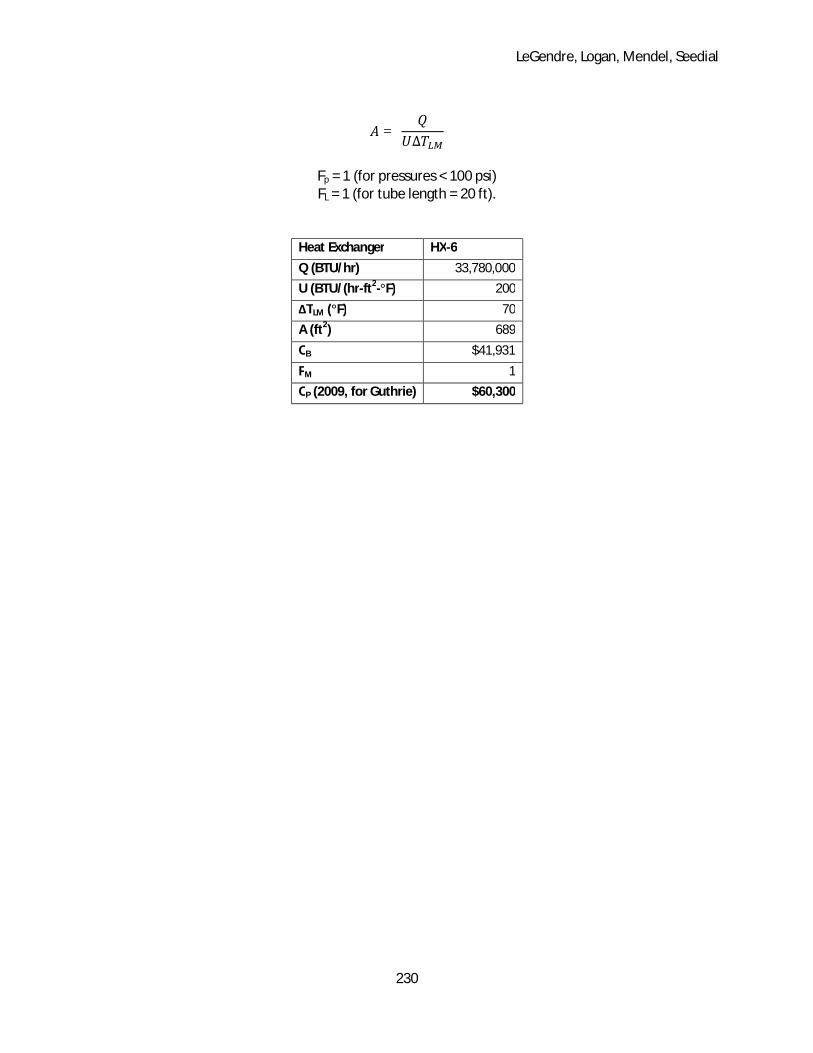
LeGendre, Logan, Mendel, Seedial
230
= ∆
Fp = 1 (for pressures < 100 psi) FL = 1 (for tube length = 20 ft).
Heat Exchanger HX-6
Q (BTU/hr) 33,780,000
U (BTU/(hr-ft2-°F) 200
∆TLM (°F) 70
A (ft2) 689
CB $41,931
FM 1
CP (2009, for Guthrie) $60,300
LeGendre, Logan, Mendel, Seedial
231
Heat of Reaction Calculation for determining Temperature Change in Reactors
Glycerol Heat of Formation = -655.9 kJ/mol Ethanol Heat of Formation =-277.63 kJ/mol Carbon Dioxide Heat of Formation =-393.5 kJ/mol Hydrogen Heat of Formation =0 kJ/mol Primary Reaction Glycerol à Ethanol + CO2 + H2 ∆Hrxn = -5.23 kJ/mol of Ethanol formed (exothermic reaction) Ethanol formation rate in largest reactor: 3,181.96 kmol over 60 hours = 53,032.79 mol/hr = -277,361 kJ/hr Q = CPmT Q = -277,361 kJ/hr CP = 38.08 kJ/kmol-K (mostly water in solution) m = 76129.39 kmol in reactor (water, ethanol, glycerol) (S-132) T = -0.095 K/hr (Temperature rise) Over 60 hours, corresponds to adiabatic temperature rise of 5.74 K = Change from 37 °C to 42.74 °C (or from 98.6 °F to 109 °F) (This temperature rise is used to determine the heat duty for HX-FERM)

LeGendre, Logan, Mendel, Seedial
232
Molecular Sieves:
According to the problem statement, a packaged unit for drying ethanol with molecular sieves costs $2.5 million for a 34,000 lb/hr pure ethanol basis, with a scaling exponent of 0.6. Our flow rate of ethanol is 39,761.59 lb/hr so:
= 39,761.5934,000 . ($2,500,000)
CP=$2,746,200
Incremental costs suggested by the problem statement are below:
Incremental Electricity = (.002 kWhr/lb)*($.060/kWhr)*(39761.59 lb/hr)
Incremental Electricity = $4.77139/hr
Incremental Steam =(.04lb/lb)*($3.00/1000lb)*( 39761.59 lb/hr)
Incremental Steam =$4.77139/hr
Incremental Cooling Water = (3 gal/lb)*($.075/1000 gal)*( 39761.59 lb/hr)
Incremental Cooling Water = $8.94636/hr

LeGendre, Logan, Mendel, Seedial
233
Pumps
Modeled as Centrifugal Pumps (Seider 506-514) Cp = (566/394)*(C pump + C motor) S=Q (H)0.5 Where S = Size Factor Q = flow rate through the pump (GPM) H = Pump head (ft) Pump head calculated from H=pressure rise/liquid density Where ΔP= (ρ *g/gc* h)+ 172,500 Pa (corresponds to 25 psi drop across piping) For pumps with unknown ending fluid heights a pressure change corresponding to 50 psi was used. The pressure rise of the fluid entering the sterilizer heat exchanger network is 45 psi. All other pumps were put in place to continue fluid flow opposing frictional pipe wall forces rather than increasing fluid pressure for processing. Pump Cost, Cpump
Cpump =FT FMCB
FM =1 for carbon steel FT = 1 for 50-900 gpm, 50-400 ft Pump Head Or FT =2 for 250-5000 gpm , 50-500 ft Pump Head CB= exp{ 9.2951-0.06019*ln(S) + 0.0519*ln(S)2} Motor Cost, Cmotor
Cmotor = FT CB
FT = 1.8, for explosion –proof enclosure 3600 rpm, 1-250 Hp CB = exp{ 5.4866 + 0.13141*ln(Pc) + 0.053255*ln(Pc)
2 + 0.028628*ln(Pc)3 -0.0035549* ln(Pc)
4} Pc, Power Consumption(Hp)=(QH ρ)/(33,000ηpηM) ηp, Fractional efficiency of pump=-0.316+0.24015*(lnQ)-0.01199*(ln Q)2
ηM,, Fractional Efficiency of motor=0.8+0.0319*lnPB -0.00182*ln (PB)2
PB=(QH ρ)/(3300* ηp)

LeGendre, Logan, Mendel, Seedial
234
Pumps for Feed Preparation Section
Pump P-FP-01 P-FP-02 P-FP-03 P-FP-04 P-FP-05 P-FP-06
Flow rate(L/hr) 35,169.79 151,104.80 927.42 32,356.21 4,832.32 185,192.86
density of stream(kg/L) 1.23 1.00 1.00 1.23 1.36 1.04
Height of column entering(m) 2.06 2.06 2.06 2.74 6.51
density of stream(kg/m3) 1233.16 1000.00 1000.00 1233.16 1359.00 1036.39
Pressure(Pa) (not incl. 25 psi drop) 0.00 20201.73 20201.73 24912.03 36491.78 66221.38
Head (Pa) 28.55 37.23 19.64 16.32 15.68 40.45
Head (ft) 93.64 122.11 64.43 53.53 51.42 132.66
Flow rate( gallons per min) 154.85 665.31 4.08 142.46 21.28 815.40
S=Q(H^0.5) 1498.45 7351.84 32.78 1042.28 152.57 9391.84
Cp PUMP (carbon steel, CE =394) $2,140.70 $3,133.98 $2,506.60 $2,035.90 $1,960.30 $3,401.86
Q (gpm) 154.85 665.31 4.08 142.46 21.28 815.40
ηP 0.59 0.74 0.60 0.58 0.31 0.76
density of stream (lb/gal) 10.29 8.35 8.35 10.29 11.34 8.65
PB (Hp) 7.66 27.82 0.11 4.10 1.23 37.55
ηB 0.82 0.83 0.76 0.82 0.80 0.83
PC (Hp) 9.34 33.68 0.15 5.02 1.53 45.43
Cb motor $531.95 $1,493.51 $177.28 $377.58 $258.31 $1,999.77
Cp motor (CE = 394) $957.51 $2,688.32 $319.11 $679.65 $464.96 $3,599.59
Cp total (motor + pump) (2009, For Guthrie )
$4,500 $8,400 $4,100 $3,900 $3,500 $10,100
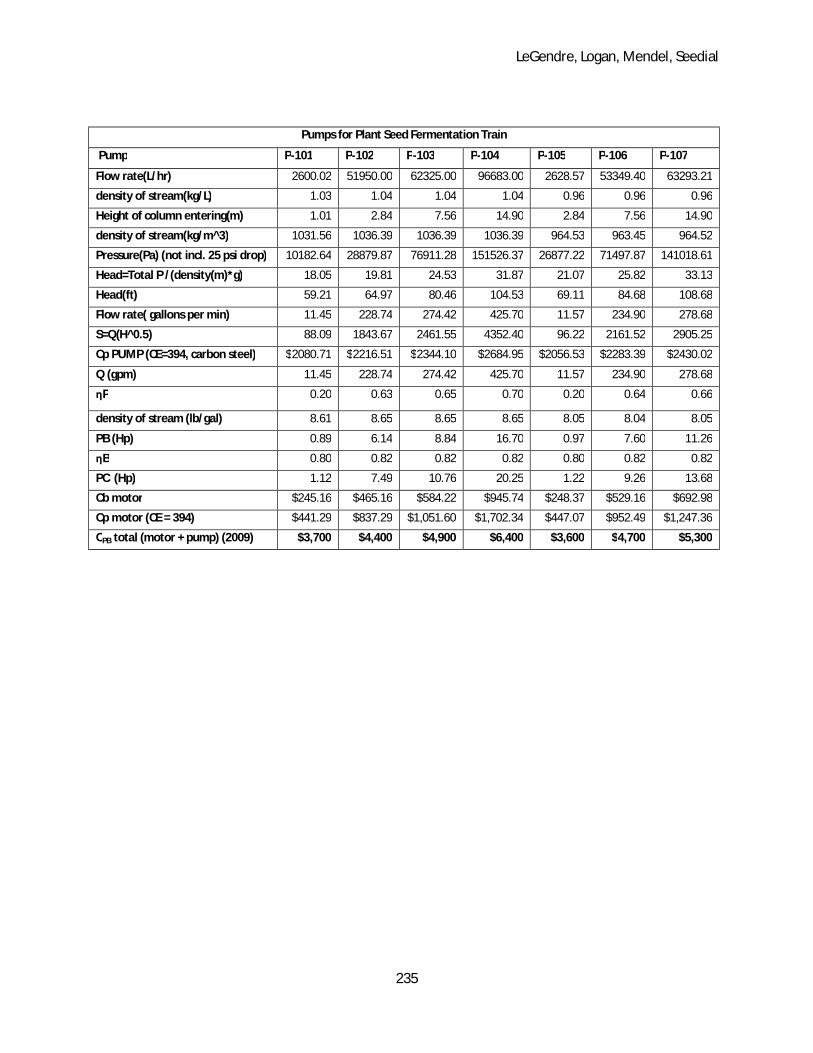
LeGendre, Logan, Mendel, Seedial
235
Pumps for Plant Seed Fermentation Train
Pump P-101 P-102 P-103 P-104 P-105 P-106 P-107
Flow rate(L/hr) 2600.02 51950.00 62325.00 96683.00 2628.57 53349.40 63293.21
density of stream(kg/L) 1.03 1.04 1.04 1.04 0.96 0.96 0.96
Height of column entering(m) 1.01 2.84 7.56 14.90 2.84 7.56 14.90
density of stream(kg/m^3) 1031.56 1036.39 1036.39 1036.39 964.53 963.45 964.52
Pressure(Pa) (not incl. 25 psi drop) 10182.64 28879.87 76911.28 151526.37 26877.22 71497.87 141018.61
Head=Total P /(density(m)*g) 18.05 19.81 24.53 31.87 21.07 25.82 33.13
Head(ft) 59.21 64.97 80.46 104.53 69.11 84.68 108.68
Flow rate( gallons per min) 11.45 228.74 274.42 425.70 11.57 234.90 278.68
S=Q(H^0.5) 88.09 1843.67 2461.55 4352.40 96.22 2161.52 2905.25
Cp PUMP (CE=394, carbon steel) $2080.71 $2216.51 $2344.10 $2684.95 $2056.53 $2283.39 $2430.02
Q (gpm) 11.45 228.74 274.42 425.70 11.57 234.90 278.68
ηP 0.20 0.63 0.65 0.70 0.20 0.64 0.66
density of stream (lb/gal) 8.61 8.65 8.65 8.65 8.05 8.04 8.05
PB (Hp) 0.89 6.14 8.84 16.70 0.97 7.60 11.26
ηB 0.80 0.82 0.82 0.82 0.80 0.82 0.82
PC (Hp) 1.12 7.49 10.76 20.25 1.22 9.26 13.68
Cb motor $245.16 $465.16 $584.22 $945.74 $248.37 $529.16 $692.98
Cp motor (CE = 394) $441.29 $837.29 $1,051.60 $1,702.34 $447.07 $952.49 $1,247.36
CPB total (motor + pump) (2009) $3,700 $4,400 $4,900 $6,400 $3,600 $4,700 $5,300
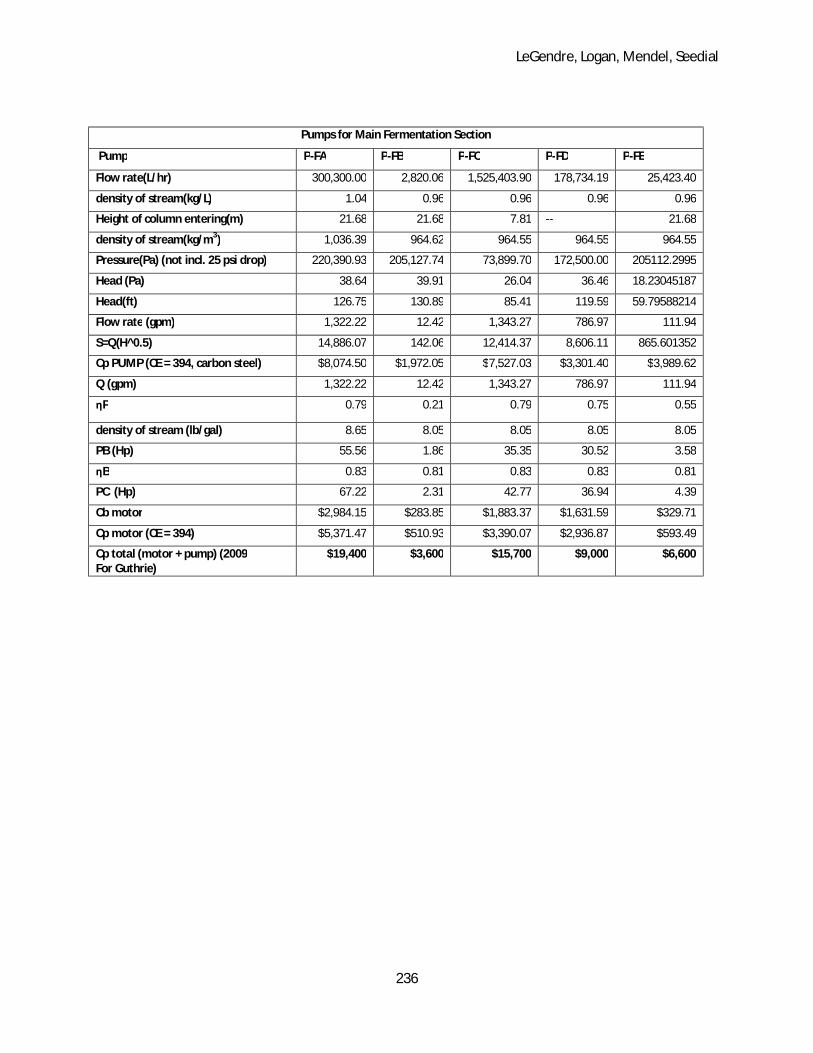
LeGendre, Logan, Mendel, Seedial
236
Pumps for Main Fermentation Section
Pump P-FA P-FB P-FC P-FD P-FE
Flow rate(L/hr) 300,300.00 2,820.06 1,525,403.90 178,734.19 25,423.40
density of stream(kg/L) 1.04 0.96 0.96 0.96 0.96
Height of column entering(m) 21.68 21.68 7.81 -- 21.68
density of stream(kg/m3) 1,036.39 964.62 964.55 964.55 964.55
Pressure(Pa) (not incl. 25 psi drop) 220,390.93 205,127.74 73,899.70 172,500.00 205112.2995
Head (Pa) 38.64 39.91 26.04 36.46 18.23045187
Head(ft) 126.75 130.89 85.41 119.59 59.79588214
Flow rate (gpm) 1,322.22 12.42 1,343.27 786.97 111.94
S=Q(H^0.5) 14,886.07 142.06 12,414.37 8,606.11 865.601352
Cp PUMP (CE = 394, carbon steel) $8,074.50 $1,972.05 $7,527.03 $3,301.40 $3,989.62
Q (gpm) 1,322.22 12.42 1,343.27 786.97 111.94
ηP 0.79 0.21 0.79 0.75 0.55
density of stream (lb/gal) 8.65 8.05 8.05 8.05 8.05
PB (Hp) 55.56 1.86 35.35 30.52 3.58
ηB 0.83 0.81 0.83 0.83 0.81
PC (Hp) 67.22 2.31 42.77 36.94 4.39
Cb motor $2,984.15 $283.85 $1,883.37 $1,631.59 $329.71
Cp motor (CE = 394) $5,371.47 $510.93 $3,390.07 $2,936.87 $593.49
Cp total (motor + pump) (2009 For Guthrie)
$19,400 $3,600 $15,700 $9,000 $6,600
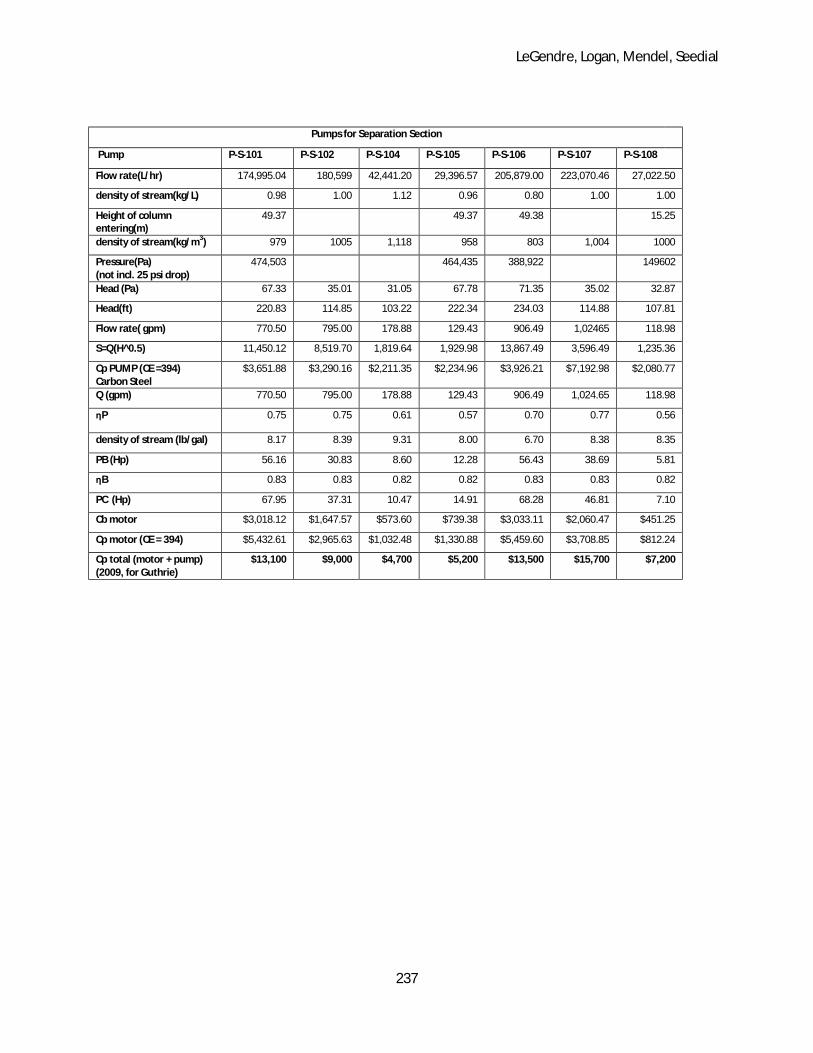
LeGendre, Logan, Mendel, Seedial
237
Pumps for Separation Section
Pump P-S-101 P-S-102 P-S-104 P-S-105 P-S-106 P-S-107 P-S-108
Flow rate(L/hr) 174,995.04 180,599 42,441.20 29,396.57 205,879.00 223,070.46 27,022.50
density of stream(kg/L) 0.98 1.00 1.12 0.96 0.80 1.00 1.00
Height of column entering(m)
49.37 49.37 49.38 15.25
density of stream(kg/m3) 979 1005 1,118 958 803 1,004 1000
Pressure(Pa) (not incl. 25 psi drop)
474,503 464,435 388,922 149602
Head (Pa) 67.33 35.01 31.05 67.78 71.35 35.02 32.87
Head(ft) 220.83 114.85 103.22 222.34 234.03 114.88 107.81
Flow rate( gpm) 770.50 795.00 178.88 129.43 906.49 1,02465 118.98
S=Q(H^0.5) 11,450.12 8,519.70 1,819.64 1,929.98 13,867.49 3,596.49 1,235.36
Cp PUMP (CE =394) Carbon Steel
$3,651.88 $3,290.16 $2,211.35 $2,234.96 $3,926.21 $7,192.98 $2,080.77
Q (gpm) 770.50 795.00 178.88 129.43 906.49 1,024.65 118.98
ηP 0.75 0.75 0.61 0.57 0.70 0.77 0.56
density of stream (lb/gal) 8.17 8.39 9.31 8.00 6.70 8.38 8.35
PB (Hp) 56.16 30.83 8.60 12.28 56.43 38.69 5.81
ηB 0.83 0.83 0.82 0.82 0.83 0.83 0.82
PC (Hp) 67.95 37.31 10.47 14.91 68.28 46.81 7.10
Cb motor $3,018.12 $1,647.57 $573.60 $739.38 $3,033.11 $2,060.47 $451.25
Cp motor (CE = 394) $5,432.61 $2,965.63 $1,032.48 $1,330.88 $5,459.60 $3,708.85 $812.24
Cp total (motor + pump) (2009, for Guthrie)
$13,100 $9,000 $4,700 $5,200 $13,500 $15,700 $7,200

LeGendre, Logan, Mendel, Seedial
238
Reflux Accumulator:
Reflux accumulators should be designed with mean residence times of 5 min at half full (Seider) so: Volumetric flow rate =165,300 L/hr Volume of Reflux Accumulator= (165,300 L/hr)*(1 hr/60 min)*(5 min)*(2)*( 0.0353146667 ft3/L) V= 606 ft3 Furthermore, it is typical to design reflux accumulators as horizontal vessels with an aspect ratio of 2, so: D=2L, or L = D/2. = 2 2
D = 11.6 ft L = 5.8 ft ts = 0.5 in The weight follows the vessel costing of the distillation column (see section for D-1) W = 2,596 lbs Cost for Horizontal vessel (Seider 527), FM = 1 for Carbon Steel = exp [8.717 − 0.2330 ln( ) + 0.04333(ln( ))] = 1580( ) . = 566394 [ + ]
CPB (2009) = $47,000
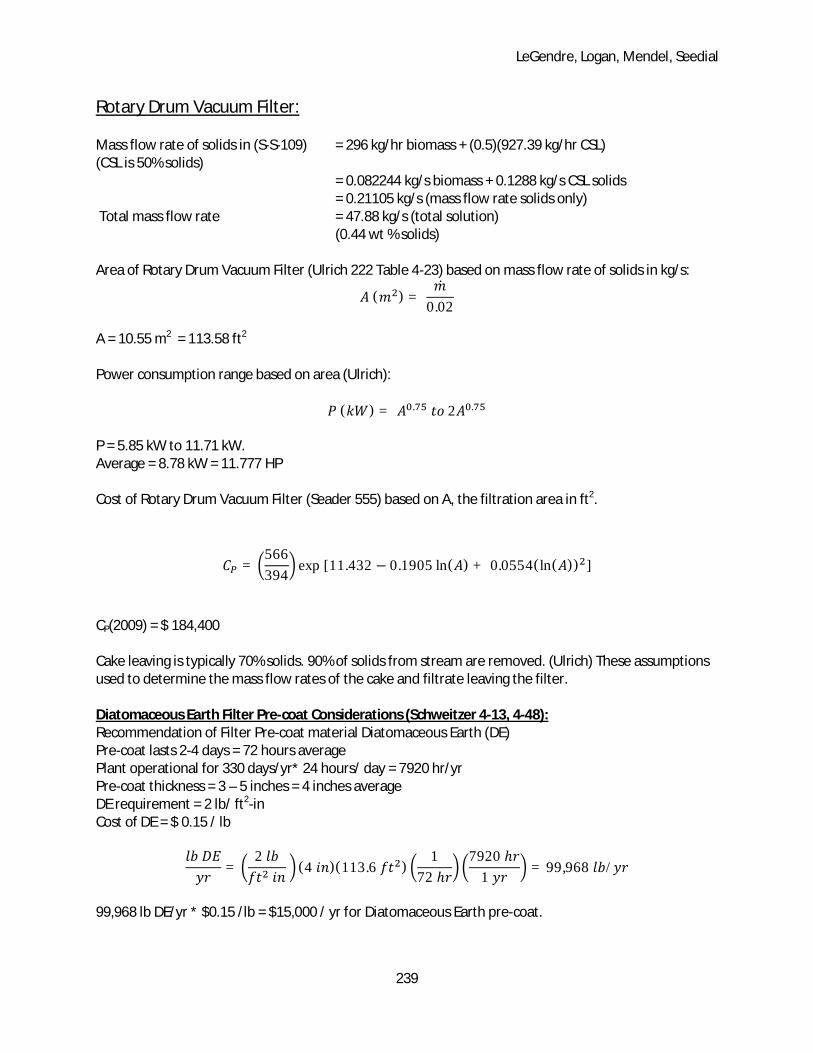
LeGendre, Logan, Mendel, Seedial
239
Rotary Drum Vacuum Filter:
Mass flow rate of solids in (S-S-109) = 296 kg/hr biomass + (0.5)(927.39 kg/hr CSL) (CSL is 50% solids) = 0.082244 kg/s biomass + 0.1288 kg/s CSL solids = 0.21105 kg/s (mass flow rate solids only) Total mass flow rate = 47.88 kg/s (total solution) (0.44 wt % solids) Area of Rotary Drum Vacuum Filter (Ulrich 222 Table 4-23) based on mass flow rate of solids in kg/s: ( ) = ̇0.02
A = 10.55 m2 = 113.58 ft2
Power consumption range based on area (Ulrich): ( ) = . 2 . P = 5.85 kW to 11.71 kW. Average = 8.78 kW = 11.777 HP Cost of Rotary Drum Vacuum Filter (Seader 555) based on A, the filtration area in ft2.
= 566394 exp [11.432 − 0.1905 ln( ) + 0.0554(ln( )) ] CP(2009) = $ 184,400 Cake leaving is typically 70% solids. 90% of solids from stream are removed. (Ulrich) These assumptions used to determine the mass flow rates of the cake and filtrate leaving the filter. Diatomaceous Earth Filter Pre-coat Considerations (Schweitzer 4-13, 4-48): Recommendation of Filter Pre-coat material Diatomaceous Earth (DE) Pre-coat lasts 2-4 days = 72 hours average Plant operational for 330 days/yr* 24 hours/ day = 7920 hr/yr Pre-coat thickness = 3 – 5 inches = 4 inches average DE requirement = 2 lb/ ft2-in Cost of DE = $ 0.15 / lb = 2 (4 )(113.6 ) 172 ℎ 7920 ℎ 1 = 99,968 /
99,968 lb DE/yr * $0.15 /lb = $15,000 / yr for Diatomaceous Earth pre-coat.

LeGendre, Logan, Mendel, Seedial
240
Screw Conveyor:
After drying, the stream of succinic acid crystals (463.39 kg/hr) must be transported into the holding tank at a height of 12 feet at a 30 degree angle, yielding a 24 foot long conveyor. Cost equation: (Seider 554) = 566394 $55.6( )( ) .
Where D is in inches and L is in feet. The smallest Diameter system is 6 inches, which can handle up to 75 ft3/hr, is sufficient for this. CP (2009) = $ 12,500.60 For the drive and power requirements (Seider 548): = 0.0146( ̇) . + 0.00182( ̇)(ℎ) Where is in lb/s and h is in ft. ̇ = (463.39 kg/hr)*(2.2 lb/kg)/(3600 s/hr)
= 0.283183 lb/s P= 0.126085 Hp, rounded up to a 1 Hp motor (Seider 510) = exp [5.4866 + 0.1314 ln( ) + 0.053255(ln( )) + 0.028628((ln( )) − 0.0035549((ln( )) ] CB=$ 241.43 CP=FT*CB Ft=1.3 (from Table 16.22 Seider for 1800 rpm totally enclosed fan cooled motors between 1 & 250Hp) CP=$ 313.86 CP(2009) = $ 313.86/394*566 CP(2009) = $ 450.88 CPB(2009) Total (Motor + conveyor) = $ 13,000

LeGendre, Logan, Mendel, Seedial
241
Spray Nozzles for Clean-In-Place System
As per recommendations by industrial consultant Mr. Bruce Vrana, spray nozzles will be purchased to supply caustic to the large fermenter tanks for the Clean-In-Place system. Mr. Vrana recommends purchasing spray nozzles from supplier Gammajet, at $10,000 per nozzle. His recommendation is 4 nozzles per 2,000,000 L tank, for a total of 48 nozzles in the main fermentation section. Additionally, the largest seed fermenters Seed Ferm 7A/B will use 3 nozzles per tank, for a total of 6 spray nozzles.

LeGendre, Logan, Mendel, Seedial
242
Storage, Mixing, and Holding Tanks
All Storage Tanks: Height: Diameter Aspect Ratio = 1:3. T-110 has Height: Diameter Aspect Ratio of 2:1 (Solids contained) Crude Glycerol Storage Tank (T-101), Corn Steep Liquor Storage Tank (T-103), and Gasoline Storage Tank (T-109) and hold a 3 -day supply of feedstock. Brine Storage Tank (T-104) has a one day supply. Denatured Ethanol Holding Tank (T-111) holds a 3 day supply of product (Seider). Succinic Acid Holding Tank (T-110) holds a 3 day supply of product. All tanks have a working volume of 80%. Mixing Tank (T-105) has a residence time of 10 minutes. Mixing Tank (T-108) has a residence time of 10 minutes. Mixing tanks have a working volume of 50%. Intermediate holding tanks between the continuous and batch processes: T-106 volume calculation: (Amount of feed required for initializing one batch) + (Amount of feed entering tank continuously x time for charging fermenter with feed – Amount of feed leaving during charging) / 0.8 (for 80 % working volume)
Or volumes from stream tables: [(S-S-115) + (S-FP-112 x 5 – S-S-115) ]/0.8
T-107 volume calculation: (Amount of feed from one FERM1 tank) + (Amount of feed from one FERM1 tank - Amount of feed leaving tank continuously x amount of time for draining tank) / 0.8 (for 80 % working volume)
Or volumes from stream tables: [(S-S-137) + (S-S-137 – S-140 x 5)]/0.8
T-101, T-106, T-107, T-108, T-109, T-111 modeled as a Floating Roof Tank (Volatiles) T-103, T-104, T-105, T-110 modeled as Cone Roof Tank (Non-volatiles) Floating Roof Tanks (Seider 555) with V in gallons :
Cp= (566/394)*375*V0.51
Cone Roof Tanks (Seider 555) with V in gallons :
Cp= (566/394)*210*V0.51

LeGendre, Logan, Mendel, Seedial
243
Floating Roof Storage Tanks
T-101 T-106 T-107 T-108 T-109 T-111
Volume(L) 3,165,281.51 1,157,455.63 3,370,526.25 7,619.58 41,145.75 2,057,287.39
Volume(gal) 836,178.75 305,700.91 890,205.14 2,012.88 10,869.55 543,477.73
Volume (m3)
3,165.28 1,157.46 3,370.53 7.60 41.15 2,057.29
Diameter (m)
22.95 5.47 23.44 3.07 5.40 19.88
Height(m) 7.65 16.41 7.81 1.02 1.80 6.62
Cp (2009) $564,600 $338,000 $582,900 $26,800 $101,000 $453,300
Cone Roof Storage Tanks
T-103 T-104 T-105 T-110
Volume(L) 83,467.68 144,969.67 61,730.95 26,477.50
Volume(gal) 22,049.82 38,296.93 16,307.59 6994.61
Volume(m3) 83.47 144.97 61.73 26.47
Diameter(m) 6.83 8.21 6.18 19.88
Height(m) 2.28 2.74 2.06 1.04
Cp $49,600 $65,700 $42,500 $27,600
LeGendre, Logan, Mendel, Seedial
244
Appendix C.
R-101 Glycerol Purification System Patent Application
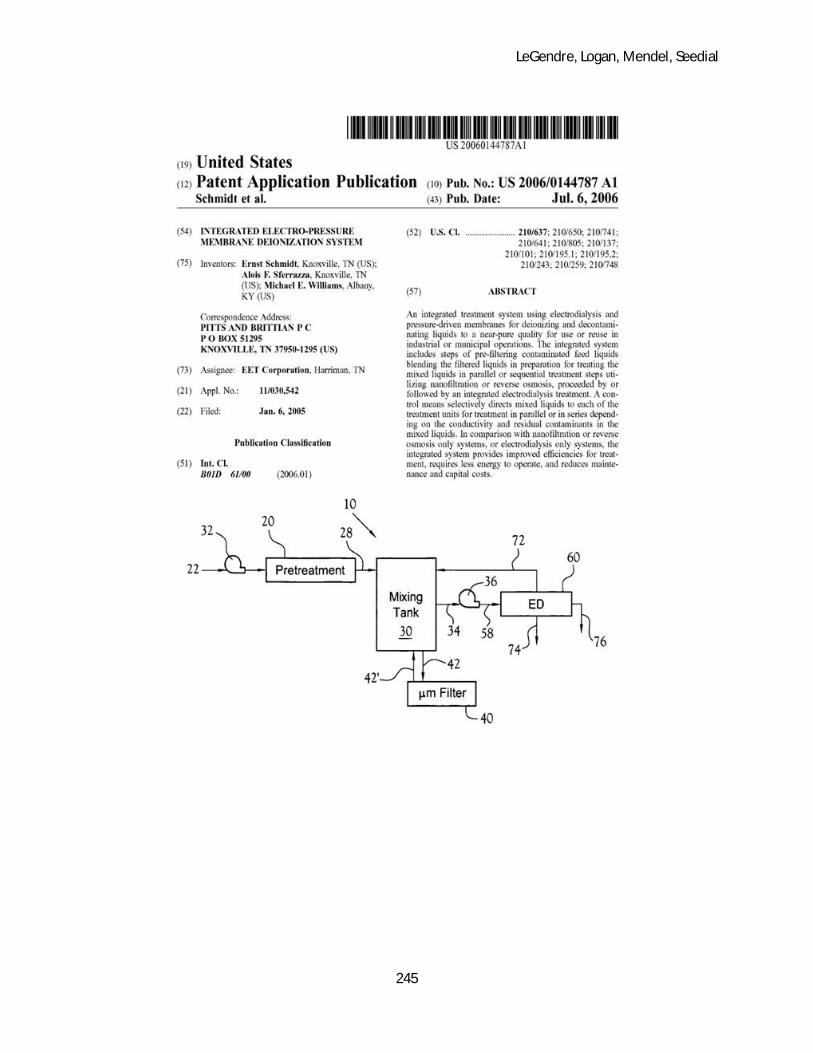
LeGendre, Logan, Mendel, Seedial
245

LeGendre, Logan, Mendel, Seedial
246
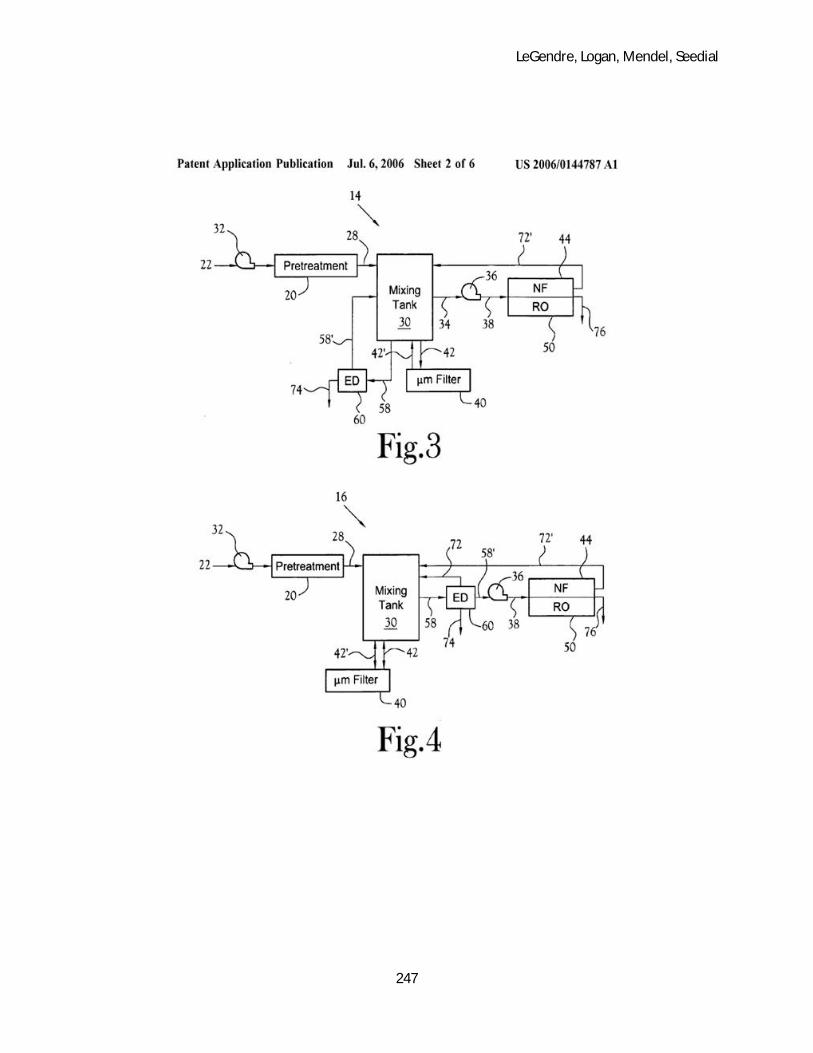
LeGendre, Logan, Mendel, Seedial
247
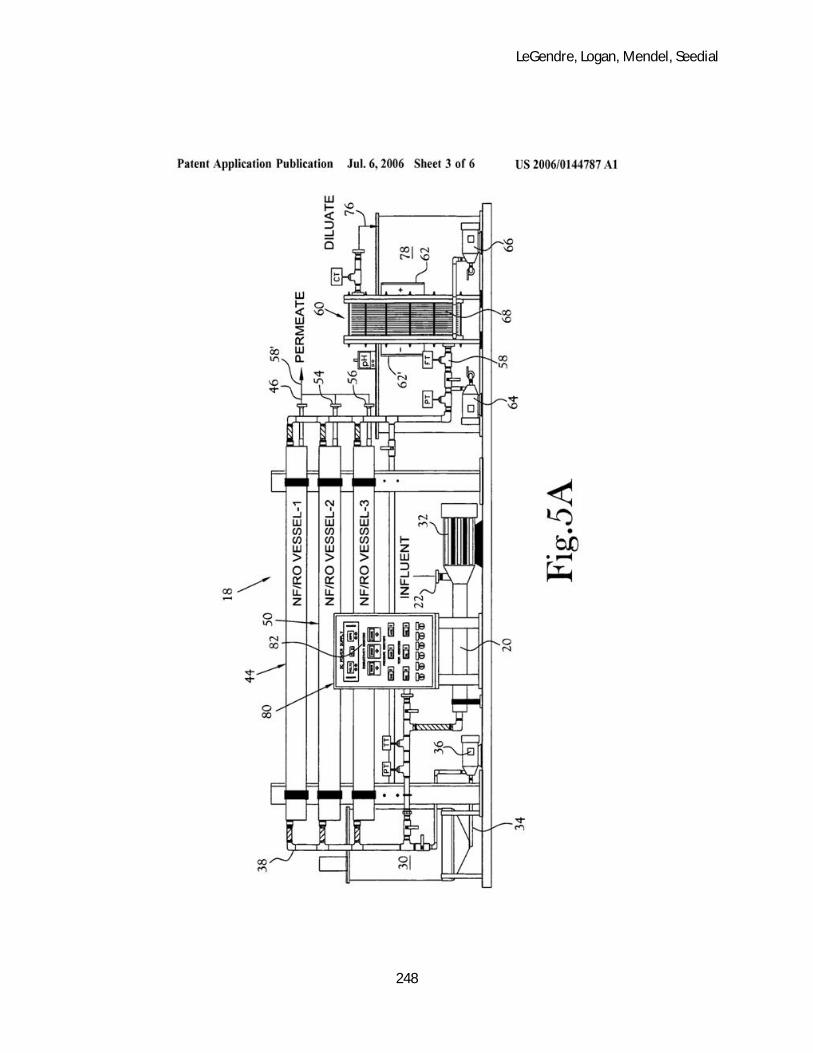
LeGendre, Logan, Mendel, Seedial
248
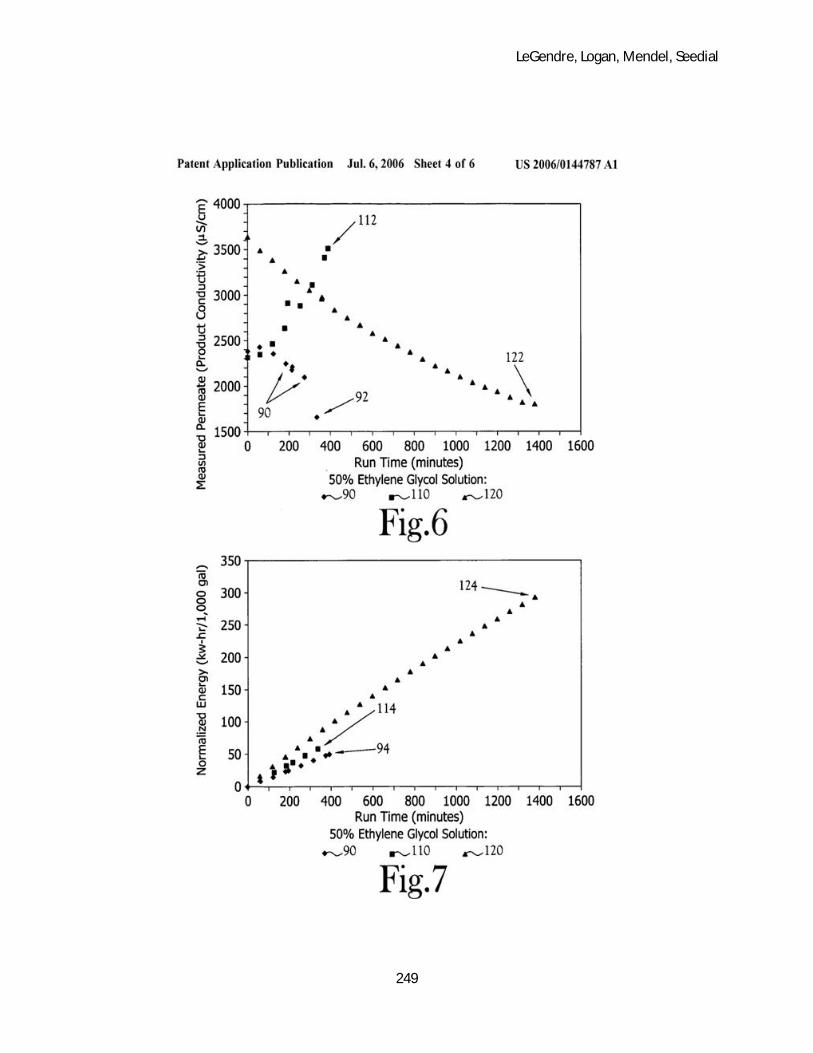
LeGendre, Logan, Mendel, Seedial
249
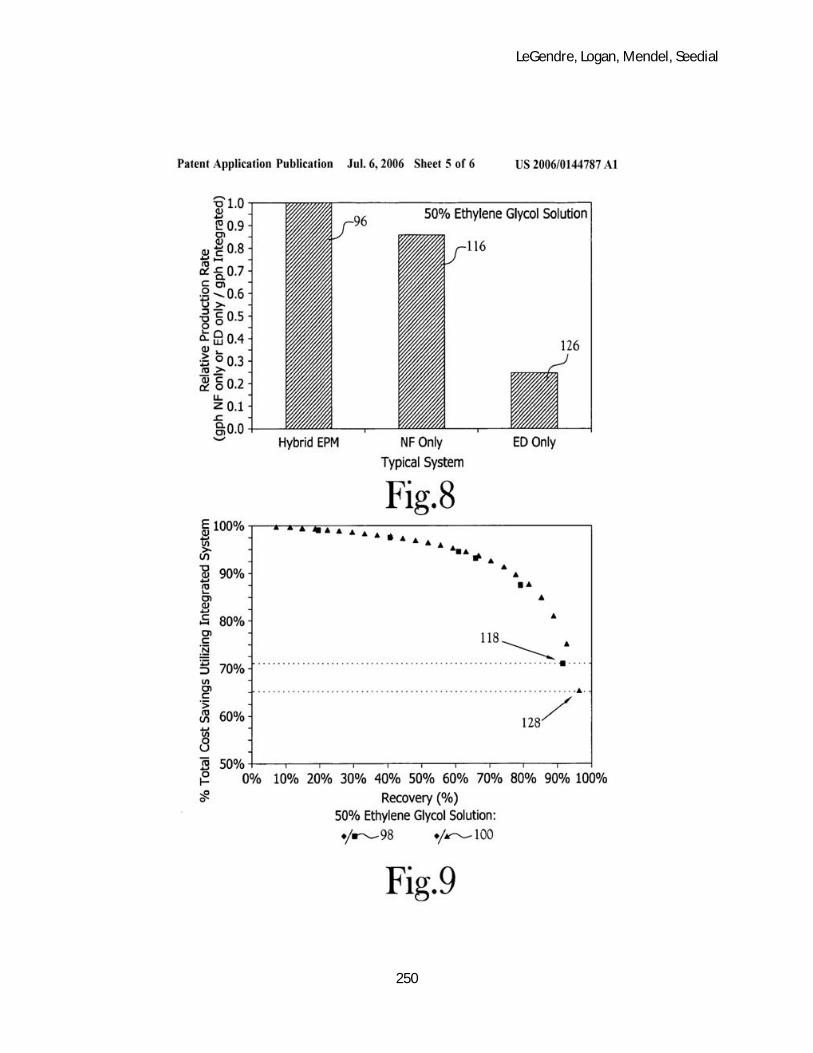
LeGendre, Logan, Mendel, Seedial
250

LeGendre, Logan, Mendel, Seedial
251

LeGendre, Logan, Mendel, Seedial
252

LeGendre, Logan, Mendel, Seedial
253

LeGendre, Logan, Mendel, Seedial
254

LeGendre, Logan, Mendel, Seedial
255

LeGendre, Logan, Mendel, Seedial
256

LeGendre, Logan, Mendel, Seedial
257

LeGendre, Logan, Mendel, Seedial
258

LeGendre, Logan, Mendel, Seedial
259

LeGendre, Logan, Mendel, Seedial
260
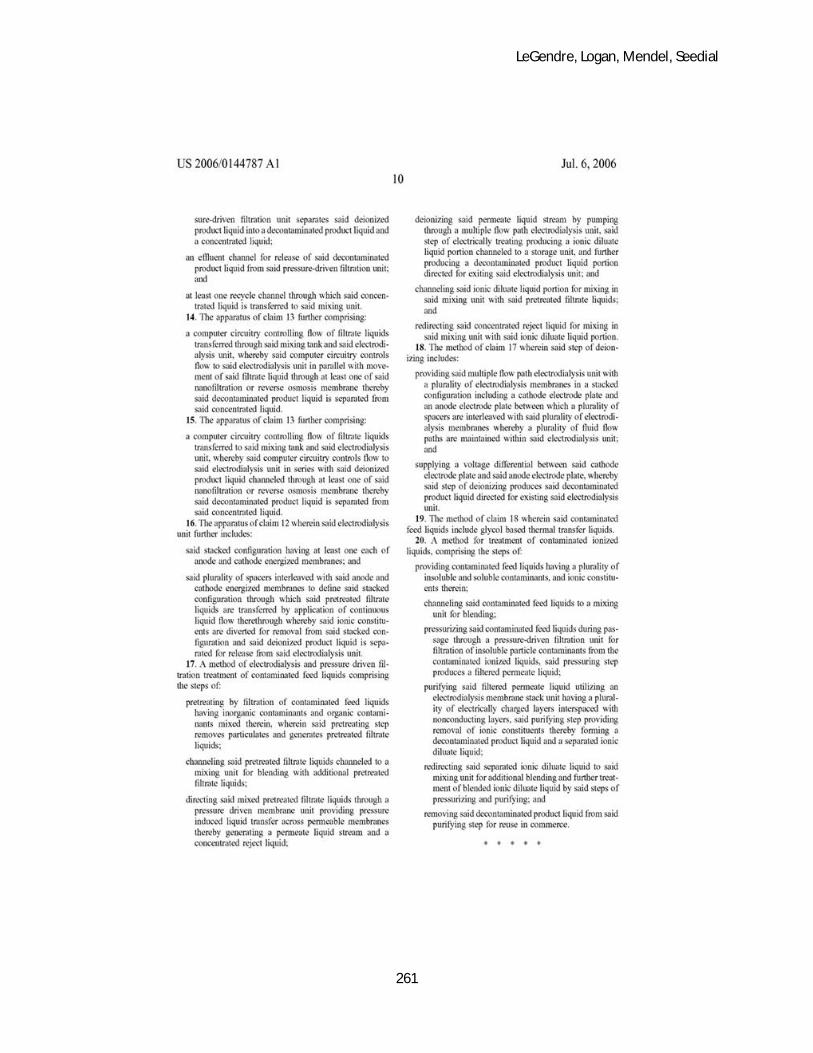
LeGendre, Logan, Mendel, Seedial
261

LeGendre, Logan, Mendel, Seedial
262
Appendix D.
Glycerol Purification System Supplier
Information
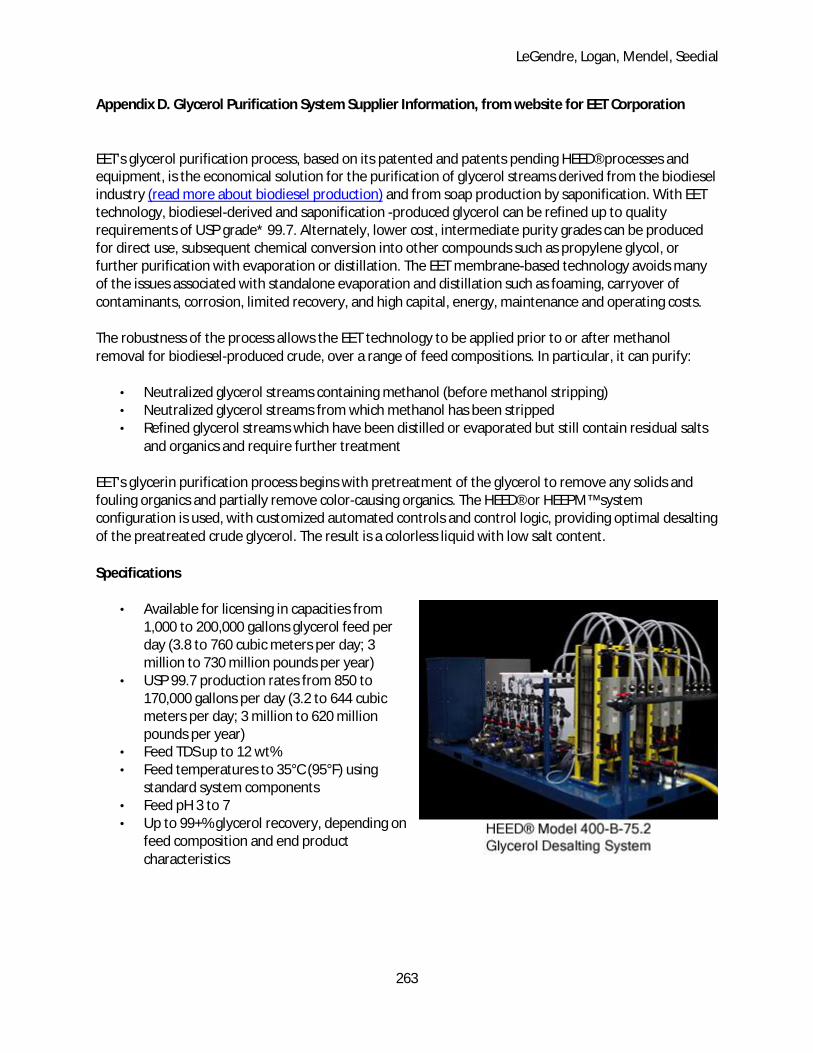
LeGendre, Logan, Mendel, Seedial
263
Appendix D. Glycerol Purification System Supplier Information, from website for EET Corporation
EET's glycerol purification process, based on its patented and patents pending HEED® processes and equipment, is the economical solution for the purification of glycerol streams derived from the biodiesel industry (read more about biodiesel production) and from soap production by saponification. With EET technology, biodiesel-derived and saponification -produced glycerol can be refined up to quality requirements of USP grade* 99.7. Alternately, lower cost, intermediate purity grades can be produced for direct use, subsequent chemical conversion into other compounds such as propylene glycol, or further purification with evaporation or distillation. The EET membrane-based technology avoids many of the issues associated with standalone evaporation and distillation such as foaming, carryover of contaminants, corrosion, limited recovery, and high capital, energy, maintenance and operating costs.
The robustness of the process allows the EET technology to be applied prior to or after methanol removal for biodiesel-produced crude, over a range of feed compositions. In particular, it can purify:
• Neutralized glycerol streams containing methanol (before methanol stripping) • Neutralized glycerol streams from which methanol has been stripped • Refined glycerol streams which have been distilled or evaporated but still contain residual salts
and organics and require further treatment
EET's glycerin purification process begins with pretreatment of the glycerol to remove any solids and fouling organics and partially remove color-causing organics. The HEED® or HEEPM™ system configuration is used, with customized automated controls and control logic, providing optimal desalting of the preatreated crude glycerol. The result is a colorless liquid with low salt content.
Specifications
• Available for licensing in capacities from 1,000 to 200,000 gallons glycerol feed per day (3.8 to 760 cubic meters per day; 3 million to 730 million pounds per year)
• USP 99.7 production rates from 850 to 170,000 gallons per day (3.2 to 644 cubic meters per day; 3 million to 620 million pounds per year)
• Feed TDS up to 12 wt% • Feed temperatures to 35°C (95°F) using
standard system components • Feed pH 3 to 7 • Up to 99+% glycerol recovery, depending on
feed composition and end product characteristics

LeGendre, Logan, Mendel, Seedial
264
Key Features
• Proven technology with full-scale installations currently in operation • High recoveries with much lower capital and operating costs compared to other technologies • Salt removal to specified levels, including to USP glycerol, with the system able to adapt to
changing feed supply contaminant types and concentrations • Robust unit operation(s) for removal of Free Fatty Acids (FFAs), Matter Organic Not Glycerol
(MONG), organic acids, color and odor • Modular systems, easily scaleable to increase capacity • Semi-automated system easy to use and control • Minimum downtime required (typically 23+ operating hours per day) • Nonhazardous side streams consisting of dry filter cake and aqueous brine solution for easy
disposal
Space, Utility, and Tank Requirements
• The space/footprint needed will depend on the overall production capacity, feed chemistry, and product characteristics. In general, the process equipment requires only a fraction of the space of storage tanks for feed and product. For example, processing equipment with work tanks for a 10 million pound/year (~2,500 gpd) plant producing USP 99.7 grade glycerol using typical chloride containing crude feed will occupy about 7,000 square feet, while the actual process equipment will occupy only about 1,000 square feet (see EET facility photos)
• Three-phase 480V electrical utility preferred; three-phase 230V or single-phase 110V acceptable for some size units
• Process air • Softened, de-chlorinated make-up water (or tap water with <3 ppm free chlorine) • Appropriate feed, product, and brine concentrate tanks and lines to and from these to the
working tanks of the EET-supplied systems
Maintenance
Maintenance requirements for the EET glycerol purification system are minimal. Depending on feed characteristics, periodic cleaning, typically <1 hour per day, is required. Although each installation and application will vary, installed units have been in operation for over 5 years with no change in HEED® membrane stack and no major component (e.g., pumps, rectifier, controls) replacement.
By-products of Glycerol Purification
• Concentrated brine stream, typically dischargeable as sanitary wastes (check with your local regulators)
• A dry solid waste (nonhazardous) passing the paint filter test (no free liquids). The amount of solid waste will depend on the amount of MONG and FFAs in the biodiesel-derived glycerol
• Small amounts of hydrogen and oxygen gas, which are typically vented to atmosphere

LeGendre, Logan, Mendel, Seedial
265
Appendix E.
Carbon Dioxide Cap and Trade
Legislation
LeGendre, Logan, Mendel, Seedial
266
Appendix E. Carbon Dioxide Cap and Trade Legislation
Cap and Trade Pending Legislation
The idea behind Cap and Trade programs is that each company, power plant, or other large-
scale carbon emitter will be able to reduce carbon emissions at different rates. Each will be given a
capped amount of carbon it can emit. Over time, the caps get stricter and stricter until the ultimate
emissions goals are reached. Since some carbon emitters will be able to reduce emissions more easily
and cheaply than others, those that can reduce to levels below their specified caps can sell on the open
market, carbon allowances to emitters that cannot meet their specified levels. This is trade part of the
system.
The 110th US Congress, which was in session in 2007 and 2008, introduced a flurry of proposals
to address climate change, 235 pieces in total. By the end of January 2008, seven main congressional
bills addressed carbon and other greenhouse gas emissions through a variety of methods. All set goals
for at least slowing the rate of emissions to the atmosphere. The Pew Center on Global Climate Change
summed up each of these bills and created a chart of what effects on emissions these bills would have if
each of their goals were met (Pew), which is Fig CT-1 below.

LeGendre, Logan, Mendel, Seedial
267
Figure CT-2. The Pew Center on Global Climate Change summary of congressional bills. Graph shows what
effects on Carbon Dioxide emissions these bills would have if each of their goals were met
The most radical of these plans is the Sanders-Boxer/ Waxman proposal (s.309), an amendment
to the Clean Air Act, which calls for a steady 2% reduction in emissions year-on-year, so that by 2050
total emissions will be reduced 80% from their 1990 value. This plan does not require Cap and Trade,
but allows for systems of cap and trade to exist to assist in meeting the goals. The amendment also did
not specify which sectors the caps would be placed on, instead just listing total national goals. This
amendment never came up for a vote, and expired when the 110th Congress did last year (Gov Track).
Many of the other plans drafted called for slightly less reduction. The Lieberman-Warner
(s.2191) bill, called for caps to be auctioned off on the open market and gave incentives for carbon
sequestering, and the Olver-Gilchrest (H.R. 620) bill would have provided for a step-down approach to
limiting emissions(Gov Track). The bills set target years for emissions to be reduced to certain levels, and
had no specifications on reduction in between these target years. The Lieberman-Warner bill reached

LeGendre, Logan, Mendel, Seedial
268
the committee phase, but no further action was taken; the Olver-Gilchrest bill did not even make it to
committee(Gov Track).
The one proposed bill that took on the issue slightly differently was Spector-Bingham (s.1766)
The bill calls for a reduction back to 1990 emissions levels by 2030, primarily through Cap and Trade. The
bill has many incentives for research, including special carbon capture allocations and funding for green
research. The bill also gives the President the power to set the goals to a more aggressive level, up to
60% below 1990 levels by 2050, in the event that international regulations or actions change over this
time period. The bill did not make it past introduction.
In short, it seems to be a few years before the Cap and Trade system will be applied within the
United States.

LeGendre, Logan, Mendel, Seedial
269
Appendix F.
Problem Statement
LeGendre, Logan, Mendel, Seedial
270
Glycerol to Ethanol
(recommended by Bruce Vrana, DuPont)
Glycerol is a byproduct of biodiesel manufacture, with relatively few industrial uses. As the production of biodiesel increases, particularly in Europe due to government regulations but also in the U.S. due to public demand for renewable fuels, the price of glycerol is expected to continue to decrease.
Your research organization has recently isolated a naturally occurring E. coli, code-named Penn09, that will ferment glycerol to ethanol and a small amount of succinic acid. Ethanol is in high demand for transportation fuel, and succinic acid is a high-value specialty chemical.
You have been asked to determine whether this technology could be commercially successful, using the following assumptions, determined by your research director. You need to design a plant that will make 50MM gallons per year of fuel ethanol using this technology and estimate the economics.
Crude glycerol is a good substrate for this strain of E. coli. The salts in the glycerol contain all the nutrients that the organism needs to survive and reproduce. The fermentation is anaerobic, and the overall reactions can be written as:
CH2OH-CHOH-CH2OH à CH3-CH2OH + CO2 + H2 (1)
Glycerol Ethanol
CH2OH-CHOH-CH2OH + CO2 à HOOC-CH2-CH2-COOH + H20 (2)
Glycerol Succinic acid
Assume that 98% of the glycerol is converted in reaction 1, 1% of the glycerol is converted in reaction 2, and 1% is converted to biomass. The overall reaction rate is 1.6 g EtOH formed/L of reaction volume/hour. Feed only enough glycerol to the batch fermenter to reach a final ethanol titer of 100 g/L.
Sterility in the fermentation area is a significant concern. Suitable measures must be taken to ensure that no adventitious organisms enter the process, eating feedstock and generating undesired products. Everything entering the fermenter must be sterile, except of course for the innoculum.

LeGendre, Logan, Mendel, Seedial
271
The organism is a naturally occurring strain that poses no known hazards to humans and thus is less stringently regulated than if it were genetically modified. Nonetheless, it would be prudent to design facilities to physically contain the live organism. Prior to removal from containment, the organism must be deactivated or killed and then disposed of properly. Landfill is adequate for final disposal. Likewise, operating vents and spills that could contain the live organism are to be contained and treated. The operating vent could be treated with a scrubber using a low concentration of bleach. Spills could be sent to a tank and heated to sterilization temperature prior to discharge.
Also fed to the fermenters is your E. coli inoculum, which you produce in a separate seed fermentation train. The biochemistry of the organism is outside the scope of this project. Fortunately, your research organization has developed a simple scenario for your use. The organism will come from 1 ml vials stored in a freezer on site. It will be grown in successive stages each 20 times the size of the prior stage, each stage taking 24 hours.* After 24 hours, it is put in the next larger vessel along with water and a sugar source. If you use less than a 20 X factor for any stage of fermentation, you must still allow 24 hours for that stage of fermentation to take place. 10 liters is the largest stage that can be grown in the lab before transferring to the first seed fermenter in the plant. Lab scale fermentations will use clean glycerol and other nutrients, the cost of which can be ignored for this evaluation, along with the cost of the initial vial of organism. (Note, however, that the vials do have a cost, so you may only use one vial per production fermenter batch.) Once the laboratory-produced seed is taken to the plant seed fermentation train, each stage of seed fermentation will be fed with plant water and enough glycerol to produce the maximum titer of 100 g/L ethanol before transfer to the next larger seed fermenter, or ultimately the production fermenter(s). Your material and energy balance should include the amount of water and glycerol fed to the plant seed train.
Fermentation is the only batch step in the process. Your design must consider how to best match up fermentation with the continuous back end of the plant. A Gantt chart may be helpful to illustrate the filling, fermentation, emptying and cleaning process for however many production and seed fermenters your design employs.
Fermentation off-gas will, unlike in ethanol plants, contain a significant amount of hydrogen, as shown in the stoichiometry above. Your design needs to handle this stream in a safe, environmentally acceptable and economical manner before discharge to the atmosphere. You may assume a slight positive pressure in the fermenters, say 5 inches of water gauge, which will help keep the fermentation anaerobic.
*This 24 hour time period was found to be in disagreement with the calculated 60 hr period using the given growth rate and end ethanol concentration, so this 24-hour time period was ignored at the later suggestion of Mr. Vrana.

LeGendre, Logan, Mendel, Seedial
272
Downstream of fermentation, it is expected that this process will have many similarities to the fuel ethanol process used in the U.S. and Brazil. Should you wish to use the fuel ethanol industry process standard for drying ethanol from near the azeotrope to 99.5% purity, molecular sieves, you need to know that regeneration of the molecular sieves requires recycling 20% of the dry ethanol product back to the sieves. This regeneration stream, which on average contains 37% water after leaving the molecular sieves, must then be recycled back to your separation process. The composition of the regeneration stream varies with time, so your design should take that into consideration. A brief, but informative, discussion of the ethanol molecular sieve process is contained in Aden et al. (2002).
A packaged unit for drying ethanol with molecular sieves costs $2.5 million to process 34,000 lb/hr on a pure ethanol basis. The feed is saturated vapor at 1 atm, 92% ethanol, 8% water by weight. The products are saturated liquid at 1 atm. Scale the cost with a 0.6 exponent. Electrical usage is 0.002 kWhr/lb of product. Steam usage is 0.04 lb/lb of product for additional heating. Cooling water usage is 3 gal/lb of product. Since this is a packaged unit, it includes local piping, instrumentation, etc. and thus should have different installation factors than most other purchased equipment.
Ethanol must be denatured on site with 2-5% by volume of unleaded gasoline, to conform to the Bureau of Alcohol, Tobacco and Firearms regulations (preventing human consumption of untaxed alcohol). Prior to denaturing, it must be 99.5% pure ethanol.
Corrosion and cleanliness dictate that most process equipment be fabricated from 304 stainless steel. This holds for any equipment that contains water. Exceptions include corn silos, product storage tanks, and any distillation or other separation systems that contain less than 1% water, which may use carbon steel.
Since your product is intended for transportation fuel use, it is imperative that the process be as energy efficient as possible. The current benchmark for energy use in a fuel ethanol plant is about 35,000 BTU/gallon of product. (This is calculated as the amount of heat and electricity needed by the process, not the amount of fuel consumed in the boiler.) You should certainly be able to surpass that benchmark, due to differences in the process.
The plant design should be as environmentally friendly as possible. Recover and recycle process materials to the maximum economic extent. Also, energy consumption should be minimized, to the extent economically justified. The plant design must also be controllable and safe to operate. Remember that you will be there for the start-up and will have to live with whatever design decisions you have made.

LeGendre, Logan, Mendel, Seedial
273
Your purchasing organization believes that the equilibrium price for byproduct glycerol is $0.15/lb, delivered to your U. S. Gulf Coast plant. Your marketing organization believes they can sell denatured ethanol for $2.50/gal. Succinic acid can be sold for $2.00/lb provided it meets normal purity specs. Unleaded regular gasoline used for denaturing costs $2.50/gallon wholesale. All prices referenced here are in 2009 dollars. Obviously, you will want to test the sensitivity of your economics to these price forecasts.
Undoubtedly, you will need additional data beyond that given here. Cite any literature data used. If need be, make reasonable assumptions, state them, and whether your design or economics are sensitive to the assumptions you have made.
References
The Renewable Fuels Association web site has a good description of the fuel ethanol process and industry. http://www.ethanolrfa.org
A good model for much of the dry grind ethanol process is discussed on http://www.intelligen.com/literature.shtml which links to a paper by Kwiatkowski et al. This includes a SUPERPRO DESIGNER model that works with their evaluation version of the software. Note, however, that SUPERPRO DESIGNER does not handle VLE rigorously and thus is not suitable for designing this process.
Dharmadi, Y., A. Murarka, and R. Gonzalez, “Anaerobic Fermentation of Glycerol by Escherichia coli: A New Platform for Metabolic Engineering”, Wiley InterScience, 5/20/2006 contains a description of the biochemistry in a similar organism.
Aden, A., et al., “Lignocellulosic Biomass to Ethanol Process Design and Economics Utilizing Co-Current Dilute Acid Prehydrolysis and Enzymatic Hydrolysis for Corn Stover”, NREL/TP-510-32438 (2002).
LeGendre, Logan, Mendel, Seedial
274
Appendix G.
Relevant MSDS
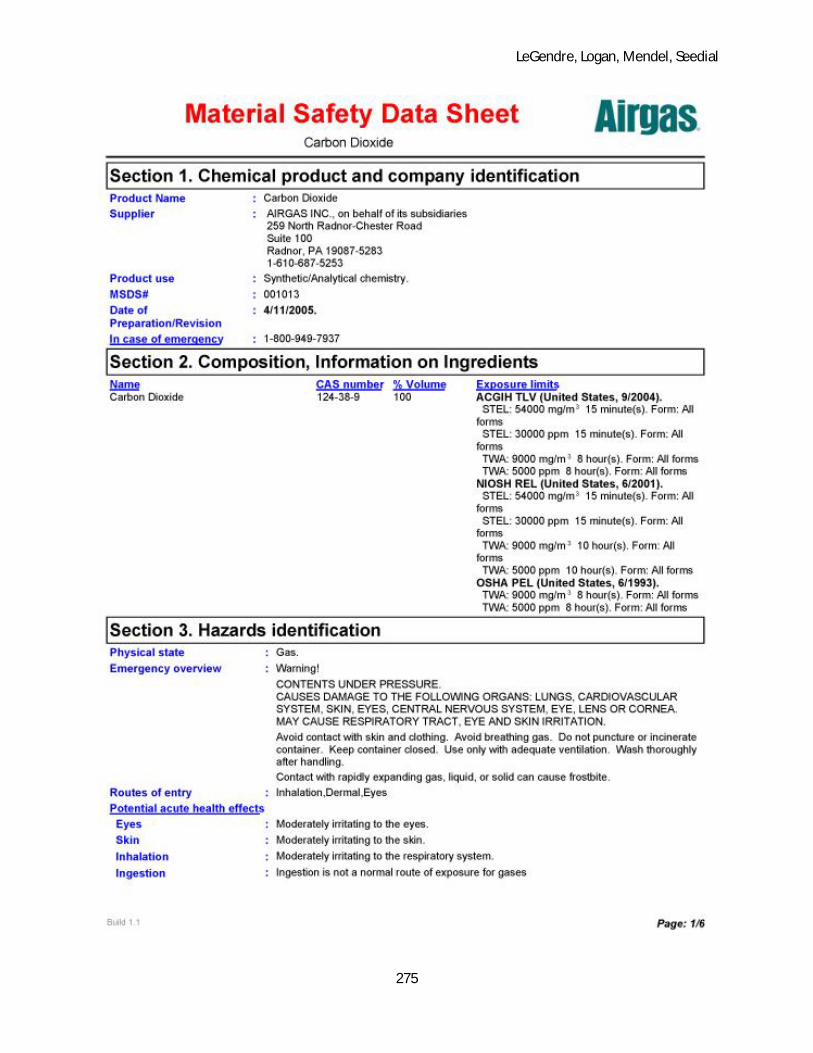
LeGendre, Logan, Mendel, Seedial
275

LeGendre, Logan, Mendel, Seedial
276
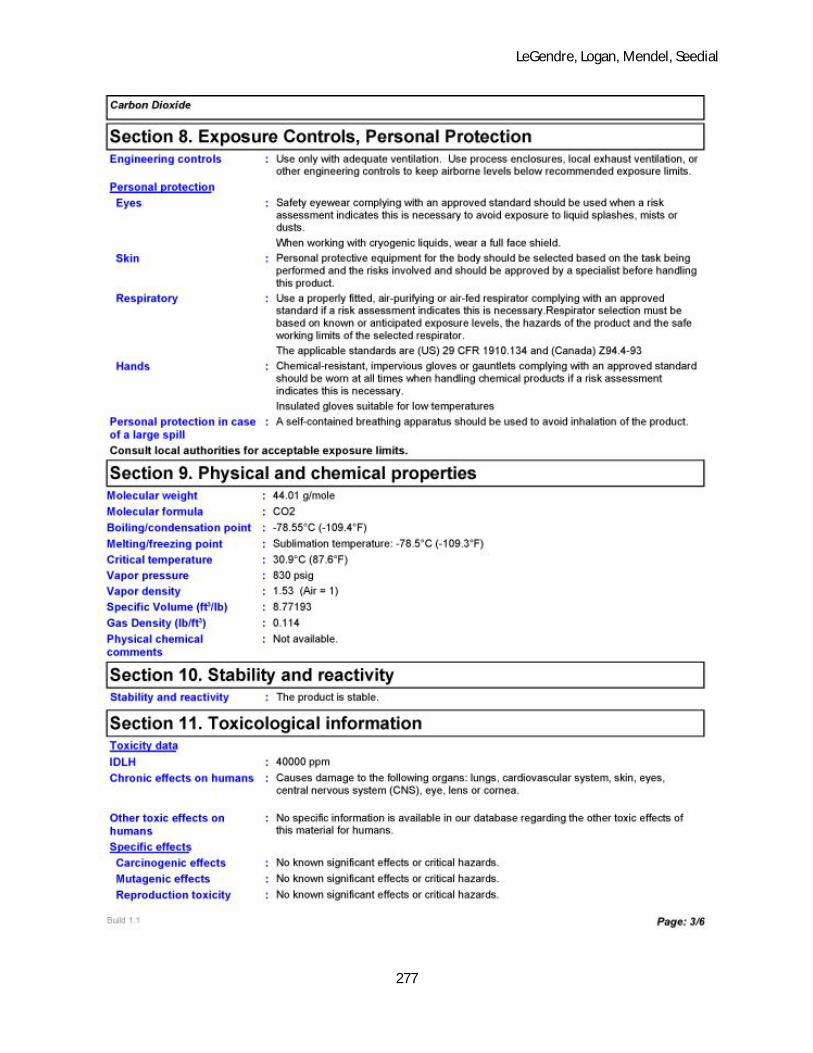
LeGendre, Logan, Mendel, Seedial
277

LeGendre, Logan, Mendel, Seedial
278

LeGendre, Logan, Mendel, Seedial
279

LeGendre, Logan, Mendel, Seedial
280

LeGendre, Logan, Mendel, Seedial
281

LeGendre, Logan, Mendel, Seedial
282

LeGendre, Logan, Mendel, Seedial
283
LeGendre, Logan, Mendel, Seedial
284
LeGendre, Logan, Mendel, Seedial
285
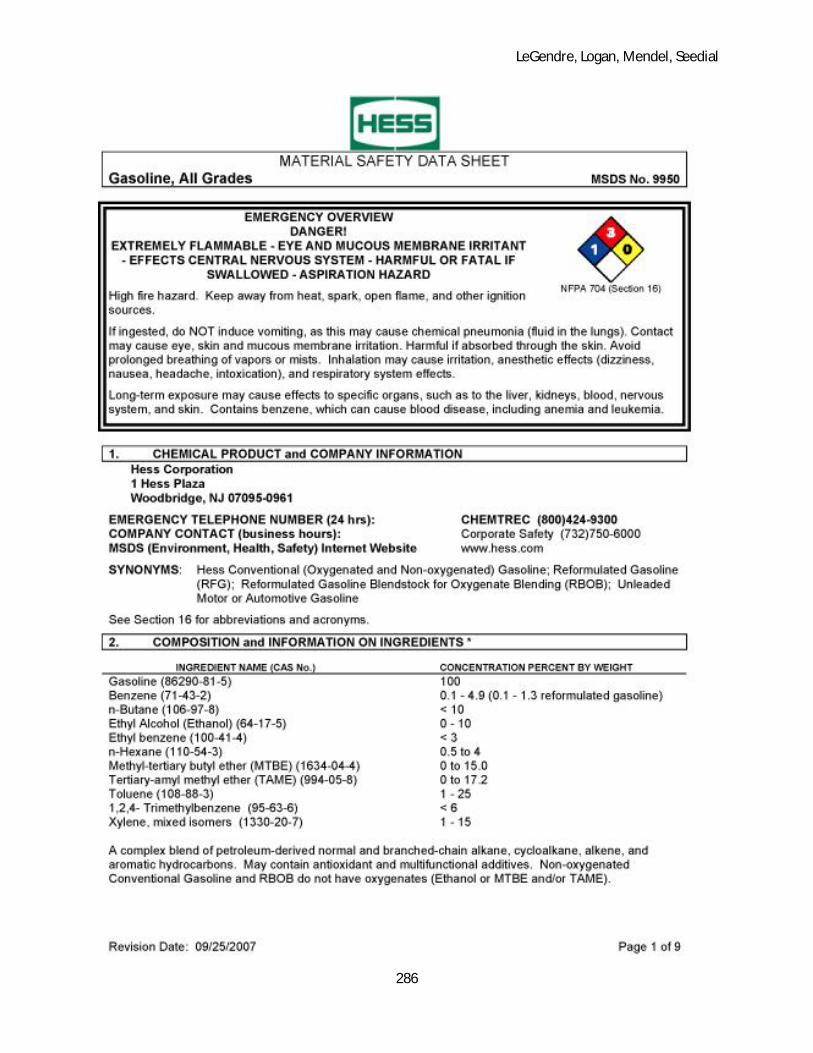
LeGendre, Logan, Mendel, Seedial
286

LeGendre, Logan, Mendel, Seedial
287
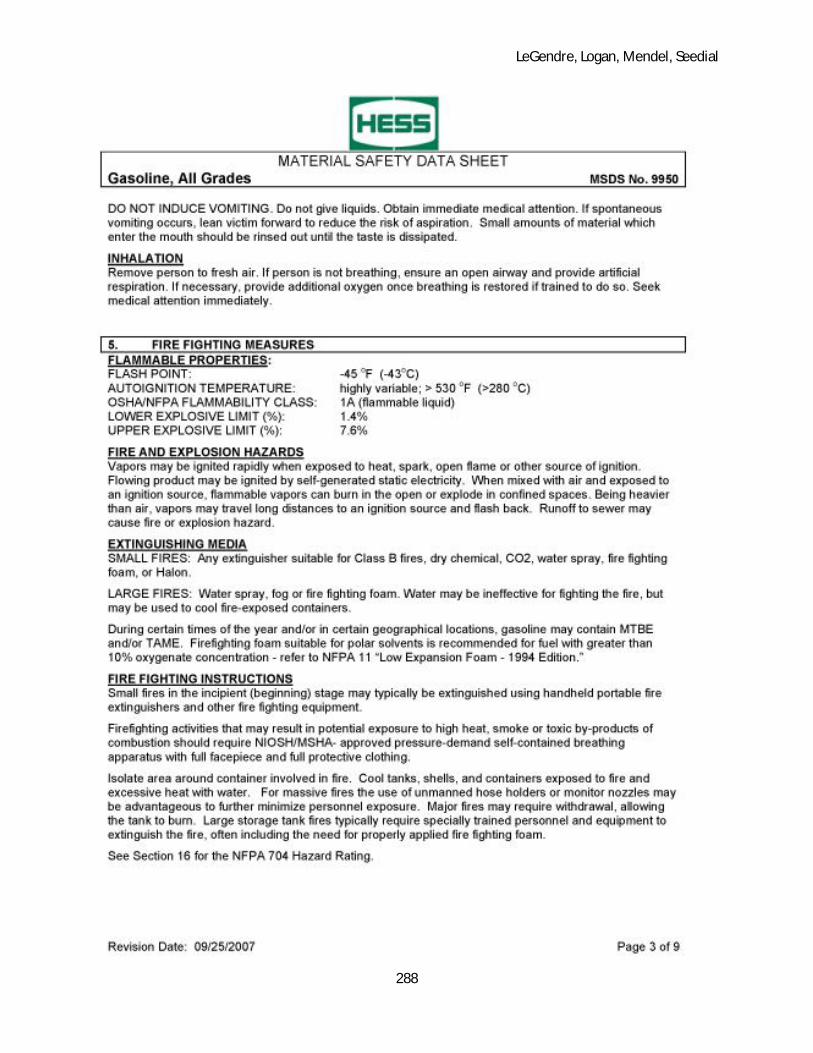
LeGendre, Logan, Mendel, Seedial
288
LeGendre, Logan, Mendel, Seedial
289

LeGendre, Logan, Mendel, Seedial
290
LeGendre, Logan, Mendel, Seedial
291
LeGendre, Logan, Mendel, Seedial
292
LeGendre, Logan, Mendel, Seedial
293

LeGendre, Logan, Mendel, Seedial
294
LeGendre, Logan, Mendel, Seedial
295
LeGendre, Logan, Mendel, Seedial
296

LeGendre, Logan, Mendel, Seedial
297
LeGendre, Logan, Mendel, Seedial
298

LeGendre, Logan, Mendel, Seedial
299
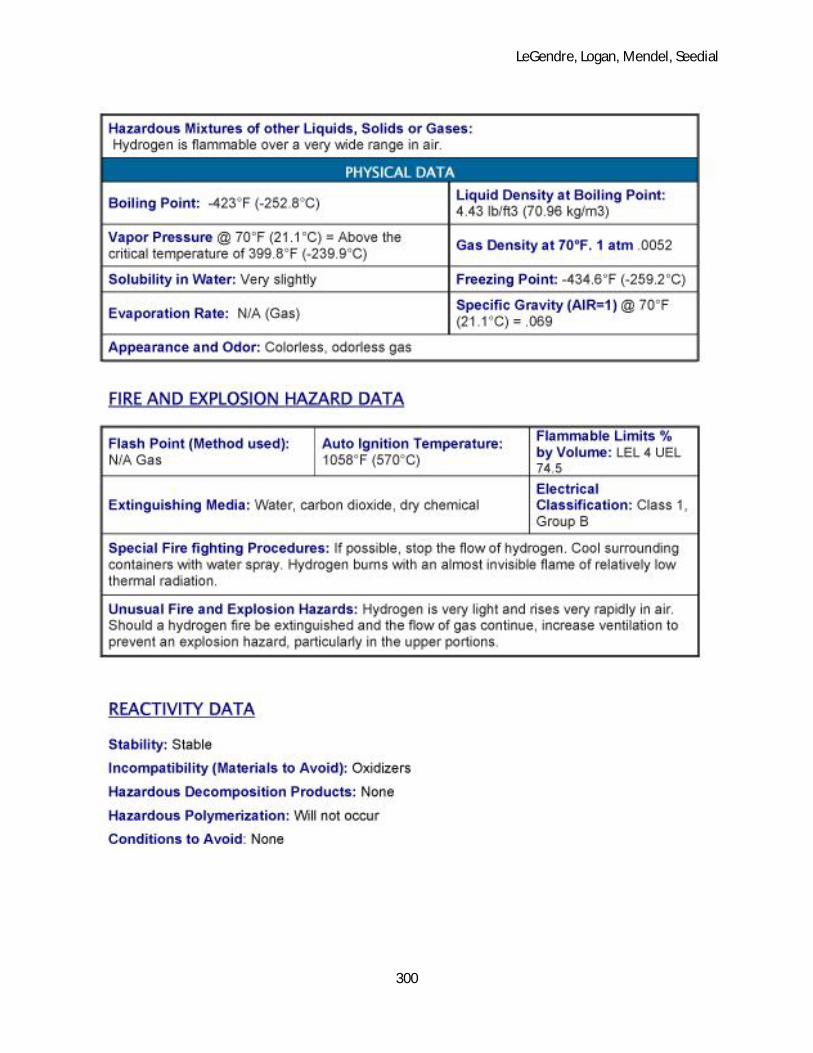
LeGendre, Logan, Mendel, Seedial
300
LeGendre, Logan, Mendel, Seedial
301

LeGendre, Logan, Mendel, Seedial
302

LeGendre, Logan, Mendel, Seedial
303

LeGendre, Logan, Mendel, Seedial
304
LeGendre, Logan, Mendel, Seedial
305

LeGendre, Logan, Mendel, Seedial
306

LeGendre, Logan, Mendel, Seedial
307
LeGendre, Logan, Mendel, Seedial
308
LeGendre, Logan, Mendel, Seedial
309

LeGendre, Logan, Mendel, Seedial
310

LeGendre, Logan, Mendel, Seedial
311
LeGendre, Logan, Mendel, Seedial
312

LeGendre, Logan, Mendel, Seedial
313
LeGendre, Logan, Mendel, Seedial
314
LeGendre, Logan, Mendel, Seedial
315

LeGendre, Logan, Mendel, Seedial
316
Related Documents