Application Note 118 AN118-1 an118fb March 2008 transformers originally intended for LCD display backlight service are readily available. These transformers are mul- tiply sourced, well proven and competitively priced. Figure 1’s resonant Royer topology achieves 100µV P-P noise at 250V output by minimizing high frequency harmonic in the power drive stage. The self oscillating resonant Royer circuitry is composed of Q2, Q3, C1, T1 and L1. Current flow through L1 causes the T1, Q2, Q3, C1 circuitry to oscillate in resonant fashion, supplying sine Figure 1. Current Fed Resonant Royer Converter Produces High Voltage Output. A1 Biases Q1 Current Sink, Enforcing Output Voltage Stabilizing Feedback Loop. A1’s 0.001µF–1kΩ Network Phase Leads Output Filter, Optimizing Transient Response. D5-D6, Low Leakage Clamps, Protect A1 Introduction Photomultipliers (PMT), avalanche photodiodes (APD), ultrasonic transducers, capacitance microphones, radia- tion detectors and similar devices require high voltage, low current bias. Additionally, the high voltage must be pristinely free of noise; well under a millivolt is a common requirement with a few hundred microvolts sometimes necessary. Normally, switching regulator configurations cannot achieve this performance level without employing special techniques. One aid to achieving low noise is that load currents rarely exceed 5mA. This freedom permits output filtering methods that are usually impractical. This publication describes a variety of circuits featuring outputs from 200V to 1000V with output noise below 100µV measured in a 100MHz bandwidth. Special techniques enable this performance, most notably power stages optimized to minimize high frequency harmonic content. Although sophisticated, all examples presented utilize standard, commercially available magnetics—no custom components are required. This provision is intended to assist the user in quickly arriving at a produceable design. Circuits and their descriptions are presented beginning with the next ink. BEFORE PROCEEDING ANY FURTHER, THE READER IS WARNED THAT CAUTION MUST BE USED IN THE CONSTRUCTION, TESTING AND USE OF THE TEXT’S CIRCUITS. HIGH VOLTAGE, LETHAL POTENTIALS ARE PRESENT IN THESE CIRCUITS. EXTREME CAUTION MUST BE USED IN WORKING WITH, AND MAKING CONNECTIONS TO, THESE CIRCUITS. REPEAT: THESE CIRCUITS CONTAIN DANGEROUS, HIGH VOLTAGE POTENTIALS. USE CAUTION. Resonant Royer Based Converters The resonant Royer topology is well suited to low noise operation due to its sinosoidal power delivery 1 . Addition- ally, the resonant Royer is particularly attractive because High Voltage, Low Noise, DC/DC Converters A Kilovolt with 100 Microvolts of Noise Jim Williams L, LT, LTC and LTM are registered trademarks of Linear Technology Corporation. All other trademarks are the property of their respective owners. AN118 F01 1μF, 400V 1μF, 400V – + LT1635 0.001μF 400V 1k 250V OUT 1M* 1k OUTPUT ADJUST 499Ω* 430k 430k 10k L1 250μH IRLRO24 Q1 A1 Q3 Q2 820Ω 5V T1 10k D1-D4 10 6 5V D5 D6 5 4 1 2 3 0.1μF 0.22μF x2 5V C1 V REF = 0.2V DANGER! Lethal Potentials Present — See Text = ZDT1048 DUAL L1 = CTX250-4, COILTRONICS T1 = 210605R, COILTRONICS 1μF = WIMA MKS-4 0.22μF = WIMA MKP-2 D1-D4 = TOSHIBA DUAL DIODE 1SS306. CONNECT EACH UNIT IN SERIES. D5-D6 = 2N4393 * = 1% METAL FILM RESISTOR Note 1. This publication sacrifices academic completeness for focus on the title subject. As such, operating details of the various switching regulator architectures utilized are not covered. Readers desiring background tutorial are directed to the References. Resonant Royer theory appears in Reference 1.

Welcome message from author
This document is posted to help you gain knowledge. Please leave a comment to let me know what you think about it! Share it to your friends and learn new things together.
Transcript

Application Note 118
AN118-1
an118fb
March 2008
transformers originally intended for LCD display backlight service are readily available. These transformers are mul-tiply sourced, well proven and competitively priced.
Figure 1’s resonant Royer topology achieves 100µVP-P noise at 250V output by minimizing high frequency harmonic in the power drive stage. The self oscillating resonant Royer circuitry is composed of Q2, Q3, C1, T1 and L1. Current flow through L1 causes the T1, Q2, Q3, C1 circuitry to oscillate in resonant fashion, supplying sine
Figure 1. Current Fed Resonant Royer Converter Produces High Voltage Output. A1 Biases Q1 Current Sink, Enforcing Output Voltage Stabilizing Feedback Loop. A1’s 0.001µF–1kΩ Network Phase Leads Output Filter, Optimizing Transient Response. D5-D6, Low Leakage Clamps, Protect A1
Introduction
Photomultipliers (PMT), avalanche photodiodes (APD), ultrasonic transducers, capacitance microphones, radia-tion detectors and similar devices require high voltage, low current bias. Additionally, the high voltage must be pristinely free of noise; well under a millivolt is a common requirement with a few hundred microvolts sometimes necessary. Normally, switching regulator configurations cannot achieve this performance level without employing special techniques. One aid to achieving low noise is that load currents rarely exceed 5mA. This freedom permits output filtering methods that are usually impractical.
This publication describes a variety of circuits featuring outputs from 200V to 1000V with output noise below 100µV measured in a 100MHz bandwidth. Special techniques enable this performance, most notably power stages optimized to minimize high frequency harmonic content. Although sophisticated, all examples presented utilize standard, commercially available magnetics—no custom components are required. This provision is intended to assist the user in quickly arriving at a produceable design. Circuits and their descriptions are presented beginning with the next ink.
BEFORE PROCEEDING ANY FURTHER, THE READER IS WARNED THAT CAUTION MUST BE USED IN THE CONSTRUCTION, TESTING AND USE OF THE TEXT’S CIRCUITS. HIGH VOLTAGE, LETHAL POTENTIALS ARE PRESENT IN THESE CIRCUITS. EXTREME CAUTION MUST BE USED IN WORKING WITH, AND MAKING CONNECTIONS TO, THESE CIRCUITS. REPEAT: THESE CIRCUITS CONTAIN DANGEROUS, HIGH VOLTAGE POTENTIALS. USE CAUTION.
Resonant Royer Based Converters
The resonant Royer topology is well suited to low noise operation due to its sinosoidal power delivery1. Addition-ally, the resonant Royer is particularly attractive because
High Voltage, Low Noise, DC/DC ConvertersA Kilovolt with 100 Microvolts of Noise
Jim Williams
L, LT, LTC and LTM are registered trademarks of Linear Technology Corporation. All other trademarks are the property of their respective owners.
AN118 F01
1µF, 400V
1µF, 400V
–
+
LT1635
0.001µF400V
1k
250VOUT
1M*
1kOUTPUTADJUST
499Ω*
430k
430k
10k
L1250µH
IRLRO24Q1
A1
Q3Q2
820Ω5V
T1
10k
D1-D4
10 65V
D5 D6
5 4 1 2 3
0.1µF
0.22µFx2 5V
C1
VREF = 0.2V
DANGER! Lethal Potentials Present — See Text
= ZDT1048 DUAL
L1 = CTX250-4, COILTRONICST1 = 210605R, COILTRONICS1µF = WIMA MKS-40.22µF = WIMA MKP-2D1-D4 = TOSHIBA DUAL DIODE 1SS306. CONNECT EACH UNIT IN SERIES.D5-D6 = 2N4393* = 1% METAL FILM RESISTOR
Note 1. This publication sacrifices academic completeness for focus on the title subject. As such, operating details of the various switching regulator architectures utilized are not covered. Readers desiring background tutorial are directed to the References. Resonant Royer theory appears in Reference 1.

Application Note 118
AN118-2
an118fb
wave drive to T1’s primary with resultant sine-like high voltage appearing across the secondary.
T1’s rectified and filtered output is fed back to amplifier-reference A1 which biases the Q1 current sink, completing a control loop around the Royer converter. L1 ensures that Q1 maintains constant current at high frequency. Milliampere level output current allows the 10k resistor in the output filter. This greatly aids filter performance with minimal power loss.2 The RC path to A1’s negative input combines with the 0.1µF capacitor to compensate A1’s loop. D5 and D6, low leakage clamps, protect A1 during start-up and transient events. Although Figure 2’s collector waveforms are distorted, no high frequency content is present.
The circuit’s low harmonic content combined with the RC output filter produces a transcendently clean output. Output noise (Figure 3) is just discernible in the monitoring instrumentation’s 100µV noise floor3.
Figure 4’s variant of Figure 1 maintains 100µV output noise while extending input supply range to 32V. Q1 may require heat sinking at high input supply voltage. Converter and loop operation is as before although compensation com-ponents are re-established to accommodate the LT1431 control element.
Figure 2. Resonant Royer Collector Waveforms Are Distorted Sinosoids; No High Frequency Content is Present
Figure 3. Figure 1’s Output Noise is Just Discernable in Monitoring Instrumentation’s 100µV Noise Floor
20µs/DIV AN118 F02
A = 5V/DIV
B = 5V/DIV
10µs/DIV AN118 F03
100µV/DIVAC COUPLED
AN118 F04
1µF, 400V
1µF, 400V
0.001µF400V
1k
250VOUT
1M*
5kOUTPUTADJUST
7.5k*
L1250µH
5V
T1
10k
D1-D4
10 6
5 4 1 2 3
LT1431
+V
GNDGND
FB
OUT
COMP
5V0.22µFx2
10k
0.2µF
1k
5V
D5 D65V
IRLRO24Q1
DANGER! Lethal Potentials Present — See Text
= ZDT1048 DUAL
L1 = CTX250-4, COILTRONICST1 = 210605R, COILTRONICS1µF = WIMA MKS-40.22µF = WIMA MKP-2D1-D4 = TOSHIBA DUAL DIODE 1SS306. CONNECT EACH UNIT IN SERIES.D5-D6 = 1N4148* = 1% METAL FILM RESISTOR
820Ω
Figure 4. LT1431 Regulator Based Variant of Figure 1 Maintains 100µV Output Noise While Extending Input Supply Range to 32V. Q1 May Require Heat Sinking at High Input Supply Voltages
Note 2. As previously mentioned, low current requirements permit certain freedoms in the output filter and feedback network. See Appendix A for examples and discussion. Note 3. Measurement technique and instrumentation choice for faithful low level noise measurement requires diligence. See Appendices B through E for practical considerations.

Application Note 118
AN118-3
an118fb
Switched Current Source Based Resonant Royer Converters
The previous resonant Royer examples utilize linear con-trol of converter current to furnish harmonic free drive. The trade off is decreased efficiency, particularly as input voltage scales. Improved efficiency is possible by employ-ing switched mode current drive to the Royer converter. Unfortunately, such switched drive usually introduces noise. As will be shown, this undesirable consequence can be countered.
Figure 5 replaces the linearly operated current sink with a switching regulator. The Royer converter and its loop are as before; Figure 6’s transistor collector waveshape (trace A) is similar to the other circuits. The high speed, switch mode current sink drive (trace B) efficiently feeds L1. This switched operation improves efficiency but degrades output noise. Figure 7 shows switching regulator harmonic clearly responsible for 3mV peak to peak output noise – about 30 times greater than the linearly operated circuits.
Careful examination of Figure 7 reveals almost no Royer based residue. The noise is dominated by switching regulator artifacts. Eliminating this switching regulator originated noise while maintaining efficiency requires special circuitry but is readily achievable.
AN118 F05
1µF, 400V
1µF, 400V
0.22µF400V
10k
250VOUT
1M
2.5kOUTPUTADJUST
3.65k*
L1250µH
5V
T1
10k
D1-D4
10 6
5 4 1 2 3
LTC3401
VOUTVIN
SDFB
GND
MODE
SWITCH
5V0.22µFx2
D6 D55V
VCRT
1µF20k
5V
1M
1N5817
DANGER! Lethal Potentials Present — See Text
= ZDT1048 DUAL
L1 = CTX250-4, COILTRONICST1 = 210605R, COILTRONICS1µF = WIMA MKS-40.22µF = WIMA MKP-2D1-D4 = TOSHIBA DUAL DIODE 1SS306. CONNECT EACH UNIT IN SERIES.D5-D6 = 1N4148* = 1% METAL FILM RESISTOR
820Ω
Figure 5. Replacing Linearly Operated Current Sink with Switching Regulator Minimizes Heating Although Output Noise Increases
A = 20µs/DIVB = 1µs/DIV
(TRIGGERS ASYNCRONOUS)
AN118 F06
A = 5V/DIV
B = 5V/DIV
500ns/DIV AN118 F07
A = 1mV/DIVAC COUPLED
Figure 6. Resonant Royer Collector Waveshape (Trace A) is Similar to Previous Circuits. High Speed, Switched Mode Current Sink Drive (Trace B) Efficiency Feeds L1
Figure 7. Switching Regulator Harmonic Results in 3mVP-P Output Noise

Application Note 118
AN118-4
an118fb
Low Noise Switching Regulator Driven Resonant Royer Converters
Figure 8 examplifies the aforementioned “special circuitry”. The resonant Royer converter and its loop are reminis-cent of previous circuits. The fundamental difference is the LT1534 switching regulator which utilizes controlled transition times to retard high frequency harmonic while maintaining efficiency. This approach blends switching and linear current sink benefits4. Voltage and current transi-tion rate, set by RV and RI respectively, is a compromise between efficiency and noise reduction.
Note 4. As stated, this forum must suffer brevity to maintain focus. The LT1534’s controlled transition time operation mandates further study. See Reference 3.
Figure 9’s Royer collector waveshape (trace A) is nearly identical to the one produced by Figure 5’s circuit. Trace B, depicting LT1534 controlled transition times, markedly departs from its Figure 5 counterpart. These controlled transition times dramatically reduce output noise (Figure 10) to 150µVP-P — a 20x improvement vs Figure 7’s LTC3401 based results.
AN118 F08
1µF, 400V
1µF, 400V
0.002µF400V
100k
250VOUT
1M*
1kOUTPUTADJUST
4.53k*
L1
L228nH
5V
T1
1k
D1-D4
10 6
5 4 1 2 3
LT1534
COL+V
VCGND PGND RV RI
CT FB
RT
0.1µF33k 33k
5V1N5817
5V0.22µFx2
820pF
16.9k*
DANGER! Lethal Potentials Present — See Text
= ZDT1048 DUAL
L2 = COILCRAFT B08TL1 = CTX250-4, COILTRONICST1 = 210605R, COILTRONICS1µF = WIMA MKS-40.22µF = WIMA MKP-2D1-D4 = TOSHIBA DUAL DIODE 1SS306. CONNECT EACH UNIT IN SERIES.D5-D6 = 1N4148* = 1% METAL FILM RESISTOR
820Ω
Figure 8. LT1534’s Controlled Transition Times Retard High Frequency Harmonic and Maintain Low Heat Dissipation. Approach Blends Switching and Linear Current Sink Benefits
A = 20µs/DIVB = 10µs/DIV
(TRIGGERS ASYNCRONOUS)
AN118 F09
A = 5V/DIV
B = 5V/DIV
Figure 9. Resonant Royer Collector Waveshape (Trace A) is Identical to Figure 5’s LT3401 Circuit; LT1534 Current Sink’s Controlled Transition Times (Trace B) Attenuate High Frequency Harmonic
Figure 10. Switched Current Sinks Controlled Transition Times Dramatically Lower Noise to 150µVP-P —A 20x Improvement vs Figure 7’s LTC3401 Results
10µs/DIV AN118 F10
A = 100µV/DIVAC COUPLED

Application Note 118
AN118-5
an118fb
Figure 11 is essentially identical to Figure 8 except that it produces a negative 1000V output. A1 provides low impedance, inverting feedback to the LT1534. Figure 12a’s output noise measures inside 1mV. As before, resonant Royer ripple dominates the noise — no high frequency content is detectable. It is worth noting that this noise
AN118 F11
0.015µF, 2kV
0.033µF, 2k
–1000VOUT
9M**
L228nH
5V
T1
10k
D1-D4
10 6
5 4 1 2 3
LT1534
COL+V
VCGND PGND RV RI
CT FB
RT
15µF
24k 39k
5V1N5817
5V0.22µF
820pF
16.9k*
–
+
5kOUTPUTADJUST 8.06k*
R1LT1006
DANGER! Lethal Potentials Present — See Text
= ZDT1048 DUAL
L1 = CTX150-4, COILTRONICST1 = 210609R, COILTRONICS0.033µF/0.015µF = WIMA MKS-40.22µF = WIMA MKP-2D1-D4 = 1N6529L2 = COILCRAFT B08TD5-D6 = 1N4148* = 1% METAL FILM RESISTOR** = IRC, CGH-1, 1%
+
820Ω
figure proportionally improves with increased filter ca-pacitor values. For example, Figure 12b indicates only 100µV noise with filter capacitor values increased by 10x, although capacitor physical size is large. The original val-ues selected represent a reasonable compromise between noise performance and physical size.
Figure 12a. –1000V Converter Output Noise Measures Inside 1mV (1PPM-0.0001%) in 100MHz Bandwidth. Resonant Royer Related Ripple Dominates Residue—No High Frequency Content is Detectable
Figure 11. Controlled Transition Time Switching Regulator Applied to a Negative Output, 1000V Converter. A1 Provides Low Impedance, Inverting Feedback to LT1534
Figure 12b. 10x Increase in Figure 11’s Filter Capacitor Values Reduces Noise to 100µV. Penalty is Capacitor Physical Size
10µs/DIV AN118 F12a
A = 500µV/DIVAC COUPLED
10µs/DIV AN118 F12b
A = 100µV/DIVAC COUPLED

Application Note 118
AN118-6
an118fb
Controlled Transition Push-Pull Converters
Controlled transition techniques are also directly applicable to push-pull architectures. Figure 13 uses a controlled transition push-pull regulator in a simple loop to control a 300V output converter. Symmetrical transformer drive and controlled switching edge times promote low output noise. The D1-D4 connected damper further minimizes residual aberrations. In this case, inductors are used in the output filter although appropriate resistor values could be employed.
Figure 14 displays smooth transitions at the transformer secondary outputs (trace A is T1 Pin 4, trace B, T1 Pin 7). Absence of high frequency harmonic results in extremely low noise. Figure 15’s fundamental related output resi-due approaches the 100µV measurement noise floor in a 100MHz bandpass. This is spectacularly low noise
performance in any DC/DC converter and certainly in one providing high voltage. Here, at 300V output, noise represents less than 1 part in 3 million.
Figure 16 is similar except that output range is variable from 0V to 300V. The LT1533 is replaced by an LT3439 which contains no control elements. It simply drives the transformer with 50% duty cycle, controlled switching transitions. Feedback control is enforced by A1-Q1-Q2 driving current into T1’s primary center tap. A1 compares a resistively derived portion of the output with a user sup-plied control voltage. The values shown produce a 0V to 300V output in response to a 0V to 1V control voltage. An RC network from Q2’s collector to A1’s positive input com-pensates the loop. Collector waveforms and output noise signature are nearly identical to Figure 13. Output noise is 100µVP-P over the entire 0V to 300V output range.
AN118 F13
300VOUT
1M*
3.83k*
1k OUTPUT ADJUST
L328nH
D1-D4
4 7 (TIE 5-6)
1 2 3
* = 1% METAL FILM RESISTORL3 = COILCRAFT B08TL1, L2 = COILCRAFT LPS5010-334MLBD1-D4 = 1N6529T1 = PICO 32195
LT1533
COLA COLB+V5V
GND PGND RV RI
CT FB
RT
VC
33k 43k
5V
680pF
16.9k*
0.1µF
150ΩL1
330µH0.01µF
L2330µH
10µF450V
4.7µF450V
++
DANGER! Lethal Potentials Present — See Text
T1
Figure 13. A Push-Pull Drive, Controlled Transition, 300V Output Converter. Symmetrical Transformer Drive and Slow Edges Promote Low Output Noise
Figure 14. Transformer Secondary Outputs Show No High Frequency Artifacts
Figure 15. Push-Pull Converter Related Residue Approaches 100µV Measurement Noise Floor. No Wideband Components Appear in 100MHz Measurement Bandpass
2µs/DIV AN118 F14
A = 200V/DIV
B = 200V/DIV
5µs/DIV AN118 F15
A = 100µV/DIVAC COUPLED

Application Note 118
AN118-7
an118fb
Flyback Converters
Flyback converters, due to their abrupt, poorly controlled energy delivery, are not usually associated with low noise output. However, careful magnetic selection and layout can provide surprisingly good performance, particularly at low output current.
Figure 17’s design provides 200V from a 5V input5. The scheme is a basic inductor flyback boost regulator with some important deviations. Q1, a high voltage device, has been interposed between the LT1172 switching regulator and the inductor. This permits the regulator to control Q1’s high voltage switching without undergoing high
AN118 F16
VOUT0 TO 300V
T14 7 (TIE 5-6)
321
* = 1% METAL FILM RESISTORT1 = PICO 32195D1-D4 = 1N6529L1 = COILCRAFT LP5010-334MLB
LT3439
COLA COLB
+V GND PGND
CT
RT RSL
150Ω0.01µF
680pF
16.9k* 27k
5V
10µF400V
4.7µF400V
–
+100k
510k
510k
10k
1µF
100k
L1330µH
100Ω
0.001µF
LTC6240
2.2µF
5V
VCONTROL0 TO 1V
1M*
3.32k*
100µF
A1
2N3906Q1
5V
D44Q2
DANGER! Lethal Potentials Present — See Text
+ +
+
voltage stress. Q1, operating as a “cascode” with the LT1172’s internal switch, withstands L1’s high voltage flyback events6.
Diodes associated with Q1’s source terminal clamp L1 originated spikes arriving via Q1’s junction capacitance. The high voltage is rectified and filtered, forming the circuits’ output. The ferrite bead, 100Ω and 300Ω resistors aid filter
AN118 F17
LT1172
GND E2 E1VC
VIN FB
SW5V
1k
+1µF
+1µF
100k1N5712
15V1N4702
1N5256B30V 5% 1N5819
BAS521
1µF
+33µF
5V
L1
Q1IRF840
1µF = 2x – 0.47µF250V
100Ω 300Ω
6.19k*
1M* BAS521
0.47µF250V
OUTPUT200V
DANGER! Lethal Potentials Present — See Text
= FERRITE BEAD FERRONICS 21-110J* = 1% METAL FILM RESISTORL1 = 33µH, COILTRONICS UP2B0.47µF = PANASONIC ECW-U2474KCV
Figure 16. Full Range Adjustable Version of Figure 13. VCONTROL Directed A1 Sets T1 Drive Via Q1-Q2. 1M-3.32k Divider Provides Feedback, Stabilized by A1’s Input Capacitors. Waveforms Are Similar to Figure 13. Output Noise is 100µVP-P
Figure 17. 5V to 200V Output Converter. Cascoded Q1 Switches High Voltage, Allowing Low Voltage Regulator to Control Output. Diode Clamps Protect Regulator from Transients; 100k Path Bootstraps Q1’s Gate Drive from L1’s Flyback Events. Output Connected 300Ω- Diode Combination Provides Short-Circuit Protection. Ferrite Bead, 100Ω and 300Ω Resistors Minimize High Frequency Output Noise
Note 5. LTC application note veterans, a weary crew, will recognize material in this section from AN98 and AN113. The original circuits and text have been modified as necessary to suit low noise operation. See References. Note 6. See References 13-17 for historical perspective and study on cascodes.

Application Note 118
AN118-8
an118fb
efficiency7. Feedback to the regulator stabilizes the loop and the VC pin network provides frequency compensation. A 100k path from L1 bootstraps Q1’s gate drive to about 10V, ensuring saturation. The output connected diode provides short-circuit protection by shutting down the LT1172 if the output is accidentally grounded.
Figure 18’s traces A and C are LT1172 switch current and voltage, respectively. Q1’s drain is trace B. Current ramp termination results in a high voltage flyback event at Q1’s drain. A safely attenuated version of the flyback appears at the LT1172 switch. The sinosoidal signature, due to inductor ring-off between conduction cycles, is harmless.
Figure 19, output noise, is composed of low frequency ripple and wideband, flyback related spikes measuring 1mVP-P in a 100MHz bandpass.
Figure 20, contributed by Albert M. Wu of LTC, is a trans-former coupled flyback circuit. The transformer secondary provides voltage step-up referred to the flyback driven primary. The 4.22M resistor supplies feedback to the regu-lator, closing a control loop. A 10k-0.68µF filter network attenuates high frequency harmonic with minimal voltage drop. Flyback related transients are clearly visible in Figure 21’s output noise although within 300µVP-P.
C = 20V/DIV
A = 0.5A/DIV
B = 100V/DIV
2µs/DIV AN118 F18
5µs/DIV AN118 F19
1mV/DIVAC COUPLED
AN118 F20
C1: 2.2µF, 25V, X5R, 1206C2: TDK C3225X7R2J683MD1: VISHAY GSD2004S DUAL DIODE CONNECTED IN SERIEST1: TDK LDT565630T-041C3: WIMA MKS-4* = IRC-CGH-1, 1%
LT3580
SYNC SS
VIN
FBRT
VC
GNDSHDN
SW
VIN5V
464k 0.47µF100pF
C12.2µF
4.7µH
1
4
7, 8
5, 6
T11:10:4
RFB 4.22M*
10nF
10k
C268nF
D1
1N5817
10k
C30.68µF400V
VOUT = 350V
DANGER! Lethal Potentials Present — See Text
2µs/DIV AN118 F21
A = 200µV/DIVAC COUPLED
Figure 18. Waveforms for 5V to 200V Converter Include LT1172 Switch Current and Voltage (Traces A and C, Respectively) and Q1’s Drain Voltage (Trace B). Current Ramp Termination Results in High Voltage Flyback Event at Q1 Drain. Safely Attenuated Version Appears at LT1172 Switch. Sinosoidal Signature, Due to Inductor Ring-Off Between Current Conduction Cycles, is Harmless. All Traces Intensified Near Center Screen for Photographic Clarity
Figure 19. Figure 17’s Output Noise, Composed of Low Frequency Ripple and Wideband, Flyback Related Spikes, Measures 1mVP-P in 100MHz Bandpass
Figure 20. 5V Powered Transformer Coupled Flyback Converter Produces 350V Output
Figure 21. High Speed Transients in Figure 20’s Noise Signature are Within 300µVP-P
Note 7. Tutorial on ferrite beads appears in Appendix F.

Application Note 118
AN118-9
an118fb
Figure 22 employs the LT3468 photoflash capacitor charger as a general purpose high voltage DC/DC converter. Nor-mally, the LT3468 regulates its output at 300V by sensing T1’s flyback pulse characteristic. This circuit allows the LT3468 to regulate at lower voltages by truncating its charge cycle before the output reaches 300V. A1 compares a divided down portion of the output with the program input voltage. When the program voltage (A1 + input) is exceeded by the output derived potential (A1 – input) A1’s output goes low, shutting down the LT3468. The feedback capacitor provides AC hysteresis, sharpening A1’s output to prevent chattering at the trip point. The LT3468 remains shut down until the output voltage drops low enough to trip A1’s output high, turning it back on. In this way, A1 duty cycle modulates the LT3468, causing the output voltage to stabilize at a point determined by the program input.
Figure 23’s 250V DC output (Trace B) decays down about 2V until A1 (Trace A) goes high, enabling the LT3468 and restoring the loop. This simple circuit works well, regulat-ing over a programmable 0V to 300V range, although its inherent hysteretic operation mandates the (unacceptable) 2V output ripple noted. Loop repetition rate varies with input voltage, output set point and load but the ripple is always present. The following circuit greatly reduces ripple amplitude although complexity increases.
Figure 24’s post-regulator reduces Figure 22’s output ripple and noise to only 2mV. A1 and the LT3468 are identical to the previous circuit, except for the 15V zener diode in series with the 10M-100k feedback divider. This component causes C1’s voltage, and hence Q1’s collector, to regulate 15V above the VPROGRAM input dictated point. The VPROGRAM input is also routed to the A2-Q2-Q1 linear post-regulator. A2’s 10M-100k feedback divider does not include a zener, so the post-regulator follows the VPROGRAM input with no offset. This arrangement forces 15V across Q1 at all output voltages. This figure is high enough to eliminate undesirable ripple and noise from the output while keeping Q1 dissipation low.
Q3 and Q4 form a current limit, protecting Q1 from overload. Excessive current through the 50Ω shunt turns Q3 on. Q3 drives Q4, shutting down the LT3468. Simultaneously, a portion of Q3’s collector current turns Q2 on hard, shutting off Q1. This loop dominates the normal regulation feedback, protecting the circuit until the overload is removed.
AN118 F22
*1% METAL FILM RESISTORC1: RUBYCON 330FW13AK6325D1: TOSHIBA DUAL DIODE 1SS306, CONNECT DIODES IN SERIESD2: PANASONIC MA2Z720T1: TDK LDT565630T-002
LT3468
CHARGE DONE
VIN
GND
SW
5V4
1
5
8
T1D1
C113µF330V
0V TO 300VOUT5mA MAXIMUM
D2
+4.7µF
–
+
A1LT1006
33pF
10k
10k
100k*
10M*
VPROGRAM INPUT0V TO 3V = 0V TO 300VOUT
A = 1V/DIVAC COUPLEDON 250V DC
LEVEL
A = 5V/DIV
20ms/DIV AN118 F23
Figure 22. A Voltage Programmable 0V to 300V Output Regulator. A1 Controls Regulator Output by Duty Cycle Modulating LT3468/T1 DC/DC Converter Power Delivery
Figure 23. Details of Figure 22’s Duty Cycle Modulated Operation. High Voltage Output (Trace B) Ramps Down Until A1 (Trace A) Goes High, Enabling LT3468/T1 to Restore Output. Loop Repetition Rate Varies with Input Voltage, Output Set Point and Load

Application Note 118
AN118-10
an118fb
Figure 25 shows just how effective the post regulator is. When A1 (trace A) goes high, Q1’s collector (trace B) ramps up in response (note LT3468 switching artifacts on ramps upward slope). When the A1-LT3468 loop is satisfied, A1 goes low and Q1’s collector ramps down. The output post-regulator (trace C), however, rejects the ripple, showing only 2mV of noise. Slight trace blurring derives from A1-LT3468 loop jitter.
Summary of Circuit Characteristics
Figure 26 summarizes the circuits presented with salient characteristics noted. This chart is only a generalized guideline and not an indicator of capabilities or limits. There are too many variables and exceptions to acco-modate the categorical statement a chart implies. The interdependence of circuit parameters makes summarizing or rating various approaches a hazardous exercise. There is simply no intellectually responsible way to streamline the selection and design process if optimum results are desired. A meaningful choice must be the outcome of laboratory-based experimentation. There are just too many interdependent variables and surprises for a systematic,
C = 5mV/DIVAC COUPLEDON 200V DC
LEVEL
A = 5V/DIV
B = 0.1V/DIVAC COUPLED
100µs/DIV AN118 F25
Figure 24. Post-Regulation Reduces Figure 22’s 2V Output Ripple to 2mV. LT3468-Based DC/DC Converter, Similar to Figure 22, Delivers High Voltage to Q1 Collector. A2, Q1, Q2 Form Tracking, High Voltage Linear Regulator. Zener Sets Q1 VCE = 15V, Ensuring Tracking with Minimal Dissipation. Q3-Q4 Limit Short-Circuit Output Current
Figure 25. Low Ripple Output (Trace C) is Apparent in Post-Regulator’s Operation. Traces A and B are A1 Output and Q1’s Collector, Respectively. Trace Blurring, Right of Photo Center, Derives from Loop Jitter
Note 8. Readers detecting author ambivalence at Figure 26’s inclusion are not hallucinating. Locally based marketeers champion such charts; the writer is less enthusiastic.
theoretically based selection. Charts seek authority through glib simplification and simplification is Disaster’s deputy. Nonetheless, Figure 26, in all its appropriated glory, lists input supply range, output voltage and current along with comments for each circuit8.
+
DANGER! Lethal Potentials Present — See Text
LT3468
VPROGRAM INPUT0V TO 3V = 0V TO 300VOUT
SW
GND
CHARGE
AN118 F24
DONE
VIN
T1C113µF330V
1N470215V
44.7µF
1
5
8
5V
*1% METAL FILM RESISTOR**0.1% METAL FILM RESISTOR†WIMA MKS-4, 400VC1: RUBYCON 330FW13AK6325D1: TOSHIBA DUAL DIODE 1SS306, CONNECT DIODES IN SERIESD2: PANASONIC MA2Z720D3: 1N4148Q1, Q2: 2N6517Q3: 2N6520T1: TDK LDT565630T-002
D2
33pF
Q42N3904
10k
10k
5V
100k**
D1
10k
10M*
200k
0V TO 300VOUT5mA MAXIMUM
100k
50Ω 1k
10k
D3
10k
1k
10M*
100k**
10k
–
+
10k A11/2 LT1013
–
+A2
1/2 LT1013
100k
0.68µF†
0.1µF
Q2
Q1
Q3
0.01µF†

Application Note 118
AN118-11
an118fb
CIRCUIT TYPE
FIGURE NUMBER
SUPPLY RANGE (1mA LOAD)
MAXIMUM OUTPUT CURRENT AT TEST VOLTAGE
COMMENTS
LT1635 - Linear Resonant Royer 1 2.7V to 12V 2mA at 250V <100µV Wideband Noise. Easily Voltage Controlled. Potential Dissipation Issue at High Supply Voltages.
LT1431 - Linear Resonant Royer 4 2.7V to 32V 2mA at 250V <100µV Wideband Noise. Wide Supply Range. Potential Dissipation Issue at High Supply Voltages.
LT3401 - Switched Resonant Royer 5 2.7V to 5V 3.5mA at 250V 3mV Wideband Noise. High Output Current, Better Efficiency than Figures 1 and 4.
LT1534 - Switched Resonant Royer 8 2.7V to 15V 2mA at 250V ≈100µV Wideband Noise. Good Trade-Off Between Figures 1, 4 and 5.
LT1534 - Swiched Resonant Royer 11 4.5V to 15V 1.2mA at –1000V 1mV Wideband Noise Reducable to 100µV. Negative 1000V Output Suits Photomultiplier Tubes.
LT1533 Push-Pull 13 2.7V to 15V 2mA at 300V ≈100µV Wideband Noise.
LT3439 Push-Pull 16 4.5V to 6V 2mA at 0V to 300V Full Range Adjustable Version of Figure 13. ≈100µV Wideband Noise.
LT1172 - Cascode Inductor Flyback 17 3.5V to 30V 2mA at 200V VOUT Limit ≈200V. ≈1mV Wideband Noise.
LT3580 - XFMR Flyback 20 2.7V to 20V 4mA at 350V 300µV Wideband Noise. Wide Supply Range. High Output Current. Small Transformer.
LT3468 - LT1006 XFMR Flyback 22 3.8V to 12V 5mA at 250V 1.5V Noise. Simple Voltage Control Input 0VIN to 3VIN = 0VOUT – 300VOUT.
LT3468 - LT1013 XFMR Flyback - Linear
24 3.8V to 12V 5mA at 250V 2mV Wideband Noise. Voltage Control Input 0VIN to 3VIN = 0VOUT to 300VOUT.
Figure 26. Summarized Characteristics of Techniques Presented. Applicable Circuit Depends on Application Specifics
1. Williams, Jim, “A Fourth Generation of LCD Backlight Technology,” Linear Technology Corporation, Applica-tion Note 65, November 1995, p. 32-34, 119.
2. Bright, Pittman and Royer, “Transistors As On-Off Switches in Saturable Core Circuits,” Electrical Manu-facturing, December 1954. Available from Technomic Publishing, Lancaster, PA.
3. Williams, Jim, “A Monolithic Switching Regulator with 100µV Output Noise,” Linear Technology Corporation, Application Note 70, October 1997.
4. Baxendall, P.J., “Transistor Sine-Wave LC Oscillators,” British Journal of IEEE, February 1960, Paper No. 2978E.
5. Williams, Jim, “Low Noise Varactor Biasing with Switching Regulators,” Linear Technology Corpora-tion, Application Note 85, August 2000, p. 4-6.
6. Williams, Jim, “Minimizing Switching Residue in Linear Regulator Outputs”. Linear Technology Cor-poration, Application Note 101, July 2005.
7. Morrison, Ralph, “Grounding and Shielding Tech-niques in Instrumentation,” Wiley-Interscience, 1986.
8. Fair-Rite Corporation, “Fair-Rite Soft Ferrites,” Fair-Rite Corporation, 1998.
9. Sheehan, Dan, “Determine Noise of DC/DC Convert-ers,” Electronic Design, September 27, 1973.
10. Ott, Henry W., “Noise Reduction Techniques in Elec-tronic Systems,” Wiley Interscience, 1976.
11. Tektronix, Inc. “Type 1A7A Differential Amplifier Instruction Manual,” “Check Overall Noise Level Tangentially”, p. 5-36 and 5-37, 1968.
REFERENCES
Note: This application note was derived from a manuscript originally prepared for publication in EDN magazine.

Application Note 118
AN118-12
an118fb
12. Witt, Jeff, “The LT1533 Heralds a New Class of Low Noise Switching Regulators,” Linear Technology, Vol. VII, No. 3, August 1997, Linear Technology Corporation.
13. Williams, Jim, “Bias Voltage and Current Sense Circuits for Avalanche Photodiodes,” Linear Technology Cor-poration, Application Note 92, November 2002, p.8.
14. Williams, Jim, “Switching Regulators for Poets,” Ap-pendix D, Linear Technology Corporation, Application Note 25, September 1987.
15. Hickman, R.W. and Hunt, F.V., “On Electronic Voltage Stabilizers,” “Cascode,” Review of Scientific Instru-ments, January 1939, p. 6-21, 16.
16. Williams, Jim, “Signal Sources, Conditioners and Power Circuitry,” Linear Technology Corporation, Application Note 98, November 2004, p. 20-21.
17. Williams, Jim, “Power Conversion, Measurement and Pulse Circuits,” Linear Technology Corporation, Application Note 113, August 2007.
18. Williams, Jim and Wu, Albert, “Simple Circuitry for Cellular Telephone/Camera Flash Illumination,” Linear Technology Corporation, Application Note 95, March 2004.
19. LT3580 Data Sheet, Linear Technology Corpora-tion.
Feedback Considerations in High Voltage DC/DC Converters
A high voltage DC/DC converter feedback network is a study in compromise. The appropriate choice is applica-tion dependent. Considerations include desired output impedance, loop stability, transient response and high
voltage induced overstress protection. Figure A1 lists typical options.
(a) is basic DC feedback and requires no special com-mentary. (b) adds an AC lead network for improved dynamics. Diode clamps protect the feedback node from the capacitors differentiated response. (c)’s low ripple,
Figure A1. Feedback Network Options. (a) Is Basic DC Feedback. (b) Adds AC Lead Network for Improved Dynamics. Diode Clamps Protect Feedback Node from Capacitor’s Differentiated Response. (c)’s Low Ripple Two Section Filter Slows Loop Transmission but Lead Network Provides Stability. Resistor R Sets DC Output Impedance. (d) Encloses R in DC Loop, Lowering Output Resistance. Feedback Capacitor Supplies Leading Response. (e) Moves Feedback Capacitor to Filter Input, Further Extending (d)’s Leading Response. (f), Replacing Filter Resistor (R) with Inductor, Lowers Output Resistance but Introduces Parasitic Shunt Capacitive Path and Stray Flux Sensitivity
APPENDIX A
AN118 A1
FROM HV RECTIFICER
TO FB
OUT
(a)
FROM HVRECTIFICER
TO FB
OUT
(b)
+VIN
FROM HVRECTIFICER
TO FB
OUT
(c)
+VIN
FROM HVRECTIFICER
TO FB
OUT
(d)
+VIN
FROM HVRECTIFICER
TO FB
OUT
(e) (f)
+VIN
STRAY FLUXC PARASITIC
LOUT
LOSS TERMS
LOSS TERMS
RR
R
FROMHV
RECTIFIER

Application Note 118
AN118-13
an118fb
Note 1. See Appendix G.
Undesired output components in switching regulators are commonly referred to as “noise.” The rapid, switched mode power delivery that permits high efficiency conversion also creates wideband harmonic energy. This undesirable energy appears as radiated and conducted components, or “noise.” Actually switching regulator output “noise” isn’t really noise at all, but coherent, high frequency residue directly related to the regulator’s switching. Unfortunately, it is almost universal practice to refer to these parasitics as “noise,” and this publication maintains this common, albeit inaccurate, terminology.1
Measuring Noise
There are an almost uncountable number of ways to specify noise in a switching regulator’s output. It is com-mon industrial practice to specify peak-to-peak noise in
Note 1. Less genteelly, “If you can’t beat ‘em, join ‘em.” Note 2. One DC/DC converter manufacturer specifies RMS noise in a 20MHz bandwidth. This is beyond deviousness and unworthy of comment. Note 3. Except, of course, eager purveyors of power sources who specify them in this manner.
a 20MHz bandpass.2 Realistically, electronic systems are readily upset by spectral energy beyond 20MHz, and this specification restriction benefits no one.3 Considering all this, it seems appropriate to specify peak-to-peak noise in a verified 100MHz bandwidth. Reliable low level measure-ments in this bandpass require careful instrumentation choice and connection practices.
Our study begins by selecting test instrumentation and verifying its bandwidth and noise. This necessitates the arrangement shown in Figure B1. Figure B2 diagrams signal flow. The pulse generator supplies a subnanosec-
APPENDIX B
SPECIFYING AND MEASURING SOMETHING CALLED NOISE
two section filter slows transient response but a lead network provides stability. Resistor R, outside the loop, sets DC output impedance. (d) encloses R within the DC loop, lowering output resistance but delaying loop transmission. A feedback capacitor supplies corrective leading response. (e) moves the feedback capacitor to the filter input, further extending (d)’s leading response. (f) replaces filter resistor R with an inductor, lowering output resistance but introducing parasitic shunt capacitance which combines with capacitor loss terms to degrade filtering. The inductor also approximates a transformer secondary, vulnerable to stray flux pick-up with resulting increased output noise1.
A common concern in any high voltage feedback network is reliability. Components must be quite carefully chosen. Voltage ratings should be conservative and strictly adhered to. While component ratings are easily ascertained, more subtle effects such as ill-suited board material and board
wash contaminants can be reliability hazards. Long term electro-migration effects can have undesirable results. Every potential unintended conductive path should be considered as an error source and layout planned ac-cordingly. Operating temperature, altitude, humidity and condensation effects must be anticipated. In extreme cases, it may be necessary to rout the board under components operating at high voltage. Similarly, it is common practice to use several units in series to minimize voltage across the output connected feedback resistor. Contemporary packaging requirements emphasize tightly packed layout which may conflict with high voltage standoff requirements. This tradeoff must be carefully reviewed or reliability will suffer. The potentially deleterious (disastrous) effects of environmental factors, layout and component choice over time cannot be overstated. Clear thinking is needed to avoid unpleasant surprises.
Editor’s Note: Appendices B through E are thinly edited and modified versions of tutorials first
appearing in AN70. Although originally intended to address controlled transition applications
(e.g. LT1533, 4 and LT3439) the material is directly relevant and warrants inclusion here.

Application Note 118
AN118-14
an118fb
Figu
re B
1. 1
00M
Hz B
andw
idth
Ver
ifica
tion
Test
Set
up.
Note
Coa
xial
Con
nect
ions
for W
ideb
and
Sign
al In
tegr
ity

Application Note 118
AN118-15
an118fb
OSCILLOSCOPETEKTRONIX 454A
AMPLIFIERX40dB
HP-461A
150MHz(tr = 2.4ns)
<1mV≈1ns RISE TIME
(350MHz)
1000MHz<1ns RISE TIME = 350MHz
CASCADED BANDWIDTH ≈ 100MHz(≈3.5ns RISE TIME)
150MHz(tr = 2.4ns)
ATTENUATORHP-355D
PULSEGENERATOR
HP-215A 50ΩZIN50Ω
ZIN50Ω
AN118 B2
Figure B2. Subnanosecond Pulse Generator and Wideband Attenuator Provide Fast Step to Verify Test Setup Bandwidth
2ns/DIV AN118 B3
100µV/DIV
10µs/DIV AN118 B4
100µV/DIV
Figure B3. Oscilloscope Display Verifies Test Setup’s 100MHz (3.5ns Rise Time) Bandwidth. Baseline Noise Derives from Amplifier’s 50Ω Input Noise Floor
Figure B4. Output Switching Noise Is Just Discernible in a 100MHz Bandpass
10µs/DIV AN118 B5
100µV/DIV
50µs/DIV AN118 B6
10mV/DIV
Figure B5. 10MHz Band Limited Version of Preceding Photo. All Switching Noise Information is Preserved, Indicating Adequate Bandwidth
Figure B6. Commercially Available Switching Regulator’s Output Noise in a 1MHz Bandpass. Unit Appears to Meet its 5mVP-P Noise Specification
ond rise time step to the attenuator, which produces a <1mV version of the step. The amplifier takes 40dB of gain (A = 100) and the oscilloscope displays the result. The “front-to-back” cascaded bandwidth of this system should be about 100MHz (tRISE = 3.5ns) and Figure B3 reveals this to be so. Figure B3’s trace shows 3.5ns rise
time and about 100µV of noise. The noise is limited by the amplifier’s 50Ω noise floor.4
Note 4. Observed peak-to-peak noise is somewhat affected by the oscilloscope’s “intensity” setting. Reference 11 describes a method for normalizing the measurement.

Application Note 118
AN118-16
an118fb
50µs/DIV AN118 B7
10mV/DIV
50µs/DIV AN118 B8
20mV/DIV
Figure B7. Figure B6’s Regulator Noise in a 10MHz Bandpass. 6mVP-P Noise Exceeds Regulator’s Claimed 5mV Specification
Figure B8. Wideband Observation of Figure B7 Shows 30mVP-P Noise—Six Times the Regulator’s Specification!
10ms/DIV AN118 B9
500µV/DIV
10ms/DIV AN118 B10
50µV/DIV
Figure B9. 1Hz to 3kHz Noise Using Standard Frequency Compensation. Almost All Noise Power is Below 1kHz
Figure B10. Feedback Lead Network Decreases Low Frequency Noise, Even as Measurement Bandwidth Expands to 100kHz
Note 5. Caveat Emptor.
Figure B4’s presentation of output noise shows barely vis-ible switching artifacts (at vertical graticule lines 4, 6 and 8) in the 100MHz bandpass. Fundamental ripple is seen more clearly, although similarly noise floor dominated. Restrict-ing measurement bandwidth to 10MHz (Figure B5) reduces noise floor amplitude, although switching noise and ripple amplitudes are preserved. This indicates that there is no signal power beyond 10MHz. Further measurements as bandwidth is successively reduced can determine the highest frequency content present.
The importance of measurement bandwidth is further illustrated by Figures B6 to B8. Figure B6 measures a commercially available DC/DC converter in a 1MHz bandpass. The unit appears to meet its claimed 5mVP-P noise specification. In Figure B7, bandwidth is increased
to 10MHz. Spike amplitude enlarges to 6mVP-P, about 1mV outside the specification limit. Figure B8’s 50MHz viewpoint brings an unpleasant surprise. Spikes measure 30mVP-P—six times the specified limit!5
Low Frequency Noise
Low frequency noise is rarely a concern, because it almost never affects system operation. Low frequency noise is shown in Figure B9. It is possible to reduce low frequency noise by rolling off control loop bandwidth. Figure B10 shows about a five times improvement when this is done, even with greater measurement bandwidth. A possible disadvantage is loss of loop bandwidth and slower transient response.

Application Note 118
AN118-17
an118fb
INSTRUMENT TYPE
MANUFACTURER
MODEL NUMBER
–3dB BANDWIDTH
MAXIMUM SENSITIVITY/GAIN
AVAILABILITY
COMMENTS
Amplifier Hewlett-Packard 461A 175MHz Gain = 100 Secondary Market 50Ω Input, Stand-Alone. 100µVP-P (≈20µV RMS) noise in 100MHz bandwidth. Best of this group for noise measurement described in text.
Differential Amplifier Tektronix 1A5 50MHz 1mV/DIV Secondary Market Requires 500 Series Mainframe
Differential Amplifier Tektronix 7A13 100MHz 1mV/DIV Secondary Market Requires 7000 Series Mainframe
Differential Amplifier Tektronix 11A33 150MHz 1mV/DIV Secondary Market Requires 11000 Series Mainframe
Differential Amplifier Tektronix P6046 100MHz 1mV/DIV Secondary Market Stand-Alone
Differential Amplifier Preamble 1855 100MHz Gain = 10 Current Production Stand-Alone, Settable Bandstops
Differential Amplifier Tektronix 1A7/1A7A 1MHz 10µV/DIV Secondary Market Requires 500 Series Mainframe, Settable Bandstops
Differential Amplifier Tektronix 7A22 1MHz 10µV/DIV Secondary Market Requires 7000 Series Mainframe, Settable Bandstops
Differential Amplifier Tektronix 5A22 1MHz 10µV/DIV Secondary Market Requires 5000 Series Mainframe, Settable Bandstops
Differential Amplifier Tektronix ADA-400A 1MHz 10µV/DIV Current Production Stand-Alone with Optional Power Supply, Settable Bandstops
Differential Amplifier Preamble 1822 10MHz Gain = 100 Current Production Stand-Alone, Settable Bandstops
Differential Amplifier Stanford Research Systems
SR-560 1MHz Gain = 50000 Current Production Stand-Alone, Settable Bandstops, Battery or Line Operation
Differential Amplifier Tektronix AM-502 1MHz Gain = 100000 Secondary Market Requires TM-500 Series Power Supply
Figure B11. Some Applicable High Sensitivity, Low Noise Amplifiers. Trade-Offs Include Bandwidth, Sensitivity and Availability. All Require Protective Input Network to Prevent Catastrophic Failure. See Figure B12 and Associated Text
Preamplifier and Oscilloscope Selection
The low level measurements described require some form of preamplification for the oscilloscope. Current generation oscilloscopes rarely have greater than 2mV/DIV sensitivity, although older instruments offer more capability. Figure B11 lists representative preamplifiers and oscilloscope plug-ins suitable for noise measurement. These units feature wideband, low noise performance. It is particularly significant that the majority of these instruments are no longer produced. This is in keeping with current instrumen-tation trends, which emphasize digital signal acquisition as opposed to analog measurement capability.
The monitoring oscilloscope should have adequate band-width and exceptional trace clarity. In the latter regard high quality analog oscilloscopes are unmatched. The exceptionally small spot size of these instruments is well-suited to low level noise measurement.6 The digitizing uncertainties and raster scan limitations of DSOs impose display resolution penalties. Many DSO displays will not even register the small levels of switching-based noise.
Note 6.In our work we have found Tektronix types 454, 454A, 547 and 556 excellent choices. Their pristine trace presentation is ideal for discerning small signals of interest against a noise floor limited background.

Application Note 118
AN118-18
an118fb
AN118 B12
BNCINPUT
BNCOUTPUT.CONNECT DIRECTLY TO50Ω INPUT AMPLIFIER.NO CABLE
10M 10M
0.68µF, WIMA MKS-4, 1500V
MUR-110’s
SHIELDED COAXIAL ENCLOSURE
AN118 B13
10µF 22µF+
10pF 50pF
LT1019-4.5 LTC1799
GND GNDR DIN OUT OUT9V V+
4.5V
100k1%
4.5V
221k, 1%SHIELD 1k PEAKING CONNECT
DIRECTLY TO50Ω INPUT.NO CABLE
+
Figure B12. Coaxially Fixtured Clamp Protects Figure B11’s Low Noise Amplifiers From High Voltage Inputs. Resistors Insure Capacitor Discharge
Figure B13. Battery Powered, 1MHz, 1mV Square Wave Amplitude Calibrator Permits Signal Path Gain Verification. Peaking Trim Optimizes Front and Trailing Corner Fidelity
500ns/DIV AN118 B14
200µV/DIV
Figure B14. 1mV Amplitude Calibrator Output Has Minor Corner Rounding but Pulse Flats Indicate Desired Amplitude. Trace Thickening Describes Amplifier Noise Floor
Note 7. Don’t say we didn’t warn you.
Auxiliary Measurement Circuits
Figure B12 is the clamp circuit referred to in the preceding figure caption. It must be employed with any of Figure B12’s amplifiers to insure protection against catastrophic overloading.7 The network is simply an AC coupled diode clamp. The coupling capacitor specified withstands the text examples high voltage outputs and the 10M resistors bleed residual capacitor charge. Built into a small BNC equipped enclosure, its output should be directly con-nected to the amplifier. 50Ω inputs may be directly driven; high impedance input amplifiers should be shunted with a coaxial 50Ω terminator.
B13’s battery powered, 1 MHz, 1mV square wave amplitude calibrator facilitates “end-to-end” amplifier—oscilloscope path gain verification. The 221k resistor associated area is sensitive to variations in stray capacitance and is shielded as per the schematic. A 4.5V reference stabilizes output amplitude against battery voltage change and a peaking trim optimizes front and trailing corner fidelity. Figure B14 shows that the simple peaking network does not quite achieve square corners, but 1mV pulse amplitude is clearly delineated. Trace thickening in the waveform flats indicates amplifier noise floor.
Application Note 118
AN118-19
an118fb
APPENDIX C
PROBING AND CONNECTION TECHNIQUES FOR LOW LEVEL, WIDEBAND SIGNAL INTEGRITY
The most carefully prepared breadboard cannot fulfill its mission if signal connections introduce distortion. Con-nections to the circuit are crucial for accurate information extraction. The low level, wideband measurements demand care in routing signals to test instrumentation.
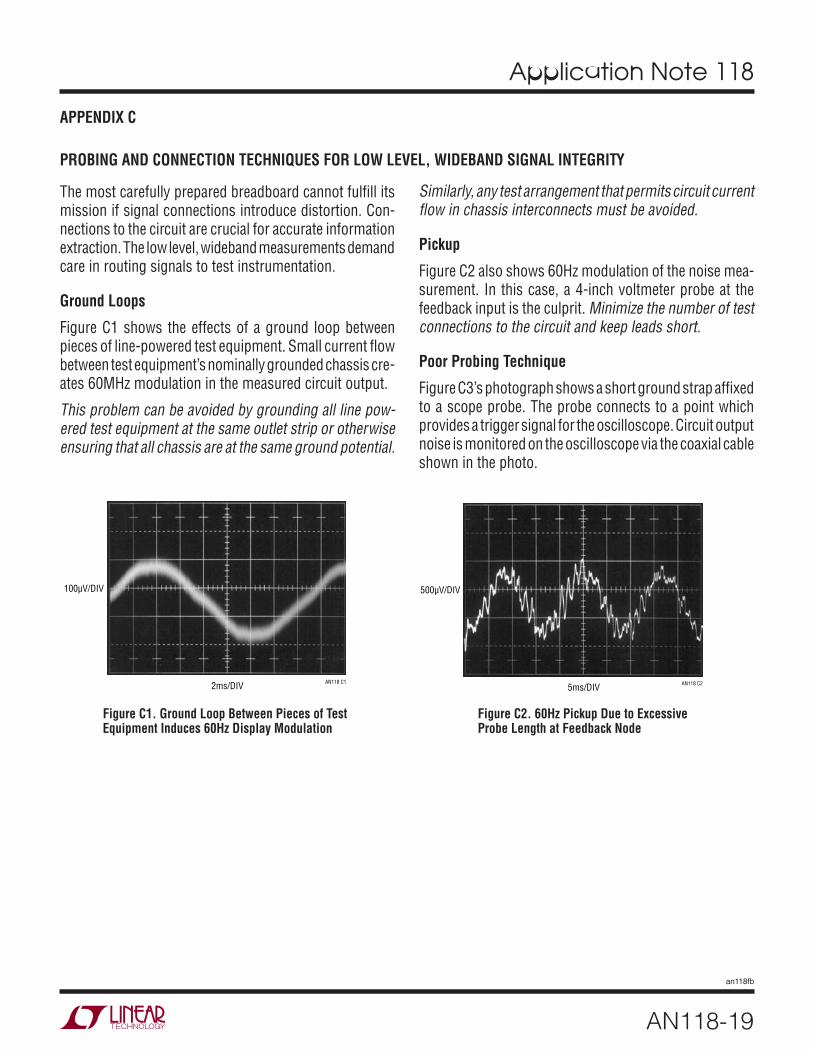
Ground Loops
Figure C1 shows the effects of a ground loop between pieces of line-powered test equipment. Small current flow between test equipment’s nominally grounded chassis cre-ates 60MHz modulation in the measured circuit output.
This problem can be avoided by grounding all line pow-ered test equipment at the same outlet strip or otherwise ensuring that all chassis are at the same ground potential.
Similarly, any test arrangement that permits circuit current flow in chassis interconnects must be avoided.
Pickup
Figure C2 also shows 60Hz modulation of the noise mea-surement. In this case, a 4-inch voltmeter probe at the feedback input is the culprit. Minimize the number of test connections to the circuit and keep leads short.
Poor Probing Technique
Figure C3’s photograph shows a short ground strap affixed to a scope probe. The probe connects to a point which provides a trigger signal for the oscilloscope. Circuit output noise is monitored on the oscilloscope via the coaxial cable shown in the photo.
2ms/DIV AN118 C1
100µV/DIV
Figure C1. Ground Loop Between Pieces of Test Equipment Induces 60Hz Display Modulation
Figure C2. 60Hz Pickup Due to Excessive Probe Length at Feedback Node
5ms/DIV AN118 C2
500µV/DIV

Application Note 118
AN118-20
an118fb
Figu
re C
3. P
oor P
robi
ng T
echn
ique
. Trig
ger P
robe
Gro
und
Lead
Can
Ca
use
Grou
nd L
oop-
Indu
ced
Artif
acts
to A
ppea
r in
Disp
lay

Application Note 118
AN118-21
an118fb
Figure C4 shows results. A ground loop on the board between the probe ground strap and the ground referred cable shield causes apparent excessive ripple in the display. Minimize the number of test connections to the circuit and avoid ground loops.
Proper Coaxial Connection Path
In Figure C9, a coaxial cable transmits the noise signal to the amplifier-oscilloscope combination. In theory, this af-fords the highest integrity cable signal transmission. Figure C10’s trace shows this to be true. The former examples aberrations and excessive noise have disappeared. The switching residuals are now faintly outlined in the ampli-fier noise floor. Maintain coaxial connections in the noise signal monitoring path.
Direct Connection Path
A good way to verify there are no cable-based errors is to eliminate the cable. Figure C11’s approach eliminates all cable between breadboard, amplifier and oscilloscope. Figure C12’s presentation is indistinguishable from Figure C10, indicating no cable-introduced infidelity. When results seem optimal, design an experiment to test them. When results seem poor, design an experiment to test them. When results are as expected, design an experiment to test them. When results are unexpected, design an experi-ment to test them.
Test Lead Connections
In theory, attaching a voltmeter lead to the regulator’s output should not introduce noise. Figure C13’s increased noise reading contradicts the theory. The regulator’s output impedance, albeit low, is not zero, especially as frequency scales up. The RF noise injected by the test lead works against the finite output impedance, producing the 200µV of noise indicated in the figure. If a voltmeter lead must be connected to the output during testing, it should be done through a 10kΩ-10µF filter. Such a network eliminates Figure C13’s problem while introducing minimal error in the monitoring DVM. Minimize the number of test lead connections to the circuit while checking noise. Prevent test leads from injecting RF into the test circuit.
5µs/DIV AN118 C4
100µV/DIV(INVERTED)
Note 1. To be discussed. Read on.
Figure C4. Apparent Excessive Ripple Results from Figure C3’s Probe Misuse. Ground Loop on Board Introduces Serious Measurement Error
Violating Coaxial Signal Transmission—Felony Case
In Figure C5, the coaxial cable used to transmit the cir-cuit output noise to the amplifier-oscilloscope has been replaced with a probe. A short ground strap is employed as the probe’s return. The error inducing trigger channel probe in the previous case has been eliminated; the ’scope is triggered by a noninvasive, isolated probe.1 Figure C6 shows excessive display noise due to breakup of the coaxial signal environment. The probe’s ground strap violates coaxial transmission and the signal is corrupted by RF. Maintain coaxial connections in the noise signal monitoring path.
Violating Coaxial Signal Transmission—Misdemeanor Case
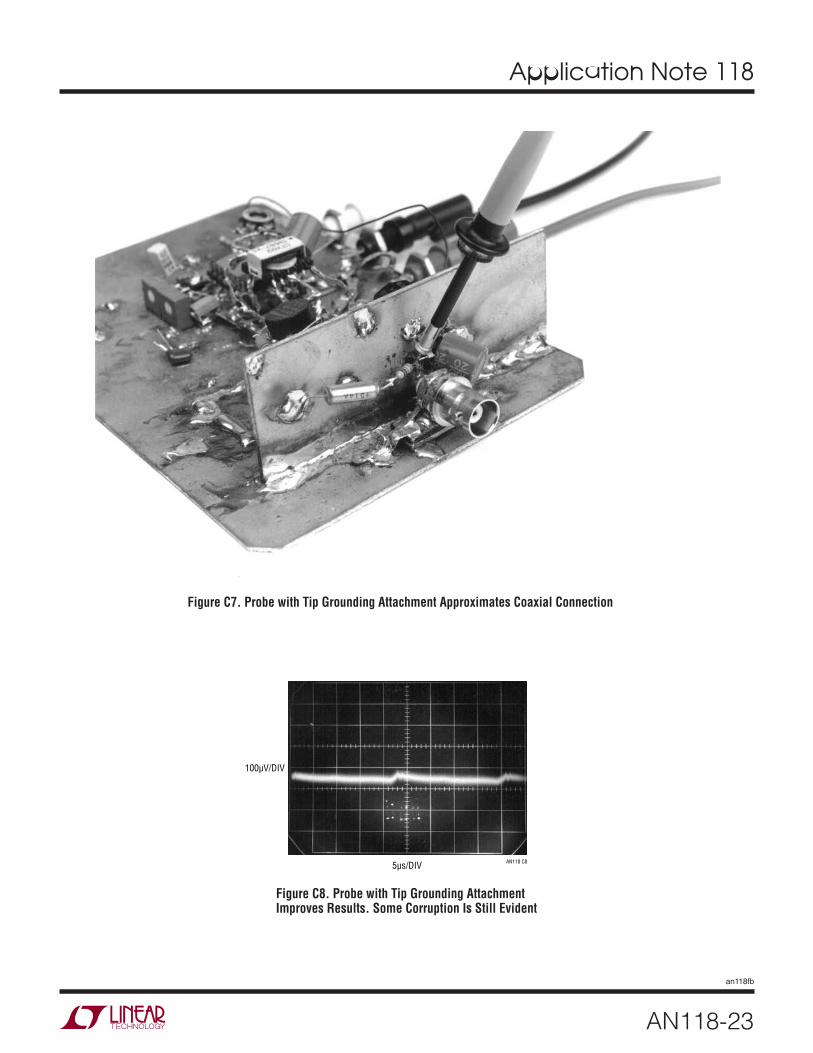
Figure C7’s probe connection also violates coaxial signal flow, but to a less offensive extent. The probe’s ground strap is eliminated, replaced by a tip grounding attachment. Figure C8 shows better results over the preceding case, although signal corruption is still evident. Maintain coaxial connections in the noise signal monitoring path.

Application Note 118
AN118-22
an118fb
Figure C5. Floating Trigger Probe Eliminates Ground Loop, but Output Probe Ground Lead (Photo Upper Right) Violates Coaxial Signal Transmission
Figure C6. Signal Corruption Due to Figure C5’s Noncoaxial Probe Connection
5µs/DIV AN118 C6
500µV/DIV
Application Note 118
AN118-23
an118fb
Figure C7. Probe with Tip Grounding Attachment Approximates Coaxial Connection
Figure C8. Probe with Tip Grounding Attachment Improves Results. Some Corruption Is Still Evident
5µs/DIV AN118 C8
100µV/DIV

Application Note 118
AN118-24
an118fb
Figure C9. Coaxial Connection Theoretically Affords Highest Fidelity Signal Transmission
Figure C10. Life Agrees with Theory. Coaxial Signal Transmission Maintains Signal Integrity. Switching Residuals Are Faintly Outlined in Amplifier Noise
5µs/DIV AN118 C10
100µV/DIV

Application Note 118
AN118-25
an118fb
Figure C11. Direct Connection to Equipment Eliminates Possible Cable-Termination Parasitics, Providing Best Possible Signal Transmission
Figure C12. Direct Connection to Equipment Provides Identical Results to Cable-Termination Approach. Cable and Termination Are Therefore Acceptable
5µs/DIV AN118 C12
100µV/DIV

Application Note 118
AN118-26
an118fb
Isolated Trigger Probe
The text associated with Figure C5 somewhat cryptically alluded to an “isolated trigger probe.” Figure C14 reveals this to be simply an RF choke terminated against ringing. The choke picks up residual radiated field, generating an isolated trigger signal. This arrangement furnishes a ’scope trigger signal with essentially no measurement corruption. The probe’s physical form appears in Figure C15. For good results the termination should be adjusted for minimum ringing while preserving the highest possible amplitude output. Light compensatory damping produces Figure C16’s output, which will cause poor ’scope trig-gering. Proper adjustment results in a more favorable output (Figure C17), characterized by minimal ringing and well-defined edges.
Trigger Probe Amplifier
The field around the switching magnetics is small and may not be adequate to reliably trigger some oscilloscopes. In such cases, Figure C18’s trigger probe amplifier is useful. It uses an adaptive triggering scheme to compensate for variations in probe output amplitude. A stable 5V trigger output is maintained over a 50:1 probe output range. A1, operating at a gain of 100, provides wideband AC gain. The output of this stage biases a 2-way peak detector (Q1 through Q4). The maximum peak is stored in Q2’s emit-ter capacitor, while the minimum excursion is retained in Q4’s emitter capacitor. The DC value of the midpoint of
A1’s output signal appears at the junction of the 500pF capacitor and the 3MΩ units. This point always sits midway between the signal’s excursions, regardless of absolute amplitude. This signal-adaptive voltage is buffered by A2 to set the trigger voltage at the LT1394’s positive input. The LT1394’s negative input is biased directly from A1’s output. The LT1394’s output, the circuit’s trigger output, is unaffected by >50:1 signal amplitude variations. An X100 analog output is available at A1.
Figure C19 shows the circuit’s digital output (trace B) responding to the amplified probe signal at A1 (trace A).
Figure C20 is a typical noise testing setup. It includes the breadboard, trigger probe, amplifier, oscilloscope and coaxial components.
Figure C13. Voltmeter Lead Attached to Regulator Output Introduces RF Pickup, Multiplying Apparent Noise Floor
5µs/DIV AN118 C13
200µV/DIV
Figure C14. Simple Trigger Probe Eliminates Board Level Ground Loops. Termination Box Components Damp L1’s Ringing Response
1k
4700pF
L1: J.W. MILLER #100267AN70 FC14
TERMINATION BOXSHIELDED
CABLE
L1PROBE
BNC CONNECTIONTO TERMINATION BOX
DAMPINGADJUST
BNCOUTPUT

Application Note 118
AN118-27
an118fb
Figu
re C
15. T
he Tr
igge
r Pro
be a
nd T
erm
inat
ion
Box.
Cl
ip L
ead
Faci
litat
es M
ount
ing
Prob
e, Is
Ele
ctric
ally
Neu
tral

Application Note 118
AN118-28
an118fb
Figure C16. Misadjusted Termination Causes Inadequate Damping. Unstable Oscilloscope Triggering May Result
10µs/DIV AN118 C16
10mV/DIV
Figure C17. Properly Adjusted Termination Minimizes Ringing with Small Amplitude Penalty
10µs/DIV AN118 C17
10mV/DIV
Figure C18. Trigger Probe Amplifier Has Analog and Digital Outputs. Adaptive Threshold Maintains Digital Output Over 50:1 Probe Signal Variations
5V
–
+A1
LT1227
–
+A2
LT1006
5V
5V
5V
DIGITALTRIGGEROUT BNCTO ’SCOPE
AN118 C18
500pF
0.1µF
1k
470Ω
470Ω
750Ω
10Ω
13
2 4
1413
15
56
1210
11
2k
TRIGGER PROBEAND TERMINATION BOX
(SEE FIGURE C14 FOR DETAILS)
10µF
2k
2k+0.1µF
0.1µF
0.005µF
0.005µF
100µF+
Q1, Q2, Q3, Q4 = CA3096 ARRAY: TIE SUBSTRATE (PIN 16) TO GROUND= 1N4148
–
+
LT1394
Q1 Q2
Q3 Q4
3M
50Ω
3M
ANALOG BNC OUTPUTTO ’SCOPE TRIGGER INPUT
10µs/DIV (UNCALIB) AN118 C19
B = 5V/DIV
A = 1V/DIVAC COUPLED
Figure C19. Trigger Probe Amplifier Analog (Trace A) and Digital (Trace B) Outputs

Application Note 118
AN118-29
an118fb
Figu
re C
20. T
ypic
al N
oise
Tes
t Set
up In
clud
es Tr
igge
r Pro
be,
Ampl
ifier
, Osc
illos
cope
and
Coa
xial
Com
pone
nts

Application Note 118
AN118-30
an118fb
LT1533-based circuit’s low harmonic content allows their noise performance to be less layout sensitive than other switching regulators. However, some degree of prudence is in order. As in all things, cavalierness is a direct route to disappointment. Obtaining the absolute lowest noise figure requires care, but performance below 500µV is readily achieved. In general, lowest noise is obtained by preventing mixing of ground currents in the return path. Indiscriminate disposition of ground currents into a bus or ground plane will cause such mixing, raising observed output noise. The LT1533’s restricted edge rates mitigate against corrupted ground path-induced problems, but best noise performance occurs in a “single-point” ground scheme. Single-point return schemes may be impractical in production PC boards. In such cases, provide the lowest possible impedance path to the power entry point from the inductor associated with the LT1533’s power ground pin. (Pin 16). Locate the output component ground returns as close to the circuit load point as possible. Minimize return current mixing between input and output sections by restricting such mixing to the smallest possible com-mon conductive area.
Noise Minimization
The LT1533’s controlled switching times allow extraor-dinarily low noise DC/DC conversion with surprisingly little design effort. Wideband output noise well below 500µV is easily achieved. In most situations this level of performance is entirely adequate. Applications requiring the lowest possible output noise will benefit from special attention to several areas.
Noise Tweaking
The slew time versus efficiency trace-off should be weighted towards lowest noise to the extent tolerable. Typically, slew times beyond 1.3µs result in “expensive” noise reduction in terms of lost efficiency, but the benefit is available. The issue is how much power is expendable to obtain incremental decreases in output noise. Similarly, the layout techniques
previously discussed should be reviewed. Rigid adherence to these guidelines will result in correspondingly lower noise performance. The text’s breadboards were originally constructed to provide the lowest possible noise levels, and then systematically degraded to test layout sensitiv-ity. This approach allows experimentation to determine the best layout without expanding fanatical attention to details that provide essentially no benefit.
The slow edge times greatly minimize radiated EMI, but experimentation with the component’s physical orientation can sometimes improve things. Look at the components (yes, literally!) and try and imagine just what their residual radiated field impinges on. In particular, the optional output inductor may pick up field radiated by other magnetics, resulting in increased output noise. Appropriate physical layout will eliminate this effect, and experimentation is useful. The EMI probe described in Appendix E is a useful tool in this pursuit and highly recommended.
Capacitors
The filter capacitors used should have low parasitic im-pedance. Sanyo OS-CON types are excellent in this regard and contributed to the performance levels quoted in the text. Tantalum types are nearly as good. The input supply bypass capacitor, which should be located directly at the transformer center tap, needs similarly good character-istics. Aluminum electrolytics are not suitable for any service in LT1533 circuits.
Damper Network
Some circuits may benefit from a small (e.g., 300Ω-1000pF) damper network across the transformer secondary if the absolutely lowest noise is needed. Extremely small (20µV to 30µV) excursions can briefly appear during the switching interval when no energy is coming through the transformer. These events are so minuscule that they are barely measurable in the noise floor, but the damper will eliminate them.
APPENDIX D
BREADBOARDING, NOISE MINIMIZATION AND LAYOUT CONSIDERATIONS

Application Note 118
AN118-31
an118fb
Note 1. I do not wax pedantic here. My guilt in this offense runs deep.
Measurement Technique
Strictly speaking, measurement technique is not a way to obtain lowest noise performance. Realistically, it is essential that measurement technique be trustworthy. Uncountable
hours have been lost chasing “circuit problems” that in reality are manifestations of poor measurement technique. Please read Appendices B and C before pursuing solutions to circuit noise that isn’t really there.1
APPENDIX E
APPLICATION NOTE E101: EMI “SNIFFER” PROBEBruce Carsten Associates, Inc.6410 NW Sisters Place, Corvallis, Oregon 97330541-745-3935
The EMI Sniffer Probe1 is used with an oscilloscope to locate and identify magnetic field sources of electromag-netic interference (EMI) in electronic equipment. The probe consists of a miniature 10 turn pickup coil located in the end of a small shielded tube, with a BNC connector provided for connection to a coaxial cable (Figure E1). The Sniffer Probe output voltage is essentially proportional to the rate of change of the ambient magnetic field, and thus to the rate of change of nearby currents.
The principal advantages of the Sniffer Probe over simple pickup loops are:
1. Spatial resolution of about a millimeter.
2. Relatively high sensitivity for a small coil.
3. A 50Ω source termination to minimize cable reflections with unterminated scope inputs.
4. Faraday shielding to minimize sensitivity to electric fields.
The EMI Sniffer Probe was developed to diagnose sources of EMI in switch mode power converters, but it can also be used in high speed logic systems and other electronic equipment.
SOURCES OF EMI
Rapidly changing voltages and currents in electrical and electronic equipment can easily result in radiated and con-ducted noise. Most EMI in switch mode power converters is thus generated during switching transients when power transistors are turned on or off.
Conventional scope probes can readily be used to see dynamic voltages, which are the principal sources of common mode conducted EMI. (High dV/dt can also feed through poorly designed filters as normal mode voltage spikes and may radiate fields from a circuit without a conductive enclosure.)
Dynamic currents produce rapidly changing magnetic fields which radiate far more easily than electric fields as they are more difficult to shield. These changing magnetic fields can also induce low impedance voltage transients in other circuits, resulting in unexpected normal and common mode conducted EMI.
These high dl/dt currents and resultant fields can not be directly sensed by voltage probes, but are readily detected and located with the Sniffer Probe. While current probes can sense currents in discrete conductors and wires, they are of little use with printed circuit traces or in detecting dynamic magnetic fields.
PROBE RESPONSE CHARACTERISTICS
The Sniffer Probe is sensitive to magnetic fields only along the probe axis. This directionality is useful in locating the paths and sources of high dl/dt currents. The resolution is usually sufficient to locate which trace on a printed circuit board, or which lead on a component package, is conducting the EMI generating current.
For “isolated” single conductors or PC traces, the Probe response is greatest just to either side of the conductor
Note 1. The EMI Sniffer Probe is available from Bruce Carsten Associates at the address noted in the title of this appendix.

Application Note 118
AN118-32
an118fb
where the magnetic flux is along with probe axis. (Probe response may be a little greater with the axis tilted towards the center of the conductor.) As shown in Figure E2, there is a sharp response null in the middle of the conductor, with a 180° phase shift to either side and a decreasing response with distance. The response will increase on the inside of a bend where the flux lines are crowded together, and is reduced on the outside of a bend where the flux lines spread apart.
When the return current is in an adjacent parallel con-ductor, the Probe response is greatest between the two conductors as shown in Figure E3. There will be a sharp null and phase shift over each conductor, with a lower peak response outside the conductor pair, again decreas-ing with distance.
The response to a trace with a return current on the oppo-site side of the board is similar to that of a single isolated trace, except that the probe response may be greater with the Probe axis tilted away from the trace. A “ground plane” below a trace will have a similar effect, as there will be a counter-flowing “image” current in the ground plane.
The Probe frequency response to a uniform magnetic field is shown in Figure E4. Due to large variations in field strength around a conductor, the Probe should be considered as a qualitative indicator only, with no at-tempt made to “calibrate” it. The response fall-off near 300MHz is due to the pickup coil inductance driving the coax cable impedance, and the mild resonant peaks (with a 1MΩ scope termination) at multiples of 80MHz are due to transmission line reflections.
Figure E1. Construction of the EMI “Sniffer Probe” for Locating and Identifying Magnetic Field Sources of EMI
© 1997, Bruce Carsten Associates, Inc. *Approx. 160µ Wire, 1.5mm Coil Dia.

Application Note 118
AN118-33
an118fb
PCB
PROBE
PROB
E VO
LTAG
E
PC TRACE
PCB
PROBE
PROB
E VO
LTAG
E
PC TRACES
Figure E2. Sniffer Probe Response to Current in a Physically “Isolated” Conductor
Figure E3. Sniffer Probe Response with Return Current in a Parallel Conductor
Figure E4. Typical EMI “Sniffer” Probe Frequency Response Measured with 1.3m (51") of 50Ω Coax to Scope Upper Traces: 1Meg Scope Input Impedance Lower Traces: 50Ω Scope Input Impedance
© 1997, Bruce Carsten Associates, Inc.

Application Note 118
AN118-34
an118fb
PRINCIPLES OF PROBE USE
The Sniffer Probe is used with at least a 2-channel scope. One channel is used to view the noise whose source is to be located (which may also provide the scope trigger) and the other channel is used for the Sniffer Probe. The probe response nulls make it inadvisable to use this scope channel for triggering.
A third scope trigger channel can be very useful, particu-larly if it is difficult to trigger on the noise. Transistor drive waveforms (or their predecessors in the upstream logic) are ideal for triggering; they are usually stable, and allow immediate precursors of the noise to be viewed.
Start with the Probe at some distance from the circuit with the Probe channel at maximum sensitivity. Move the probe around the circuit, looking for “something happening” in the circuit’s magnetic fields at the same time as the noise problem. A precise “time domain” correlation between EMI noise transients and internal circuit fields is fundamental to the diagnostic approach.
As a candidate noise source is located, the Probe is moved closer while the scope sensitivity is decreased to keep the probe waveform on-screen. It should be possible to quickly bring the probe down to the PC board trace (or wiring) where the probe signal seems to be a maximum. This may not be near the point of EMI generation, but it should be near a PC trace or other conductor carrying the current from the EMI source. This can be verified by moving the
probe back and forth in several directions; when the ap-propriate PC trace is crossed at roughly right angles, the probe output will go through a sharp null over the trace, with an evident phase reversal in probe voltage on each side of the trace (as noted above).
This EMI “hot” trace can be followed (like a bloodhound on the scent trail) to find all or much of the EMI generat-ing current loop. If the trace is hidden on the back side (or inside) of the board, mark its path with a felt pen and locate the trace on disassembly, on another board or on the artwork. From the current path and the timing of the noise transient, the source of the problem usually becomes almost self-evident.
Several not-uncommon problems (all of which have been diagnosed with various versions of the Sniffer Probe) are discussed here with suggested solutions or fixes.
TYPICAL DI/DT EMI PROBLEMS
Rectifier Reverse Recovery
Reverse recovery of rectifiers is the most common source of dl/dt-related EMI in power converters; the charge stored in P-N junction diodes during conduction causes a momentary reverse current flow when the voltage re-verses. This reverse current may stop very quickly (<1ns) in diodes with a “snap” recovery (more likely in devices with a PIV rating of less than 200V), or the reverse current
PROBE POINTS
TYP. PROBE WAVEFORMS:
“SOFT”RECOVERY
“SNAP”RECOVERY
Figure E5. Rectifier Reverse Recovery Typical Fix: Tightly Coupled R-C Snubber

Application Note 118
AN118-35
an118fb
may decay more gradually with a “soft” recovery. Typical Sniffer Probe waveforms for each type of recovery are shown in Figure E5.
The sudden change in current creates a rapidly changing magnetic field, which will both radiate external fields and induce low impedance voltage spikes in other circuits. This reverse recovery may “shock” parasitic L-C circuits into ringing, which will result in oscillatory waveforms with varying degrees of damping when the diode recovers. A series R-C damper circuit in parallel with the diode is the usual solution.
Output rectifiers generally carry the highest currents and are thus the most prone to this problem, but this is often recognized and they may be well-snubbed. It is not uncommon for unsnubbed catch or clamp diodes to be more of an EMI problem. (The fact that a diode in an R-C-D snubber may need its own R-C snubber is not always self-evident, for example).
The problem can usually be identified by placing the Sniffer Probe near a rectifier lead. The signal will be strongest on the inside of a lead bend in an axial package, or between the anode and cathode leads in a TO-220, TO-247 or similar type of package, as shown in Figure E5.
Using “softer” recovery diodes is a possible solution and Schottky diodes are ideal in low voltage applications. However, it must be recognized that a P-N diode with soft recovery is also inherently lossy (while a “snap” recovery is not), as the diode simultaneously develops a reverse voltage while still conducting current: The fastest possible diode (lowest recovered charge) with a moderately soft recovery is usually the best choice. Sometimes a faster, slightly “snappy” diode with a tightly coupled R-C snubber works as well or better than a soft but excessively slow recovery diode.
If significant ringing occurs, a “quick-and-dirty” R-C snub-ber design approach works fairly well: increasingly large damper capacitors are placed across the diode until the ringing frequency is halved. We know that the total ring-ing capacity is now quadrupled or that the original ringing capacity is 1/3 of the added capacity. The damper resistance required is about equal to the capacitive reactance of the original ringing capacity at the original ringing frequency.
The “frequency halving” capacity is then connected in series with the damping resistance and placed across the diode, as tightly coupled as possible.
Snubber capacitors must have a high pulse current ca-pability and low dielectric loss. Temperature stable (disc or multilayer) ceramic, silvered mica and some plastic filmfoil capacitors are suitable. Snubber resistors should be noninductive; metal film, carbon film and carbon com-position resistors are good, but wirewound resistors must be avoided. The maximum snubber resistor dissipation can be estimated from the product of the damper capacity, switching frequency and the square of the peak snubber capacitor voltage.
Snubbers on passive switches (diodes) or active switches (transistors) should always be coupled as closely as physically possible, with minimal loop inductance. This minimizes the radiated field from the change in current path from the switch to the snubber. It also minimizes the turn-off voltage overshoot “required” to force the current to change path through the switch-snubber loop inductance.
Ringing in Clamp Zeners
A capacitor-to-capacitor ringing problem can occur when a voltage clamping Zener or TransZorb® is placed across the output of a converter for overvoltage protection (OVP). Power Zeners have a large junction capacity, and this can ring in series with the lead ESL and the output capaci-tors, with some of the ringing voltage showing up on the output. This ringing current can be most easily detected near the Zener leads, particularly on the inside of a bend as shown in Figure E6.
R-C snubbers have not been found to work well in this case as the ringing loop inductance is often as low or lower than the obtainable parasitic inductance in the snubber. Increasing the external loop inductance to allow damping is not advisable as this would limit dynamic clamping capability. In this case, it was found that a small ferrite bead on one or both of the Zener leads dampened the HF oscillations with minimal adverse side effects (a high permeability ferrite bead quickly saturates as soon as the Zener begins to conduct significant current).

Application Note 118
AN118-36
an118fb
Probe Point
Package Lead ESL PCB Connections
Rd
IRING(a)
(c)
(b)
+
Rd
+
+
PROBE POINTSTYP. PROBE WAVEFORM:
100-500MHzRINGING
I
Figure E6. Ringing Between Clamp Zener and Capacitor Typical Fix: Small Ferrite Bead on Zener Lead(s)
Figure E7. Ringing in Paralleled Dual Rectifiers

Application Note 118
AN118-37
an118fb
Paralleled Rectifiers
A less evident problem can occur when dual rectifier diodes in a package are paralleled for increased current capability, even with a tightly coupled R-C snubber. The two diodes seldom recover at exactly the same time, which can cause a very high frequency oscillation (hundreds of MHz) to occur between the capacities of the two diodes in series with the anode lead inductances, as shown in Figure E7. This effect can really only be observed by placing the probe between the two anode leads, as the ringing current exists almost nowhere else (the ringing is nearly “invisible” to a conventional voltage probe, like many other EMI effects that can be easily found with a magnetic field Sniffer Probe).
This “teeter-totter” oscillation has a voltage “null” about where the R-C snubber is connected, so it provides little or no damping (see Figure E7a). It is actually very difficult to insert a suitable damping resistance into this circuit.
The easiest way to dampen the oscillation is to “slit” the anode PC trace for an inch or so and place a damping resistor at the anode leads as shown in Figure E7b. This increases the inductance in series with the diode-diode loop external to the package and leads, while having minimal effect on the effective series inductance. Even better damping is obtained by placing the resistor across the anode leads at the entry point to the case, as shown in Figure E7c, but this violates the mindset of many pro-duction engineers.
It is also preferable to split the original R-C damper into two (2R) - (C/2) dampers, one on each side of the dual
rectifier (also shown in Figure E7c). In practice, it is always preferable to use dual R-C dampers, one each side of the diode; loop inductance is cut about in half, and the external dl/dt field is reduced even further due to the oppositely “handed” currents in the two snubber networks.
Paralleled Snubber or Damper Caps
A problem similar to that with the paralleled diodes occurs when two or more low loss capacitors are paralleled and driven with a sudden current change. There is a tendency for a current to ring between the two capacitors in series with their lead inductances (or ESL), as shown in Figure E8a. This type of oscillation can usually be detected by placing the Sniffer Probe between the leads of the paral-leled capacitors. The ringing frequency is much lower than with the paralleled diodes (due to the larger capacity), and the effect may be benign if the capacitors are sufficiently closer together.
If the resultant ringing is picked up externally, it can be damped in a similar way as with the parallel diodes as shown in Figure E8b. In either case, the dissipation in the damping resistor tends to be relatively small.
Ringing in Transformer Shield Leads
The capacity of a transformer shield to other shields or windings (CS in Figure E9) forms a series resonant circuit with its “drain wire” inductance (LS) to the bypass point. This resonant circuit is readily excited by typical square wave voltages on windings, and a poorly damped oscil-latory current may flow in the drain wire. The shield cur-
(b)
IRING
RD
(a)Probe Point
Figure E8. Ringing in Paralleled “Snubber” Capacitors

Application Note 118
AN118-38
an118fb
LS
VSCS
SHIELDPARASITICS
(1)
LS
RD
CS
SHIELD RESONANCE DAMPING
(2)
10
1
10–1
10–2
10–3
10–4
0.01 0.1 1 10
(2)SHIELD RESONANCE
CAN BE DAMPED WITH
A RESISTOR “RD” OR A
SMALL FERRITE BEAD:
(1)
NORMALIZED FREQUENCYF/Fres
SHIE
LD V
OLTA
GE F
EEDT
HROU
GH
RD ≅ LSCS
Figure E9. Shield Effectiveness at High Frequencies is Limited by Shield Capacity and Lead Inductance

Application Note 118
AN118-39
an118fb
Note 2. Ed Note. See Appendix D for additional commentary.
rent may radiate noise into other circuits, and the shield voltage will often show up as common mode conducted noise. The shield voltage is very difficult to detect with a voltage probe in most transformers, but the ringing shield current can be observed by holding the Sniffer Probe near the shield drain wire (Figure E10), or the shield current’s return path in the circuit.
This ringing can be dampened by placing a resistor RD in series with the shield drain wire, whose value is approxi-mately equal to the surge impedance of the resonant circuit, which may be calculated from the formula in Figure E9.
The shield capacitance (CS) can readily be measured with a bridge (as the capacity from the shield to all facing shields and/or windings), but LS is usually best calculated from CS and the ringing frequency (as sensed by the Sniffer Probe). This resistance is typically on the order of tens of ohms.
One or more small ferrite beads can also be placed on the drain wire instead to provide damping. This option may be preferable as a late “fix” when the PC board has already been laid out.
In either case, the damper losses are typically quite small. The damper resistor has a moderately adverse impact on shield effectiveness below the shield and drain wire reso-nant frequency; damper beads are superior in this respect as their impedance is less at lower frequencies. The drain wire connection should also be as short as possible to the circuit bypass point, both to minimize EMI and to raise the shield’s maximum effective (i.e., resonant) frequency.
Leakage Inductance Fields
Transformer leakage inductance fields emanate from between primary and secondary windings. With a single primary and secondary, a significant dipole field is cre-ated, which may be seen by placing the Sniffer Probe near the winding ends as shown in Figure E11a. If this field is generating EMI, there are two principal fixes:
1. Split the Primary or Secondary in two, to “sandwich” the other winding, and/or:
2. Place a shorted copper strap “electromagnetic shield” around the complete-core and winding assembly as shown in Figue E12. Eddy currents in the shorted strap largely cancel the external magnetic field.
The first approach creates a “quadrupole” instead of a dipole leakage field, which significantly reduces the distant field intensity. It also reduces the eddy current losses in any shorted strap electromagnetic shield used, which may or may not be an important consideration.
External Air Gap Fields
External air gaps in an inductor, such as those in open “bobbin core” inductors or with “E” cores spaced apart (Figure E11b), can be a major source of external magnetic fields when significant ripple or AC currents are present. These fields can also be easily located with the Sniffer Probe; response will be a maximum near an air gap or near the end of an open inductor winding.
“Open” inductor fields are not readily shielded and if they present an EMI problem the inductor must usually be redesigned to reduce external fields. The external field around spaced E cores can be virtually eliminated by placing all of the air gap in the center leg. Fields due to a (possibly intentional) residual or minor outside air gap can be minimized with the shorted strap electromagnetic shield of Figure E12, if eddy current losses prove not to be too high.
A less obvious problem may occur when inductors with “open” cores are used as second stage filter chokes. The minimal ripple current may not create a significant field, but such an inductor can “pick up” external magnetic fields and convert them to noise voltages or be an EMI susceptibility problem.2
Poorly Bypassed High Speed Logic
Ideally, all high speed logic should have a tightly coupled bypass capacitor for each IC and/or have power and ground distribution planes in a multilayer PCB.
At the other extreme, I have seen one bypass capacitor used at the power entrance to a logic board, with power and ground led to the ICs from opposite sides of the board. This created large spikes on the logic supply voltage and produced significant electromagnetic fields around the board.

Application Note 118
AN118-40
an118fb
PROBE POINT (NEARSHIELD DRAIN PIN)
TYP. PROBE WAVEFORM:
10-100MHzRINGING
Figure E10. Transformer Shield Ringing Typical Fix: 10Ω to 100Ω Resistor (or Ferrite Bead in Drain Wire)
TRANSFORMER LEAKAGEINDUCTANCE FIELD
TYPICAL FIXES:SANDWICHED WINDINGS:SHORTED STRAP SHIELD
TYPICAL FIX:EXTERNAL AIR GAPS
INDUCTOR EXTERNALAIR GAP FIELD
PROBEPOINTS
(a)(b)
Figure E11. Probe Voltages Resemble the Transformer and Inductor Winding Waveforms

Application Note 118
AN118-41
an118fb
EM SHIELD ON AN INDUCTORWITH LARGE EXTERNAL COREAIR GAPS WILL HAVE HIGHLOCALIZED EDDY CURRENTLOSSES NEAR THE GAPS
ELECTROMAGNETIC SHIELDFORMED BY SHORTED COPPER
STRAP AROUND CORE AND WINDING
Figure E12. A “Sandwiched” PRI-SEC Transformer Winding Construction Reduces Electromagnetic Shield Eddy Current Losses

Application Note 118
AN118-42
an118fb
B
A
(OPTIONAL)SCOPE
CH 1
CH 2
EXT. TRIG.
CABLE LENGTH ≅ A + B
(OPTIONAL TRIGGER INPUT)
EMI“SNIFFER”
PROBE
EQUIPMENT UNDEREMI INVESTIGATION
LINE IMPEDANCESTABILIZATION
NETWORK
(LISN)
NOISEOUTPUT(BNC)
AC L
INE
INPU
T
AC L
INE
OUTP
UT
INPUT
OUTPUT
LISN
AC
LINE
FIL
TER
Figure E13. Using the Probe with a “LISN”

Application Note 118
AN118-43
an118fb
20 TURNS #28 AWG WIRE WRAP WIRE(OR SUB. #24 AWG MAGNET WIRE)
The Sniffer Probe Tip is centered inside the test coil where the Probe voltage
is greatest. The approximate flux density in the middle of a coil can be calculated
from the formula:
B = H = 1.257 NI /I (CGS Units)
For the 1.27cm long, 20-turn test coil , the flux density is about 20 Gauss per amp.
At 1MHz, the Sniffer Probe voltage is 19mVP-P (±10%) per 100mAP-P for a 1MΩload impedance, and half that for a 50Ω load.
12.4Ω, 1/4WM.F. RESISTOR
0.5"
3/16" OD, 1/8" ID PLASTIC TUBE,3/4" TO 1" LONG (AVAILABLE ATMANY MODEL AND HOBBY SHOPS)
HI
2× SCALE
COM
TO SIGNALGENERATOR
TO SCOPE(50ΩTERM.)
Figure E14. EMI “Sniffer” Probe Test Coil

Application Note 118
AN118-44
an118fb
Figure E15. EMI “Sniffer” Probe Procedure Outline
1) Use a 2-channel scope, preferably one with an external trigger.2) One scope channel is used for the Sniffer Probe, which is not to be used for
triggering.3) The second channel is used to view the noise transient whose source is to be located,
which may also be used for triggering if practical.4) More stable and reliable triggering is achieved with an “external trigger” (or a 3rd
channel) on a transistor drive waveform (or preceding logic transition), allowing immediate precursors to the transient to be viewed. (Nearly all noise transients occur during, or just after, a power transistor turn-on or turn-off.
5) Start with the Probe at some distance from the circuit with maximum sensitivity and “sniff around” for something happening in precise sync with the noise transient. The Probe waveform will not be identical to the noise transient, but will usually have a strong resemblance.
6) Move the Probe closer to the suspected source while decreasing sensitivity. The conductor carrying the responsible current is located by the sharp response null on top of the conductor with inverted polarity on each side.
7) Trace out the noise current path as much as possible. Identify the current path on the schematic.
8) The source of the noise transient is usually evident from the current path and the timing information.
©1997, Bruce Carsten Associates, Inc.
With a Sniffer Probe, I was able to show which pins of which ICs had the larger current transients in synchronism with the supply voltage transients. (The logic design engineers were accusing the power supply vendor of creating the noise. I found that the supplies were fairly quiet; it was the poorly designed logic power distribution system that was the problem.)
Probe Use with a “LISN”
A test setup using the Sniffer Probe with a Line Impedance Stabilization Network (LISN) is shown in FIgure E13. The optional “LISN AC LINE FILTER” reduces AC line voltage feedthrough from a few 100mV to microvolt levels, sim-plifying EMI diagnosis when a suitable DC voltage source is not available or cannot be used.
TESTING THE SNIFFER PROBE
The Sniffer Probe can be functionally tested with a jig similar to that shown in Figure E14, which is used to test probes in production.
CONCLUSION
The Sniffer Probe is a simple, but very fast and effective means to locate dl/dt sources of EMI. These EMI sources are very difficult to locate with conventional voltage or current probes.
SUMMARY
A summarized procedure for using the EMI “Sniffer” Probe appears in Figure E15.

Application Note 118
AN118-45
an118fb
Figure E16. 40MHz Amplifier for EMI Probe
–
+A1
LT1223
–
+A2
LT12231k
365Ω
USE RF LAYOUT TECHNIQUES.SUPPLIES = ±15V, BYPASS EACH AMPLIFIER WITH0.1µF CERAMIC CAPACITORS.DIODE CLAMP SUPPLIES FOR REVERSE VOLTAGE
EMI “SNIFFER” PROBE(SEE APPENDIX IFOR DETAILS)
1k
365Ω
–
+A3
LT1223
1k 1k
1µF
365Ω
AN72 J16
–
+A4
LT1223
1k
–15V
15V
BNC OUTPUTTO SCOPE
365Ω
50Ω
50Ω
SNIFFER PROBE AMPLIFIER
Figure E16 shows a 40MHz amplifier for the Sniffer Probe. A gain of 200 allows an oscilloscope to display probe output over a wide range of sensed inputs. The amplifier is built into a small aluminum box. The probe should connect to the amplifier via BNC cable, although the 50Ω termina-tion does not have to be a high quality coaxial type. The
probe’s uncalibrated, relative output means high frequency termination aberrations are irrelevant. A simple film resis-tor, contained in the amplifier box, is adequate. Figure E17 shows the Sniffer Probe and the amplifier.
An alternate approach utilizes Appendix B’s (Figure B11) HP-461A 50Ω amplifier.

Application Note 118
AN118-46
an118fb
Figu
re E
17. S
niffe
r Pro
be a
nd A
mpl
ifier
. Not
e Al
l BNC
-Bas
ed S
igna
l Tr
ansm
issi
on. ±
15V
Pow
er E
nter
s Bo
x vi
a Se
para
te C
able

Application Note 118
AN118-47
an118fb
Information furnished by Linear Technology Corporation is believed to be accurate and reliable. However, no responsibility is assumed for its use. Linear Technology Corporation makes no representa-tion that the interconnection of its circuits as described herein will not infringe on existing patent rights.
About Ferrite Beads
A ferrite bead enclosed conductor provides the highly desir-able property of increasing impedance as frequency rises. This effect is ideally suited to high frequency noise filter-ing of DC and low frequency signal carrying conductors. The bead is essentially lossless within a linear regulator’s passband. At higher frequencies the bead’s ferrite material interacts with the conductors magnetic field, creating the loss characteristic. Various ferrite materials and geometries result in different loss factors versus frequency and power level. Figure F1’s plot shows this. Impedance rises from 0.01Ω at DC to 50Ω at 100MHz. As DC current, and hence constant magnetic field bias, rises, the ferrite becomes less effective in offering loss. Note that beads can be “stacked” in series along a conductor, proportionally increasing their loss contribution. A wide variety of bead materials and physical configurations are available to suit requirements in standard and custom products.
APPENDIX F
FREQUENCY (MHz)1
0
IMPE
DENC
E (Ω
) 40
50
60
10 100 1000
AN118 F1
30
20
10
DC = 0.01Ω
0A
0.1A
0.2A
0.5A
Figure F1. Impedance vs Frequency at Various DC Bias Currents for a Surface Mounted Ferrite Bead (Fair-Rite 2518065007Y6). Impedance is Essentially Zero at DC and Low Frequency, Rising Above 50Ω Depending on Frequency and DC Current. Source: Fair-Rite 2518065007Y6 Datasheet
Inductor Parasitics
Inductors can sometimes be used for high frequency filtering instead of beads but parasitics must be kept in mind. Advantages include wide availability and better ef-fectiveness at lower frequencies, e.g., ≤100kHz. Figure G1 shows disadvantages are parasitic shunt capacitance and potential susceptibility to stray switching regulator radiation. Parasitic shunt capacitance allows unwanted high frequency feedthrough. The inductors circuit board position may allow stray magnetic fields to impinge its
APPENDIX G
winding, effectively turning it into a transformer second-ary. The resulting observed spike and ripple related arti-facts masquerade as conducted components, degrading performance.
Figure G2 shows a form of inductance based filter con-structed from PC board trace. Such extended length traces, formed in spiral or serpentine patterns, look inductive at high frequency. They can be surprisingly effective in some circumstances, although introducing much less loss per unit area than ferrite beads.
Figure G1. Some Parasitic Terms of an Inductor. Unwanted Capacitance Permits High Frequency Feedthrough. Stray Magnetic Field Induces Erroneous Inductor Current
Figure G2. Spiral and Serpentine PC Patterns are Sometimes Used as High Frequency Filters, Although Less Effective Than Ferrite Beads
USERTERMINAL
USERTERMINAL
PARASITICCAPACITANCE
STRAYMAGNETIC
FIELD
AN118 G1
TERMINAL ACCESSABLE WITH PC VIA.
AN118 G2

Application Note 118
AN118-48
an118fb
Linear Technology Corporation1630 McCarthy Blvd., Milpitas, CA 95035-7417 (408) 432-1900 FAX: (408) 434-0507 www.linear.com © LINEAR TECHNOLOGY CORPORATION 2008
LT 0615 REV B • PRINTED IN USA
Related Documents


![HYDROVARHYDROVAR Power supply Output to motor Type Rated output Voltage limits 48-62 Hz Recommended Rated current line protection Max. voltage output output HV [kW] [V] [A] [V] [A]](https://static.cupdf.com/doc/110x72/60b9368db7874e2ac643ec24/hydrovar-hydrovar-power-supply-output-to-motor-type-rated-output-voltage-limits.jpg)