National Water-Quality Assessment Program An Overview Comparing Results from Two Decades of Monitoring for Pesticides in the Nation’s Streams and Rivers, 1992–2001 and 2002–2011 Scientific Investigations Report 2014–5154 U.S. Department of the Interior U.S. Geological Survey

Welcome message from author
This document is posted to help you gain knowledge. Please leave a comment to let me know what you think about it! Share it to your friends and learn new things together.
Transcript

National Water-Quality Assessment Program
An Overview Comparing Results from Two Decades of Monitoring for Pesticides in the Nation’s Streams and Rivers, 1992–2001 and 2002–2011
Scientific Investigations Report 2014–5154
U.S. Department of the InteriorU.S. Geological Survey


An Overview Comparing Results from Two Decades of Monitoring for Pesticides in the Nation’s Streams and Rivers, 1992–2001 and 2002–2011
By Wesley W. Stone, Robert J. Gilliom, and Jeffrey D. Martin
National Water-Quality Assessment Program
Scientific Investigations Report 2014–5154
U.S. Department of the InteriorU.S. Geological Survey

U.S. Department of the InteriorSALLY JEWELL, Secretary
U.S. Geological SurveySuzette M. Kimball, Acting Director
U.S. Geological Survey, Reston, Virginia: 2014
For more information on the USGS—the Federal source for science about the Earth, its natural and living resources, natural hazards, and the environment, visit http://www.usgs.gov or call 1–888–ASK–USGS.
For an overview of USGS information products, including maps, imagery, and publications, visit http://www.usgs.gov/pubprod
To order this and other USGS information products, visit http://store.usgs.gov
Any use of trade, firm, or product names is for descriptive purposes only and does not imply endorsement by the U.S. Government.
Although this information product, for the most part, is in the public domain, it also may contain copyrighted materials as noted in the text. Permission to reproduce copyrighted items must be secured from the copyright owner.
Suggested citation:Stone, W.W., Gilliom, R.J., and Martin, J.D., 2014, An overview comparing results from two decades of monitoring for pesticides in the Nation’s streams and Rrvers, 1992–2001 and 2002–2011: U.S. Geological Survey Scientific Investigations Report 2014–5154, 23 p., http://dx.doi.org/10.3133/sir20145154.
ISSN 2328-0328 (online)http://dx.doi.org/10.3133/sir20145154

iii
Contents
Abstract ..........................................................................................................................................................1Introduction.....................................................................................................................................................1
Purpose and Scope ..............................................................................................................................2Pesticide Monitoring Design ..............................................................................................................2
Methods...........................................................................................................................................................2Pesticides ...............................................................................................................................................3Stream-Site Selection ..........................................................................................................................4Detection Frequency and Concentration Statistics ........................................................................4Land-Use Classifications .....................................................................................................................6
Pesticide Occurrence ...................................................................................................................................7Concentrations And Benchmark Comparisons ........................................................................................8Summary........................................................................................................................................................10References Cited..........................................................................................................................................11Appendix 1.....................................................................................................................................................13
Figures
1. Estimated agricultural use of synthetic organic herbicides, insecticides, and fungicides in the conterminous U.S. during first (1992–2001) and second (2002–11) decades of stream monitoring ....................................................................................................3
2. Map showing the national monitoring network for pesticides in streams and rivers included 182 sites during 1992–2001 and 125 sites during 2002–11, with 96 of the sites common to both decades. ...................................................................................................................5
3. Percentage of time during a year that the most frequently detected pesticides were detected in streams and rivers in relation to land-use classification .......................7
4. Pesticides that exceeded chronic Aquatic Life Benchmarks at more than 5 percent of stream sites and percent of streams by land-use classification .....................................9
Tables
1. Minimum samples, per water year, by watershed size ..........................................................4 2. Land-use classifications and watershed land-use criteria ...........................................................6 3. Number of stream sites by land-use classification ................................................................6 4. Percent of time one or more pesticides or pesticide degradates were detected in
streams, by land-use classification ...........................................................................................7 5. Percent of streams with one or more pesticide concentration statistics that
exceeded a chronic Aquatic Life Benchmark (ALB), by land-use classification ............10

iv
Conversion Factors and Abbreviations
SI to Inch/Pound
Multiply By To obtain
Areasquare kilometer (km2) 247.1 acresquare kilometer (km2) 0.3861 square mile (mi2)
Water year is the 12-month period of October 1, for any given year through September 30, of the following year. The water year is designated by the calendar year in which it ends and which includes 9 of the 12 months.
Abbreviations used in this report
ALB Aquatic Life Benchmark
GCMS gas chromatography/mass spectrometry
HHB Human Health Benchmark
NASQAN National Stream Quality Accounting Network
NAWQA National Water-Quality Assessment
NLCD National Land Cover Data
NLCD06 National Land Cover Data 2006
NLCDe National Land Cover Data enhanced
NWQL National Water Quality Laboratory
USGS U.S. Geological Survey

An Overview Comparing Results from Two Decades of Monitoring for Pesticides in the Nation’s Streams and Rivers, 1992–2001 and 2002–2011
By Wesley W. Stone, Robert J. Gilliom, and Jeffrey D. Martin
Abstract
This report provides an overview of the U.S. Geologi-cal Survey National Water-Quality Assessment program and National Stream Quality Accounting Network findings for pes-ticide occurrence in U.S. streams and rivers during 2002–11 and compares them to findings for the previous decade (1992–2001). In addition, pesticide stream concentrations were compared to Human Health Benchmarks (HHBs) and chronic Aquatic Life Benchmarks (ALBs). The comparisons between the decades were intended to be simple and descrip-tive. Trends over time are being evaluated separately in a series of studies involving rigorous trend analysis. During both decades, one or more pesticides or pesticide degradates were detected more than 90 percent of the time in streams across all types of land uses. For individual pesticides during 2002–11, atrazine (and degradate, deethylatrazine), carbaryl, fipronil (and degradates), metolachlor, prometon, and simazine were detected in streams more than 50 percent of the time. In con-trast, alachlor, chlorpyrifos, cyanazine, diazinon, EPTC, Dac-thal, and tebuthiuron were detected less frequently in streams during the second decade than during the first decade. Dur-ing 2002–11, only one stream had an annual mean pesticide concentration that exceeded an HHB. In contrast, 17 percent of agriculture land-use streams and one mixed land-use stream had annual mean pesticide concentrations that exceeded HHBs during 1992–2001. The difference between the first and sec-ond decades in terms of percent of streams exceeding HHBs was attributed to regulatory changes. During 2002–11, nearly two-thirds of agriculture land-use streams and nearly one-half of mixed land-use streams exceeded chronic ALBs. For urban land use, 90 percent of the streams exceeded a chronic ALB. Fipronil, metolachlor, malathion, cis-permethrin, and dichlorvos exceeded chronic ALBs for more than 10 percent of the streams. For agriculture and mixed land-use streams, the overall percent of streams that exceeded a chronic ALB was very similar between the decades. For urban land-use streams, the percent of streams exceeding a chronic ALB during
2002–11 nearly doubled that seen during 1992–2001. The reason for this difference was the inclusion of fipronil moni-toring during the second decade. Across all land-use streams, the percent of streams exceeding a chronic ALB for fipronil during 2002–11 was greater than all other insecticides dur-ing both decades. The percent of streams exceeding a chronic ALB for metolachlor, chlorpyrifos, diazinon, malathion, and carbaryl decreased from the first decade to the second decade. The results of the 2002–11 summary and comparison to 1992–2001 are consistent with the results from more rigorous trend analysis of pesticide stream concentrations for individual streams in various regions of the U.S.
Introduction
The U.S. Geological Survey (USGS) National Water-Quality Assessment (NAWQA) and National Stream Quality Accounting Network (NASQAN) are monitoring programs that collect and report data for national assessments of pesti-cide concentrations in the Nation’s streams and rivers. Gilliom and others (2006) reported findings for the first decade (1992–2001) of the NAWQA program and found that pesticides or their degradates were present in one or more water samples from every stream included in the assessment; one or more pesticides were detected more than 90 percent of the time in agricultural, urban, and mixed land-use streams; and the most frequently detected pesticides also had the greatest use.
This report builds upon the 1992–2001 assessment of pesticides in the Nation’s streams (Gilliom and others, 2006) by summarizing pesticide occurrence in streams during the second decade (2002–11) of NAWQA stream monitor-ing, including pesticide stream concentration data from the NASQAN program, and providing descriptive comparisons between the two decades of pesticide monitoring. Gilliom and others (2006) assessed the occurrence of 83 pesticides and degradates from 186 stream sites that represented agriculture, urban, mixed, and undeveloped land uses during 1992–2001.

2 An Overview Comparing Results from Two Decades of Monitoring for Pesticides in the Nation’s Streams and Rivers
Changes in the NAWQA program between the first and second decades reduced the number of monitored stream sites. The sampling design (number of samples to be collected and when they were to be collected) also changed between the decades. Specifically, the 1992–2001 sampling design was a mix of fixed-frequency sampling and high-flow sampling (to char-acterize times of expected higher stream pesticide concentra-tions); however, the 2002–11 sampling design was fixed-fre-quency with minimal high-flow sampling efforts. In addition, the number of pesticides and degradates that were monitored in streams sufficient for a national assessment nearly doubled during the second decade.
The changes in the NAWQA pesticide stream monitor-ing program from the first to second decade made it difficult to do simple, stream site to stream site comparisons between the decades and compare directly to the assessment by Gilliom and others (2006). In addition, this assessment differs from the previous assessment by Gilliom and others (2006) because (1) Human Health Benchmarks (HHBs) and chronic Aquatic Life Benchmarks (ALBs) have been updated; (2) some pesticides assessed during 1992–2001 were not sampled at enough sites to attain a reasonable national distribution during 2002–11; (3) land use ancillary data used to group sites have changed over time; (4) the stream-site selection process was revised; and (5) this assessment includes multiple years of data for sites, when available. The inclusion of multiple years of concentra-tion data rather than a single year in the assessment, as was done by Gilliom and others (2006), was evaluated in terms of occurrence and percent of stream sites exceeding an HHB or chronic ALB for 1992–2001. The occurrence of pesticides in streams and the percent of stream sites that exceeded an HHB or chronic ALB for a single year compared to multiple years were all within 10 percent of each other for 1992–2001. Overall, the 1992–2001 results in this report are not markedly different than those reported by Gilliom and others (2006) except in cases where an ALB has been more recently estab-lished. For example, an ALB for metolachlor or S-metolachlor did not exist when Gilliom and others (2006) completed the initial assessment for 1992–2001; however, ALBs for S-meto-lachlor have been established and are used in this assessment. This report uses the most current HHBs and chronic ALBs for assessment of annual pesticide stream concentrations. Acute ALBs were not used in the comparisons between decades because the differences in sampling designs between them would likely bias the comparisons.
Purpose and Scope
The purpose of this report is to summarize pesticide occurrence in U.S. streams and rivers during 2002–11 in comparison to the previous decade, 1992–2001. This overview focuses on pesticide occurrence (percent of time detected) and pesticide concentrations in relation to HHBs and chronic ALBs. Although pesticide occurrence is compared between the decades for perspective, the comparisons are simple and
descriptive, and are not meant as a rigorous trend analysis. Trends are being evaluated separately in a series of studies involving quantitative site-based trend models, including Corn-Belt streams (Sullivan and others, 2009) and urban streams (Ryberg and others, 2010).
Pesticide Monitoring Design
The national design for monitoring pesticides in streams and rivers has evolved from the combination of two USGS programs, NAWQA and NASQAN. NAWQA stream monitor-ing during 1992–2001 focused on assessing water-quality con-ditions in 51 of the Nation’s river basins, referred to as “Study Units,” on a rotational schedule—20 Study Units during 1992–95, 16 during 1996–98, and 15 during 1998–2001 (Gilliom and others, 2006). Pesticide samples generally were collected at each stream site by using a combination of fixed-frequency and high-flow sampling (Gilliom and others, 1995). Fixed-frequency sampling means that a given number of water-quality samples were allocated to each month (more samples for months with expected higher potential for pesticide runoff and fewer samples during months of lower expected potential for pesticide runoff), and the water samples were collected at regularly spaced intervals within each month. High-flow sampling was used to allocate additional water samples to characterize high-flow events during seasonal periods of high pesticide use and potential runoff. Changes to the design of the NAWQA program during 2002–2011 included reduction in the number of long-term stream-monitoring sites, an increased emphasis on regional assessments, and supplemental high-flow sampling was limited to special regional studies.
The NASQAN program was redesigned in 1995 to esti-mate the mass flux of pesticides and other constituents at 41 monitoring sites in four large river systems: the Mississippi, the Rio Grande, the Columbia, and the Colorado. Similar to the NAWQA program, water samples generally were collected at each stream site by using a combination of fixed-frequency and high-flow sampling (Hooper and others, 2001). Also similar to the NAWQA program, the frequency of water-quality sampling typically changed seasonally, with more frequent samples during the peak pesticide-runoff months. The NASQAN sampling strategy was revised in 2000 (U.S. Geological Survey, 2010), with reduced monitoring in the Columbia and Colorado River Basins.
Methods
This report summarizes pesticide stream concentration data from samples collected during 2002–11 and compares the results to findings from 1992–2001. Site selection was based on the number of years with data, watershed size, and frequency of sampling within each year. For a sampling site, all years of sampling that met the minimum sampling criteria were included in the summaries. The summaries for

Methods 3
both decades are based on the estimated amount of time a pesticide was detectable at a stream site and the number of times HHBs and chronic ALBs were exceeded. For summary purposes, sampling sites were grouped by dominant land-use classification.
Pesticides
During any given year more than 400 different pesticides are used in agricultural settings (Stone, 2013). The large num-ber of pesticides in use and the phasing out and introduction of new pesticides make it not possible to monitor all pesti-cides because of budget and method constraints. This report includes a selected subset of pesticides in use over the last two decades that were sampled at enough sites to attain a reason-able national distribution during 2002–11.
Pesticides included in this report are listed in appendix 1 (table 1–1). Martin (2009) determined that only pesticide data from a single laboratory and analytical method were sufficiently extensive in time and space for a national assess-ment across decades. Hence, only pesticides and pesticide data that were analyzed at the National Water-Quality Labora-tory (NWQL) by a gas chromatography/mass spectrometry (GCMS) method were included in this report. The NAWQA and NASQAN programs periodically evaluate the full range of pesticides in use to prioritize monitoring to include the most important ones in relation to ecosystem and human health (Norman and others, 2012). This prioritization process also evaluates the likelihood that a pesticide will be found in sur-face water or sediment, based on chemical properties. During
2002–11, there were 123 pesticides and pesticide degradates with sufficient stream concentration data to include in this assessment. Gilliom and others (2006) included 83 pesticides in their assessment of 1992–2001; however, only 47 of these pesticides were sampled at enough sites during 2002–11 for a national-level comparison between the decades. The difference between the 47 pesticides assessed during the first decade and the 123 pesticides assessed during the second decade included 39 (or 51 percent) pesticide degradates; 21 (or 28 percent) insecticides; 8 (or 11 percent) fungicides; and the remaining were herbicides, nematicides, plant growth regulators, and defoliants.
Figure 1 shows an overview by one measure—amount used—of how pesticides included in this report relate to total national use and to selected pesticides or groups not included. A large portion of the difference between national total her-bicide use and the proportion included in this report was the result of increased use of glyphosate that came with the rapid adoption of genetically modified crops resistant to glypho-sate, beginning in the mid-1990s. Glyphosate is difficult and costly to measure, and efforts to assess glyphosate have been limited primarily to local or short-term studies. Other types of pesticides not comprehensively included in this report, such as fungicides and neonicotinoid insecticides, are not individu-ally as prominent as glyphosate in terms of amounts applied, but may be environmentally important because of their greater toxicity. Finally, some hydrophobic pesticides, such as legacy organochlorines and pyrethroid insecticides, are important as contaminants of sediment and (or) tissues, but are not often found in filtered-water samples.
0
100
200
300
400
500
600
2010200820062004200220001998199619941992
Year
Estim
ated
use
, in
mill
ion
poun
ds
0
20
40
60
80
100
120
200820062004200220001998199619941992 2010Year
Herbicides Insecticides
Included in assessmentTotal use*
EXPLANATION
Glyphosate Fungicides Neonicotinoids
*Does not include fumigants or inorganic compounds
Figure 1. Estimated agricultural use of synthetic organic herbicides, insecticides, and fungicides in the conterminous U.S. during first (1992-2001) and second (2002-11) decades of stream monitoring. (GfK Kynetec, Inc., proprietary data, written commun., December 2011 and July 2013).
Figure 1. Estimated agricultural use of synthetic organic herbicides, insecticides, and fungicides in the conterminous U.S. during first (1992–2001) and second (2002–11) decades of stream monitoring. (GfK Kynetec, Inc., proprietary data, written commun., December 2011 and July 2013).

4 An Overview Comparing Results from Two Decades of Monitoring for Pesticides in the Nation’s Streams and Rivers
Stream-Site Selection
Stream-site selection was based on total number of samples each year, watershed size, and the number of samples during potentially high pesticide runoff months. A year was defined as the water year, beginning October 1 and ending September 30. Stream-site selection was based on modifi-cation of the criteria used in Stone and others (2013). The stream-site selection process began with an evaluation of the number of samples collected for the water year compared to minimums based on watershed size (table 1). Stream sites retained from the previous step were then evaluated to make sure there was at least one sample during the months of May, June, and July. These three months are typically the months of expected higher transport of pesticides to streams for the most heavily used pesticides (Stone and others, 2013). Stream sites retained to this point were then evaluated to ensure that samples were present during times when pesticides are less likely transported to streams in order to better represent their occurrence during the entire water year. Specifically, each stream site could not have a consecutive 3-month period with-out a sample. The stream-site selection process was done by individual pesticide because changing analysis schedules over time caused variations in sample numbers between pesticides for some years. The stream-site selection process also did not limit the selection to a single year; all years of sampling at a stream site that met the selection criteria were included in this summary. Stream sites selected for the summary are shown in figure 2 and listed in appendix 1 (table 1–2).
Table 1. Minimum samples, per water year, by watershed size.
[km2, square kilometer; water year, the 12-month period of October 1, for any given year through September 30, of the following year. The water year is designated by the calendar year in which it ends and which includes 9 of the 12 months]
Watershed size (km2) Minimum number of samples
Less than 500 16500 to 4,999 125,000 to 50,000 10Greater than 50,000 8
Detection Frequency and Concentration Statistics
Time-weighted detection frequencies account for the more frequent sample collection during some months than in other months and provide an estimate of the percentage of time (throughout the water year) that a pesticide was detected. The weights were calculated as the amount of time extending from one-half the time interval between an observation and the preceding observation and one-half the time interval extending from the observation to the subsequent observation, divided by the total time in one year. Sample weights for a pesticide at
a stream site sum to one for each year; therefore, the sum of the weights for samples with detections represent the percent-age of time that pesticide was detected for that stream site and year. When there were multiple water years for a stream site and pesticide, the median percentage of time detected across the years was used for that stream site and pesticide. Both the mean and median were evaluated for sites and pesticides with multiple water years of data, and there was not a large difference between the two statistics for the sites and pesti-cides used in this summary.
Annual concentration statistics were calculated for each stream site and pesticide for comparison to HHBs (Toccalino and others, 2014) and chronic ALBs (U.S. Environmental Protection Agency Office of Pesticide Program, http://www.epa.gov/oppefed1/ecorisk_ders/aquatic_life_benchmark.htm, accessed July 2013). Specifically, the annual mean concentra-tion for comparison to HHBs, the annual maximum 21-day moving-average concentration for comparison to the chronic invertebrate ALBs, and the annual maximum 60-day moving-average concentration for comparison to chronic fish and chronic aquatic community (atrazine) ALBs were calculated for this comparison.
Annual mean pesticide concentrations were calculated following the methods described in Larson and others (2004). Specifically, each observed concentration was weighted according to the amount of time it was used to represent the pesticide concentration in the stream. The weights were calcu-lated as the amount of time extending from one-half the time interval between an observation and the preceding observation and one-half the time interval extending from the observa-tion to the subsequent observation, divided by the total time in 1 year. Censored observations complicate the calculation of annual mean concentrations. As described in Larson and others (2004), if less than 10 percent of the weighted data for a site, pesticide, and year combination were censored, censored observations were replaced by one-half the censoring thresh-old reported by the laboratory. If more than 10 percent of the weighted data were censored, and there were at least 20 annual observations with at least 10 uncensored observations and at least 33 percent of the sample weights were represented by uncensored observations, then the log-regression method (Gil-liom and Helsel, 1986; Helsel and Gilliom, 1986) was used to approximate the annual mean concentration. Otherwise, the annual mean concentration was considered to be censored at the censoring threshold reported by the laboratory. For stream sites and pesticides with multiple years of data, if an HHB was exceeded for a pesticide in any year during the first or second decade then the HHB was considered exceeded for that stream site and pesticide in the respective decade.
Annual maximum moving-average pesticide concentra-tions were calculated following the methods described in Stone and others (2008). Hourly pesticide concentrations were estimated for each stream site through linear interpolation of actual observations. Censored observations were assigned a value of zero for the process of linear interpolation. The hourly concentration estimates were averaged to obtain an

Methods
5
EXPLANATION
Sites by land-use classification
MixedUrbanAgricultureDecade
2002–11
1992–2001
Both
Figure 2. The national monitoring network for pesticides in streams and rivers included 182 sites during 1992-2001 and 125 sites during 2002-11, with 96 of the sites common to both decades.
Figure 2. The national monitoring network for pesticides in streams and rivers included 182 sites during 1992–2001 and 125 sites during 2002–11, with 96 of the sites common to both decades.

6 An Overview Comparing Results from Two Decades of Monitoring for Pesticides in the Nation’s Streams and Rivers
estimated daily concentration. The hourly estimates facili-tated computations for days with multiple samples but were not used for other purposes. Moving-average concentrations for the selected durations (21 and 60 days) were computed for each day. The annual maximum moving-average pesti-cide concentrations for each duration were then determined for each stream site/year combination meeting the selection criteria. In most cases, insufficient observations were available for stream sites to calculate moving-average concentrations (21- or 60-day durations) for the beginning of the selected year used in the summary. For example, if the selected year for a stream site was 1993, and there were no observations available prior to that year. To address this issue and estimate moving-average concentrations for the beginning of the selected year, the actual observations for the selected year for that stream site and pesticide were used as surrogate observations for the prior year. For stream sites and pesticides with multiple years of data, if a chronic ALB was exceeded for a pesticide in any year during the first or second decade then the chronic ALB was considered exceeded for that stream site and pesticide in the respective decade.
For discussion and illustration purposes, the percentage of time pesticides were detected in streams and percent of streams exceeding an HHB or chronic ALB were grouped by land-use classification, which is discussed in the subsequent section. The percentage of time a pesticide was detected in a stream for a land-use classification was normalized by the number of stream sites within that land-use classification to avoid one stream site having more influence than another in the summary.
Land-Use Classifications
The summaries and comparisons in this report group streams into three land-use classifications: agriculture, urban, and mixed. The land-use classifications and watershed land-use criteria are similar to those used in Gilliom and others (2006), with two modifications. First, the 2006 National Land Cover Data (NLCD06) was used to classify streams based on land use instead of the 1992 enhanced NLCD (NLCDe). Second, the amount of urban land use allowable in a water-shed for the agriculture stream classification was increased from 5 to 10 percent because of the differences in methodol-ogy between NLCDe and NLCD06. In addition, Gilliom and others (2006) included streams with a land-use classification of undeveloped; however, this summary does not include streams with this land-use classification. The land-use classi-fications and watershed land-use criteria are shown in table 2. For some streams (fewer than 5 percent), the area within the watershed that contributed the majority of water to the stream was not reflective of the land use for the total watershed area. Differences between the total watershed area and the area con-tributing the majority of water to a stream can be caused by natural landscape variations and water-management practices. In these cases, the land-use classification for the stream was changed to reflect the land use for the area contributing the majority of water to the stream. The land-use classifications for each stream are shown in figure 2 and listed in appendix 1 (table 1–2). The number of stream sites by land-use classifica-tion is shown in table 3.
Table 2. Land-use classifications and watershed land-use criteria.
Land-use classification Watershed land-use criteria
Agriculture Greater than 50 percent agricultural land and less than or equal to 10 percent urban landUrban Greater than 25 percent urban land and less than or equal to 25 percent agricultural landUndeveloped Less than or equal to 5 percent urban land and less than or equal to 25 percent agriculture landMixed All other combinations of agriculture, urban, and undeveloped land use
Table 3. Number of stream sites by land-use classification.
Land-use classificationNumber
of stream sites1992–2001
Numberof stream sites
2002–11
Number of commonstream sites
Agriculture 59 36 28Mixed 83 59 45Urban 40 30 23Total 182 125 96
Pesticide Occurrence 7
Pesticide Occurrence
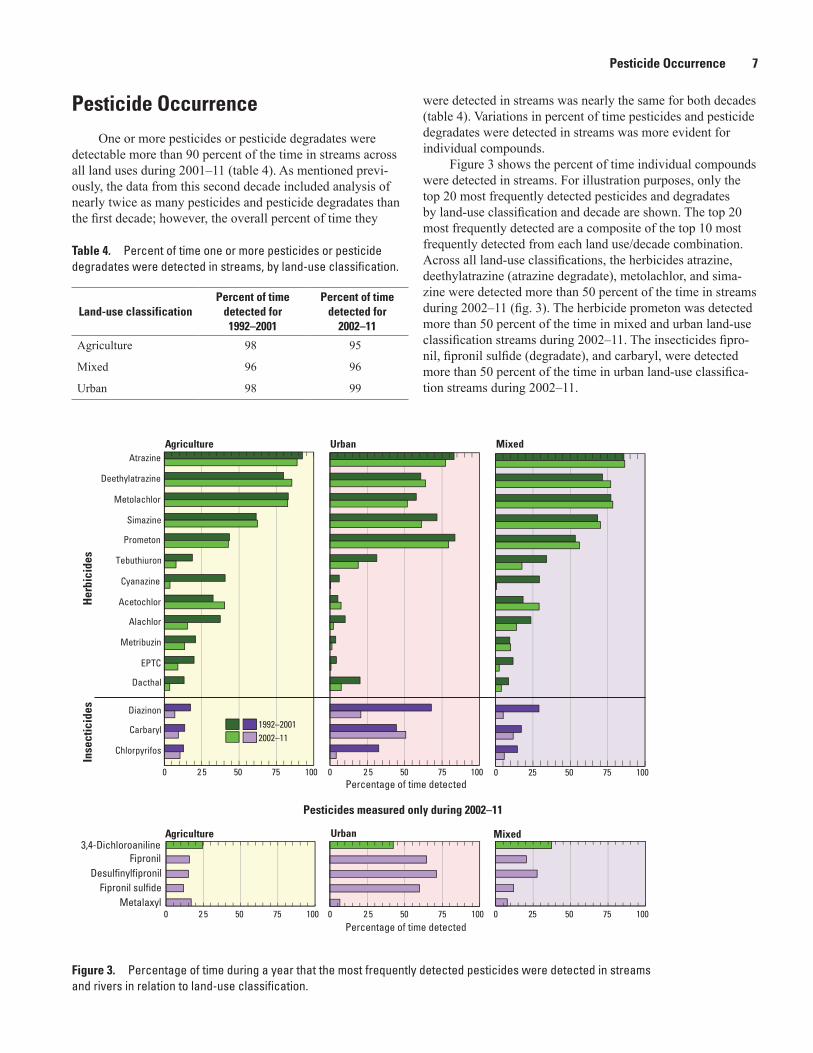
One or more pesticides or pesticide degradates were detectable more than 90 percent of the time in streams across all land uses during 2001–11 (table 4). As mentioned previ-ously, the data from this second decade included analysis of nearly twice as many pesticides and pesticide degradates than the first decade; however, the overall percent of time they
were detected in streams was nearly the same for both decades (table 4). Variations in percent of time pesticides and pesticide degradates were detected in streams was more evident for individual compounds.
Figure 3 shows the percent of time individual compounds were detected in streams. For illustration purposes, only the top 20 most frequently detected pesticides and degradates by land-use classification and decade are shown. The top 20 most frequently detected are a composite of the top 10 most frequently detected from each land use/decade combination. Across all land-use classifications, the herbicides atrazine, deethylatrazine (atrazine degradate), metolachlor, and sima-zine were detected more than 50 percent of the time in streams during 2002–11 (fig. 3). The herbicide prometon was detected more than 50 percent of the time in mixed and urban land-use classification streams during 2002–11. The insecticides fipro-nil, fipronil sulfide (degradate), and carbaryl, were detected more than 50 percent of the time in urban land-use classifica-tion streams during 2002–11.
Table 4. Percent of time one or more pesticides or pesticide degradates were detected in streams, by land-use classification.
Land-use classificationPercent of time
detected for 1992–2001
Percent of time detected for
2002–11
Agriculture 98 95
Mixed 96 96
Urban 98 99
ND
ND
ND
ND
1992–20012002–11
1000 7550 100052 7550 100052 755025
1000 7550 100052 7550 100052 755025
Mixed
Percentage of time detected
UrbanAtrazine
Deethylatrazine
Metolachlor
Simazine
Prometon
Tebuthiuron
Cyanazine
Acetochlor
Alachlor
Metribuzin
EPTC
Dacthal
Diazinon
Carbaryl
Chlorpyrifos
Agriculture
Inse
ctic
ides
Her
bici
des
3,4-DichloroanilineFipronil
DesulfinylfipronilFipronil sulfide
Metalaxyl
Mixed
Percentage of time detected
UrbanAgriculture
Pesticides measured only during 2002–11
Fig. 3 Percentage of time during a year that the most frequently detected pesticides were found in streams and rivers in relation to land-use classification.
Figure 3. Percentage of time during a year that the most frequently detected pesticides were detected in streams and rivers in relation to land-use classification.

8 An Overview Comparing Results from Two Decades of Monitoring for Pesticides in the Nation’s Streams and Rivers
The herbicides alachlor, cyanazine, EPTC, Dacthal, and tebuthiuron were detected less frequently in streams (more than 10 percent change) during the second decade than during the first decade. Sullivan and others (2009) found generally decreasing stream concentration trends for alachlor, cyanazine, and EPTC at individual stream sites within the Corn Belt. The decrease in the amount of time these pesticides were detected in streams between decades may reflect use changes from pesticide-registration cancellations and increased use of other herbicides. For example, cyanazine registration was volun-tarily cancelled in the mid-1990s, which was followed by a rapid decline in cyanazine use. Alachlor use steadily declined after the introduction of acetochlor in the mid-1990s, which was an expected result following the registration of acetochlor (de Guzman and others, 2005). In addition, the introduction of genetically modified crops that are resistant to the herbicide, glyphosate, has seen rapid adoption over the course of the last two decades with a corresponding decrease in other herbicides over the same time period (fig. 1).
The organophosphate insecticides chlorpyrifos and diazi-non were detected less frequently in streams (more than 10 percent change) during the second decade than during the first decade (fig. 3). Sullivan and others (2009) and Ryberg and others (2010) found generally decreasing stream concentra-tion trends for these two pesticides at individual stream sites in agricultural and urban land-use areas, respectively. The change in detection frequency between the two decades for these pesticides reflects registration changes and changes in pesti-cide-use patterns. Various uses of chlorpyrifos and diazinon, primarily residential, began being voluntarily cancelled during the late-1990s, and these regulatory changes continued into the early-2000s. In addition, fipronil was first registered for use in the United States in 1996 (Jackson and others, 2009) and was suggested as an alternative to organophosphate insecticides for residential and commercial turf applications during the early-2000s (U.S. Environmental Protection Agency, 2001).
Fipronil was detected in streams across all land-use clas-sifications from 17 to 63 percent of the time during 2002–11 (fig. 3); however, fipronil was not included in the NAWQA and NASQAN efforts during 1992–2001 because it was not registered for use until 1996. Ryberg and others (2010) found a preponderance of increasing fipronil stream concentration trends for urban land-use streams from 2000 to 2008.
An important consideration when comparing detec-tion frequencies over time is the possible impacts of analysis instrument changes. The assumption is that improvements in laboratory instrumentation could result in increased detection sensitivity over time. Alternatively, changes in instrumenta-tion over time could possibly result in decreased sensitivity over time. Ryberg and others (2010) evaluated detections of trace concentrations in duplicate quality-control water samples collected from 1994 to 2005. They found that for most of the pesticides evaluated, improvements to instrumentation did not result in changes to detection sensitivities through time. However, instrumentation improvements did increase the
detection sensitivity for tebuthiuron and carbaryl (Ryberg and others, 2010). As discussed previously, the amount of time tebuthiuron was detected in streams decreased from the first to the second decade (fig. 3); therefore, improvements to instrumentation was not a factor for this pesticide. For carba-ryl, the differences in detection frequency between the first and second decades were less than 10 percent in all land-use classifications.
Concentrations And Benchmark Comparisons
Annual mean pesticide concentrations in streams were compared to HHBs to provide perspective; however, these comparisons are not appropriate for assessing compliance with drinking-water regulations, which are applied to treated water. The pesticide stream concentrations used in this report represent untreated water from sites that are not located at drinking-water intakes.
During 2002–11, one agriculture land-use stream had an annual mean pesticide concentration that exceeded an HHB (atrazine), and no urban or mixed land-use streams had annual mean pesticide concentrations that exceeded HHBs. In contrast, 17 percent of the agriculture land-use streams and 5 percent of mixed land-use streams exceeded HHBs during 1992–2001. During the previous decade, alpha-HCH (lin-dane), atrazine, cyanazine, molinate, dieldrin, and propargite annual mean concentrations exceeded HHBs in 10 agriculture and 4 mixed land-use streams. The differences in the percent of streams exceeding an HHB between the first and second decade are related to regulatory and use changes. Throughout the last three decades, various lindane uses were voluntarily cancelled by registrants; the last remaining uses were can-celled in 2006. Sullivan and others (2009) found downward trends in atrazine concentrations measured in agriculture streams of the Corn Belt. As mentioned previously, cyanazine registration was voluntarily cancelled in the mid-1990s, and cyanazine use sharply declined from the first to the second decade. During the early-2000s, molinate registration was vol-untarily cancelled, and use sharply declined during 2002–11. Dieldrin registration was voluntarily cancelled during the late-1980s, and certain uses of propargite were voluntarily cancelled during the mid-1990s.
Pesticide concentrations in streams were compared to chronic ALBs. Acute ALBs were not used because the sampling frequencies do not adequately represent the high-est concentrations that may be present in a stream during the year (Crawford, 2004). In addition, differences in sampling designs between the two decades limit comparisons between the decades based on the highest concentrations measured in streams. Specifically, sampling during the first decade included samples targeting high-flow events during the season when pesticides were expected to be transported to streams,

Concentrations And Benchmark Comparisons 9
while sampling during the second decade maintained a fixed-frequency sampling design. Therefore, comparison of the highest pesticide stream concentrations between the two decades would be biased.
During 2002–11, nearly two-thirds of agriculture land-use classification streams and nearly one-half of mixed land-use classification streams exceeded a chronic ALB (table 5). For urban land-use classification streams, 90 percent exceeded a chronic ALB. The insecticide fipronil exceeded chronic ALBs for more than 20 percent of the streams across all land-use classifications (fig. 4). The herbicide metolachlor (chronic ALB for S-metolachlor) exceeded chronic ALBs for more than 10 percent of agriculture and mixed land-use streams. Similarly, the insecticide malathion exceeded chronic ALBs for more than 10 percent of agriculture and urban land-use streams. The insecticides cis-permethrin (chronic ALB for per-methrin) and dichlorvos exceeded chronic ALBs for more than 10 percent of mixed and urban land-use streams, respectively.
Overall, the percent of streams with pesticides that exceeded a chronic ALB was very similar between the
two decades for the agriculture and mixed land-use groups (table 5). In terms of pesticides that were evaluated dur-ing both decades, the percent of urban land-use streams that exceeded a chronic ALB during the second decade was about the same as that for the first decade. However the inclusion of fipronil and dichlorvos during the second decade nearly doubled the percent of urban land-use streams that exceeded a chronic ALB during the second decade in comparison to the first decade (table 5; fig. 4).
During 2002–11, there were 21 pesticides that exceeded chronic ALBs compared to 16 that exceeded chronic ALBs during 1992–2001. Figure 4 shows a subset of the pesticides that had annual concentration statistics that exceeded a chronic ALB (pesticides and degradates that exceeded a chronic ALB for more than 5 percent of the stream sites, by pesticide and land-use classification). The second decade had a lower percent of streams exceeding a chronic ALB for the herbicide metolachlor than the first decade for all land-use classifica-tions. For the agriculture land-use streams, this difference was greater than 10 percent. During the last part of the first decade
Figure 4. Pesticides that exceeded chronic Aquatic Life Benchmarks at more than 5 percent of stream sites and percent of streams by land-use classification.
Urban
Metolachlor
Atrazine
Diazinon
Malathion
Chlorpyrifos
Carbaryl
Azinphos methyl
cis-Permethrin
Disulfoton
Parathion
Agriculture
1992–20012002–11
Mixed
UrbanFipronil
Fipronil sulfone
Dichlorvos
Agriculture Mixed
0 50403020 7010 50060 403020 7010 600 50403020 7010 60
0 50403020 7010 600 50403020 7010 50060 403020 7010 60
Percent of stream sites exceeding chronic Aquatic Life Benchmarks
Percent of stream sites exceeding chronic Aquatic Life Benchmarks
Pesticides measured only during 2002–11
Her
bici
des
Inse
ctic
ides
Figure 4. Pesticides that exceeded chronic Aquatic Life Benchmarks at more than 5 percent of stream sites and percent of streams by land-use classification.

10 An Overview Comparing Results from Two Decades of Monitoring for Pesticides in the Nation’s Streams and Rivers
Table 5. Percent of streams with one or more pesticide concentration statistics that exceeded a chronic Aquatic Life Benchmark (ALB), by land-use classification.
Land-use classification
Percent of streams exceeding
ALB 1992–2001
Percent of streams exceeding
ALB 2002–11
Agriculture 69 61
Mixed 45 46
Urban 53 90
replaced by the resolved isomer S-metolachlor, which reduces the amount of pesticide required for the same agronomic effect (Hartzler, 2000). Although metolachlor was detected in streams for nearly the same amount of time for both decades (fig. 3), the decreased use (in terms of mass applied) because of the introduction of S-metolachlor likely contributed to the decrease in the percent of streams that exceeded a chronic ALB during 2002–11 when compared to 1992–2001.
For streams in the urban land-use classification group, the organophosphate insecticides chlorpyrifos, diazinon, and malathion, and the carbamate insecticide carbaryl all had decreases (greater than 10 percent) in the percent of streams exceeding a chronic ALB from the first decade to the second decade (fig. 4). This is consistent with the decreasing stream concentration trends found by Ryberg and others (2010) for chlorpyrifos and diazinon in individual urban land-use streams. These pesticides also were detected less frequently in streams during 1992–2001 compared to 2002–11 (fig. 3). In contrast, the percent of streams, across all land-use classifica-tions, exceeding a chronic ALB for fipronil during the second decade was greater than all other insecticides during both decades. As discussed previously, fipronil registration and use began toward the end of the first decade and was a suggested alternative for organophosphate insecticides during the second decade.
Summary
This report provides an overview of U.S. Geological Survey National Water-Quality Assessment (NAWQA) and National Stream Quality Accounting Network (NASQAN) findings for pesticide occurrence (percent of time pesticides were detected) in U.S. streams during 2002–11 and compares them to findings during 1992–2001. In addition, pesticide stream concentrations are compared to Human Health Bench-mark (HHBs) and chronic Aquatic Life Benchmark (ALBs) and differences between the decades discussed.
Direct and simple, one to one comparisons of pesticides in stream water between the two decades are not possible because of changes in stream sampling sites, sampling designs, and pesticides monitored within the programs over the last two decades. The comparisons in this report are from a site selection and land-use classification based on 2002–11
information that is applied to evaluate results for the 1992–2001 sites. In addition, the most current chronic ALBs are used in comparison to annual concentration statistics.
During 2002–11, atrazine, deethylatrazine (atrazine degradate), carbaryl, fipronil, fipronil sulfide (fipronil deg-radate), metolachlor, prometon, and simazine were detected more than 50 percent of the time in streams. One or more pesticides or pesticide degradates were detected more than 90 percent of the time in streams across all land uses during both decades. The overall amount of time pesticides were detected in streams was nearly the same between the first and second decades. However, there were differences between the two decades when comparing individual pesticides. The herbi-cides alachlor, cyanazine, EPTC, Dacthal, and tebuthiuron were detected less frequently in streams during 2002–11 than during 1992–2001. Regulatory changes and the increased use of acetochlor and glyphosate between the first decade and the second decade may be contributing to the decrease in the amount of time these pesticides were detected in streams. The organophosphate insecticides diazinon and chlorpyrifos were detected less frequently during 2002–11 than during 1992–2001. Product registration changes as well as the registration of the insecticide fipronil during the last part of the first decade may be contributing to the decrease in the amount of time these pesticides were detected in streams.
When stream concentration statistics were compared to HHBs, only one agriculture land-use stream had an annual mean pesticide concentration that exceeded an HHB (atrazine) during 2002–11. In contrast, during 1992–2001, about 17 per-cent of the agriculture land-use streams and one mixed land-use stream exceeded HHBs. The HHB exceedance difference between the first and second decades was the result of regula-tory changes; specifically, cancellation of pesticide registration and subsequent decreased use.
During 2002–11, most agriculture and urban land-use classification streams and nearly one-half of mixed land-use classification streams had pesticide concentration statistics that exceeded a chronic ALB. The overall percent of streams that exceeded a chronic ALB was very similar between the two decades for agricultural and mixed land-use classification streams. However, for urban land-use classification streams the percent of streams exceeding a chronic ALB during 2002–11 nearly doubled that seen during 1992–2001. The inclusion of fipronil and dichlorvos monitoring during 2002–11 was the reason for this difference.
The summaries and comparisons between the two decades in this report were intended to be simple and descrip-tive overviews and not substitutes for more quantitative trend analysis that account for streamflow and other factors. Pesticide stream concentration trends at individual stream sites have been evaluated with more rigorous analysis methods for regions of the U.S. and selected time periods during these decades (Sullivan and others, 2009; Ryberg and others, 2010). Pesticide stream concentration trends using NAWQA and NASQAN results will continue to be evaluated in a series of studies involving quantitative site-based trend models.

References Cited 11
References Cited
Crawford, C.G., 2004, Sampling strategies for estimating acute and chronic exposures of pesticides in streams: Jour-nal of the American Water Resources Association, v. 40, no. 2, p. 485–502, DOI:10.1111/j.1752-1688.2004.tb01045.x.
de Guzman, N.P., Hendley, P., Gustafson, D.I., van Wesen-beeck, I., Klein, A.J., Fuhrman, J.D., Travis, K., Simmons, N.D., Teskey, W.E., and Durham, R.B, 2005, The Aceto-chlor Registration Partnership state ground water moni-toring program: Journal of Environmental Quality, v. 34, p. 793–803, doi:10.2134/jeq2003.0412.
Gilliom, R.J., Alley, W.M., and Gurtz, M.E., 1995, Design of the National Water-Quality Assessment Program—Occurrence and distribution of water-quality conditions: U.S. Geological Survey Circular 1112, 33 p.
Gilliom, R.J., Barbash, J.E., Crawford, C.G., Hamilton, P.A., Martin, J.D., Nakagaki, Naomi, Nowell, L.H., Scott, J.C., Stackelberg, P.E., Thelin, G.P., and Wolock, D.M., 2006, The quality of our Nation’s waters—Pesticides in the Nation’s streams and ground water, 1992–2001: U.S. Geological Survey Circular 1291, 172 p.
Gilliom, R.J., and Helsel, D.R., 1986, Estimation of distribu-tional parameters for censored trace level water quality data 1—Estimation techniques: Water Resources Research, v. 22, no. 2, p. 135–146, DOI:10.1029/WR022i002p00135.
Hartzler, Bob, 2000, Resolved isomers explained: Ames, Iowa, Iowa State University, Weed Science, accessed February 14, 2014, at http://www.weeds.iastate.edu/mgmt/qtr00-1/isomers.htm.
Helsel, D.R., and Gilliom, R.J., 1986, Estimation of distri-butional parameters for censored trace level water quality data, 2—Verification and applications: Water Resources Research, v. 22, no. 2, p. 147–155, DOI:10.1029/WR022i002p00147.
Hooper, R.P., Aulenbach, B.T., and Kelly, V.J., 2001, The National Stream Quality Accounting Network—A flux-based approach to monitoring the water quality of large rivers: Hydrological Processes, v. 15, p. 1089–1106.
Jackson, D., Cornell, C.B., Luukinen, B., Buhl, K., and Stone, D., 2009, Fipronil Technical Fact Sheet: National Pesticide Information Center, Oregon State University Extension Services, accessed July 21, 2014, at http://npic.orst.edu/factsheets/fiptech.pdf.
Larson, S.J., Crawford, C.G., and Gilliom, R.J., 2004, Development and application of Watershed Regressions for Pesticides (WARP) for estimating atrazine concentration distributions in streams: U.S. Geological Survey Water-Resources Investigations Report 03–4047, 68 p.
Martin, J.D., 2009, Sources and preparation of data for assess-ing trends in concentrations of pesticides in streams of the United States, 1992–2006: U.S. Geological Survey Scien-tific Investigations Report 2009–5062, 41 p.
Norman, J.E., Kuivila, K.M., and Nowell, L.H., 2012, Priori-tizing pesticide compounds for analytical methods devel-opment: U.S. Geological Survey Scientific Investigations Report 2012–5045, 206 p.
Ryberg, K.R., Vecchia, A.V., Martin, J.D., and Gilliom, R.J., 2010, Trends in pesticide concentrations in urban streams in the United States, 1992–2008: U.S. Geological Survey Scientific Investigations Report 2010–5139, 101 p.
Stone, W.W., 2013, Estimated annual agricultural pesticide use for counties of the conterminous United States, 1992–2009: U.S. Geological Survey Data Series 752, 1–p. pamphlet, 14 tables.
Stone, W.W., Crawford, C.G., and Gilliom, R.J, 2013, Water-shed Regressions for Pesticides (WARP) models for predict-ing stream concentrations of multiple pesticides: Journal of Environmental Quality, v. 42, no. 6, p. 1838–1851, doi:10.2134/jeq2013.05.0179.
Stone, W.W., Gilliom, R.J., and Crawford, C.G., 2008, Water-shed Regressions for Pesticides (WARP) for predicting annual maximum and maximum moving-average concentra-tions of atrazine in streams: U.S. Geological Survey Open-File Report 2008–1186, 19 p.
Sullivan, D.J., Vecchia, A.V., Lorenz, D.L., Gilliom, R.J., and Martin, J.D., 2009, Trends in pesticide concentrations in corn-belt streams, 1996–2006: U.S. Geological Survey Scientific Investigations Report 2009–5132, 75 p.
Toccalino, P.L., Norman, J.E., and Schoephoester, K.M., 2014, Health-based screening levels for evaluating water-quality data: U.S. Geological Survey National Water-Quality Assessment Program, updated June 2014, accessed July 22, 2014, at http://water.usgs.gov/nawqa/HBSL.
U.S. Environmental Protection Agency, 2001, FY2001 con-ventional pesticides registration decisions, accessed Febru-ary 14, 2014, at http://www.epa.gov/opprd001/workplan/regdec2001.pdf.
U.S. Geological Survey, 2010, NASQAN National Stream Quality Accounting Network, 2001–2007 NASQAN design information, accessed September 15, 2011, at http://water.usgs.gov/nasqan/2001_2007_design_info.html.


Appendix 13
Appendix 1.
Table 1–1. Pesticide compounds used in the 1992–2001 and 2002–11 summaries. .......................14
Table 1–2. Stream sites used in the first decade (1992–2001) and second decade (2002–11) summaries......................................................................................................................18

14 An overview comparing results from two decades of monitoring for pesticides in the Nation’s streams and rivers
Table 1–1. Pesticide compounds used in the 1992–2001 and 2002–11 summaries.—Continued
[CASRN, Chemical Abstracts Service Registry Number®;—, not applicable]
Pesticide compound(synonym)
Type of pesticide compound (parent pesticide, if degradate)
CASRN1 Parameter code
1992–2001
2002–11
Acetochlor Herbicide 34256-82-1 49260 Yes Yes
Alachlor Herbicide 15972-60-8 46342 Yes Yes
2,6-Diethylaniline Degradate (Alachlor) 579-66-8 82660 Yes Yes
2-Chloro-2,6-diethylacetanilide Degradate (Alachlor) 6967-29-9 61618 Yes
alpha-Endosulfan Insecticide 959-98-8 34362 Yes
Endosulfan ether Degradate (alpha-Endosulfan) 3369-52-6 61642 Yes
Endosulfan sulfate Degradate (alpha-Endosulfan, beta-Endosulfan)
1031-07-8 61590 Yes
Atrazine Herbicide 1912-24-9 39632 Yes Yes
Deethylatrazine Degradate (Atrazine) 6190-65-4 04040 Yes Yes
Azinphos-methyl (Guthion) Insecticide 86-50-0 82686 Yes Yes
Azinphos-methyl-oxon Degradate (Azinphos-methyl) 961-22-8 61635 Yes
Benfluralin Herbicide 1861-40-1 82673 Yes Yes
2-Amino-N-isopropylbenzamide Degradate (Bentazon) 30391-89-0 61617 Yes
beta-Endosulfan Insecticide 33213-65-9 34357 Yes
Bifenthrin Insecticide 82657-04-3 61580 Yes
Butylate Herbicide 2008-41-5 04028 Yes Yes
Carbaryl Insecticide 63-25-2 82680 Yes Yes
1-Naphthol Degradate (Carbaryl, Napromide) 90-15-3 49295 Yes
Carbofuran Insecticide 1563-66-2 82674 Yes Yes
2,5-Dichloroaniline Degradate (Chloramben) 95-82-9 61614 Yes
Chlorpyrifos Insecticide 2921-88-2 38933 Yes Yes
Chlorpyrifos_oxon Degradate (Chlorpyrifos) 5598-15-2 61636 Yes
cis-Permethrin Insecticide 61949-76-6 82687 Yes Yes
cis-Propiconazole Fungicide 112721-87-6 79846 Yes
Cyanazine Herbicide 21725-46-2 04041 Yes Yes
Cycloate Herbicide 1134-23-2 04031 Yes
Cyfluthrin Insecticide 68359-37-5 61585 Yes
cis-Methyl-3-(2,2-dichlorovinyl)- 2,2-dimethyl-(1-cyclopropane)-carboxylate
Degradate (Cyfluthrin) 59897-93-7 79842 Yes
trans-Methyl-3-(2,2-dichlorovinyl)- 2,2-dimethyl-(1-cyclopropane)-carboxylate
Degradate (Cyfluthrin) 59897-94-8 79843 Yes
Cypermethrin Insecticide 52315-07-8 61586 Yes
Dacthal (DCPA) Herbicide 1861-32-1 82682 Yes Yes
Diazinon Insecticide 333-41-5 39572 Yes Yes
Diazoxon Degradate (Diazinon) 962-58-3 61638 Yes
Dichlorvos Insecticide/Fumigant/Degradate (Naled)
62-73-7 38775 Yes
Dicrotophos Insecticide 141-66-2 38454 Yes

Appendix 15
Table 1–1. Pesticide compounds used in the 1992–2001 and 2002–11 summaries.—Continued
[CASRN, Chemical Abstracts Service Registry Number®;—, not applicable]
Pesticide compound(synonym)
Type of pesticide compound (parent pesticide, if degradate)
CASRN1 Parameter code
1992–2001
2002–11
Dieldrin
Dimethoate
Disulfoton
Disulfoton_sulfone
Disulfoton_sulfoxide
E-Dimethomorph
3,4-Dichloroaniline
EPTC
Ethalfluralin
Ethion
Ethion_monoxon
Ethoprophos (Ethoprop)
O-Ethyl-O-methyl-S-propylphospho-rothioate
Fenamiphos
Fenamiphos_sulfone
Fenamiphos_sulfoxide
Fenthion
Fenthion_sulfoxide
Fipronil
Desulfinylfipronil
Desulfinylfipronil_amide
Fipronil_sulfide
Fipronil_sulfone
Flumetralin
3-(Trifluoromethyl)aniline
Fonofos
gamma-HCH (Lindane)
alpha-HCH
Hexazinone
Iprodione
3,5-Dichloroaniline
Isofenphos
lambda-Cyhalothrin
Linuron
Malathion
Malaoxon
Metalaxyl
4-Chloro-2-methylphenol
Methidathion
Insecticide
Insecticide
Insecticide
Degradate (Disulfoton)
Degradate (Disulfoton)
Fungicide
Degradate (Diuron)
Herbicide
Herbicide
Insecticide
Degradate (Ethion)
Insecticide
Degradate (Ethoprophos)
Nematocide
Degradate (Fenamiphos)
Degradate (Fenamiphos)
Insecticide
Degradate (Fenthion)
Insecticide
Degradate (Fipronil)
Degradate (Fipronil)
Degradate (Fipronil)
Degradate (Fipronil)
Plant_Growth_Regulator
Degradate (Fluometuron)
Insecticide
Insecticide
Degradate (gamma-HCH)
Herbicide
Fungicide
Degradate (Iprodione)
Insecticide
Insecticide
Herbicide
Insecticide
Degradate (Malathion)
Fungicide
Degradate (MCPA)
Insecticide
60-57-1
60-51-5
298-04-4
2497-06-5
2497-07-6
—
95-76-1
759-94-4
55283-68-6
563-12-2
17356-42-2
13194-48-4
76960-87-7
22224-92-6
31972-44-8
31972-43-7
55-38-9
3761-41-9
120068-37-3
—
—
120067-83-6
120068-36-2
62924-70-3
98-16-8
944-22-9
58-89-9
319-84-6
51235-04-2
36734-19-7
626-43-7
25311-71-1
91465-08-6
330-55-2
121-75-5
1634-78-2
57837-19-1
1570-64-5
950-37-8
39381
82662
82677
61640
61641
79844
61625
82668
82663
82346
61644
82672
61660
61591
61645
61646
38801
61647
62166
62170
62169
62167
62168
61592
61630
04095
39341
34253
04025
61593
61627
61594
61595
82666
39532
61652
61596
61633
61598
Yes
Yes
Yes
Yes
Yes
Yes
Yes
Yes
Yes
Yes
Yes
Yes
Yes
Yes
Yes
Yes
Yes
Yes
Yes
Yes
Yes
Yes
Yes
Yes
Yes
Yes
Yes
Yes
Yes
Yes
Yes
Yes
Yes
Yes
Yes
Yes
Yes
Yes
Yes
Yes
Yes
Yes
Yes
Yes
Yes
Yes
Yes
Yes
Yes

16 An overview comparing results from two decades of monitoring for pesticides in the Nation’s streams and rivers
Table 1–1. Pesticide compounds used in the 1992–2001 and 2002–11 summaries.—Continued
[CASRN, Chemical Abstracts Service Registry Number®;—, not applicable]
Pesticide compound(synonym)
Type of pesticide compound (parent pesticide, if degradate)
CASRN1 Parameter code
1992–2001
2002–11
Metolachlor
2-Ethyl-6-methylaniline
MetribuzinMolinate
Myclobutanil
Napropamide
1,4-Napthaquinone
Oxyfluorfen
p,p’-DDE
4,4’-Dichlorobenzophenone
Paraoxon-ethyl
Parathion (Ethyl parathion)
Parathion-methyl (Methyl parathion)
Paraoxon-methyl
Pebulate
Pendimethalin
Phorate
Phorate_oxon
Phosmet
Phosmet_oxon
Profenofos
Prometon
Prometryn
Propachlor
Propanil
Propargite
2-(4-tert-butylphenoxy)-cyclohexanol
Propetamphos
Propyzamide (Pronamide)
Simazine
Sulfotepp
Sulprofos
Tebuconazole
Tebupirimfos
Tebupirimfos_oxon
Tebuthiuron
Tefluthrin
Temephos
Terbacil
Herbicide
Degradate (Metolaclor)
HerbicideHerbicide
Fungicide
Herbicide
Degradate (Napromide)
Herbicide
Degradate (DDT)
Degradate (DDT, Dicofol)
Insecticide/Degradate (Parathion)
Insecticide
Insecticide
Degradate (Methyl parathion)
Herbicide
Herbicide
Insecticide
Degradate (Phorate)
Insecticide
Degradate (Phosmet)
Insecticide
Herbicide
Herbicide
Herbicide
Herbicide
Acaricide
Degradate (Propargite)
Insecticide
Herbicide
Herbicide
Insecticide
Insecticide
Fungicide
Insecticide
Degradate (Tebupirimfos)
Herbicide
Insecticide
Insecticide
Herbicide
51218-45-2
24549-06-2
21087-64-92212-67-1
88671-89-0
15299-99-7
130-15-4
42874-03-3
72-55-9
90-98-2
311-45-5
56-38-2
298-00-0
950-35-6
1114-71-2
40487-42-1
298-02-2
2600-69-3
732-11-6
3735-33-9
41198-08-7
1610-18-0
7287-19-6
1918-16-7
709-98-8
2312-35-8
1942-71-8
31218-83-4
23950-58-5
122-34-9
3689-24-5
35400-43-2
107534-96-3
96182-53-5
—
34014-18-1
79538-32-2
3383-96-8
5902-51-2
39415
61620
8263082671
61599
82684
61611
61600
34653
61631
61663
39542
82667
61664
82669
82683
82664
61666
61601
61668
61603
04037
04036
04024
82679
82685
61637
61604
82676
04035
61605
38716
62852
61602
61669
82670
61606
61607
82665
Yes
YesYes
Yes
Yes
Yes
Yes
Yes
Yes
Yes
Yes
Yes
Yes
Yes
Yes
Yes
Yes
Yes
Yes
Yes
YesYes
Yes
Yes
Yes
Yes
Yes
Yes
Yes
Yes
Yes
Yes
Yes
Yes
Yes
Yes
Yes
Yes
Yes
Yes
Yes
Yes
Yes
Yes
Yes
Yes
Yes
Yes
Yes
Yes
Yes
Yes
Yes
Yes
Yes
Yes
Yes

Appendix 17
Table 1–1. Pesticide compounds used in the 1992–2001 and 2002–11 summaries.—Continued
[CASRN, Chemical Abstracts Service Registry Number®;—, not applicable]
Pesticide compound(synonym)
Type of pesticide compound (parent pesticide, if degradate)
CASRN1 Parameter code
1992–2001
2002–11
Terbufos Insecticide 13071-79-9 82675 Yes Yes
Terbufos_sulfone_oxygen_analog Degradate (Terbufos) 56070-15-6 61674 Yes
Terbuthylazine Herbicide 5915-41-3 04022 Yes
Thiobencarb Herbicide 28249-77-6 82681 Yes Yes4-Chlorobenzylmethyl_sulfone Degradate (Thiobencarb) 98-57-7 61634 Yes
trans-Propiconazole Fungicide 120523-07-1 79847 Yes
Triallate Herbicide 2303-17-5 82678 Yes Yes
Tribuphos Defoliant 78-48-8 61610 Yes
Trifluralin Herbicide 1582-09-8 82661 Yes Yes
Z-Dimethomorph Fungicide — 79845 Yes
1This report contains CAS Registry Numbers®, which is a Registered Trademark of the American Chemical Society. CAS recommends the verification of the CASRNs through CAS Client ServicesSM.

18 An overview comparing results from two decades of monitoring for pesticides in the Nation’s streams and rivers
Table 1–2. Stream sites used in the first decade (1992–2001) and second decade (2002–11) summaries.—Continued
[km2, square kilometer; Cr, Creek; Ri, River; Irr Dist; Irrigation District; No., number; MA, Massachusetts; CT, Connecticut; NY, New York; NJ, New Jersey; PA, Pennsylvania; MD, Maryland; VA, Virginia; WV, West Virginia; DC, District of Columbia; NC, North Carolina; SC, South Carolina; GA, Georgia; FL, Florida; AL, Alabama; OH, Ohio; IN, Indiana; TN, Tennessee; KY, Kentucky; IL, Illinois; WI, Wisconsin; MI, Michigan; MN, Minnesota; ND, North Dakota; IA, Iowa; MT, Montana; WY, Wyoming; CO, Colorado; NE, Nebraska; MO, Missouri; AR, Arkansas; MS, Mississippi; LA, Louisiana; TX, Texas; AZ, Arizona; VT, Vermont; NV, Nevada; CA, California; WA, Washington; ID, Idaho; OR, Oregon]
Site number Site nameWatershed area
(km2)Land use
Number of years
1992–2001
2002–11
01102500 Aberjona River at Winchester, MA 60 Urban 2
01104615 Charles River near Watertown, MA 695 Urban 2
01184000 Connecticut River at Thompsonville, CT 25,000 Mixed 4 3
01209710 Norwalk River at Winnipauk, CT 85 Urban 5 3
01349150 Canajoharie Creek near Canajoharie, NY 155 Agriculture 5 3
01356190 Lisha Kill northwest of Niskayuna, NY 40 Urban 1 3
01357500 Mohawk River at Cohoes, NY 9,110 Mixed 8 2
01403300 Raritan River at Bound Brook, NJ 2,070 Urban 3 6
01403900 Bound Brook at Middlesex, NJ 126 Urban 2 2
01410784 Great Egg Harbor River near Sicklerville, NJ 39 Urban 2
01454700 Lehigh River at Easton, PA 3,520 Mixed 1
01463500 Delaware River at Trenton, NJ 17,600 Mixed 2 2
01464907 Little Neshaminy Creek near Warminster, PA 72 Urban 2 1
01470779 Tulpehocken Creek near Bernville, PA 179 Mixed 2
01472157 French Creek near Phoenixville, PA 152 Mixed 1
01474500 Schuylkill River at Philadelphia, PA 4,900 Mixed 2
01485000 Pocomoke River at Willards, MD 138 Mixed 1
01493112 Chesterville Branch near Crumpton, MD 17 Agriculture 1
01493500 Morgan Creek near Kennedyville, MD 33 Agriculture 3
01555400 East Mahantango Creek at Klingerstown, PA 116 Agriculture 2
01571490 Cedar Run at Eberlys Mill, PA 33 Urban 3
01573095 Bachman Run at Annville, PA 20 Mixed 1
01576540 Mill Creek near Lyndon, PA 141 Mixed 2
01578310 Susquehanna River at Conowingo, MD 70,100 Mixed 2 6
01621050 Muddy Creek at Mount Clinton, VA 37 Agriculture 2 3
01636500 Shenandoah River at Millville, WV 7,880 Mixed 1
01639000 Monocacy River at Bridgeport, MD 449 Mixed 1
01646580 Potomac River at Washington, DC 30,000 Mixed 4 7
01654000 Accotink Creek near Annandale, VA 61 Urban 2 4
02082731 Devils Cradle Creek near Alert, NC 35 Mixed 1
02083500 Tar River at Tarboro, NC 5,750 Mixed 1
02083833 Pete Mitchell Swamp near Penny Hill, NC 45 Agriculture 1
02084160 Chicod Cr near Simpson, NC 109 Mixed 1 1
02084558 Albemarle Canal near Swindell, NC 191 Agriculture 1
02087580 Swift Creek near Apex, NC 54 Urban 5
02089500 Neuse River at Kinston, NC 7,020 Mixed 4 7

Appendix 19
Table 1–2. Stream sites used in the first decade (1992–2001) and second decade (2002–11) summaries.—Continued
[km2, square kilometer; Cr, Creek; Ri, River; Irr Dist; Irrigation District; No., number; MA, Massachusetts; CT, Connecticut; NY, New York; NJ, New Jersey; PA, Pennsylvania; MD, Maryland; VA, Virginia; WV, West Virginia; DC, District of Columbia; NC, North Carolina; SC, South Carolina; GA, Georgia; FL, Florida; AL, Alabama; OH, Ohio; IN, Indiana; TN, Tennessee; KY, Kentucky; IL, Illinois; WI, Wisconsin; MI, Michigan; MN, Minnesota; ND, North Dakota; IA, Iowa; MT, Montana; WY, Wyoming; CO, Colorado; NE, Nebraska; MO, Missouri; AR, Arkansas; MS, Mississippi; LA, Louisiana; TX, Texas; AZ, Arizona; VT, Vermont; NV, Nevada; CA, California; WA, Washington; ID, Idaho; OR, Oregon]
Site number Site nameWatershed area
(km2)Land use
Number of years
1992–2002–11
2001
02091500
02169570
02174250
02175000
02215100
02226160
02281200
02289034
02306774
02317797
02318500
02326838
02335870
02336300
02338000
02350080
02356980
02359170
02424000
02429500
02444490
02469762
02470500
03049625
03049646
03167000
03176500
03201300
03267900
03274000
03303280
03353637
03357330
03360895
03374100
03378500
Contentnea Creek at Hookerton, NC
Gills Creek at Columbia, SC
Cow Castle Creek near Bowman, SC
Edisto River near Givhans, SC
Tucsawhatchee Creek near Hawkinsville, GA
Altamaha River near Everett City, GA
Hillsboro Canal near Shawano, FL
U.S. Sugar Outflow Canal near Clewiston, FL
Rocky Creek near Citrus Park, FL
Little River near Tifton, GA
Withlacoochee River near Quitman, GA
Lafayette Creek near Tallahassee, FL
Sope Creek near Marietta, GA
Peachtree Creek at Atlanta, GA
Chattahoochee River near Whitesburg, GA
Lime Creek near Cobb, GA
Aycocks Creek near Boykin, GA
Apalachicola River near Sumatra, FL
Cahaba River at Centreville, AL
Alabama River at Claiborne, AL
Bogue Chitto near Memphis, AL
Tombigbee River near Coffeeville, AL
Mobile River at Mt. Vernon, AL
Allegheny River at New Kensington, PA
Deer Creek near Dorseyville, PA
Reed Creek at Grahams Forge, VA
New River at Glen Lyn, VA
Kanawha River at Winfield, WV
Mad River near Eagle City, OH
Great Miami River at Hamilton, OH
Ohio River at Cannelton Dam at Cannelton, IN
Little Buck Creek near Indianapolis, IN
Big Walnut Creek near Roachdale, IN
Kessinger Ditch near Monroe City, IN
White River at Hazleton, IN
Wabash River at New Harmony, IN
1,910
154
62
7,080
420
36,100
806
73
46
335
3,860
25
80
222
6,250
162
271
49,800
2660
56,900
136
47,800
111,400
29,700
70
669
9,780
30,600
802
9,400
251,200
45
339
146
29,300
75,700
Agriculture
Urban
Mixed
Mixed
Mixed
Mixed
Agriculture
Agriculture
Urban
Mixed
Mixed
Urban
Urban
Urban
Urban
Mixed
Mixed
Mixed
Mixed
Mixed
Agriculture
Mixed
Mixed
Mixed
Urban
Mixed
Mixed
Mixed
Agriculture
Mixed
Mixed
Urban
Agriculture
Agriculture
Mixed
Agriculture
3
1
2
4
1
3
1
1
3
2
2
1
3
2
1
2
1
1
1
1
1
1
1
3
2
6
3
1
10
5
3
2
2
3
4
1
2
1
3
4
7
4
1
1
3
1
4
3
10
2
2
7
10

20 An overview comparing results from two decades of monitoring for pesticides in the Nation’s streams and rivers
Table 1–2. Stream sites used in the first decade (1992–2001) and second decade (2002–11) summaries.—Continued
[km2, square kilometer; Cr, Creek; Ri, River; Irr Dist; Irrigation District; No., number; MA, Massachusetts; CT, Connecticut; NY, New York; NJ, New Jersey; PA, Pennsylvania; MD, Maryland; VA, Virginia; WV, West Virginia; DC, District of Columbia; NC, North Carolina; SC, South Carolina; GA, Georgia; FL, Florida; AL, Alabama; OH, Ohio; IN, Indiana; TN, Tennessee; KY, Kentucky; IL, Illinois; WI, Wisconsin; MI, Michigan; MN, Minnesota; ND, North Dakota; IA, Iowa; MT, Montana; WY, Wyoming; CO, Colorado; NE, Nebraska; MO, Missouri; AR, Arkansas; MS, Mississippi; LA, Louisiana; TX, Texas; AZ, Arizona; VT, Vermont; NV, Nevada; CA, California; WA, Washington; ID, Idaho; OR, Oregon]
Number of yearsWatershed area Site number Site name Land use
(km2) 1992–2002–11
2001
03455000 French Broad River near Newport, TN 4,800 Mixed 1
03466208 Big Limestone Creek near Limestone, TN 205 Agriculture 2 1
03467609 Nolichucky River near Lowland, TN 4,370 Mixed 2 1
03526000 Copper Creek near Gate City, VA 277 Mixed 1
03528000 Clinch River above Tazewell, TN 3,820 Mixed 1
03575100 Flint River near Brownsboro, AL 969 Agriculture 3 2
03609750 Tennessee River at Highway 60 near Paducah, 104,500 Mixed 5 4KY
03612500 Ohio River at Dam 53 near Grand Chain, IL 526,000 Mixed 6 10
04072050 Duck Creek near Howard, WI 247 Agriculture 3 3
04087000 Milwaukee River at Milwaukee, WI 1,810 Mixed 3 2
04159492 Black River near Jeddo, MI 1,200 Agriculture 1
04161820 Clinton River at Sterling Heights, MI 803 Urban 1 2
04175600 River Raisin near Manchester, MI 331 Mixed 1
04178000 St. Joseph River near Newville, IN 1,600 Agriculture 2
04183000 Maumee River at New Haven, IN 5,040 Mixed 1
04186500 Auglaize River near Fort Jennings, OH 858 Agriculture 1 2
04193500 Maumee River at Waterville, OH 16,400 Mixed 5 3
04208504 Cuyahoga River at Cleveland, OH 2,040 Urban 1
04211820 Grand Ri at Harpersfield, OH 1,430 Mixed 1
04213500 Cattaraugus Creek at Gowanda, NY 1,130 Mixed 1
05062500 Wild Rice River at Twin Valley, MN 2,410 Mixed 1
05082625 Turtle River near Arvilla, ND 658 Agriculture 1
05085900 Snake River above Alvarado, MN 566 Agriculture 1
05102490 Red River of the North at Pembina, ND 92,100 Agriculture 5
05288705 Shingle Creek at Minneapolis, MN 73 Urban 1 3
05320270 Little Cobb River near Beauford, MN 336 Agriculture 1 2
05330000 Minnesota River near Jordan, MN 42,000 Agriculture 2
05330902 Nine Mile Creek at Bloomington, MN 116 Urban 1
05331580 Mississippi River at Hastings, MN 96,000 Agriculture 5 3
05420500 Mississippi River at Clinton, IA 221,700 Mixed 6 10
05420680 Wapsipinicon River near Tripoli, IA 897 Agriculture 1
05449500 Iowa River near Rowan, IA 1,080 Agriculture 2
05451210 South Fork Iowa River near New Providence, IA 581 Agriculture 2 5
05455570 English River at Riverside, IA 1,620 Agriculture 1
05464220 Wolf Creek near Dysart, IA 775 Agriculture 2
05465500 Iowa River at Wapello, IA 32,400 Agriculture 5 3

Appendix 21
Table 1–2. Stream sites used in the first decade (1992–2001) and second decade (2002–11) summaries.—Continued
[km2, square kilometer; Cr, Creek; Ri, River; Irr Dist; Irrigation District; No., number; MA, Massachusetts; CT, Connecticut; NY, New York; NJ, New Jersey; PA, Pennsylvania; MD, Maryland; VA, Virginia; WV, West Virginia; DC, District of Columbia; NC, North Carolina; SC, South Carolina; GA, Georgia; FL, Florida; AL, Alabama; OH, Ohio; IN, Indiana; TN, Tennessee; KY, Kentucky; IL, Illinois; WI, Wisconsin; MI, Michigan; MN, Minnesota; ND, North Dakota; IA, Iowa; MT, Montana; WY, Wyoming; CO, Colorado; NE, Nebraska; MO, Missouri; AR, Arkansas; MS, Mississippi; LA, Louisiana; TX, Texas; AZ, Arizona; VT, Vermont; NV, Nevada; CA, California; WA, Washington; ID, Idaho; OR, Oregon]
Site number Site nameWatershed area
(km2)Land use
Number of years
1992–2002–11
2001
05490500
05525500
05531500
05532500
05553500
05572000
05584500
05586100
05587455
06208500
06279500
06295000
06329500
06713500
06714000
06753990
06754000
06795500
06800000
06800500
06805500
06923150
06934500
07022000
07031692
07043500
07053250
07263620
07288650
07288955
07369500
07373420
07374000
07374525
07375050
07379960
Des Moines River at Keosauqua, IA
Sugar Creek at Milford, IL
Salt Creek at Western Springs, IL
Des Plaines River at Riverside, IL
Illinois River at Ottawa, IL
Sangamon River at Monticello, IL
La Moine River at Colmar, IL
Illinois River at Valley City, IL
Mississippi River Below Grafton, IL
Clarks Fork Yellowstone River near Edgar, MT
Bighorn River at Kane, WY
Yellowstone River at Forsyth, MT
Yellowstone River near Sidney, MT
Cherry Creek at Denver, CO
South Platte River at Denver, CO
Lonetree Creek near Greeley, CO
South Platte River near Kersey, CO
Shell Creek near Columbus, NE
Maple Creek near Nickerson, NE
Elkhorn River at Waterloo, NE
Platte River at Louisville, NE
Dousinbury Creek near Wall Street, MO
Missouri River at Hermann, MO
Mississippi River at Thebes, IL
Fletcher Creek at Memphis, TN
Little River Ditch No 1 near Morehouse, MO
Yocum Creek near Oak Grove, AR
Arkansas River at David D Terry Lock and Dam below Little Rock, AR
Bogue Phalia near Leland, MS
Yazoo River near Long Lake, MS
Tensas River at Tendal, LA
Mississippi River near St. Francisville, LA
Mississippi River at Baton Rouge, LA
Mississippi River at Belle Chasse, LA
Tchefuncte River near Covington, LA
Dawson Creek at Baton Rouge, LA
36,400
1,160
291
1,630
28,300
1,430
1,700
69,200
443,700
5,240
40,800
102,000
177,000
1,060
10,000
1,480
25,000
762
955
18,000
221,000
106
1,353,000
1,847,000
79
1,140
134
401,000
1,300
34,800
721
2,915,000
2,926,000
2,727,000
366
39
Agriculture
Agriculture
Urban
Urban
Mixed
Agriculture
Agriculture
Mixed
Agriculture
Mixed
Mixed
Mixed
Mixed
Urban
Urban
Agriculture
Mixed
Agriculture
Agriculture
Agriculture
Mixed
Mixed
Mixed
Mixed
Urban
Agriculture
Agriculture
Mixed
Agriculture
Mixed
Agriculture
Mixed
Mixed
Mixed
Mixed
Urban
2
1
1
3
2
2
5
5
1
1
3
5
2
4
2
5
5
7
1
6
6
1
2
1
6
3
6
4
6
2
2
2
1
2
6
7
3
4
5
1
3
1
5
4
8
8
8
1
9
3
10
10
7
5
1
1

22 An overview comparing results from two decades of monitoring for pesticides in the Nation’s streams and rivers
Table 1–2. Stream sites used in the first decade (1992–2001) and second decade (2002–11) summaries.—Continued
[km2, square kilometer; Cr, Creek; Ri, River; Irr Dist; Irrigation District; No., number; MA, Massachusetts; CT, Connecticut; NY, New York; NJ, New Jersey; PA, Pennsylvania; MD, Maryland; VA, Virginia; WV, West Virginia; DC, District of Columbia; NC, North Carolina; SC, South Carolina; GA, Georgia; FL, Florida; AL, Alabama; OH, Ohio; IN, Indiana; TN, Tennessee; KY, Kentucky; IL, Illinois; WI, Wisconsin; MI, Michigan; MN, Minnesota; ND, North Dakota; IA, Iowa; MT, Montana; WY, Wyoming; CO, Colorado; NE, Nebraska; MO, Missouri; AR, Arkansas; MS, Mississippi; LA, Louisiana; TX, Texas; AZ, Arizona; VT, Vermont; NV, Nevada; CA, California; WA, Washington; ID, Idaho; OR, Oregon]
Site number Site nameWatershed area
(km2)Land use
Number of years
1992–2002–11
2001
07381440
07381495
07381590
07381600
08010000
08012150
08012470
08049240
08051500
08057200
08057410
08064100
08116650
08178800
08180640
08181800
08364000
09153290
09481740
09514000
09517000
10102200
10168000
10171000
10350500
11060400
11074000
11075610
11261100
11262900
11273500
11274538
11274560
11274570
11303500
11390890
Bayou Grosse Tete at Rosedale, LA
Atchafalaya River at Melville, LA
Wax Lake Outlet at Calumet, LA
Lower Atchafalaya River at Morgan City, LA
Bayou Des Cannes near Eunice, LA
Mermentau River at Mermentau, LA
Bayou Lacassine near Hayes, LA
Rush Creek at Arlington, TX
Clear Creek near Sanger, TX
White Rock Creek at Dallas, TX
Trinity River below Dallas, TX
Chambers Creek near Rice, TX
Brazos River near Rosharon, TX
Salado Creek at San Antonio, TX
Medina River at La Coste, TX
San Antonio River near Elmendorf, TX
Rio Grande at El Paso, TX
Reed Wash near Mack, CO
Santa Cruz River at Tubac, AZ
Buckeye Canal near Avondale, AZ
Hassayampa River near Arlington, AZ
Cub River near Richmond, UT
Little Cottonwood Creek at Salt Lake City, UT
Jordan River at Salt Lake City, UT
Truckee River at Clark, NV
Warm Creek near San Bernardino, CA
Santa Ana River below Prado Dam, CA
Santa Ana River near Anaheim, CA
Salt Slough near Stevinson, CA
Mud Slough near Gustine, CA
Merced River near Newman, CA
Orestimba Creek near Crows Landing, CA
Turlock Irr Dist Lateral No. 5 near Patterson, CA
San Joaquin River near Patterson, CA
San Joaquin River near Vernalis, CA
Colusa Basin Drain near Knights Landing, CA
305
241,700
5,600
245,100
369
3,580
767
74
763
173
16,200
2,140
117,400
506
2,100
4,530
77,600
36
3,120
117,000
3,970
577
117
9,100
4,310
31
3,730
3,870
1,270
1,270
3,620
28
218
9,800
19,200
4,260
Agriculture
Mixed
Mixed
Mixed
Mixed
Agriculture
Agriculture
Urban
Mixed
Urban
Mixed
Mixed
Mixed
Urban
Mixed
Urban
Mixed
Mixed
Urban
Mixed
Mixed
Agriculture
Urban
Mixed
Mixed
Urban
Urban
Urban
Agriculture
Agriculture
Agriculture
Agriculture
Mixed
Mixed
Mixed
Agriculture
1
6
1
2
3
1
2
5
1
1
1
2
5
1
2
1
2
2
3
4
2
2
2
1
6
5
1
1
8
1
10
5
5
2
1
5
7
2
2
2
9
1
1
1
2
5
3
3
7

Appendix 23
Table 1–2. Stream sites used in the first decade (1992–2001) and second decade (2002–11) summaries.—Continued
[km2, square kilometer; Cr, Creek; Ri, River; Irr Dist; Irrigation District; No., number; MA, Massachusetts; CT, Connecticut; NY, New York; NJ, New Jersey; PA, Pennsylvania; MD, Maryland; VA, Virginia; WV, West Virginia; DC, District of Columbia; NC, North Carolina; SC, South Carolina; GA, Georgia; FL, Florida; AL, Alabama; OH, Ohio; IN, Indiana; TN, Tennessee; KY, Kentucky; IL, Illinois; WI, Wisconsin; MI, Michigan; MN, Minnesota; ND, North Dakota; IA, Iowa; MT, Montana; WY, Wyoming; CO, Colorado; NE, Nebraska; MO, Missouri; AR, Arkansas; MS, Mississippi; LA, Louisiana; TX, Texas; AZ, Arizona; VT, Vermont; NV, Nevada; CA, California; WA, Washington; ID, Idaho; OR, Oregon]
Site number Site nameWatershed area
(km2)Land use
Number of years
1992–2002–11
2001
11447360
11447650
12113390
12128000
12212100
12424500
12464770
12471400
12472380
12473740
12500420
12505450
12510500
13055000
13092747
13154500
13351000
14201300
14202000
14206950
14211720
040863075
040869415
073814675
094196783
0242354750
0357479650
252414080333200
322023090544500
393944084120700
394340085524601
Arcade Creek near Del Paso Heights, CA
Sacramento River at Freeport, CA
Duwamish River at Tukwila, WA
Thornton Creek near Seattle, WA
Fishtrap Creek at Lynden, WA
Spokane River near Spokane, WA
Crab Creek near Ritzville, WA
Lind Coulee Wasteway near Warden, WA
Crab Creek Lateral near Othello, WA
El 68 D Wasteway near Othello, WA
Moxee Drain near Union Gap, WA
Granger Drain at Granger, WA
Yakima River at Kiona, WA
Teton River near St Anthony, ID
Rock Creek at Twin Falls, ID
Snake River at King Hill, ID
Palouse River at Hooper, WA
Zollner Creek near Mt. Angel, OR
Pudding River at Aurora, OR
Fanno Creek at Durham, OR
Willamette River at Portland, OR
North Branch Milwaukee River near Random Lake, WI
Lincoln Creek at Milwaukee, WI
Bayou Boeuf at Amelia, LA
Las Vegas Wash near Las Vegas, NV
Cahaba Valley Creek at Pelham, AL
Hester Creek near Plevna, AL
C-111 Canal near Homestead, FL
Mississippi River above Vicksburg, MS
Holes Creek at Kettering, OH
Sugar Creek at New Palestine, IN
82
61,700
1,190
29
99
13,000
1,190
1,820
146
377
353
160
14,500
2,290
623
92,900
6,380
39
1,260
81
28,900
130
26
3,170
2,650
66
76
132
2,929,500
52
246
Urban
Mixed
Urban
Urban
Mixed
Urban
Agriculture
Agriculture
Agriculture
Agriculture
Mixed
Agriculture
Mixed
Mixed
Agriculture
Mixed
Agriculture
Agriculture
Agriculture
Urban
Mixed
Agriculture
Urban
Mixed
Urban
Urban
Agriculture
Mixed
Mixed
Urban
Agriculture
1
5
5
2
1
1
3
1
1
1
1
1
1
5
5
8
1
6
1
1
5
2
2
1
2
7
2
10
3
1
4
3
1
2
6
2
3
5
9
5
5
3
1
1
2
5


Stone and others—A
n Overview
Comparing Results from
Two D
ecades of Monitoring for Pesticides in the N
ation’s Streams and Rivers—
Scientific Investigations Report 2014–5154ISSN 2328-0328 (online)http://dx.doi.org/10.3133/sir20145154
Related Documents