Qadir, Hajra, Khalid, Osman, Khan, Muhammad Usman Shahid, Khan, Atta ur Rehman and Nawaz, Raheel (2018) An Optimal Ride Sharing Recommen- dation Framework for Carpooling Services. IEEE Access. ISSN 2169-3536 Downloaded from: Version: Accepted Version Publisher: Institute of Electrical and Electronics Engineers (IEEE) DOI: https://doi.org/10.1109/ACCESS.2018.2876595 Please cite the published version

Welcome message from author
This document is posted to help you gain knowledge. Please leave a comment to let me know what you think about it! Share it to your friends and learn new things together.
Transcript
Qadir, Hajra, Khalid, Osman, Khan, Muhammad Usman Shahid, Khan, Attaur Rehman and Nawaz, Raheel (2018) An Optimal Ride Sharing Recommen-dation Framework for Carpooling Services. IEEE Access. ISSN 2169-3536
Downloaded from: https://e-space.mmu.ac.uk/621683/
Version: Accepted Version
Publisher: Institute of Electrical and Electronics Engineers (IEEE)
DOI: https://doi.org/10.1109/ACCESS.2018.2876595
Please cite the published version
https://e-space.mmu.ac.uk
An Optimal Ride Sharing Recommendation Framework for Carpooling Services
Hajra Qadir1, Osman Khalid1, Muhammad U. S. Khan1, Member, IEEE, Atta ur Rehman2 Khan, and Raheel Nawaz3 1Department of Computer Science, COMSATS Institute of Information Technology, Pakistan 2Faculty of Computing and Information Technology, Sohar University, Oman 3Manchester Metropolitan University, UK
Corresponding author: Osman Khalid (e-mail: [email protected]).
ABSTRACT Carpooling services allow drivers to share rides with other passengers. This helps in reducing the
passengers’ fares and time, as well as traffic congestion and increases the income for drivers. In recent years,
several carpooling based recommendation systems have been proposed. However, most of the existing systems
do no effectively balance the conflicting objectives of drivers and passengers. We propose a Highest Aggregated
Score Vehicular Recommendation (HASVR) framework that recommends a vehicle with highest aggregated
score to the requesting passenger. The aggregated score is based on parameters, namely: (a) average time
delay, (b) vehicle’s capacity, (c) fare reduction, (d) driving distance, and (e) profit increment. We propose a
heuristic that balances the incentives of both drivers and passengers keeping in consideration their constraints
and the real-time traffic conditions. We evaluated HASVR with a real-world dataset that contains GPS trace
data of 61,136 taxicabs. Evaluation results confirm the effectiveness of HASVR compared
to existing scheme in reducing the total mileage used to deliver all passengers, reducing the passengers’ fare,
increasing the profit of drivers, and increasing the percentage of satisfied ride requests.
INDEX TERMS Transportation System, Vehicular Recommendation, Information Filtering,
I. INTRODUCTION
With the continuous manufacturing of vehicles, the traffic congestion and air pollution have become two of the major challenges in urban cities of the world. According to a survey conducted in New York City, approximately 13000 taxis consume around 32 million gallons of gas per year with an average rate of 25 miles per gallon (MPG) [1]. This results in excessive amount of gas consumption every year, more than the annual gas utilization in smaller countries e.g., Central African Republic. Usually in urban cities passengers have to wait for a long time for taxicabs to become available. Passengers have to wait more than 30 minutes on average for a taxicab and average fare is more than 6 times of a public transport fare in urban cities [2].
The above mentioned issues have gained much research
interest in the recent years leading to an emerging solution of
carpooling services. Carpooling refers to a service where
multiple passengers with similar schedules and
itineraries
share ride. The shared use of a vehicle by more than one
passenger reduces the number of vehicles on roads, resulting
in reduced fuel consumption, traffic congestion, and pollution.
Carpooling improves vehicles’ availability during rush hours
or bad weather conditions, resulting in reduced waiting time
for passengers.
The total fare is shared among all the passengers
participating in a carpool. This reduces the fare for each
individual passenger. The combined carpool fare is higher
than the regular taxicab fare, resulting in increased profit for
drivers [3]. Recently, the companies like Uber and Careem
have also launched carpooling in recent years [4] [5]. The
Uber’s carpooling service is “Uber Pool” [4] whereas the
Careem has launched a service named “Careem Sawa” [5] to
allow passengers to share their rides. Carpooling has become
a popular vehicular service that represents 10% of all commute
trips in United States in 2009 [6].
Although carpooling service has solved the problems of
passengers and drivers, yet at the same time it has also slightly
increased the travel time and inconvenience of passengers.
Currently, there are many important challenges in the
implementation and adoption of carpooling services. There are
three primary stakeholders involved in a dynamic carpooling
system, namely: (a) existing passengers, (b) requesting (new)
passengers, and (c) drivers. Considering objectives of existing
passengers while recommending a carpooling vehicle to a new
passenger is an important issue that needs to be addressed by
the existing carpooling services. Moreover, striking a balance
between multiple incentives of all parties involved in
carpooling while recommending a vehicle is a major challenge
faced by most of the existing dynamic carpooling systems.
This is because, the attempt to reduce the fare of passengers
also decreases the profit of the drivers. Alternatively, if the
objective is to increase profit of drivers, then passengers will
have to pay more, as well as may get time penalty. The
techniques to schedule the ride requests at real-time need to be
improved in a way that can minimize the travel time of each
individual passenger due to carpooling. A significant amount of research work is being carried out
to minimize the inconvenience of an individual passenger due
to carpooling [7]. Call Cab [8] recommended taxicab on the
basis of single passenger’s objective; taxicab with minimum
passenger’s detour ratio without considering travel time and
taxicab capacity constraints. Moreover, the aforementioned
system did not consider the objectives of existing passengers.
Real-time City-Scale Taxi Ridesharing [9] is able to handle
real-time ride requests but it performs simple scheduling. The
aforementioned system served each new ride request by
dispatching a taxicab that satisfies it with minimum increase
in taxi’s scheduled travel distance. It did not consider Quality
of Service (QoS) i.e., travel time and inconvenience of
passengers in the chosen taxi while scheduling. Although the
authors in [9] considered the objectives of existing passengers
e.g., time and fare, yet at the time of selecting the taxi that can satisfy new ride request, the proposed algorithm selects the one with minimum increase in taxi’s scheduled travel distance. Moreover, the system computed recommendations on the basis of driver’s objective only. The monetary constraints proposed in [9] exhibit limitations in terms of fare reduction computation of existing and new passenger(s). The new passenger is compensated by a fixed amount in fare regardless of the increase in travel time. coRide [10] handled static ride requests in which both passengers and taxicabs are at the same pick up location. Although algorithms proposed by coRide [10] maintain balance between incentives of drivers and passengers, they are not able to handle dynamic (real-time) ride requests. Cloud-based public vehicle system [11] proposed multi-hop ridesharing system, in which a passenger can transfer between different vehicles and may be served by multiple vehicles. The algorithms proposed for the transfer problem in [11] calculate a transfer point for each ride request that can most reduce the traveling distance of vehicle. Thus,
benefit of only drivers is taken into account while computing
transfer points of passengers.
All of the above mentioned systems consider either the
objectives of drivers or passengers while computing vehicle
recommendations. To address the above mentioned
challenges, we propose a dynamic and unified carpooling
system that provides vehicle recommendations to real-time
ride requests. The recommended vehicle in the proposed
system can be occupied or vacant. We propose a heuristic
based vehicle recommendation framework, HASVR, which
considers multiple objectives of drivers and passengers
rather than a single objective while generating vehicle
recommendations. We summarize the contribution of this
paper as follows:
A recommendation frameworks is presented that
combines multiple parameters of both drivers and
passengers while computing recommendations. The
parameters of passengers are (a) average time delay,
(b) vehicle’s capacity, and (c) fare reduction. The
drivers’ parameters are: (a) profit increment and (b)
driving distance. The vehicle recommended by our
proposed framework is an overall preferred vehicle
that takes into account the objective of each party
participating in dynamic carpooling i.e., existing
passengers, new passenger, and driver.
A heuristic based scheduling algorithm; variant of
nearest neighbor (NN) algorithm [12] is used to
schedule the ride requests.
A policy is used to reduce fare of each passenger,
whether existing or new. The fare of each passenger
reduces in proportion to increase in travel distance.
The extra charges to pick up a new passenger are
included in the regular fare of new passenger to
benefit drivers. Our recommendation framework
improves the dynamic carpooling by maintaining
balance among the incentives of all parties involved in
carpooling.
The experiments are conducted with real-world
dataset from T-Drive trajectory data sample [13] and
the results show effectiveness of HASVR as compared
to vacant taxicab service.
The remainder of this paper is organized as follows. Section
2 reviews the related work The system architecture is
described in Section 3. In Section 4, we present our proposed
model for vehicle recommendation. Section 5 evaluates our
system with a large-scale dataset. Finally, the conclusions
and future work are reported in the last Section 6.
II. LITERATURE REVIEW
The problem of providing taxicab recommendations has
attracted the attention of many researchers over the last
decades. Recommender systems in taxicab industry play a
significant role in helping passengers and drivers in a variety
of ways. Yuan et al. [14] determined fast driving directions
that are learned from the historical (GPS) trajectories of taxis.
The proposed approach provided a taxi’s driver with fastest
route to a given destination at a given travel start time. Zhang
et al. [15] proposed a system for taxicab drivers that finds
optimal routes to pick up passengers with an objective to
reduce drivers’ cruising miles. The aforementioned systems
were proposed only for non-sharing taxicabs in which capacity
of taxicabs is usually not fully utilized. In addition, these
systems considered the objectives of only drivers while our
system considers the perspectives of both passengers and
drivers.
Zhang et al. [16] introduced a novel parameter called detour
ratio, which is defined as the ratio of a passenger’s detour
distance (extra distance due to carpooling) and the distance of
the passenger’s direct route. The proposed system
recommends either a vacant taxicab with zero detour ratio or
an occupied taxicab with minimum detour ratio. Moreover, the
detour ratio is calculated at real-time. Zhang et al. [8] extended
the earlier work [16] by adding price mechanism. The
proposed mechanism reduces fare of an individual passenger
and increases profit of drivers at the same time. However, the
proposed pricing model did not compensate the travel time
delay of a passenger in the form of fare reduction. Orey et al.
[17] proposed a distributed and dynamic taxi-sharing algorithm enhanced by wireless communications and distributed computing capabilities to perform coordination between customers’ requests.
Setzke et al. [18] proposed and evaluated a dynamic
ridesharing matching algorithm for crowd sourced delivery
platforms that assigns items to potential drivers. The
aforementioned algorithm automates and optimizes the
assignment of transportation requests to drivers by matching
them on the basis of transportation routes and time constraints.
Cao et al. [19] proposed an efficient and scalable ridesharing
service that allows riders to provide the maximum price they
can pay for the service and the maximum time they can pay
before being picked up. The aforementioned technique
employs a cost model that estimates the cost of the ride sharing
service for each driver. The proposed technique identifies
those drivers that can satisfy the rider request within its cost
limits and temporal constraints on the basis of cost model.
Agatz et al. [20] proposed a dynamic carpooling technique
that considers matching drivers and riders on a short notice.
The paper proposed optimization-based approaches with an
objective to minimize the total system- wide vehicle miles
incurred by system users, and their individual travel costs.
Ma et al. [3] proposed a system that takes real-time ride
requests as an input and generates ridesharing schedules.
These schedules reduce total travel distance of taxis. Shuo Ma
et al. [9] extended the earlier work [3]. The proposed
ridesharing system [9] introduced the mechanism of taking the
agreement of existing passengers before generating a
ridesharing schedule. The aforementioned technique added
monetary constraints in the scheduling algorithm. However,
the scheduling algorithm in the aforementioned systems do
not
consider the increase in travel time of existing passengers
while scheduling a new ride request.
Ming Zhu et al. [11] proposed a cloud-based public vehicle
system where passengers can transfer among public vehicles
according to the scheduling decisions made using cloud
computing. The aim of aforementioned approach is to reduce
the travel distance of all public vehicles with service assurance
for passengers e.g., transfer time and detour ratio. Although
the proposed approach improves the ride availability but lacks
pricing mechanism i.e., how to charge passengers when they
are transferred among vehicles. Desheng Zhang et al. [10]
calculated cost-efficient carpool routes for taxicab drivers in
response to delivery requests of passengers. This reduces the
total mileage of taxicabs. The proposed approach provides the
concept of delivery graph, which indicates the schedule of a
carpool route to deliver passengers. The pricing model
compensates increase in travel time in the form of fare
reduction for the individual passenger. However, the proposed
algorithm [10] can only handle the static ride requests in which
both passengers and taxicabs are present at the same pick-up
location. Moreover, the proposed technique is not able to
handle the new requests (requests that arrive 0.25 or 1 hour
before the delivery start time) efficiently.
Moreover, the carpooling services [8], [9] consider either the
objectives of passengers or drivers while finding an optimal
vehicle to serve the requesting passenger. In addition, these
carpooling systems do not consider the objectives of existing
passengers while computing vehicle recommendations.
Huang et al. [21] proposed a branch and bound algorithm,
a mixed-integer-programing algorithm, and an optimized
kinetic tree algorithm to dynamically match real-time ride
requests to servers vehicles) in a road network to allow
ridesharing. The goal of before mentioned approach is to
schedule requests in real-time and minimize the servers’ travel
times i.e., objective of only drivers is considered.
Asghari et al. [22] proposed a fair pricing model with an
objective to satisfy both the constraints of drivers and riders
simultaneously. The aforementioned model is an auction-
based framework where each driver automatically bids on
every nearby request by considering a number of parameters
such as both the driver’s and the riders’ profiles, their
destinations, the pricing model, and the current number of
riders in the vehicle. The server determines the driver that
generates highest profit and assigns the rider to that driver.
However, the proposed model considers only objectives of
only drivers and platform owner while assigning the request
to a driver.
To address these limitation, our proposed heuristics based
recommendation framework, HASVR, presents a solution for
maintaining a balance among the objectives of all the parties
involved in carpooling systems while finding an optimal
vehicle to serve the new request.
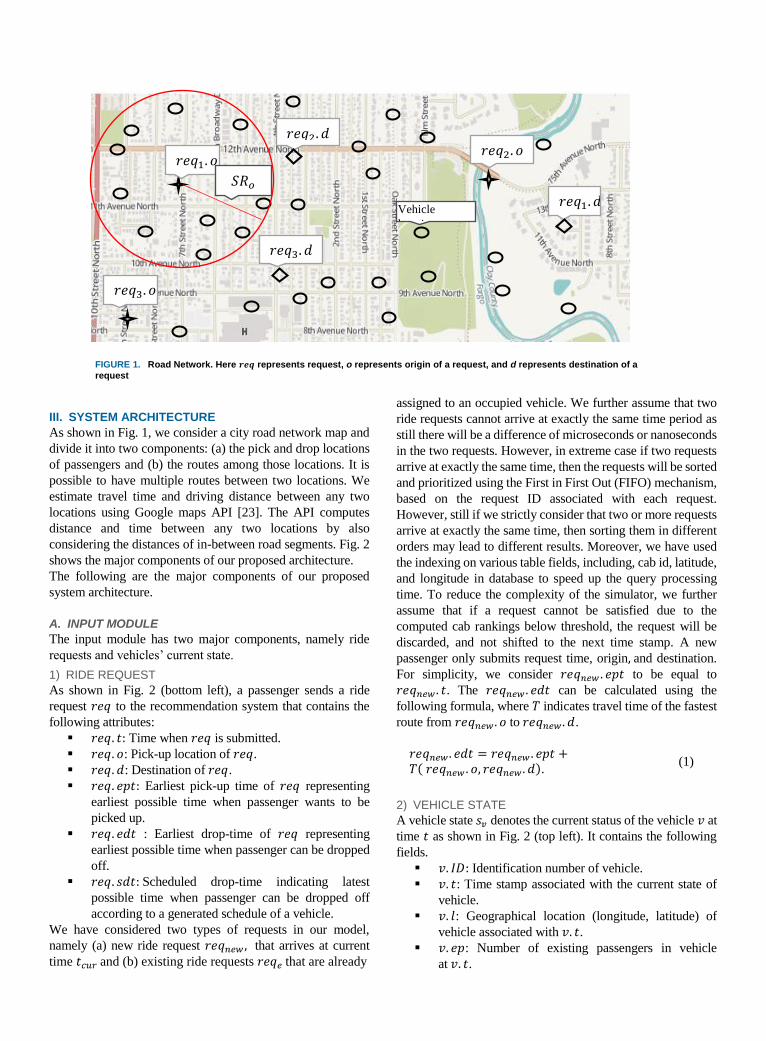
III. SYSTEM ARCHITECTURE
As shown in Fig. 1, we consider a city road network map and
divide it into two components: (a) the pick and drop locations
of passengers and (b) the routes among those locations. It is
possible to have multiple routes between two locations. We
estimate travel time and driving distance between any two
locations using Google maps API [23]. The API computes
distance and time between any two locations by also
considering the distances of in-between road segments. Fig. 2
shows the major components of our proposed architecture.
The following are the major components of our proposed
system architecture.
A. INPUT MODULE
The input module has two major components, namely ride
requests and vehicles’ current state.
1) RIDE REQUEST
As shown in Fig. 2 (bottom left), a passenger sends a ride
request 𝑟𝑒𝑞 to the recommendation system that contains the
following attributes:
𝑟𝑒𝑞. 𝑡: Time when 𝑟𝑒𝑞 is submitted.
𝑟𝑒𝑞. 𝑜: Pick-up location of 𝑟𝑒𝑞.
𝑟𝑒𝑞. 𝑑: Destination of 𝑟𝑒𝑞.
𝑟𝑒𝑞. 𝑒𝑝𝑡: Earliest pick-up time of 𝑟𝑒𝑞 representing
earliest possible time when passenger wants to be
picked up.
𝑟𝑒𝑞. 𝑒𝑑𝑡 : Earliest drop-time of 𝑟𝑒𝑞 representing
earliest possible time when passenger can be dropped
off.
𝑟𝑒𝑞. 𝑠𝑑𝑡: Scheduled drop-time indicating latest
possible time when passenger can be dropped off
according to a generated schedule of a vehicle.
We have considered two types of requests in our model,
namely (a) new ride request 𝑟𝑒𝑞𝑛𝑒𝑤 , that arrives at current time 𝑡𝑐𝑢𝑟 and (b) existing ride requests 𝑟𝑒𝑞𝑒 that are already
assigned to an occupied vehicle. We further assume that two
ride requests cannot arrive at exactly the same time period as
still there will be a difference of microseconds or nanoseconds
in the two requests. However, in extreme case if two requests
arrive at exactly the same time, then the requests will be sorted
and prioritized using the First in First Out (FIFO) mechanism,
based on the request ID associated with each request.
However, still if we strictly consider that two or more requests
arrive at exactly the same time, then sorting them in different
orders may lead to different results. Moreover, we have used
the indexing on various table fields, including, cab id, latitude,
and longitude in database to speed up the query processing
time. To reduce the complexity of the simulator, we further
assume that if a request cannot be satisfied due to the
computed cab rankings below threshold, the request will be
discarded, and not shifted to the next time stamp. A new
passenger only submits request time, origin, and destination.
For simplicity, we consider 𝑟𝑒𝑞𝑛𝑒𝑤 . 𝑒𝑝𝑡 to be equal to
𝑟𝑒𝑞𝑛𝑒𝑤 . 𝑡. The 𝑟𝑒𝑞𝑛𝑒𝑤 . 𝑒𝑑𝑡 can be calculated using the
following formula, where 𝑇 indicates travel time of the fastest
route from 𝑟𝑒𝑞𝑛𝑒𝑤 . 𝑜 to 𝑟𝑒𝑞𝑛𝑒𝑤 . 𝑑.
𝑟𝑒𝑞𝑛𝑒𝑤 . 𝑒𝑑𝑡 = 𝑟𝑒𝑞𝑛𝑒𝑤 . 𝑒𝑝𝑡 +𝑇( 𝑟𝑒𝑞𝑛𝑒𝑤 . 𝑜, 𝑟𝑒𝑞𝑛𝑒𝑤 . 𝑑).
(1)
2) VEHICLE STATE
A vehicle state 𝑠𝑣 denotes the current status of the vehicle 𝑣 at
time 𝑡 as shown in Fig. 2 (top left). It contains the following
fields.
𝑣. 𝐼𝐷: Identification number of vehicle.
𝑣. 𝑡: Time stamp associated with the current state of
vehicle.
𝑣. 𝑙: Geographical location (longitude, latitude) of
vehicle associated with 𝑣. 𝑡.
𝑣. 𝑒𝑝: Number of existing passengers in vehicle
at 𝑣. 𝑡.
Vehicle
location
𝑟𝑒𝑞1. 𝑜 .Orig
𝑟𝑒𝑞1. 𝑑 .Orig
𝑟𝑒𝑞2. 𝑑.Origin
𝑟𝑒𝑞3. 𝑑 .Origin
𝑟𝑒𝑞2. 𝑜 .Origin
𝑟𝑒𝑞3. 𝑜 .Orig
𝑆𝑅𝑜
FIGURE 1. Road Network. Here 𝒓𝒆𝒒 represents request, o represents origin of a request, and d represents destination of a
request

𝑣. 𝑐 : Current seat capacity of vehicle at 𝑣. 𝑡𝑣. 𝐸𝐷: Set of destinations of existing passengers in vehicle,
such that 𝑣. 𝐸𝐷 = {𝑟𝑒𝑞1.𝑑,… , 𝑟𝑒𝑞𝑛−1.𝑑}, where 𝑛 − 1 =𝑒𝑝.
B. PROCESSING MODULE
Ride requests and vehicles’ current states are imported to the
processing module as shown in Fig. 2 (middle) that further
comprises of three stages that need to be executed in the
following sequence: vehicle searching, vehicle scheduling,
and generating parameters matrix. The current location of a
vehicle 𝑣 at arrival time of new request is represented as 𝑣. 𝑙.
1) VEHICLE SEARCHING
This is the first step of processing module which extracts a
nearby vehicle set 𝑉𝑁 where vehicles lie within searching
radius 𝑆𝑅𝑜 around the request origin. Fig. 1 shows a road
network of a city where three ride requests have been
generated at time 𝑡. The locations of vehicles, origin and
destination of ride requests are randomly distributed over the
network as shown in Fig. 1. For instance, the 𝑆𝑅𝑜 (represented
by a circle in Fig. 1) around origin of 𝑟𝑒𝑞1 contains ten
vehicles. While finding the nearby vehicles around request
origin, it is also important to consider the seat capacity of
vehicle to check whether or not the vehicle can accommodate
requesting passenger. Therefore, we represent nearby vehicle
set by 𝑉𝑐𝑁. The current seat capacity of a vehicle can be
calculated using following equation:
𝑣. 𝑐 = 𝑐𝑎𝑝𝑎𝑐𝑖𝑡𝑦𝑚𝑎𝑥 − 𝑣. 𝑒𝑝, ∀𝑣 ∈ 𝑉𝑐𝑁 . (2)
Where 𝑐𝑎𝑝𝑎𝑐𝑖𝑡𝑦𝑚𝑎𝑥 is maximum seat capacity of a vehicle.
2) VEHICLE SCHEDULING
After identifying the set of candidate vehicles i.e., 𝑉𝑐𝑁 for
arrived request 𝑟𝑒𝑞𝑛𝑒𝑤 , the scheduling module next calculates the schedules of occupied vehicles in the set. The calculation
of shared route for each occupied vehicle in nearby vehicle set
is modelled as travelling salesman problem (TSP) [24] that
states: “Given a list of cities and distances between each pair
of cities, what is the shortest possible route that visits each city
exactly once”. It is an NP-hard problem and finding an optimal
solution results in long running time. Thus, a heuristic
algorithm should be used to calculate the shared route within
reasonable time.
If the vehicle 𝑣 ∈ 𝑉𝑐𝑁 is occupied, then a variant of nearest
neighbor (NN) heuristic algorithm [12] is used to schedule all
ride requests (new and existing). Nearest neighbor procedure
is one of the commonly used heuristics of travelling salesman
problem (𝑇𝑆𝑃). NN algorithm builds a trip on the basis of
travelling distance from the currently visited node to the
closest node in the network. However, the heuristic produces
an approximately optimal solution from the distance matrix.
3) GENERATING PARAMETERS MATRIX
Given the set 𝑉𝑐𝑁 (each vehicle in the set has its own current
state) retrieved for new ride request 𝑟𝑒𝑞𝑛𝑒𝑤, the purpose of
generating parameters matrix is to find vehicle 𝑣 ∈ 𝑉𝑐𝑁 that
is preferred from the perspective of driver, requesting
passenger, and existing passengers. We have considered the
following five parameters of drivers and passengers in our
methodology, namely: (a) average time delay of passengers,
(b) vehicle capacity, (c) fare reduction of passengers, (d) total
driving distance, and (e) profit increment to driver. If vehicle
is occupied, then it needs to be scheduled before calculation of
aforementioned parameters. All parameters except vehicle
capacity are calculated on the basis of NN schedule.
C. RECOMMENDATION MODULE
The last module of our system architecture as shown in Fig. 2
(right most) is the recommendation module where each
𝑟𝑒𝑞𝑛𝑒𝑤 that arrives at current time 𝑡𝑐𝑢𝑟 is recommended a
preferred vehicle from the set 𝑉𝑐𝑁. The vehicle needs to be
ranked with respect to average time delay, vehicle capacity,
FIGURE 2. System Architecture

fare reduction, driving distance, and profit increment.
Therefore, we need to sum all the aforementioned parameters
to calculate an aggregated score.
IV. PROPOSED VEHICLE RECOMMENDATIONFRAMEWORK
In this section, we discuss in detail the proposed heuristic
based vehicle recommendation framework HASVR. The
framework has two major modules: (a) scheduling module for
occupied vehicles and (b) calculation of aggregated score for
each vehicle.
A. SCHEDULING MODULE
The scheduling algorithm produces a temporally-ordered
sequences of locations that an occupied vehicle 𝑣 ∈ 𝑉𝑐𝑁 will
visit when 𝑟𝑒𝑞𝑛𝑒𝑤 is assigned to it. The locations include
origin of new passenger and destinations of all (new and
existing) passengers. The schedule indicates the order of
serving the ride requests if the requesting passenger is
assigned to an occupied vehicle 𝑣 ∈ 𝑉𝑐𝑁.
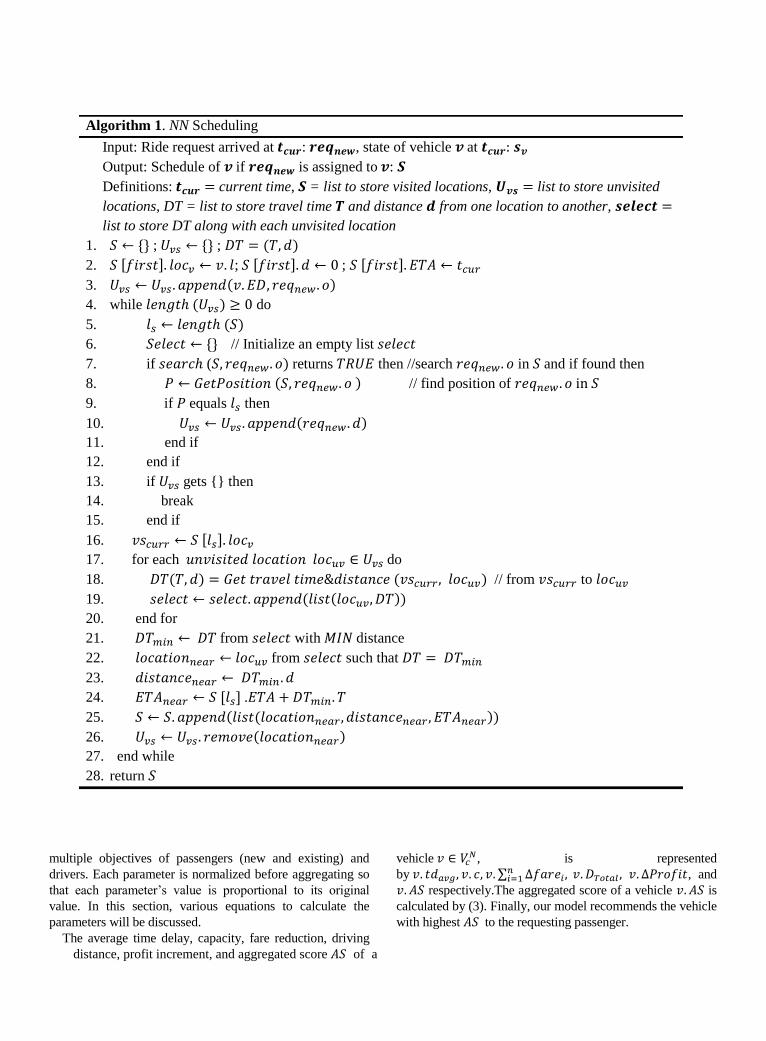
Algorithm 1 illustrates the procedure of nearest neighbor
scheduling. The algorithm takes as input the following
parameters: (a) currently arrived ride request 𝑟𝑒𝑞𝑛𝑒𝑤 that
wants recommendation of preferred vehicle and (b) current
state of vehicle 𝑠𝑣 from which location of vehicle at 𝑡𝑐𝑢𝑟 , and
set of destinations of existing passengers can be extracted.
The term “visited” and “unvisited” is used to differentiate
whether the location has been inserted into the schedule
(termed as “visited”) or not (termed as “unvisited”). Following
text explains the steps involved in the algorithm. Initializations (Line 1−Line 3): In Line 1, various
lists (data structures) used by algorithm are declared.
𝑆 consists of a list where each index stores three
elements, (i) visited location 𝑙𝑜𝑐𝑣 , (ii) estimated
time of arrival 𝐸𝑇𝐴 at the visited location according
to the created schedule (also referred as scheduled
arrival time), and (iii) distance travelled 𝑑 to the
location from current (last or previous) visited
location. The distance and travel time are computed
by using Google maps distance matrix API [23]. The
current location of vehicle 𝑣. 𝑙 at 𝑡𝑐𝑢𝑟 is the starting
point from where NN schedule is created. Therefore,
𝑣. 𝑙 is first location to be inserted in 𝑆. Distance
travelled to 𝑣. 𝑙 is 0 and estimated time of arrival at
𝑣. 𝑙 is equal to request time (Line 2). Origin of
requesting passenger and destinations of existing
passengers are appended to 𝑈𝑣𝑠 (Line 3). Destination
of requesting passenger is appended to 𝑈𝑣𝑠 after
visiting corresponding origin.
Schedule Creation (Line 4- Line 28): On each
iteration of while loop, nearest location from current
visited location 𝑣𝑠𝑐𝑢𝑟𝑟 is inserted into 𝑆. While loop
continues to insert locations into 𝑆 unless each
location in 𝑈𝑣𝑠 gets visited (inserted into 𝑆) (Line 4).
Both lists 𝑆 and 𝑈𝑣𝑠 are updated on each iteration of
while loop. A location is added to 𝑆 and removed
from 𝑈𝑣𝑠 on each while loop iteration. Length of 𝑆 is
calculated to refer the current visited location in
𝑆 (Line 5). A list 𝑠𝑒𝑙𝑒𝑐𝑡 is initialized as empty on
each iteration of while loop (Line 6). This list stores
each unvisited 𝑙𝑜𝑐𝑢𝑣 ∈ 𝑈𝑣𝑠 along with travel time
and distance from 𝑣𝑠𝑐𝑢𝑟𝑟 to 𝑙𝑜𝑐𝑢𝑣 .
Precedence rule of origin and destination (Line 7-
Line 12): The origin of new request must be inserted
before the destination in the schedule. The algorithm
first checks whether the origin has been visited or not
(Line 7). If origin has been visited, then algorithm
checks whether it is the last visited location in 𝑆 or
not i.e., finds position of new request’s origin in 𝑆(Line 8). If origin is found to be last visited location
in 𝑆, then destination of new request is appended to
list of unvisited locations 𝑈𝑣𝑠 (Line 9-Line 12). The
destination is included in the decision “where to go
next” only if the corresponding origin has been
visited. If each unvisited location in 𝑈𝑣𝑠 has been
inserted into 𝑆 (𝑈𝑣𝑠 gets empty), then control goes
out of the while loop and algorithm terminates
returning schedule 𝑆 (Line 13-Line15, and Line 28).
Finding “Nearest” location (Line 16- Line 27): In
this step, spatial closeness (distance) from the current
visited location to each unvisited location 𝑙𝑜𝑐𝑢𝑣 ∈𝑈𝑣𝑠 is measured. The last location inserted into S is
the currently visited location (Line 16). The unvisited
location 𝑙𝑜𝑐𝑢𝑣 that has highest spatial closeness to
𝑣𝑠𝑐𝑢𝑟𝑟 is scheduled to be next location to visit (Line
17 –Line 22). In line 24, the estimated arrival time at
the nearest location 𝑙𝑜𝑐𝑎𝑡𝑖𝑜𝑛𝑛𝑒𝑎𝑟 is calculated by
adding the estimated arrival time at previous visited
location and travel time from 𝑣𝑠𝑐𝑢𝑟𝑟
to 𝑙𝑜𝑐𝑎𝑡𝑖𝑜𝑛𝑛𝑒𝑎𝑟 . The nearest location along with its
spatial closeness from 𝑣𝑠𝑐𝑢𝑟𝑟 and estimated arrival
time is appended as a list to S (Line 25). The nearest
location needs to be removed from 𝑈𝑣𝑠 after its
insertion into 𝑆 (Line 26).
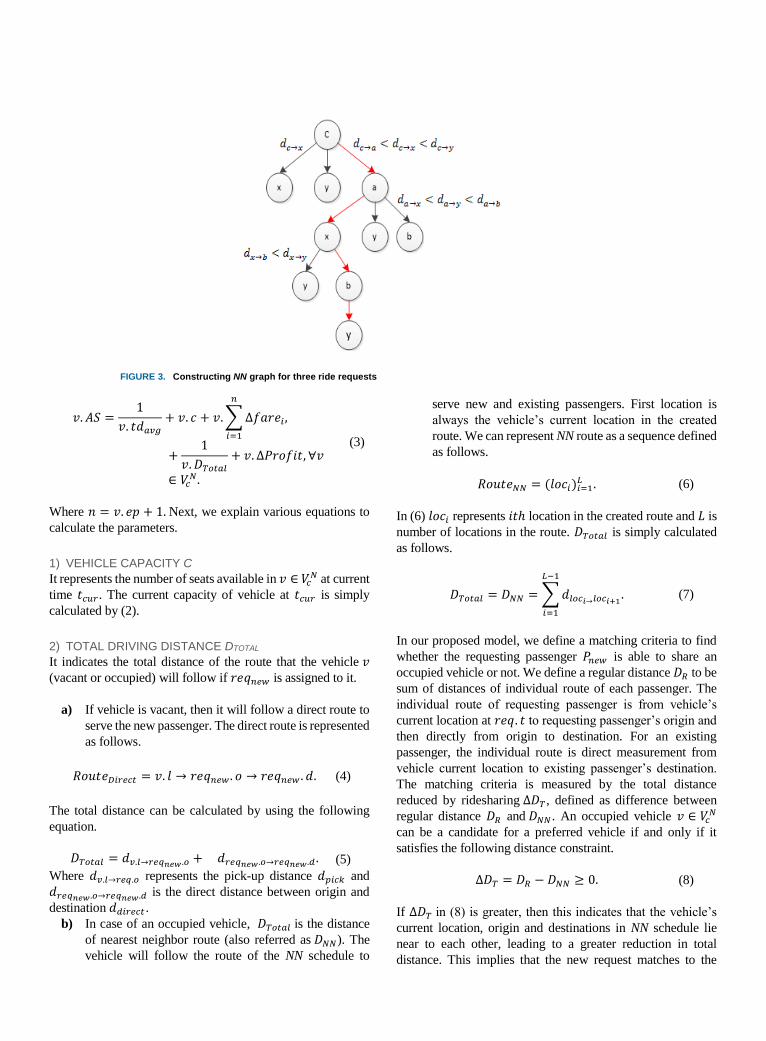
Fig. 3 gives an example of how to create a NN schedule
serving three ride requests (one new and two existing) from
the vehicle current location c. The origin and destination nodes
of new request are 𝑎 and 𝑏, respectively. The destinations
nodes of two existing passengers are 𝑥 and 𝑦. A weight on an
edge (e.g., 𝑑𝑐→𝑥) indicates real-world mileage of the fastest
route from node 𝑐 to node 𝑥. Therefore, NN route will be 𝑐 →𝑎 → 𝑥 → 𝑏 → 𝑦 .
B. AGGREGATE SCORE CALCULATION
For each vehicle 𝑣 ∈ 𝑉𝑐𝑁, our proposed model calculates the
values of various parameters as discussed previously. The
recommendation module combines all the calculated
parameters to calculate an aggregate score of each vehicle 𝑣 ∈𝑉𝑐
𝑁. This aggregated score is used as a rating scale that is
generated by the recommender system by considering
multiple objectives of passengers (new and existing) and
drivers. Each parameter is normalized before aggregating so
that each parameter’s value is proportional to its original
value. In this section, various equations to calculate the
parameters will be discussed.
The average time delay, capacity, fare reduction, driving
distance, profit increment, and aggregated score 𝐴𝑆 of a
vehicle 𝑣 ∈ 𝑉𝑐𝑁, is represented
by 𝑣. 𝑡𝑑𝑎𝑣𝑔, 𝑣. 𝑐, 𝑣. ∑ ∆𝑓𝑎𝑟𝑒𝑖 ,𝑛𝑖=1 𝑣. 𝐷𝑇𝑜𝑡𝑎𝑙 , 𝑣. ∆𝑃𝑟𝑜𝑓𝑖𝑡, and
𝑣. 𝐴𝑆 respectively.The aggregated score of a vehicle 𝑣. 𝐴𝑆 is
calculated by (3). Finally, our model recommends the vehicle
with highest 𝐴𝑆 to the requesting passenger.
Algorithm 1. NN Scheduling
Input: Ride request arrived at 𝒕𝒄𝒖𝒓: 𝒓𝒆𝒒𝒏𝒆𝒘, state of vehicle 𝒗 at 𝒕𝒄𝒖𝒓: 𝒔𝒗
Output: Schedule of 𝒗 if 𝒓𝒆𝒒𝒏𝒆𝒘 is assigned to 𝒗: 𝑺
Definitions: 𝒕𝒄𝒖𝒓 = current time, 𝑺 = list to store visited locations, 𝑼𝒗𝒔 = list to store unvisited
locations, DT = list to store travel time 𝑻 and distance 𝒅 from one location to another, 𝒔𝒆𝒍𝒆𝒄𝒕 =
list to store DT along with each unvisited location
1. 𝑆 ← {} ; 𝑈𝑣𝑠 ← {} ; 𝐷𝑇 = (𝑇, 𝑑)
2. 𝑆 𝑓𝑖𝑟𝑠𝑡 . 𝑙𝑜𝑐𝑣 ← 𝑣. 𝑙; 𝑆 𝑓𝑖𝑟𝑠𝑡 . 𝑑 ← 0 ; 𝑆 𝑓𝑖𝑟𝑠𝑡 . 𝐸𝑇𝐴 ← 𝑡𝑐𝑢𝑟
3. 𝑈𝑣𝑠 ← 𝑈𝑣𝑠. 𝑎𝑝𝑝𝑒𝑛𝑑(𝑣. 𝐸𝐷, 𝑟𝑒𝑞𝑛𝑒𝑤. 𝑜)
4. while 𝑙𝑒𝑛𝑔𝑡ℎ (𝑈𝑣𝑠) ≥ 0 do
5. 𝑙𝑠 ← 𝑙𝑒𝑛𝑔𝑡ℎ (𝑆)
6. 𝑆𝑒𝑙𝑒𝑐𝑡 ← {} // Initialize an empty list 𝑠𝑒𝑙𝑒𝑐𝑡
7. if 𝑠𝑒𝑎𝑟𝑐ℎ (𝑆, 𝑟𝑒𝑞𝑛𝑒𝑤. 𝑜) returns 𝑇𝑅𝑈𝐸 then //search 𝑟𝑒𝑞𝑛𝑒𝑤. 𝑜 in 𝑆 and if found then
8. 𝑃 ← 𝐺𝑒𝑡𝑃𝑜𝑠𝑖𝑡𝑖𝑜𝑛 (𝑆, 𝑟𝑒𝑞𝑛𝑒𝑤. 𝑜 ) // find position of 𝑟𝑒𝑞𝑛𝑒𝑤. 𝑜 in 𝑆
9. if 𝑃 equals 𝑙𝑠 then
10. 𝑈𝑣𝑠 ← 𝑈𝑣𝑠. 𝑎𝑝𝑝𝑒𝑛𝑑(𝑟𝑒𝑞𝑛𝑒𝑤. 𝑑)
11. end if
12. end if
13. if 𝑈𝑣𝑠 gets {} then
14. break
15. end if
16. 𝑣𝑠𝑐𝑢𝑟𝑟 ← 𝑆 𝑙𝑠 . 𝑙𝑜𝑐𝑣
17. for each 𝑢𝑛𝑣𝑖𝑠𝑖𝑡𝑒𝑑 𝑙𝑜𝑐𝑎𝑡𝑖𝑜𝑛 𝑙𝑜𝑐𝑢𝑣 ∈ 𝑈𝑣𝑠 do
18. 𝐷𝑇(𝑇, 𝑑) = 𝐺𝑒𝑡 𝑡𝑟𝑎𝑣𝑒𝑙 𝑡𝑖𝑚𝑒&𝑑𝑖𝑠𝑡𝑎𝑛𝑐𝑒 (𝑣𝑠𝑐𝑢𝑟𝑟, 𝑙𝑜𝑐𝑢𝑣) // from 𝑣𝑠𝑐𝑢𝑟𝑟 to 𝑙𝑜𝑐𝑢𝑣
19. 𝑠𝑒𝑙𝑒𝑐𝑡 ← 𝑠𝑒𝑙𝑒𝑐𝑡. 𝑎𝑝𝑝𝑒𝑛𝑑(𝑙𝑖𝑠𝑡(𝑙𝑜𝑐𝑢𝑣, 𝐷𝑇))
20. end for
21. 𝐷𝑇𝑚𝑖𝑛 ← 𝐷𝑇 from 𝑠𝑒𝑙𝑒𝑐𝑡 with 𝑀𝐼𝑁 distance
22. 𝑙𝑜𝑐𝑎𝑡𝑖𝑜𝑛𝑛𝑒𝑎𝑟 ← 𝑙𝑜𝑐𝑢𝑣 from 𝑠𝑒𝑙𝑒𝑐𝑡 such that 𝐷𝑇 = 𝐷𝑇𝑚𝑖𝑛
23. 𝑑𝑖𝑠𝑡𝑎𝑛𝑐𝑒𝑛𝑒𝑎𝑟 ← 𝐷𝑇𝑚𝑖𝑛. 𝑑
24. 𝐸𝑇𝐴𝑛𝑒𝑎𝑟 ← 𝑆 𝑙𝑠 .𝐸𝑇𝐴 + 𝐷𝑇𝑚𝑖𝑛. 𝑇
25. 𝑆 ← 𝑆. 𝑎𝑝𝑝𝑒𝑛𝑑(𝑙𝑖𝑠𝑡(𝑙𝑜𝑐𝑎𝑡𝑖𝑜𝑛𝑛𝑒𝑎𝑟 , 𝑑𝑖𝑠𝑡𝑎𝑛𝑐𝑒𝑛𝑒𝑎𝑟 , 𝐸𝑇𝐴𝑛𝑒𝑎𝑟))
26. 𝑈𝑣𝑠 ← 𝑈𝑣𝑠. 𝑟𝑒𝑚𝑜𝑣𝑒(𝑙𝑜𝑐𝑎𝑡𝑖𝑜𝑛𝑛𝑒𝑎𝑟)
27. end while
28. return 𝑆
𝑣. 𝐴𝑆 =1
𝑣. 𝑡𝑑𝑎𝑣𝑔
+ 𝑣. 𝑐 + 𝑣.∑∆𝑓𝑎𝑟𝑒𝑖 ,
𝑛
𝑖=1
+1
𝑣. 𝐷𝑇𝑜𝑡𝑎𝑙
+ 𝑣. ∆𝑃𝑟𝑜𝑓𝑖𝑡, ∀𝑣
∈ 𝑉𝑐𝑁.
(3)
Where 𝑛 = 𝑣. 𝑒𝑝 + 1. Next, we explain various equations to
calculate the parameters.
1) VEHICLE CAPACITY C
It represents the number of seats available in 𝑣 ∈ 𝑉𝑐𝑁 at current
time 𝑡𝑐𝑢𝑟. The current capacity of vehicle at 𝑡𝑐𝑢𝑟 is simply
calculated by (2).
2) TOTAL DRIVING DISTANCE DTOTAL
It indicates the total distance of the route that the vehicle 𝑣(vacant or occupied) will follow if 𝑟𝑒𝑞𝑛𝑒𝑤 is assigned to it.
a) If vehicle is vacant, then it will follow a direct route to
serve the new passenger. The direct route is represented
as follows.
𝑅𝑜𝑢𝑡𝑒𝐷𝑖𝑟𝑒𝑐𝑡 = 𝑣. 𝑙 → 𝑟𝑒𝑞𝑛𝑒𝑤 . 𝑜 → 𝑟𝑒𝑞𝑛𝑒𝑤 . 𝑑. (4)
The total distance can be calculated by using the following
equation.
𝐷𝑇𝑜𝑡𝑎𝑙 = 𝑑𝑣.𝑙→𝑟𝑒𝑞𝑛𝑒𝑤.𝑜 + 𝑑𝑟𝑒𝑞𝑛𝑒𝑤.𝑜→𝑟𝑒𝑞𝑛𝑒𝑤.𝑑 . (5)
Where 𝑑𝑣.𝑙→𝑟𝑒𝑞.𝑜 represents the pick-up distance 𝑑𝑝𝑖𝑐𝑘 and
𝑑𝑟𝑒𝑞𝑛𝑒𝑤.𝑜→𝑟𝑒𝑞𝑛𝑒𝑤.𝑑 is the direct distance between origin and
destination 𝑑𝑑𝑖𝑟𝑒𝑐𝑡 .
b) In case of an occupied vehicle, 𝐷𝑇𝑜𝑡𝑎𝑙 is the distance
of nearest neighbor route (also referred as 𝐷𝑁𝑁). The
vehicle will follow the route of the NN schedule to
serve new and existing passengers. First location is
always the vehicle’s current location in the created
route. We can represent NN route as a sequence defined
as follows.
𝑅𝑜𝑢𝑡𝑒𝑁𝑁 = (𝑙𝑜𝑐𝑖)𝑖=1𝐿 . (6)
In (6) 𝑙𝑜𝑐𝑖 represents 𝑖𝑡ℎ location in the created route and 𝐿 is
number of locations in the route. 𝐷𝑇𝑜𝑡𝑎𝑙 is simply calculated
as follows.
𝐷𝑇𝑜𝑡𝑎𝑙 = 𝐷𝑁𝑁 = ∑𝑑𝑙𝑜𝑐𝑖→𝑙𝑜𝑐𝑖+1
𝐿−1
𝑖=1
. (7)
In our proposed model, we define a matching criteria to find
whether the requesting passenger 𝑃𝑛𝑒𝑤 is able to share an
occupied vehicle or not. We define a regular distance 𝐷𝑅 to be
sum of distances of individual route of each passenger. The
individual route of requesting passenger is from vehicle’s
current location at 𝑟𝑒𝑞. 𝑡 to requesting passenger’s origin and
then directly from origin to destination. For an existing
passenger, the individual route is direct measurement from
vehicle current location to existing passenger’s destination.
The matching criteria is measured by the total distance
reduced by ridesharing ∆𝐷𝑇 , defined as difference between
regular distance 𝐷𝑅 and 𝐷𝑁𝑁. An occupied vehicle 𝑣 ∈ 𝑉𝑐𝑁
can be a candidate for a preferred vehicle if and only if it
satisfies the following distance constraint.
∆𝐷𝑇 = 𝐷𝑅 − 𝐷𝑁𝑁 ≥ 0. (8)
If ∆𝐷𝑇 in (8) is greater, then this indicates that the vehicle’s
current location, origin and destinations in NN schedule lie
near to each other, leading to a greater reduction in total
distance. This implies that the new request matches to the
FIGURE 3. Constructing NN graph for three ride requests
destinations of existing passengers in 𝑣 ∈ 𝑉𝑐𝑁 and assigning
the request to 𝑣 will provide benefit to both drivers and
passengers (new and existing). However, if ∆𝐷𝑇 negative,
then the vehicle’s current location, origin and destinations in
NN schedule lie far apart from each other such that sum of
distances of individual routes of passengers is less than NN
distance. This indicates that new request is not able to carpool
existing passengers in 𝑣 ∈ 𝑉𝑐𝑁. Therefore, the nearby
occupied vehicle 𝑣 needs to be removed from nearby vehicle
set 𝑉𝑐𝑁.
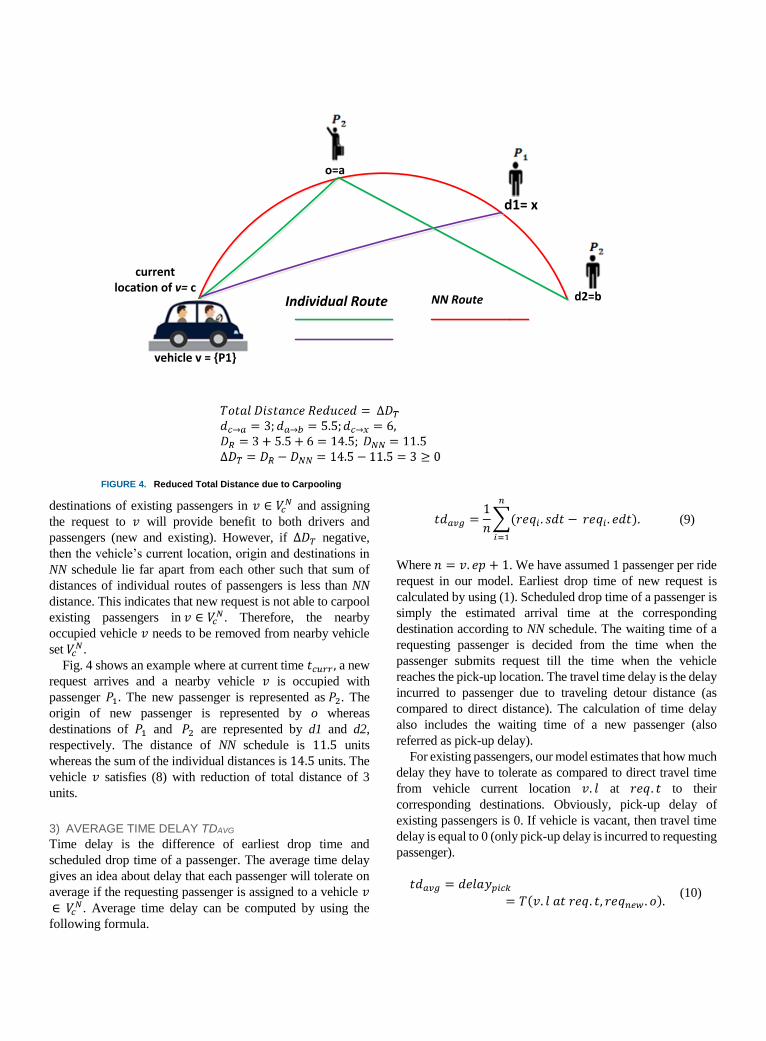
Fig. 4 shows an example where at current time 𝑡𝑐𝑢𝑟𝑟 , a new
request arrives and a nearby vehicle 𝑣 is occupied with
passenger 𝑃1. The new passenger is represented as 𝑃2. The
origin of new passenger is represented by o whereas
destinations of 𝑃1 and 𝑃2 are represented by d1 and d2,
respectively. The distance of NN schedule is 11.5 units
whereas the sum of the individual distances is 14.5 units. The
vehicle 𝑣 satisfies (8) with reduction of total distance of 3
units.
3) AVERAGE TIME DELAY TDAVG
Time delay is the difference of earliest drop time and scheduled drop time of a passenger. The average time delay gives an idea about delay that each passenger will tolerate on average if the requesting passenger is assigned to a vehicle 𝑣 ∈ 𝑉𝑐
𝑁. Average time delay can be computed by using the following formula.
𝑡𝑑𝑎𝑣𝑔 =1
𝑛∑(𝑟𝑒𝑞𝑖 . 𝑠𝑑𝑡 −
𝑛
𝑖=1
𝑟𝑒𝑞𝑖 . 𝑒𝑑𝑡). (9)
Where 𝑛 = 𝑣. 𝑒𝑝 + 1. We have assumed 1 passenger per ride
request in our model. Earliest drop time of new request is
calculated by using (1). Scheduled drop time of a passenger is
simply the estimated arrival time at the corresponding
destination according to NN schedule. The waiting time of a
requesting passenger is decided from the time when the
passenger submits request till the time when the vehicle
reaches the pick-up location. The travel time delay is the delay
incurred to passenger due to traveling detour distance (as
compared to direct distance). The calculation of time delay
also includes the waiting time of a new passenger (also
referred as pick-up delay).
For existing passengers, our model estimates that how much
delay they have to tolerate as compared to direct travel time
from vehicle current location 𝑣. 𝑙 at 𝑟𝑒𝑞. 𝑡 to their
corresponding destinations. Obviously, pick-up delay of
existing passengers is 0. If vehicle is vacant, then travel time
delay is equal to 0 (only pick-up delay is incurred to requesting
passenger).
𝑡𝑑𝑎𝑣𝑔 = 𝑑𝑒𝑙𝑎𝑦𝑝𝑖𝑐𝑘
= 𝑇(𝑣. 𝑙 𝑎𝑡 𝑟𝑒𝑞. 𝑡, 𝑟𝑒𝑞𝑛𝑒𝑤 . 𝑜).(10)
d1= x
d2=b
currentlocation of v= c
vehicle v = {P1}
Individual Route NN Route
o=a
FIGURE 4. Reduced Total Distance due to Carpooling

4) PRICE MECHANISM (FARE REDUCTION AND PROFITINCREMENT)
We have proposed a variant of win-win fare model [10]. In
order to motivate drivers and passengers to participate in
carpooling, the pricing mechanism is designed to provide
monetary incentives for all involved parties. Since the time
delay caused by detouring is the major concern of carpooling
systems, it is important to design the pricing mechanism while
considering the detouring of each passenger participating in
carpooling. The pricing scheme is used to calculate total fare
reduction and profit increment score of each vehicle 𝑣 ∈ 𝑉𝑐𝑁.
The fare reduction score estimates that how much fare of new
passenger as well as existing passengers in vehicle 𝑣 can be
reduced if 𝑟𝑒𝑞𝑛𝑒𝑤 is assigned to 𝑣. Our proposed pricing
scheme works as follows.
The passenger pays the regular fare 𝑅𝐹 while
travelling alone. The regular fare is the fare
proportional to the distance travelled by vehicle to
serve the passenger alone. Regular fare rate 𝜕𝑟 is aconstant price for unit distance. The regular fare
𝑅𝐹 corresponding to travelled distance 𝑑 is
represented as 𝑟𝑓(𝑑) = 𝜕𝑟 × 𝑑. The value of 𝜕𝑟 can
be decided by the vehicle service company.
The 𝑅𝐹 of a requesting passenger also includes the
pick-up charge in our model. Pick-up charge is the
fare for the distance that vehicle travels to pick the
passenger from its previous location in the created
route. This strategy helps to avoid loss to drivers.
The passenger 𝑃 whose travel distance is increased
due to sharing the ride should be compensated in the
form of fare reduction and the reduction should be
proportional to increase in travel distance of 𝑃. The driver’s profit is the sum of fares estimated for
all passengers. It is important to mention that total
fare paid by all passengers equals the profit collected
by driver in our model. The expected profit of a
driver 𝑃𝑟𝑜𝑓𝑖𝑡𝑒𝑥𝑝 is the regular fare corresponding to
the total distance travelled by vehicle to serve all
passengers. The increase in driver’s profit indicates
that how much extra profit the driver can earn as
compared to expected profit. The increase in profit
can be calculated as follows.
∆Profit = collected profit − Profitexp. (11)
Collected profit = ∑EFi
n
i=1
where, n
= v. ep + 1.
(12)
Profitexp = rf(DTotal). (13)
In (12) 𝐸𝐹𝑖 represents the fare estimated for request 𝑖. The fare
constraint can be represented by (14); representing regular fare
of request 𝑖 by 𝑅𝐹𝑖.
EFi ≤ RFi ∀i = 1,… , n. (14)
Each nearby vehicle 𝑣 ∈ 𝑉𝑐𝑁 can be vacant or occupied at
arrival time of new request. Therefore, we consider two cases
in our proposed mechanism.
(a) Vacant vehicle∶ Vacant vehicle 𝑣 will follow a direct
route if new request is assigned to it. The requesting
passenger is regularly charged. Fare of requesting
passenger is estimated by (15).
EFnew = RFnew = rf(dloci−1→loci+
dloci→reqnew.d), loci = reqnew. o.(15)
Where 𝑙𝑜𝑐𝑖 represents 𝑖𝑡ℎ location in the created route. There
will be no reduction in fare as vehicle will follow a direct route
to serve the passenger so total fare reduction associated with
passenger of a vacant vehicle is 0. Profit increment score of a
vacant vehicle is also 0 as the driver’s expected and collected
profit is same.
(b) Occupied vehicle: The total saving due to carpooling is
shared among all the involved parties (new passenger,
existing passengers, and driver). Total carpool saving
𝐶𝑆 is defined by (16).
CS = rf(DR − DNN), where DR ≥ DNN. (16)
To optimize the objectives of drivers and passengers, we
need to share the carpool saving between driver and all
passengers as a party. The percentage of carpool saving given
to party of passengers is then shared between new passenger
and existing passengers of vehicle on the basis of their detour
distance (increase in travel distance) in NN route. We
represent new ride request by 𝑟𝑒𝑞𝑛 and existing ride requests
by 𝑟𝑒𝑞1, … , 𝑟𝑒𝑞𝑛−1.
To calculate the fare reduction score of a vehicle 𝑣, our
model first calculates regular fare and then estimates fare of
each passenger 𝑃 on the basis of 𝑅𝑓, 𝐶𝑆 and 𝑃′𝑠 detour
distance. The 𝑅𝑓 of new passenger is calculated by using (15).
However, the regular fare of an existing passenger is
calculated using (17).
RFi = rf(dv.l→reqi.d) ∀i = 1,… , n − 1. (17)
The fare of each passenger in scenario of same origin and same
destinations (same origin means when the request origin is in
the way of cab) is estimated by the following equation.
𝐸𝐹𝑖 = 𝑅𝐹𝑖 − 𝜇 × 𝐶𝑆 ×1
𝑛. (18)
In this case, detour distance is 0 as all passengers have
common origin and common destination. This scenario
happens when the new request’s origin matches to vehicle’s
current location and destination of new request matches to
common destination of all existing passengers. The parameter
𝜇 in (18) and (19) indicates the percentage of total carpool
saving given to passengers group. The percentage of carpool
saving given to passengers is then shared equally between new
passenger and existing passengers. Whereas the fare of each
passenger in case of different origins and different destinations
is estimated by the following equation.
EFi = RFi − μ × CS ×∆di
∑ ∆dini=1
. (19)
Where 𝑛 = 𝑣. 𝑒𝑝 + 1 and 0 < 𝜇 < 1. ∆𝑑𝑖 represents the
detour distance of passenger 𝑖 that can be calculated by (20).
For an existing passenger 𝑃, detour distance represents extra
distance that 𝑃 has to travel as compared to direct distance
from the vehicle’s current location to the destination of 𝑃.
However, for a new passenger, detour distance indicates extra
distance as compared to direct distance from origin to
destination.
Detour distance= travel distance in RouteNN
− direct distance.
(20)
The term 𝜇 × 𝐶𝑆 × (∆𝑑𝑖/∑ ∆𝑑𝑖𝑛𝑖=1 ) indicates the saving
given to an individual passenger. The expression ∆𝑑𝑖/∑ ∆𝑑𝑖
𝑛𝑖=1 is used to share the percentage of total carpool saving
given to passengers group on the basis of their detour distance.
The passenger having maximum detour distance will be
rewarded maximum in the form of fare reduction. The total
fare reduction associated with passengers of a nearby vehicle
𝑣 ∈ 𝑉𝑐𝑁 when new request assigned to it can be computed by
using the following formula, where 𝑛 = 𝑣. 𝑒𝑝 + 1.
∑∆farei
n
i=1
= ∑RFi − ∑ EFi
n
i=1
n
i=1
. (21)
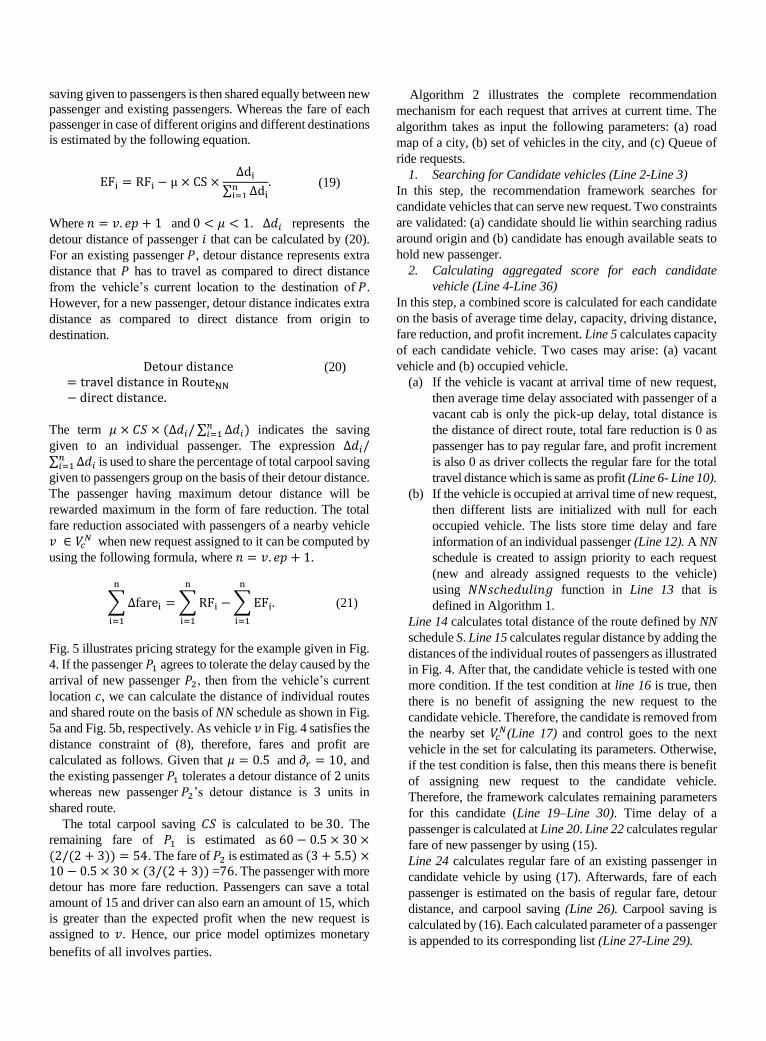
Fig. 5 illustrates pricing strategy for the example given in Fig.
4. If the passenger 𝑃1 agrees to tolerate the delay caused by the arrival of new passenger 𝑃2, then from the vehicle’s current location 𝑐, we can calculate the distance of individual routes
and shared route on the basis of NN schedule as shown in Fig.
5a and Fig. 5b, respectively. As vehicle 𝑣 in Fig. 4 satisfies the
distance constraint of (8), therefore, fares and profit are
calculated as follows. Given that 𝜇 = 0.5 and 𝜕𝑟 = 10, and the existing passenger 𝑃1 tolerates a detour distance of 2 units whereas new passenger 𝑃2’s detour distance is 3 units in shared route.
The total carpool saving 𝐶𝑆 is calculated to be 30. The
remaining fare of 𝑃1 is estimated as 60 − 0.5 × 30 × (2/(2 + 3)) = 54. The fare of 𝑃2 is estimated as (3 + 5.5) × 10 − 0.5 × 30 × (3/(2 + 3)) =76. The passenger with more
detour has more fare reduction. Passengers can save a total
amount of 15 and driver can also earn an amount of 15, which
is greater than the expected profit when the new request is
assigned to 𝑣. Hence, our price model optimizes monetary
benefits of all involves parties.
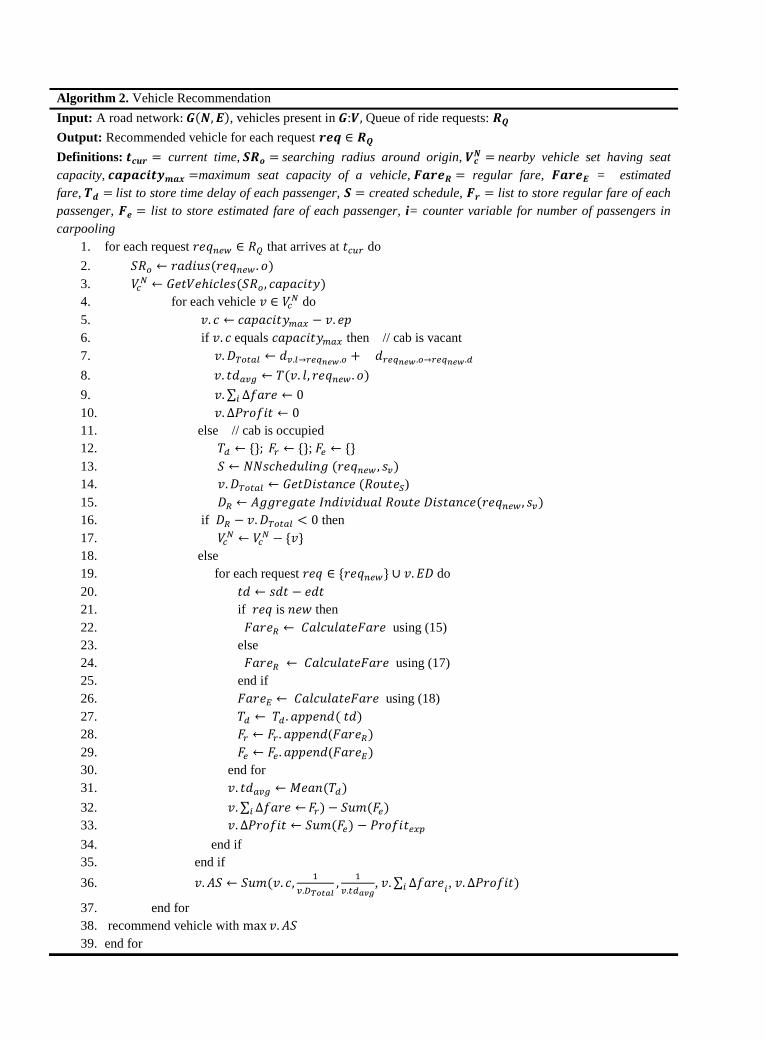
Algorithm 2 illustrates the complete recommendation
mechanism for each request that arrives at current time. The
algorithm takes as input the following parameters: (a) road
map of a city, (b) set of vehicles in the city, and (c) Queue of
ride requests.
1. Searching for Candidate vehicles (Line 2-Line 3)
In this step, the recommendation framework searches for
candidate vehicles that can serve new request. Two constraints
are validated: (a) candidate should lie within searching radius
around origin and (b) candidate has enough available seats to
hold new passenger.
2. Calculating aggregated score for each candidate
vehicle (Line 4-Line 36)
In this step, a combined score is calculated for each candidate
on the basis of average time delay, capacity, driving distance,
fare reduction, and profit increment. Line 5 calculates capacity
of each candidate vehicle. Two cases may arise: (a) vacant
vehicle and (b) occupied vehicle.
(a) If the vehicle is vacant at arrival time of new request,
then average time delay associated with passenger of a
vacant cab is only the pick-up delay, total distance is
the distance of direct route, total fare reduction is 0 as
passenger has to pay regular fare, and profit increment
is also 0 as driver collects the regular fare for the total
travel distance which is same as profit (Line 6- Line 10).
(b) If the vehicle is occupied at arrival time of new request,
then different lists are initialized with null for each
occupied vehicle. The lists store time delay and fare
information of an individual passenger (Line 12). A NN
schedule is created to assign priority to each request
(new and already assigned requests to the vehicle)
using 𝑁𝑁𝑠𝑐ℎ𝑒𝑑𝑢𝑙𝑖𝑛𝑔 function in Line 13 that is
defined in Algorithm 1.
Line 14 calculates total distance of the route defined by NN
schedule S. Line 15 calculates regular distance by adding the
distances of the individual routes of passengers as illustrated
in Fig. 4. After that, the candidate vehicle is tested with one
more condition. If the test condition at line 16 is true, then
there is no benefit of assigning the new request to the
candidate vehicle. Therefore, the candidate is removed from
the nearby set 𝑉𝑐𝑁(Line 17) and control goes to the next
vehicle in the set for calculating its parameters. Otherwise,
if the test condition is false, then this means there is benefit
of assigning new request to the candidate vehicle.
Therefore, the framework calculates remaining parameters
for this candidate (Line 19–Line 30). Time delay of a
passenger is calculated at Line 20. Line 22 calculates regular
fare of new passenger by using (15). Line 24 calculates regular fare of an existing passenger in
candidate vehicle by using (17). Afterwards, fare of each
passenger is estimated on the basis of regular fare, detour
distance, and carpool saving (Line 26). Carpool saving is
calculated by (16). Each calculated parameter of a passenger
is appended to its corresponding list (Line 27-Line 29).
Algorithm 2. Vehicle Recommendation
Input: A road network: 𝑮(𝑵, 𝑬), vehicles present in 𝑮:𝑽, Queue of ride requests: 𝑹𝑸
Output: Recommended vehicle for each request 𝒓𝒆𝒒 ∈ 𝑹𝑸
Definitions: 𝒕𝒄𝒖𝒓 = current time, 𝑺𝑹𝒐 = searching radius around origin, 𝑽𝒄𝑵 = nearby vehicle set having seat
capacity, 𝒄𝒂𝒑𝒂𝒄𝒊𝒕𝒚𝒎𝒂𝒙 =maximum seat capacity of a vehicle, 𝑭𝒂𝒓𝒆𝑹 = regular fare, 𝑭𝒂𝒓𝒆𝑬 = estimated
fare, 𝑻𝒅 = list to store time delay of each passenger, 𝑺 = created schedule, 𝑭𝒓 = list to store regular fare of each
passenger, 𝑭𝒆 = list to store estimated fare of each passenger, i= counter variable for number of passengers in
carpooling
1. for each request 𝑟𝑒𝑞𝑛𝑒𝑤 ∈ 𝑅𝑄 that arrives at 𝑡𝑐𝑢𝑟 do
2. 𝑆𝑅𝑜 ← 𝑟𝑎𝑑𝑖𝑢𝑠(𝑟𝑒𝑞𝑛𝑒𝑤 . 𝑜)
3. 𝑉𝑐𝑁 ← 𝐺𝑒𝑡𝑉𝑒ℎ𝑖𝑐𝑙𝑒𝑠(𝑆𝑅𝑜, 𝑐𝑎𝑝𝑎𝑐𝑖𝑡𝑦)
4. for each vehicle 𝑣 ∈ 𝑉𝑐𝑁 do
5. 𝑣. 𝑐 ← 𝑐𝑎𝑝𝑎𝑐𝑖𝑡𝑦𝑚𝑎𝑥 − 𝑣. 𝑒𝑝
6. if 𝑣. 𝑐 equals 𝑐𝑎𝑝𝑎𝑐𝑖𝑡𝑦𝑚𝑎𝑥 then // cab is vacant
7. 𝑣. 𝐷𝑇𝑜𝑡𝑎𝑙 ← 𝑑𝑣.𝑙→𝑟𝑒𝑞𝑛𝑒𝑤.𝑜 + 𝑑𝑟𝑒𝑞𝑛𝑒𝑤.𝑜→𝑟𝑒𝑞𝑛𝑒𝑤.𝑑
8. 𝑣. 𝑡𝑑𝑎𝑣𝑔 ← 𝑇(𝑣. 𝑙, 𝑟𝑒𝑞𝑛𝑒𝑤 . 𝑜)
9. 𝑣. ∑ ∆𝑓𝑎𝑟𝑒 ← 0𝑖
10. 𝑣. ∆𝑃𝑟𝑜𝑓𝑖𝑡 ← 0
11. else // cab is occupied
12. 𝑇𝑑 ← {}; 𝐹𝑟 ← {}; 𝐹𝑒 ← {}
13. 𝑆 ← 𝑁𝑁𝑠𝑐ℎ𝑒𝑑𝑢𝑙𝑖𝑛𝑔 (𝑟𝑒𝑞𝑛𝑒𝑤 , 𝑠𝑣)
14. 𝑣. 𝐷𝑇𝑜𝑡𝑎𝑙 ← 𝐺𝑒𝑡𝐷𝑖𝑠𝑡𝑎𝑛𝑐𝑒 (𝑅𝑜𝑢𝑡𝑒𝑆)
15. 𝐷𝑅 ← 𝐴𝑔𝑔𝑟𝑒𝑔𝑎𝑡𝑒 𝐼𝑛𝑑𝑖𝑣𝑖𝑑𝑢𝑎𝑙 𝑅𝑜𝑢𝑡𝑒 𝐷𝑖𝑠𝑡𝑎𝑛𝑐𝑒(𝑟𝑒𝑞𝑛𝑒𝑤 , 𝑠𝑣)
16. if 𝐷𝑅 − 𝑣. 𝐷𝑇𝑜𝑡𝑎𝑙 < 0 then
17. 𝑉𝑐𝑁 ← 𝑉𝑐
𝑁 − {𝑣}
18. else
19. for each request 𝑟𝑒𝑞 ∈ {𝑟𝑒𝑞𝑛𝑒𝑤} ∪ 𝑣. 𝐸𝐷 do
20. 𝑡𝑑 ← 𝑠𝑑𝑡 − 𝑒𝑑𝑡
21. if 𝑟𝑒𝑞 is 𝑛𝑒𝑤 then
22. 𝐹𝑎𝑟𝑒𝑅 ← 𝐶𝑎𝑙𝑐𝑢𝑙𝑎𝑡𝑒𝐹𝑎𝑟𝑒 using (15)
23. else
24. 𝐹𝑎𝑟𝑒𝑅 ← 𝐶𝑎𝑙𝑐𝑢𝑙𝑎𝑡𝑒𝐹𝑎𝑟𝑒 using (17)
25. end if
26. 𝐹𝑎𝑟𝑒𝐸 ← 𝐶𝑎𝑙𝑐𝑢𝑙𝑎𝑡𝑒𝐹𝑎𝑟𝑒 using (18)
27. 𝑇𝑑 ← 𝑇𝑑 . 𝑎𝑝𝑝𝑒𝑛𝑑( 𝑡𝑑)
28. 𝐹𝑟 ← 𝐹𝑟 . 𝑎𝑝𝑝𝑒𝑛𝑑(𝐹𝑎𝑟𝑒𝑅)
29. 𝐹𝑒 ← 𝐹𝑒. 𝑎𝑝𝑝𝑒𝑛𝑑(𝐹𝑎𝑟𝑒𝐸)
30. end for
31. 𝑣. 𝑡𝑑𝑎𝑣𝑔 ← 𝑀𝑒𝑎𝑛(𝑇𝑑)
32. 𝑣. ∑ ∆𝑓𝑎𝑟𝑒 ←𝑖 𝐹𝑟) − 𝑆𝑢𝑚(𝐹𝑒)
33. 𝑣. ∆𝑃𝑟𝑜𝑓𝑖𝑡 ← 𝑆𝑢𝑚(𝐹𝑒) − 𝑃𝑟𝑜𝑓𝑖𝑡𝑒𝑥𝑝
34. end if
35. end if
36. 𝑣. 𝐴𝑆 ← 𝑆𝑢𝑚(𝑣. 𝑐,1
𝑣.𝐷𝑇𝑜𝑡𝑎𝑙,
1
𝑣.𝑡𝑑𝑎𝑣𝑔, 𝑣. ∑ ∆𝑓𝑎𝑟𝑒𝑖 𝑖
, 𝑣. ∆𝑃𝑟𝑜𝑓𝑖𝑡)
37. end for
38. recommend vehicle with max 𝑣. 𝐴𝑆
39. end for
Once all the parameters have been calculated for each
passenger; average time delay, total fare reduction, and
profit increment associated with occupied vehicle is
calculated (Line 31-Line 33). Line 36 calculates an
aggregated score on the basis of all the calculated
parameters. The candidate vehicle with highest aggregated
score is recommended to the requesting passenger (Line 38).
V. PERFORMANCE EVALUATION
In this section, we perform the experimental validation of our proposed heuristic based vehicle recommendation framework HASVR.
A. EXPERIMENTAL SETTINGS
We have created a customized simulation framework in R programming language and utilized gmapsdistance
[25]
package. The framework is capable of visualizing all
simulation modules (e.g., tracking vehicles and ride requests).
We have conducted trace driven experimental analysis using
T-Drive trajectory data sample [13]. The dataset contains GPS
trajectories of 10,357 taxis of Beijing during the period of
February 2 to February 8, 2008. We draw a sample with one
day GPS traces of 250 taxis from the dataset to test our
recommendation system. The framework takes as input a total
of real-world 61,136 taxicab traces. From the dataset, we
generate a passenger request (request time, origin, and
destination) using uniform and Poisson distribution.
B. INITIAL TAXI STATES
The timestamp and location of taxis at the corresponding
timestamp is taken from the GPS traces. However, the number
of existing passengers in a taxi at a certain timestamp is
randomly chosen between 0 and 𝑐𝑎𝑝𝑎𝑐𝑖𝑡𝑦𝑚𝑎𝑥 . The trajectory
Current location of vehicle 𝑣 Destination of passenger 𝑃1
P 𝑃1 Origin of passenger 𝑃2 Destination of passenger 𝑃2
P 𝑃1Shared Route Individual Route
6
4 1.5
1
2
With Sharing
4
1
2
0.5
2.5
Without Sharing
𝒗 = {𝑷𝟏}
(a)
𝒗 = {𝑷𝟏}
(b)
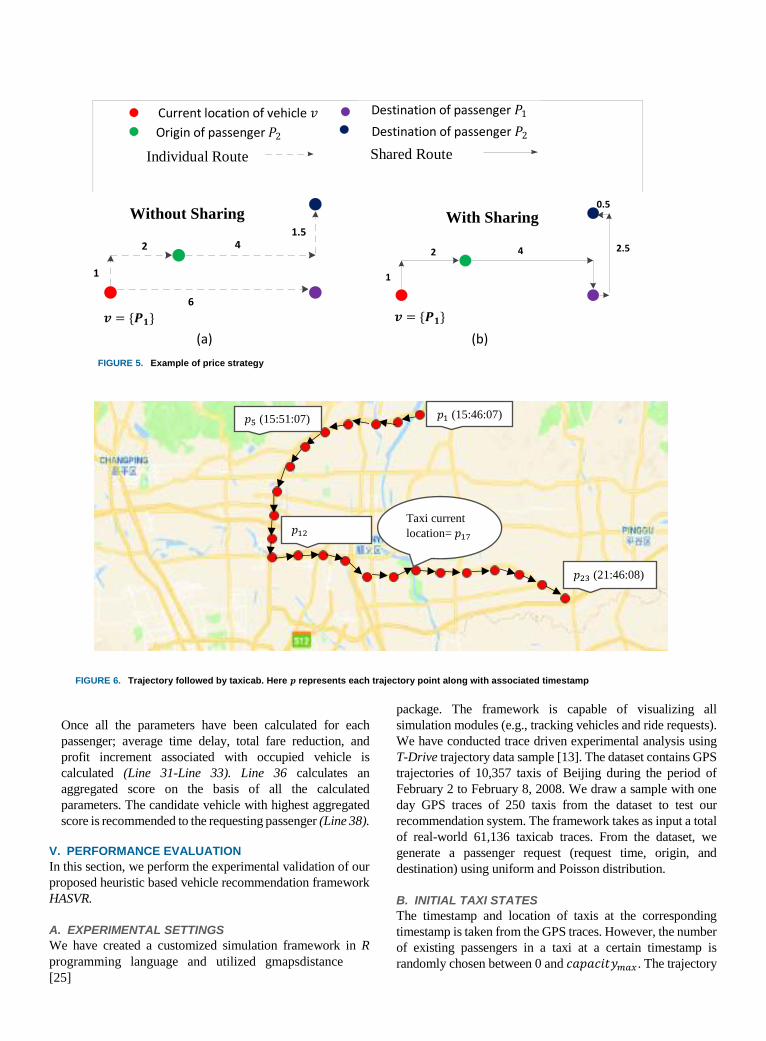
FIGURE 5. Example of price strategy
FIGURE 6. Trajectory followed by taxicab. Here 𝒑 represents each trajectory point along with associated timestamp
𝑝1 (15:46:07) 15:46:07
𝑝5 (15:51:07)
𝑝12
(17:46:07)
𝑝23 (21:46:08)
Taxi current
location= 𝑝17
points of each taxicab in the dataset are arranged with respect
to ascending order of timestamps. This feature of T-Drive
dataset helps to determine the direction of each taxi’s traversal.
Each trajectory point 𝑝 in the dataset is followed by the points
that are in forward direction to 𝑝. Therefore, the destination of
existing passengers in a taxicab can be selected from the taxi’s
trajectory points that are in forward direction to taxicab’s
current location. Fig. 6 shows a trajectory followed by a
taxicab. For example in Fig. 6, at arrival time of new request,
taxi’s current location is 𝑝17; so the destination of an existing
passenger can be selected on the same path as 𝑝23. To show the effectiveness of our proposed unified and
dynamic carpooling service (recommended vehicle can be
occupied or vacant); we compare our proposed approach,
namely Highest Aggregated Score Vehicle Recommendation
(HASVR) with Nearest Vehicle Recommendation (NVR), and
No-Carpooling. We also compare our fare calculation model
with the win-win fare model of coRide [10] to evaluate the
maximum fare reduction of an individual passenger. NVR is a
heuristic approach that first extracts the occupied vehicles with
∆𝐷𝑇 < 0 from nearby set 𝑉𝑐𝑁and then greedily recommends
the nearest vehicle to the passengers to minimize their waiting
time. In No-Carpooling system, each requesting passenger is
recommended a vacant vehicle from the set 𝑉𝑐𝑁. A ride request
may be rejected if the system cannot find a vacant vehicle at
the requested time. The passenger may resend the request to
get the recommended vehicle.
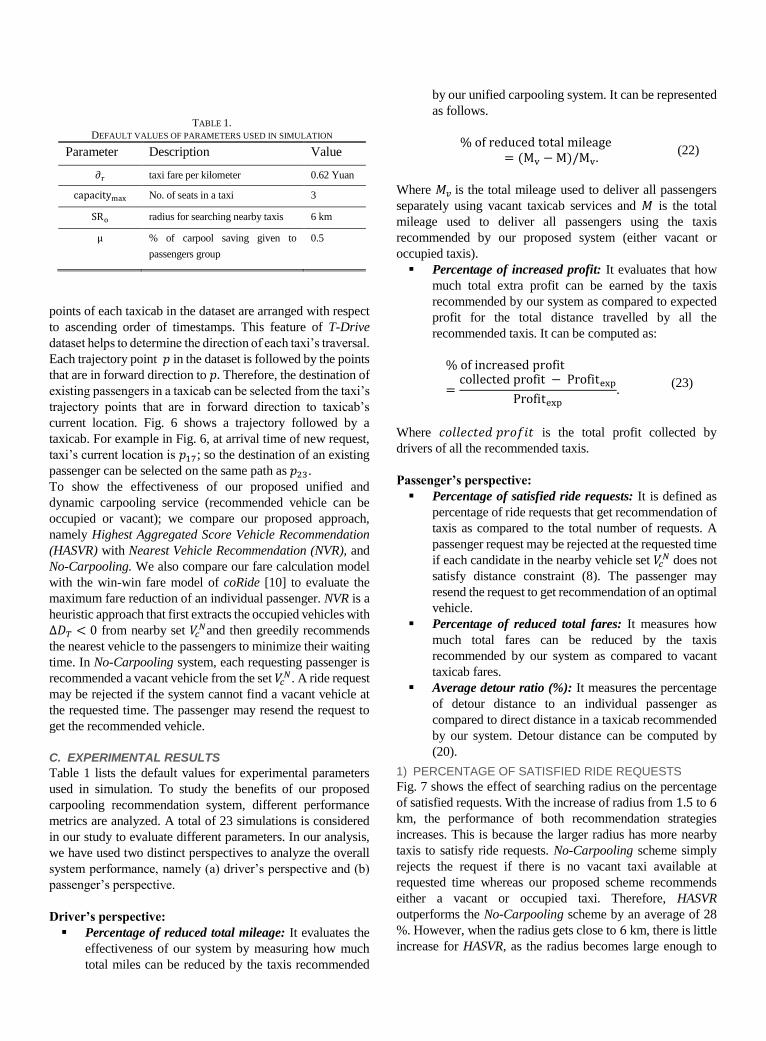
C. EXPERIMENTAL RESULTS
Table 1 lists the default values for experimental parameters
used in simulation. To study the benefits of our proposed
carpooling recommendation system, different performance
metrics are analyzed. A total of 23 simulations is considered
in our study to evaluate different parameters. In our analysis,
we have used two distinct perspectives to analyze the overall
system performance, namely (a) driver’s perspective and (b)
passenger’s perspective.
Driver’s perspective:
Percentage of reduced total mileage: It evaluates the
effectiveness of our system by measuring how much
total miles can be reduced by the taxis recommended
by our unified carpooling system. It can be represented
as follows.
% of reduced total mileage= (Mv − M)/Mv.
(22)
Where 𝑀𝑣 is the total mileage used to deliver all passengers
separately using vacant taxicab services and 𝑀 is the total
mileage used to deliver all passengers using the taxis
recommended by our proposed system (either vacant or
occupied taxis). Percentage of increased profit: It evaluates that how
much total extra profit can be earned by the taxis
recommended by our system as compared to expected
profit for the total distance travelled by all the
recommended taxis. It can be computed as:
% of increased profit
=collected profit − Profitexp
Profitexp
. (23)
Where 𝑐𝑜𝑙𝑙𝑒𝑐𝑡𝑒𝑑 𝑝𝑟𝑜𝑓𝑖𝑡 is the total profit collected by
drivers of all the recommended taxis.
Passenger’s perspective:
Percentage of satisfied ride requests: It is defined as
percentage of ride requests that get recommendation of
taxis as compared to the total number of requests. A
passenger request may be rejected at the requested time
if each candidate in the nearby vehicle set 𝑉𝑐𝑁 does not
satisfy distance constraint (8). The passenger may
resend the request to get recommendation of an optimal
vehicle.
Percentage of reduced total fares: It measures how
much total fares can be reduced by the taxis
recommended by our system as compared to vacant
taxicab fares.
Average detour ratio (%): It measures the percentage
of detour distance to an individual passenger as
compared to direct distance in a taxicab recommended
by our system. Detour distance can be computed by
(20).
1) PERCENTAGE OF SATISFIED RIDE REQUESTS
Fig. 7 shows the effect of searching radius on the percentage
of satisfied requests. With the increase of radius from 1.5 to 6km, the performance of both recommendation strategies
increases. This is because the larger radius has more nearby
taxis to satisfy ride requests. No-Carpooling scheme simply
rejects the request if there is no vacant taxi available at
requested time whereas our proposed scheme recommends
either a vacant or occupied taxi. Therefore, HASVR
outperforms the No-Carpooling scheme by an average of 28
%. However, when the radius gets close to 6 km, there is little
increase for HASVR, as the radius becomes large enough to
TABLE 1.
DEFAULT VALUES OF PARAMETERS USED IN SIMULATION
Parameter Description Value
∂r taxi fare per kilometer 0.62 Yuan
capacitymax No. of seats in a taxi 3
SRo radius for searching nearby taxis 6 km
μ % of carpool saving given to
passengers group
0.5

have sufficient nearby taxis and increasing the radius further
does not improve the performance.
2) PERCENTAGE OF REDUCED TOTAL MILEAGE
Fig. 8 (a) shows the impact of number of taxis in the dataset
on the percentage of reduced miles by keeping the searching
radius constant. With the increase of taxis from 50 to 250 the
performance of HASVR increases since increasing the
number of taxis in the dataset increases the probability of
finding an optimal taxi in terms of reduced mileage. However,
NVR shows a fluctuation in performance. This behavior is due
to the fact that increasing the taxis in the dataset finds the
closer taxi to the request origin but that taxi may or may not
be optimal in terms of reduced mileage.
HASVR outperforms NVR by 9 % on average and in
comparison to No-Carpooling, it performs better by 27 % on average. The difference in performance of HASVR and NVR
is due to the fact that requesting passenger’s origin and
destination may not match to the destinations of existing
passengers in the nearest cab, since NVR only considers
waiting time of passengers while recommending cabs.
Fig. 8 (b) shows the impact of searching radius on the
percentage of reduced miles by keeping the number of taxis
constant. The performance of NVR stays constant as it always
recommends the nearest taxi from the nearby taxi set. At first,
the performance of HASVR and NVR stays the same, then
HASVR starts to perform better than NVR as the radius
increases from 3 km. HASVR outperforms NVR by 5 % and as
compared to No-Carpooling, its performance is better by an
average of 27 %. Therefore, we conclude that increasing the
number of taxis or increasing the searching radius, increases
the number of taxis in the nearby set, thereby increasing the
probability of finding the most appropriate taxi.
Fig. 8 (c) shows the impact of hours of the day on the
percentage of reduced miles. For instance, λ = 9 represents
the arrival time of requests around 9 am. During rush hours of
the day e.g., 9 and 15, the percentage of reduced mileage is
higher as compared to non-rush hours e.g., 3 and 21 for
HASVR. This difference is due to the fact that during rush
hours, vacant taxicabs become deficient and hence more
occupied taxis are recommended to passengers leading to
higher reduction of total mileage. As compared to No-
Carpooling, HASVR outperforms during rush hours by an
average of 17% and during non-rush hours it surpasses by
12% on average. However, NVR does not differentiate
between rush and non-rush hours as it applies heuristics of
nearest taxi for recommendation.
3) PERCENTAGE OF REDUCED FARES
Fig. 9 (a) illustrates the effect of different values of sharing
percentage 𝜇 on the percentage of total fare reduction. When
𝜇 increases from 0.1 to 0.9, more share of total carpool saving
is given to passengers group. Therefore, both 𝐻𝐴𝑆𝑉𝑅 and
NVR show an increasing trend. However, the %-age of total
fare reduction for NVR is less as compared to 𝐻𝐴𝑆𝑉𝑅 since
NVR does not consider fare reduction of passengers while
recommending a taxicab.
We evaluate the performance of HASVR in terms of
maximum fare saving for an individual passenger as compared
to win-win fare model of coRide [10] in Fig. 9 (b). Both
schemes provide 0 % fare saving when number of passenger
is 1 (when passenger travels alone). The performance of both
schemes increases as we increase the number of passengers
sharing the ride. In coRide, with more number of passengers,
greater distance can be shared with other passengers,
therefore, leading to larger carpool benefit for individual fare
reduction. Since our scheme HASVR reduces each passenger’s
fare on the basis of detour distance, with greater number of
passengers in carpool, a passenger has to tolerate more detour
FIGURE 7. Percentage of satisfied ride
(c) Mean of Poisson distribution(b) Searching radius(a) No. of taxis in dataset
FIGURE 8. Percentage of reduced miles
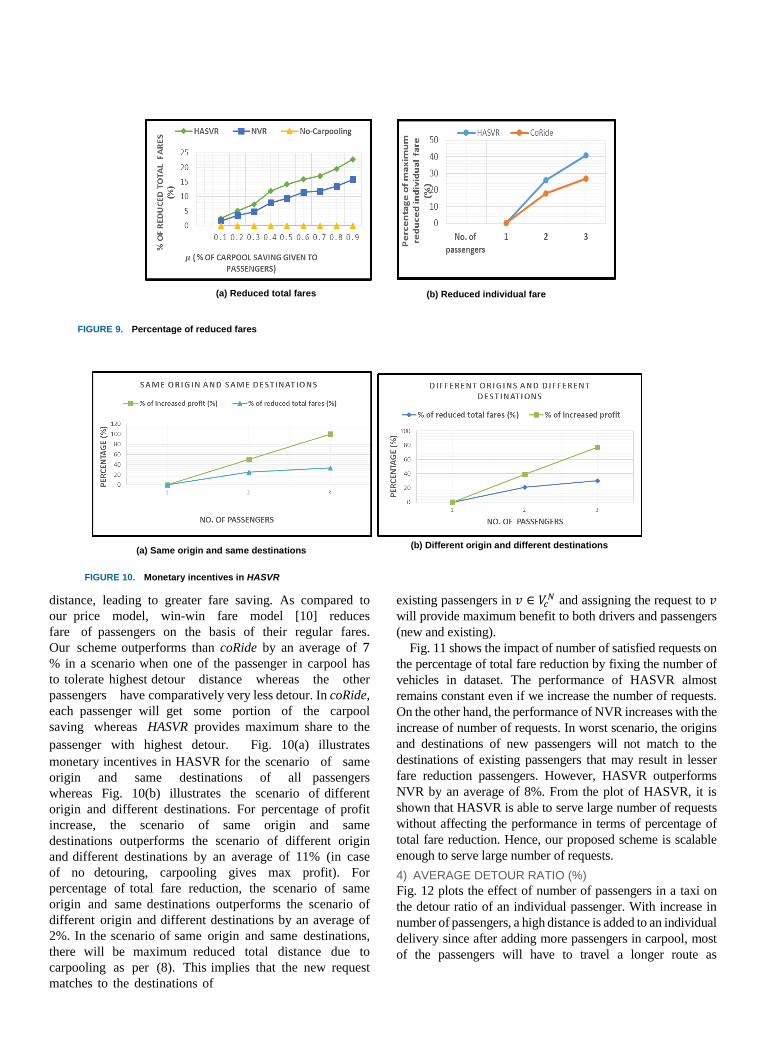
distance, leading to greater fare saving. As compared to
our price model, win-win fare model [10] reduces
fare of passengers on the basis of their regular fares.
Our scheme outperforms than coRide by an average of 7
% in a scenario when one of the passenger in carpool has
to tolerate highest detour distance whereas the other
passengers have comparatively very less detour. In coRide,
each passenger will get some portion of the carpool
saving whereas HASVR provides maximum share to the
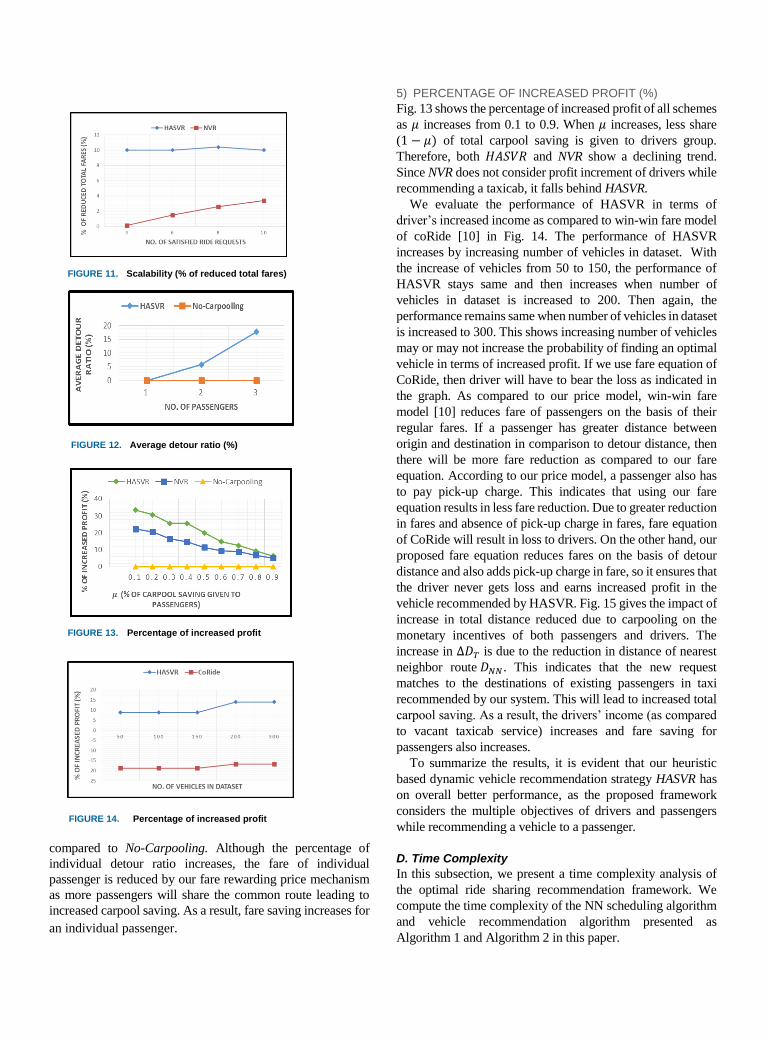
passenger with highest detour. Fig. 10(a) illustrates
monetary incentives in HASVR for the scenario of same
origin and same destinations of all passengers
whereas Fig. 10(b) illustrates the scenario of different
origin and different destinations. For percentage of profit
increase, the scenario of same origin and same
destinations outperforms the scenario of different origin
and different destinations by an average of 11% (in case
of no detouring, carpooling gives max profit). For
percentage of total fare reduction, the scenario of same
origin and same destinations outperforms the scenario of
different origin and different destinations by an average of
2%. In the scenario of same origin and same destinations,
there will be maximum reduced total distance due to
carpooling as per (8). This implies that the new request
matches to the destinations of
existing passengers in 𝑣 ∈ 𝑉𝑐𝑁 and assigning the request to 𝑣
will provide maximum benefit to both drivers and passengers
(new and existing).
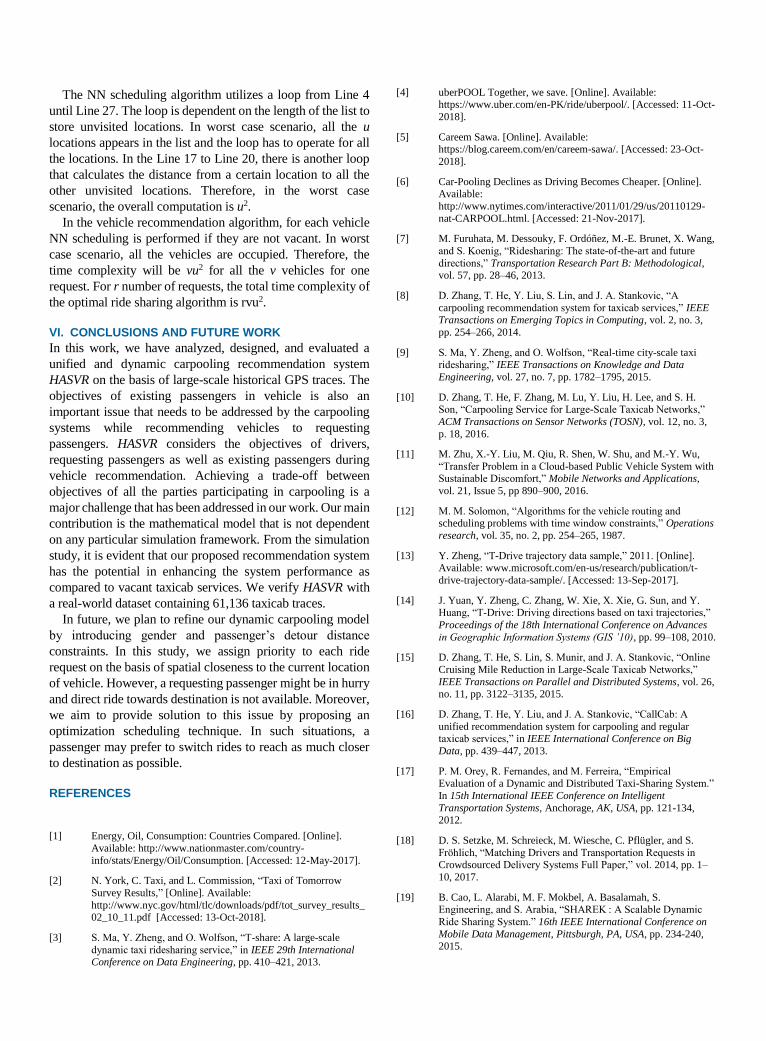
Fig. 11 shows the impact of number of satisfied requests on
the percentage of total fare reduction by fixing the number of
vehicles in dataset. The performance of HASVR almost
remains constant even if we increase the number of requests.
On the other hand, the performance of NVR increases with the increase of number of requests. In worst scenario, the origins
and destinations of new passengers will not match to the
destinations of existing passengers that may result in lesser
fare reduction passengers. However, HASVR outperforms
NVR by an average of 8%. From the plot of HASVR, it is
shown that HASVR is able to serve large number of requests
without affecting the performance in terms of percentage of
total fare reduction. Hence, our proposed scheme is scalable
enough to serve large number of requests.
4) AVERAGE DETOUR RATIO (%)
Fig. 12 plots the effect of number of passengers in a taxi on
the detour ratio of an individual passenger. With increase in
number of passengers, a high distance is added to an individual
delivery since after adding more passengers in carpool, most
of the passengers will have to travel a longer route as
(b) Reduced individual fare (a) Reduced total fares
FIGURE 9. Percentage of reduced fares
FIGURE 10. Monetary incentives in HASVR
(a) Same origin and same destinations (b) Different origin and different destinations
compared to No-Carpooling. Although the percentage of
individual detour ratio increases, the fare of individual
passenger is reduced by our fare rewarding price mechanism
as more passengers will share the common route leading to
increased carpool saving. As a result, fare saving increases for
an individual passenger.
5) PERCENTAGE OF INCREASED PROFIT (%)
Fig. 13 shows the percentage of increased profit of all schemes
as 𝜇 increases from 0.1 to 0.9. When 𝜇 increases, less share
(1 − 𝜇) of total carpool saving is given to drivers group.
Therefore, both 𝐻𝐴𝑆𝑉𝑅 and NVR show a declining trend.
Since NVR does not consider profit increment of drivers while
recommending a taxicab, it falls behind HASVR.
We evaluate the performance of HASVR in terms of
driver’s increased income as compared to win-win fare model
of coRide [10] in Fig. 14. The performance of HASVR
increases by increasing number of vehicles in dataset. With
the increase of vehicles from 50 to 150, the performance of
HASVR stays same and then increases when number of
vehicles in dataset is increased to 200. Then again, the
performance remains same when number of vehicles in dataset
is increased to 300. This shows increasing number of vehicles
may or may not increase the probability of finding an optimal
vehicle in terms of increased profit. If we use fare equation of
CoRide, then driver will have to bear the loss as indicated in
the graph. As compared to our price model, win-win fare
model [10] reduces fare of passengers on the basis of their
regular fares. If a passenger has greater distance between
origin and destination in comparison to detour distance, then
there will be more fare reduction as compared to our fare
equation. According to our price model, a passenger also has
to pay pick-up charge. This indicates that using our fare
equation results in less fare reduction. Due to greater reduction
in fares and absence of pick-up charge in fares, fare equation
of CoRide will result in loss to drivers. On the other hand, our
proposed fare equation reduces fares on the basis of detour
distance and also adds pick-up charge in fare, so it ensures that
the driver never gets loss and earns increased profit in the
vehicle recommended by HASVR. Fig. 15 gives the impact of
increase in total distance reduced due to carpooling on the
monetary incentives of both passengers and drivers. The
increase in ∆𝐷𝑇 is due to the reduction in distance of nearest
neighbor route 𝐷𝑁𝑁. This indicates that the new request
matches to the destinations of existing passengers in taxi
recommended by our system. This will lead to increased total
carpool saving. As a result, the drivers’ income (as compared
to vacant taxicab service) increases and fare saving for
passengers also increases.
To summarize the results, it is evident that our heuristic
based dynamic vehicle recommendation strategy HASVR has
on overall better performance, as the proposed framework
considers the multiple objectives of drivers and passengers
while recommending a vehicle to a passenger.
D. Time Complexity
In this subsection, we present a time complexity analysis of
the optimal ride sharing recommendation framework. We
compute the time complexity of the NN scheduling algorithm
and vehicle recommendation algorithm presented as
Algorithm 1 and Algorithm 2 in this paper.
FIGURE 13. Percentage of increased profit
FIGURE 12. Average detour ratio (%)
FIGURE 11. Scalability (% of reduced total fares)
FIGURE 14. Percentage of increased profit
The NN scheduling algorithm utilizes a loop from Line 4
until Line 27. The loop is dependent on the length of the list to
store unvisited locations. In worst case scenario, all the u
locations appears in the list and the loop has to operate for all
the locations. In the Line 17 to Line 20, there is another loop
that calculates the distance from a certain location to all the
other unvisited locations. Therefore, in the worst case
scenario, the overall computation is u2.
In the vehicle recommendation algorithm, for each vehicle
NN scheduling is performed if they are not vacant. In worst
case scenario, all the vehicles are occupied. Therefore, the
time complexity will be vu2 for all the v vehicles for one
request. For r number of requests, the total time complexity of
the optimal ride sharing algorithm is rvu2.
VI. CONCLUSIONS AND FUTURE WORK
In this work, we have analyzed, designed, and evaluated a
unified and dynamic carpooling recommendation system
HASVR on the basis of large-scale historical GPS traces. The
objectives of existing passengers in vehicle is also an
important issue that needs to be addressed by the carpooling
systems while recommending vehicles to requesting
passengers. HASVR considers the objectives of drivers,
requesting passengers as well as existing passengers during
vehicle recommendation. Achieving a trade-off between
objectives of all the parties participating in carpooling is a
major challenge that has been addressed in our work. Our main
contribution is the mathematical model that is not dependent
on any particular simulation framework. From the simulation
study, it is evident that our proposed recommendation system
has the potential in enhancing the system performance as
compared to vacant taxicab services. We verify HASVR with
a real-world dataset containing 61,136 taxicab traces.
In future, we plan to refine our dynamic carpooling model
by introducing gender and passenger’s detour distance
constraints. In this study, we assign priority to each ride
request on the basis of spatial closeness to the current location
of vehicle. However, a requesting passenger might be in hurry
and direct ride towards destination is not available. Moreover,
we aim to provide solution to this issue by proposing an
optimization scheduling technique. In such situations, a
passenger may prefer to switch rides to reach as much closer
to destination as possible.
REFERENCES
[1] Energy, Oil, Consumption: Countries Compared. [Online].
Available: http://www.nationmaster.com/country-
info/stats/Energy/Oil/Consumption. [Accessed: 12-May-2017].
[2] N. York, C. Taxi, and L. Commission, “Taxi of Tomorrow
Survey Results,” [Online]. Available:
http://www.nyc.gov/html/tlc/downloads/pdf/tot_survey_results_02_10_11.pdf [Accessed: 13-Oct-2018].
[3] S. Ma, Y. Zheng, and O. Wolfson, “T-share: A large-scale
dynamic taxi ridesharing service,” in IEEE 29th InternationalConference on Data Engineering, pp. 410–421, 2013.
[4] uberPOOL Together, we save. [Online]. Available: https://www.uber.com/en-PK/ride/uberpool/. [Accessed: 11-Oct-
2018].
[5] Careem Sawa. [Online]. Available: https://blog.careem.com/en/careem-sawa/. [Accessed: 23-Oct-
2018].
[6] Car-Pooling Declines as Driving Becomes Cheaper. [Online].Available:
http://www.nytimes.com/interactive/2011/01/29/us/20110129-
nat-CARPOOL.html. [Accessed: 21-Nov-2017].
[7] M. Furuhata, M. Dessouky, F. Ordóñez, M.-E. Brunet, X. Wang,
and S. Koenig, “Ridesharing: The state-of-the-art and future
directions,” Transportation Research Part B: Methodological, vol. 57, pp. 28–46, 2013.
[8] D. Zhang, T. He, Y. Liu, S. Lin, and J. A. Stankovic, “A
carpooling recommendation system for taxicab services,” IEEETransactions on Emerging Topics in Computing, vol. 2, no. 3,
pp. 254–266, 2014.
[9] S. Ma, Y. Zheng, and O. Wolfson, “Real-time city-scale taxiridesharing,” IEEE Transactions on Knowledge and Data
Engineering, vol. 27, no. 7, pp. 1782–1795, 2015.
[10] D. Zhang, T. He, F. Zhang, M. Lu, Y. Liu, H. Lee, and S. H.Son, “Carpooling Service for Large-Scale Taxicab Networks,”
ACM Transactions on Sensor Networks (TOSN), vol. 12, no. 3,
p. 18, 2016.
[11] M. Zhu, X.-Y. Liu, M. Qiu, R. Shen, W. Shu, and M.-Y. Wu,
“Transfer Problem in a Cloud-based Public Vehicle System withSustainable Discomfort,” Mobile Networks and Applications,
vol. 21, Issue 5, pp 890–900, 2016.
[12] M. M. Solomon, “Algorithms for the vehicle routing and scheduling problems with time window constraints,” Operations
research, vol. 35, no. 2, pp. 254–265, 1987.
[13] Y. Zheng, “T-Drive trajectory data sample,” 2011. [Online].
Available: www.microsoft.com/en-us/research/publication/t-
drive-trajectory-data-sample/. [Accessed: 13-Sep-2017].
[14] J. Yuan, Y. Zheng, C. Zhang, W. Xie, X. Xie, G. Sun, and Y.Huang, “T-Drive: Driving directions based on taxi trajectories,”
Proceedings of the 18th International Conference on Advances
in Geographic Information Systems (GIS ’10), pp. 99–108, 2010.
[15] D. Zhang, T. He, S. Lin, S. Munir, and J. A. Stankovic, “Online
Cruising Mile Reduction in Large-Scale Taxicab Networks,”
IEEE Transactions on Parallel and Distributed Systems, vol. 26, no. 11, pp. 3122–3135, 2015.
[16] D. Zhang, T. He, Y. Liu, and J. A. Stankovic, “CallCab: A
unified recommendation system for carpooling and regular taxicab services,” in IEEE International Conference on Big
Data, pp. 439–447, 2013.
[17] P. M. Orey, R. Fernandes, and M. Ferreira, “Empirical Evaluation of a Dynamic and Distributed Taxi-Sharing System.”
In 15th International IEEE Conference on Intelligent
Transportation Systems, Anchorage, AK, USA, pp. 121-134,2012.
[18] D. S. Setzke, M. Schreieck, M. Wiesche, C. Pflügler, and S.
Fröhlich, “Matching Drivers and Transportation Requests in Crowdsourced Delivery Systems Full Paper,” vol. 2014, pp. 1–
10, 2017.
[19] B. Cao, L. Alarabi, M. F. Mokbel, A. Basalamah, S. Engineering, and S. Arabia, “SHAREK : A Scalable Dynamic
Ride Sharing System.” 16th IEEE International Conference on
Mobile Data Management, Pittsburgh, PA, USA, pp. 234-240, 2015.
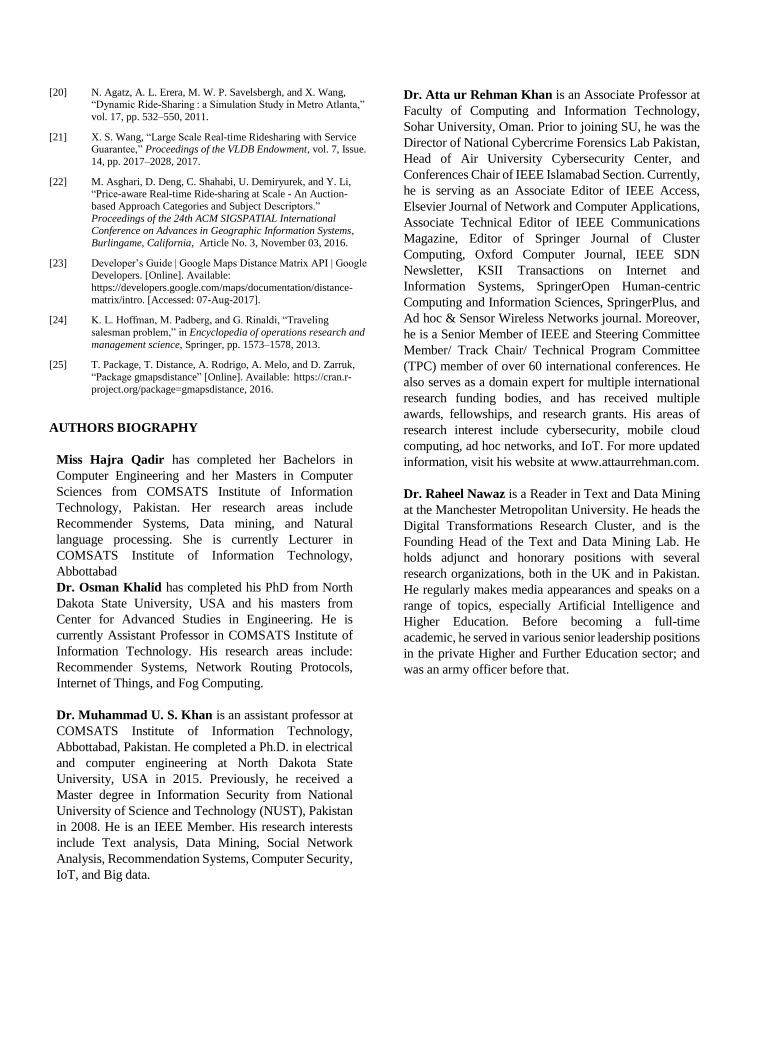
[20] N. Agatz, A. L. Erera, M. W. P. Savelsbergh, and X. Wang,“Dynamic Ride-Sharing : a Simulation Study in Metro Atlanta,”
vol. 17, pp. 532–550, 2011.
[21] X. S. Wang, “Large Scale Real-time Ridesharing with Service Guarantee,” Proceedings of the VLDB Endowment, vol. 7, Issue.
14, pp. 2017–2028, 2017.
[22] M. Asghari, D. Deng, C. Shahabi, U. Demiryurek, and Y. Li,“Price-aware Real-time Ride-sharing at Scale - An Auction-
based Approach Categories and Subject Descriptors.”
Proceedings of the 24th ACM SIGSPATIAL InternationalConference on Advances in Geographic Information Systems,
Burlingame, California, Article No. 3, November 03, 2016.
[23] Developer’s Guide | Google Maps Distance Matrix API | Google Developers. [Online]. Available:
https://developers.google.com/maps/documentation/distance-
matrix/intro. [Accessed: 07-Aug-2017].
[24] K. L. Hoffman, M. Padberg, and G. Rinaldi, “Traveling
salesman problem,” in Encyclopedia of operations research and
management science, Springer, pp. 1573–1578, 2013.
[25] T. Package, T. Distance, A. Rodrigo, A. Melo, and D. Zarruk,
“Package gmapsdistance” [Online]. Available: https://cran.r-
project.org/package=gmapsdistance, 2016.
AUTHORS BIOGRAPHY
Miss Hajra Qadir has completed her Bachelors in
Computer Engineering and her Masters in Computer
Sciences from COMSATS Institute of Information
Technology, Pakistan. Her research areas include
Recommender Systems, Data mining, and Natural
language processing. She is currently Lecturer in
COMSATS Institute of Information Technology,
Abbottabad
Dr. Osman Khalid has completed his PhD from North
Dakota State University, USA and his masters from
Center for Advanced Studies in Engineering. He is
currently Assistant Professor in COMSATS Institute of
Information Technology. His research areas include:
Recommender Systems, Network Routing Protocols,
Internet of Things, and Fog Computing.
Dr. Muhammad U. S. Khan is an assistant professor at
COMSATS Institute of Information Technology,
Abbottabad, Pakistan. He completed a Ph.D. in electrical
and computer engineering at North Dakota State
University, USA in 2015. Previously, he received a
Master degree in Information Security from National
University of Science and Technology (NUST), Pakistan
in 2008. He is an IEEE Member. His research interests
include Text analysis, Data Mining, Social Network
Analysis, Recommendation Systems, Computer Security,
IoT, and Big data.
Dr. Atta ur Rehman Khan is an Associate Professor at
Faculty of Computing and Information Technology,
Sohar University, Oman. Prior to joining SU, he was the
Director of National Cybercrime Forensics Lab Pakistan,
Head of Air University Cybersecurity Center, and
Conferences Chair of IEEE Islamabad Section. Currently,
he is serving as an Associate Editor of IEEE Access,
Elsevier Journal of Network and Computer Applications,
Associate Technical Editor of IEEE Communications
Magazine, Editor of Springer Journal of Cluster
Computing, Oxford Computer Journal, IEEE SDN
Newsletter, KSII Transactions on Internet and
Information Systems, SpringerOpen Human-centric
Computing and Information Sciences, SpringerPlus, and
Ad hoc & Sensor Wireless Networks journal. Moreover,
he is a Senior Member of IEEE and Steering Committee
Member/ Track Chair/ Technical Program Committee
(TPC) member of over 60 international conferences. He
also serves as a domain expert for multiple international
research funding bodies, and has received multiple
awards, fellowships, and research grants. His areas of
research interest include cybersecurity, mobile cloud
computing, ad hoc networks, and IoT. For more updated
information, visit his website at www.attaurrehman.com.
Dr. Raheel Nawaz is a Reader in Text and Data Mining
at the Manchester Metropolitan University. He heads the
Digital Transformations Research Cluster, and is the
Founding Head of the Text and Data Mining Lab. He
holds adjunct and honorary positions with several
research organizations, both in the UK and in Pakistan.
He regularly makes media appearances and speaks on a
range of topics, especially Artificial Intelligence and
Higher Education. Before becoming a full-time
academic, he served in various senior leadership positions
in the private Higher and Further Education sector; and
was an army officer before that.
Related Documents