HAL Id: hal-00069267 https://hal.archives-ouvertes.fr/hal-00069267 Submitted on 12 Aug 2021 HAL is a multi-disciplinary open access archive for the deposit and dissemination of sci- entific research documents, whether they are pub- lished or not. The documents may come from teaching and research institutions in France or abroad, or from public or private research centers. L’archive ouverte pluridisciplinaire HAL, est destinée au dépôt et à la diffusion de documents scientifiques de niveau recherche, publiés ou non, émanant des établissements d’enseignement et de recherche français ou étrangers, des laboratoires publics ou privés. Distributed under a Creative Commons Attribution| 4.0 International License An Observational Study of the Mesoscale Mistral Dynamics Vincent Guenard, Philippe Drobinski, Jean-Luc Caccia, Bernard Campistron, Bruno Bench To cite this version: Vincent Guenard, Philippe Drobinski, Jean-Luc Caccia, Bernard Campistron, Bruno Bench. An Ob- servational Study of the Mesoscale Mistral Dynamics. Boundary-Layer Meteorology, Springer Verlag, 2005, 115 (2), pp.263-288. 10.1007/s10546-004-3406-z. hal-00069267

Welcome message from author
This document is posted to help you gain knowledge. Please leave a comment to let me know what you think about it! Share it to your friends and learn new things together.
Transcript

HAL Id: hal-00069267https://hal.archives-ouvertes.fr/hal-00069267
Submitted on 12 Aug 2021
HAL is a multi-disciplinary open accessarchive for the deposit and dissemination of sci-entific research documents, whether they are pub-lished or not. The documents may come fromteaching and research institutions in France orabroad, or from public or private research centers.
L’archive ouverte pluridisciplinaire HAL, estdestinée au dépôt et à la diffusion de documentsscientifiques de niveau recherche, publiés ou non,émanant des établissements d’enseignement et derecherche français ou étrangers, des laboratoirespublics ou privés.
Distributed under a Creative Commons Attribution| 4.0 International License
An Observational Study of the Mesoscale MistralDynamics
Vincent Guenard, Philippe Drobinski, Jean-Luc Caccia, Bernard Campistron,Bruno Bench
To cite this version:Vincent Guenard, Philippe Drobinski, Jean-Luc Caccia, Bernard Campistron, Bruno Bench. An Ob-servational Study of the Mesoscale Mistral Dynamics. Boundary-Layer Meteorology, Springer Verlag,2005, 115 (2), pp.263-288. �10.1007/s10546-004-3406-z�. �hal-00069267�

AN OBSERVATIONAL STUDY OF THE MESOSCALE MISTRAL
DYNAMICS
VINCENT GUENARD1,*, PHILIPPE DROBINSKI2, JEAN-LUC CACCIA3,
BERNARD CAMPISTRON4 and BRUNO BENECH4
1LSEET-LEPI, CNRS, Universite Sud Toulon-Var, La Garde, France; 2SA, CNRS, Institut
Pierre Simon Laplace, Paris, France; 3LSEET-LEPI, CNRS, Universite Sud Toulon-Var, La
Garde, France; 4LA, CNRS, Observatoire Midi-Pyrenees, Universite Paul Sabatier,
Campistrous, France
Abstract. We investigate the mesoscale dynamics of the mistral through the wind profiler
observations of the MAP (autumn 1999) and ESCOMPTE (summer 2001) field campaigns.
We show that the mistral wind field can dramatically change on a time scale less than 3 hours.
Transitions from a deep to a shallow mistral are often observed at any season when the lower
layers are stable. The variability, mainly attributed in summer to the mistral/land–sea breeze
interactions on a 10-km scale, is highlighted by observations from the wind profiler network
set up during ESCOMPTE. The interpretations of the dynamical mistral structure are per-
formed through comparisons with existing basic theories. The linear theory of R. B. Smith
[Advances in Geophysics, Vol. 31, 1989, Academic Press, 1–41] and the shallow water theory
[Schar, C. and Smith, R. B.: 1993a, J. Atmos. Sci. 50, 1373–1400] give some complementary
explanations for the deep-to-shallow transition especially for the MAP mistral event. The
wave breaking process induces a low-level jet (LLJ) downstream of the Alps that degenerates
into a mountain wake, which in turn provokes the cessation of the mistral downstream of the
Alps. Both theories indicate that the flow splits around the Alps and results in a persistent LLJ
at the exit of the Rhone valley. The LLJ is strengthened by the channelling effect of the Rhone
valley that is more efficient for north-easterly than northerly upstream winds despite the
north–south valley axis. Summer moderate and weak mistral episodes are influenced by land–
sea breezes and convection over land that induce a very complex interaction that cannot be
accurately described by the previous theories.
Keywords: Atmospheric boundary layer, Gap flow, Linear theory, Mistral, Shallow water
theory, UHF wind profiler.
1. Introduction
The mistral is a northerly, low-level, orography-induced, cold-air outbreak
over the north-western Mediterranean. It accompanies cold and dry conti-
nental air masses and restores clear sky conditions after the passage of a cold
front over Provence (south-eastern France). During summer, it accelerates
ground drying and is responsible for the propagation of devastating forest
fires (Wrathall, 1985). Furthermore, mistral gusts can cause severe damage to
* E-mail: [email protected]
1

farm plantations, hazardous conditions for aviation and ship navigation
(Mayencon, 1982) and increased forest fire risks. It is frequently observed to
extend as far as a few hundred kilometres from the coast. Its thermodynamics
favour intense air-sea exchange (Flamant, 2003). It lowers the sea surface
temperature (Millot, 1979) and forms the western Mediterranean deep water
that moves into the Atlantic Ocean (Rhein, 1995). It also affects the dilution
of pollutant species released by industrial plants located along the Rhone
valley and near Marseille (Corsmeier et al., 2004).
North-westerly to north-easterly flows that impinge on the Alpine range
are dynamically blocked by the ridge and a lee cyclone develops in the Gulf
of Genoa. The resulting flow is substantially accelerated in the Rhone valley
that separates the French Alps (highest elevation, 4807 m) from the Massif
Central (highest elevation, 1885 m) by a gap 200 km long and 60 km wide
(Figure 1). The flow in the southern part of the Rhone is referred as the
mistral.
The dynamics have been first described by reduced-gravity shallow-water
theory (RGSWT), in which the flow is bounded by a free surface (Pettre,
1982). This hydraulic analogy is the oldest conceptual model and was pro-
posed by Long (1953). Durran (1986) suggested that there is a fundamental
similarity between downslope windstorms and hydraulic jumps. In the case of
the mistral, the two-dimensional flow treated in the RGSWT is not realistic
since three-dimensional processes play a major role in the splitting around
Figure 1. Target area in southern France. The lower-right encapsulated map shows the
UHF-radar network deployed during ESCOMPTE around Marseille, except for TLN, used
only for MAP. The acronyms are listed in Table II. Geostrophic winds given in Table I are
computed from the ECMWF analysis along the transects AB and CD. The dashed line in grey
indicates the Rhone valley axis.
2

obstacles (Schar and Smith, 1993). From upstream conditions taken at Lyon
(see Figure 1), Pettre (1982) gives a description of mistral behaviour arguing
that the horizontal distribution is closely linked with hydraulic jumps. In
downslope windstorms, Smith (1985, 1989) found that wave breaking is
associated with hydraulic jumps and in turn associated with the generation of
potential vorticity (Smolarkievicz and Rotunno, 1993; Schar and Smith,
1993). Drobinski et al. (2001a) have shown that the location at which a
hydraulic jump occurs depends on the upstream and downstream flow con-
ditions and not only from upstream conditions. Recent high resolution
simulations have shown that the western and eastern boundaries of the
mistral are partly defined by gravity wave breaking over the Massif Central
and the Alps, respectively (Jiang et al., 2003). Recently, P. Drobinski et al.
(2004, private communication) have found that additional processes such as
wall separation on the western flanks of the southern Alps are involved in the
Alps wake formation. As suggested by Jiang et al. (2003), the Massif Central
wake separates the mistral from the tramontane. The latter flow blows be-
tween the Massif Central and the Pyrenees and is considered as the com-
panion of the mistral since they have the same synoptic origin and often blow
simultaneously (Georgelin and Richard, 1996; Drobinski et al., 2001b).
Although the large-scale features of the mistral are well described, meso-
scale aspects such as the temporal, vertical and horizontal variability, its
onset and cessation are still to be investigated. During MAP (Mesoscale
Alpine Program, autumn 1999, see Bougeault et al., 2001) and ESCOMPTE
(Experience sur Site pour Contraindre les Modeles de Pollution atmospher-
iques et de Transport d’Emissions, summer 2001, see Cros et al., 2004) field
experiments, a UHF wind profiler network was deployed in Provence, near
the coast, to document the spatial and temporal structure of the flow. The
network approach combined with high vertical and time resolutions of the
UHF-wind profilers enables the study of the inhomogeneity and unsteadiness
of the mistral as well as mistral-atmospheric boundary-layer (ABL) inter-
actions.
In this paper, seven cases of mistral documented by UHF wind profilers
are reported: three during MAP, in autumn, and four during ESCOMPTE, in
summer. Bordreuil et al. (1973) have shown that the mistral exhibits a sea-
sonal variability on either speed or direction. In cold seasons, the mean
mistral is featured by strong northerly wind that can persist over one week
and often reach 15–20 m s)1 at coastal ground stations. In warm seasons, the
mean mistral is weaker (from 5 to 10 m s)1). Its zonal component prevails but
rarely persists more than three consecutive days.
The seven mistral events are used to: (i) study the mechanisms responsible
for the spatial and temporal variability, sometimes very fast, of the vertical
structure, and (ii) investigate the mechanisms that can explain the seasonal
variability of mistral characteristics.
3

2. Synoptic Environment of the Mistral
The synoptic environment for the mistral is well illustrated by the meteoro-
logical situation of the MAP IOP 15 during 06–08 November 1999. It is
characterized by the passage of a cut-off low over the North Sea that induces
a north-westerly flow impinging on the Alps range (Figure 2a). Genoa
cyclogenesis is then triggered in two phases (Egger, 1972; Buzzi and Tibaldi,
1978; Bleck and Mattocks, 1984). The first phase (Figure 2a) is associated
with retardation of the cold front associated with the deep cyclone over the
North Sea, and the rapid formation of a shallow vortex supplying a low level
source of potential vorticity at the south-western edge of the Alps (Aebischer
and Schar, 1998). During the second phase (Figure 2b), the growth rate
drops to baroclinic values as a classical cyclogenesis (Bleck and Mattocks,
1984; Tafferner and Egger, 1990). Surface winds strengthen and veer
Figure 2. ECMWF analyses from the 06 November 1999 1200 UTC (TU) to the 08 November
1999 00 UTC (given each 12 hours). Surface pressure (hPa) is indicated by sold lines, 500 hPa
geopotential height (m) by dashed lines. The coloured scale gives the 1000 hPa horizontal
wind speed (WS). Black arrows give the corresponding wind direction.
4

south-eastward. The pressure gradient over the Mediterranean increases with
the development of the Azores ridge over Spain and western France (Fig-
ure 2c) supplying cold and dry air that passes over the Alps. This results in
the displacement of the cyclone towards south-eastern Italy (Figure 2d).
Then, the pressure gradient vanishes as the cyclone moves farther eastward.
Despite a persistent offshore mistral, the onshore winds stop on the 08
November 1999 1200 UTC.
Table I reports the main features of selected MAP and ESCOMPTE
mistral cases. Three mistral events occurred during MAP and four during
ESCOMPTE. The 1000 hPa ECMWF (European Centre of Medium-range
Weather Forecasts) analyses along the AB and CD transects (Figure 1) are
used to compute the geostrophic winds from the pressure gradient between
the Gulf of Genoa cyclone and the Azores high pressure system. In most
mistral events reported in Table I, the configuration of the synoptic envi-
ronment is the same as described above despite a weaker synoptic forcing.
For the weaker case (21–23 June 2001), the cyclogenesis in the southern Alps
is a consequence of an interaction between a westerly flow and a overheated
land surface with a relative cold sea surface.
In the following, three mistral cases are detailed: the strongest event of the
06–08 November 1999, the moderate event of the 01 July 2001 and the weak
event of the 21–23 June 2001.
TABLE I
Synoptic and dynamic features of the detailed mistral events. Geostrophic winds are computed
from the 1000 hPa ECMWF analysis charts along the transects AB and CD of Figure 1. The
surface winds, from the Meteo-France surface network, are the hourly averaged maximum
values recorded during the event at Marignane airport (MGN), near Marseille. IOP stands for
Intensive Observing Period. WS and WD denote the wind speed in m s)1 and the wind
direction in degree respectively.
Experiment Date Duration
(h)
Geostrophic winds
at 1000 hPa
MGN maximum
surface winds
WS (m s)1) WD (�) WS (m s)1) WD (�)
MAP 1999
IOP 4 01 October 24 25 350 15 340
IOP 5 05 October 24 30 0 14 340
IOP 15 06–08 November 43 37 5 20 350
ESCOPMPTE 2001
16–18 June 54 26 340 19 340
21–23 June 72 12 315 9 270
28 June 24 17 340 14 330
10 July 30 16 10 13 340
5

3. Experimental Set-Up
The measurements have been made using Degreane UHF wind profilers, and
consist of the time evolution of the vertical profiles of the three wind com-
ponents. They are obtained along a single vertical beam and two, or four
(depending upon the radar), oblique beams slanted at an off-zenith angle of
17� the half-power beam width being 8.5�. The wind profilers work with a
frequency of 1238 MHz (»0.3 m wavelength), and with a peak power of
4 kW. Returned echoes are due to the air refractive index fluctuations
advected by the wind. The wind velocity is estimated from the frequency
corresponding to the mean Doppler shift obtained in the radar echo. The
data quality control and processing are carried out through a consensus
algorithm based on time and height continuity of measured spectra. The
consensus works over a 60-min period providing a wind profile each 15 min
from a height of 0.1–0.3 km AGL up to 2.5–4 km AGL (depths probed by
UHF wind profilers are indicative since they are sensitive to meteorological
parameters such as humidity). The vertical resolution is typically 75–150 m.
The errors in the horizontal (vertical) wind measurements are typically
1–2 m s)1 (0.25–0.5 m s)1). Table II summarizes the location of the wind
profilers during MAP and ESCOMPTE experiments.
During MAP, two UHF wind profilers have been set up near Marseille, at
St Chamas (STC), and Toulon (TLN), 90 km apart (see Figure 1 for the
exact location of STC and TLN). Both wind profilers were near the shore,
TLN being located in an urban area and STC in the countryside. During
ESCOMPTE, the STC wind profiler was still available, the MGN radar was
located closer to the sea, the MRS radar at Marseille in an urban area and the
AIX radar at Aix les Milles in a military airport. On average, those radars
TABLE II
Site locations of UHF wind profilers set up during the MAP and ESCOMPTE experiments.
Experiment Institute name Site Acronyms Longitude
(�E)
Latitude
(�N)
MAP
ESCOMPTE
EDF and
LA/OMP
ST CHAMAS STC 5.12 43.53
MAP Degreane TOULAN TLN 5.97 43.12
ESCOMPTE Degreane AIX LES
MILLES
AIX 5.37 43.50
ESCOMPTE Meteo-France MARIGNANE MGN 5.22 43.43
ESCOMPTE CNRM/
Meteo-France
MARSILLE MRS 5.38 43.30
6

were installed 30 km apart. During each experiment, routine radio soundings
were launched at Nımes and Lyon by Meteo-France (Figure 1) each six
hours in the MAP experiment (each three hours on the 06 November 1999)
and each 12 hours in the ESCOMPTE framework. This whole experimental
network, i.e. wind profilers and radio soundings, allows a novel mesoscale
investigation.
4. The Wind Profilers Observations
4.1. THE SEVERE AUTUMN MISTRAL EPISODE (6–8 NOVEMBER 1999)
Time-height cross-sections of the horizontal wind speed and direction, above
STC and TLN are presented in Figures 3a, 3b respectively. The strong wind
events, defined by the time-height region where the wind speed is stronger
than 15 m s)1, may be divided in three successive phases.
On 06 November 1999 from 1200 to 1400 UTC, the mistral starts blowing
from the north-west at STC and from the west at TLN between 15 and
25 m s)1 above 1 km AGL. Between 06 November 1999 at 1400 UTC and 07
November 1999 at 0400 UTC at STC, the wind increases up to 25–35 m s)1
and veers to the north/north-west up to the upper range of the UHF mea-
surements. Above TLN, the wind increases on 06 November 1999 between
1400 and 2100 UTC but remains slightly weaker than above STC (i.e. be-
tween 25 and 30 m s)1) and veers to the west/north-west up to the UHF
radar detection limit. The difference in wind direction, which is more east-
ward at TLN than at STC, is a classical mistral feature.
Between 07 November 1999 at 0400 UTC and 08 November 1999 at 0900
UTC at STC, and between 06 November 1999 at 2100 UTC and 07
November 1999 at 0600 UTC at TLN, strong northerly winds are found
below 1 km AGL with a low-level jet structure (LLJ). The wind speed
maxima, found around 0.5 km AGL, progressively decrease from 30 to less
than 15 m s)1. One noticeable difference between the two sites is that the
mistral event ends seven hours earlier at TLN than at STC.
4.2. THE WEAK AND MODERATE SUMMER MISTRAL EPISODES (21–23 JUNE AND
01 JULY 2001)
During ESCOMPTE, two interesting mistral events have been documented
by the UHF wind profilers listed in Table II: a weak mistral from 21 to 23
June 2001 and a moderate mistral from 30 June to 1 July 2001. Unfortu-
nately, the UHF wind profiler located at TLN was not operated during
ESCOMPTE so the spatial variability of the mistral flow is addressed on a
7

spatial scale of 30 km. Table I indicates that these events are characterised by
a weaker pressure gradient than during the MAP IOP 15 event, leading to
substantially weaker winds as displayed in Figures 4 and 5 which show
time-height cross-sections of the horizontal wind strength and direction
measured by the AIX and STC UHF-wind profilers from 21 to 23 June 2001
and from 30 June to 1 July 2001, respectively.
The highest wind speeds recorded during the 21 to 23 June 2001 event,
were in the 12–15 m s)1 range, below 1.5 km AGL (Figure 4). One striking
Figure 3. Time-height diagrams of the horizontal wind given by the (a) STC and (b) TLN
wind profilers from the 06 to 08 November 1999 1200 UTC. The wind speed (m s)1) is given by
the coloured scale. Black arrows are the horizontal wind vectors.
8

feature is that the mistral is embedded in a 1.5-km deep layer at night
between 2200 and 0900 UTC, with maximum wind speed between 0200 and
0600 UTC, whereas during the afternoon, it is ‘lifted up’ above 1.5 km AGL,
as the near-surface wind, i.e. below 1.5 km AGL, decreases down to
» 5 m s)1, and veers to the west. This behaviour is systematically observed
above the two radar sites during the three days of the event.
For the moderate event (Figure 5), the mistral starts blowing on the 30
June 2001 afternoon with maximum wind speed ranging from 15 to 18 m s)1
Figure 4. Time-height diagrams of the horizontal wind given by the (a) STC and (b) AIX wind
profilers from the 21 to 24 June 2001 0000 UTC. The wind speed (m s)1) is given by the
coloured scale. Black arrows are the horizontal wind vectors.
9
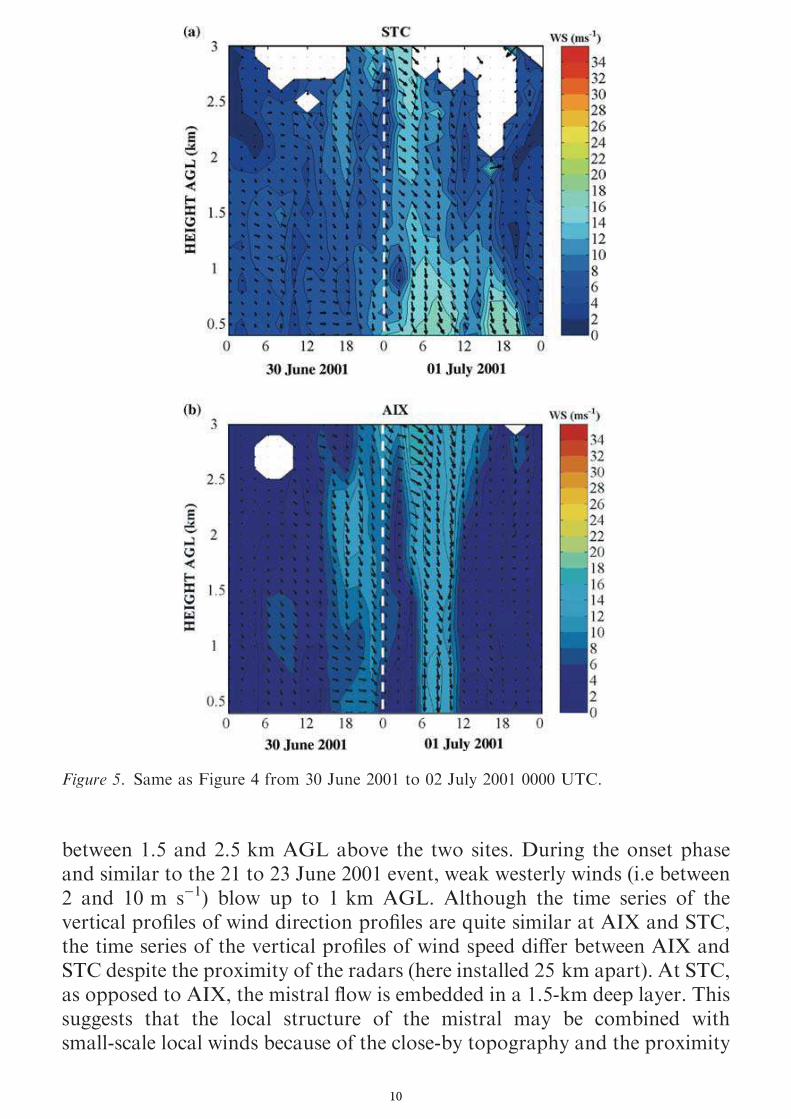
between 1.5 and 2.5 km AGL above the two sites. During the onset phase
and similar to the 21 to 23 June 2001 event, weak westerly winds (i.e between
2 and 10 m s)1) blow up to 1 km AGL. Although the time series of the
vertical profiles of wind direction profiles are quite similar at AIX and STC,
the time series of the vertical profiles of wind speed differ between AIX and
STC despite the proximity of the radars (here installed 25 km apart). At STC,
as opposed to AIX, the mistral flow is embedded in a 1.5-km deep layer. This
suggests that the local structure of the mistral may be combined with
small-scale local winds because of the close-by topography and the proximity
Figure 5. Same as Figure 4 from 30 June 2001 to 02 July 2001 0000 UTC.
10

of the sea. It should also be noticed that the near-surface weak westerly wind
is not observed during the afternoon on the 01 July 2001.
5. Discussion
The purpose of this section consists in interpreting the mistral observations
obtained with the wind profilers. The discussion especially focuses on the
transition between the deep and shallow mistral during the severe event (06–
08 November 1999) and the interactions of the mistral with land-sea breezes
during less marked episodes (21–23 June and 01 July 2001).
5.1. THE AUTUMN MISTRAL
During the 06–08 November 1999 mistral event, the synoptic forcing is well
marked so that the whole Alps ridge is affected by the northerly flows. The
linear theory (Smith, 1989) and the RGSW theory (Schar and Smith, 1993)
can be used to interpret the UHF wind observations. The incident conditions
are defined by the vertical soundings at Lyon (Pettre, 1982). Figure 6 display
the horizontal wind (Figure 6a) and the isentropes (Figure 6c) interpolated
from the radiosonde data at Lyon. The same presentation is made on the
radiosonde data at Nımes, located in the southern Rhone valley (Figure 6b
and 6d).
The analysis of the flow upstream the Massif Central and the Alps (Fig-
ure 6a) clearly shows weaker winds (10–20 m s)1 range below 3 km AGL)
and suggests a blocking process. Furthermore, a substantial shift in the
orientation of the winds occurs. On 06 November 1999 between 1200 and
1800 UTC, upstream conditions are marked by north-westerly flows that
blow below 15 m s)1. From 06 November 1999 at 1800 UTC to the 07
November 1999 at 0000 UTC, northerly flows prevail. Afterwards north-
easterly flows affected the mountain ranges.
The analysis of the Nımes sounding (Figure 6b) shows that the transition
between the deep and shallow structure occurs farther westward than STC
and confirms that it is not a local feature (see Figure 1). The soundings allow
us to better appreciate the vertical structure of the mistral that is limited to
3 km AGL in the wind profiler time series. The setting up of the low-level
mistral is associated with a decoupling in the dynamics of the lower and upper
troposphere. The wind speed magnitude reported at Nımes is similar than
those observed by the two wind profilers (in the 20–30 m s)1 range). Unfor-
tunately, the wind cessation at Nımes is not part of the available observations.
The analysis of the isentropes (Figures 6c and 6d) shows that the mistral is
associated with a well-mixed layer topped by a very stable layer. The thermal
11

inversion, that corresponds with the maximum vertical isentropic gradient,
progressively descends throughout the episode as the mistral depth (Fig-
ure 6d).
In the linear theory (Smith, 1989), two parameters control the flow:
� the horizontal aspect ratio of the obstacle r ¼ ay/ax where ay (or ax) is the
horizontal dimension of the obstacle in a direction perpendicular (or par-
allel) to the flow.
� the dimensionless mountain height h ¼ Nh/U where N is the buoyancy
frequency, h is the maximum mountain height and U is the incident wind
speed.
The values taken by the parameters (r, h) allows the building of the Smith
regime diagram for the linear theory. It predicts the occurrence of mountain
Figure 6. Time-height diagrams from the Lyon and Nımes radiosonde data interpolated from
the 06 to 08 November 1999 1200 UTC. Horizontal wind (m s)1) at (a) Lyon and (b) Nımes.
Isentropes (K) at (c) Lyon and (d) Nımes. The wind speed and the isentropes are given by the
coloured scale. Black arrows are the horizontal wind vectors.
12

waves (MW), wave breakings (WB) and flow splitting (FS) in a flow past an
obstacle. WB is featured by a stagnation point aloft of the obstacle. When the
flow splits around an obstacle, the stagnation point occurs on the windward
slope. The linear theory also predicts that a mixture of FS and WB is pos-
sible.
From the incident wind orientation, different obstacles are encountered by
the air masses. Figure 7 displays the upstream topography at STC (Fig-
ure 7a) and TLN (Figure 7b) for north-westerly, northerly and north-east-
erly incident flows. In north-westerly flows, STC and TLN are affected by the
Massif Central. For northerly and north-easterly flows, the Alps plays a
major role at the two sites. However, the mountain height varies from one
site to the other. The values of h are reported in Table III.
The computation of r is based on the map displayed in Figure 8a that
indicates the dimensions of the Massif Central and the Alps. The r values are
also given in Table III. Figure 8b reports the linear regime of the flow at STC
and TLN.
From the 06 November 1999 1200 UTC to 1800 UTC, the flow regime is
similar at STC and TLN since both influenced by the Massif Central. The
linear theory predicts a MW regime. UHF observations indicate a deep
mistral and confirm the similar wind structure above the two sites.
From 06 November at 1800 UTC to 07 November at 0000 UTC, the linear
theory predicts MW at STC and the coexistence of WB and FS at TLN. WB
in downslope windstorms triggers LLJ windstorms as described by Smith
(1985). The earlier setting of the TLN LLJ is thus predicted by the linear
theory. From the 07 November 0000 UTC to the 08 November 1999 1200
UTC, the linear theory predicts a FS regime at STC while the conditions are
favourable for MW at TLN. The FS encourages the channelling effects
within the Rhone valley that triggers the LLJ at STC. Thus, the STC LLJ has
not the same origin as the TLN one. At TLN, the MW are difficult to
interpret and limit the validity of the linear theory.
After 07 November 1999, three-dimensional processes such as FS play a
major role in the flow. Three-dimensional flows are well described by the
shallow water theory in case of two-layered flows. Table IV gives the intensity
of the thermal inversion computed at Lyon that separates the well-mixed
layer of the mistral from a very stable layer aloft (see Figure 6). The thermal
inversion strength progressively increases from the beginning of the mistral to
the 07 November 1999 0000 UTC and range from 20 to 30 K km)1 for the
shallow mistral. Pettre (1982) uses the RGSW theory with thermal inversion
strength greater than 15 K km)1. The shallow water theory can be thus
applied from the 07 November 1999 0000 UTC and completes the description
of the linear theory.
In the shallow water theory (Schar and Smith, 1993), the control param-
eters are:
13

� the non dimensional mountain height M ¼ h/H where h is the maximum
mountain height and H is the depth of the well-mixed layer of the
mistral.
Figure 7. Contours of the mountain crests upstream (a) STC and (b) TLN for the north-
westerly (bold line), northerly (dashed line) and north-easterly (solid line) incident flows. The
locations of the wind profilers are indicated by the black arrows. These plots define the
maximum heights h of the obstacle of the linear theory.
14

TABLE
III
Lineartheory
regim
efortheSTC
andTLN
sitesduringthe06–08Novem
ber
1999mistralevent,histhemountain
height,risthehorizontal
aspectratio.Nh/U
isthedim
ensionless
mountain
height.Theregim
esare
referred
toMW
mountain
waves,WBwavebreaking,FSflowsplitting
(from
Smith,1989).
Date
Relief
STC
TLN
h(m
)r
Nh/U
regim
eh(m
)r
Nh/U
regim
e
06Novem
ber
1200UTC
MassifCentral
1000
0.8
0.7
MW
1000
0.8
0.7
MW
06Novem
ber
1500UTC
MassifCentral
1000
0.8
0.6
MW
1000
0.8
0.6
MW
06Novem
ber
1800UTC
Alps
500
1.8
0.4
MW
1500
1.8
0.9
WB+FS
06Novem
ber
2100UTC
Alps
500
1.8
0.4
MW
1500
1.8
1.0
WB+FS
07Novem
ber
0000UTC
Alps
500
1.8
0.3
MW
1500
1.8
1.0
WB+FS
07Novem
ber
0600UTC
Alps
2500
0.3
1.9
FS
2000
0.3
1.2
MW
07Novem
ber
1200UTC
Alps
2500
0.3
2.2
FS
2000
0.3
1.5
MW
07Novem
ber
1800UTC
Alps
2500
0.3
2.2
FS
2000
0.3
1.7
MW
08Novem
ber
0000UTC
Alps
2500
0.3
2.4
FS
2000
0.3
2.0
MW
08Novem
ber
0600UTC
Alps
2500
0.3
2.7
FS
2000
0.3
2.0
FS
08Novem
ber
1200UTC
Alps
2500
0.3
2.7
FS
2000
0.3
2.2
FS
15

� the Froude number F ¼ Uffiffiffiffiffiffiffiffi
g0Hp
with U the incident wind speed and g¢ the
reduced gravity given by g0 ¼ g h�h0
h, where h
0 (or h) is the potential tem-
perature of the upper (or lower) layer on either sides of the thermal
inversion.
The shallow water theory predicts the existence of four regimes. Regime I
refers to inviscid irrotational flow with no hydraulic jumps. Regime IIa refers
to a wake formation without reverse flow due to the hydraulic jump. Regime
IIb indicates a wake formation with a reverse flow. Regime III indicates a
wake regime due to a pierced fluid surface (with M > 1).
Figure 8. (a) Determination of the horizontal aspect ratio r for the use of the linear theory of
the Massif Central and the Alps. (b) Linear regimes for the flow at STC and TLN from the 06
to the 08 November 1999 12 UTC. Each point corresponds with the radio sounding launching
at Lyon and is associated with the duration from the onset of the mistral that occurs on the 06
November 12 UTC to the radio sounding launching.
16

TABLE
IV
Shallowwaterflowregim
esfortheSTCandTLN
sitesduringthe06–08Novem
ber
1999mistralevent.H
istheincidentwell-mixed
depth
taken
from
theradio
soundingslaunched
atLyon,FistheincidentFroudenumber,dh/dzisthestrength
ofthethermalinversionthatindicatesthe
degreeofvalidityoftheRGSWT,his
themountain
height,M
isthedim
ensionless
mountain
height.Flow
regim
esI,
IIa,IIb,andIIIrefer,
respectively,to
inviscidirrotationalflow,wakeregim
ewithoutreverse
flow
associatedwithhydraulicjump,wakeregim
ewithreverse
flow
associatedwithhydraulicjump,andto
awakeregim
edueto
apierced
fluid
surface
(from
ScharandSmith,1993).
Date
Relief
h(m
)F
dh/dz
(K/km)
STC
TLN
h(m
)M
regim
eh(m
)M
regim
e
06Novem
ber
1200UTC
Massif
Central
6050
0.14
81000
0.17
I1000
0.17
I
06Novem
ber
1500UTC
Massif
Central
6600
0.18
15
1000
0.15
I1000
0.18
I
06Novem
ber
1800UTC
Alps
5800
0.31
14
500
0.09
I1500
0.26
I
06Novem
ber
2100UTC
Alps
3500
0.40
11
500
0.14
I1500
0.43
I
07Novem
ber
0000UTC
Alps
3100
0.46
14
500
0.16
I1500
0.48
IIa
07Novem
ber
0600UTC
Alps
2350
0.62
32
2500
1.06
IIb
2000
0.85
IIb
07Novem
ber
1200UTC
Alps
1700
0.70
22
2500
1.47
III
2000
1.18
IIb
08Novem
ber
1800UTC
Alps
1600
0.82
25
2500
1.56
III
2000
1.25
III
08Novem
ber
0000UTC
Alps
1350
0.73
26
2500
1.85
III
2000
1.48
III
08Novem
ber
0600UTC
Alps
1250
0.76
19
2500
2.00
III
2000
1.60
III
06Novem
ber
1200UTC
Alps
1000
0.71
23
2500
2.50
III
2000
2.00
III
17

Table IV reports the values taken by the parameters (M, F) computed
from the Lyon radio soundings throughout the mistral event. Figure 9 pre-
sents the shallow water flow regime for the 07 November 1999 0000 UTC
to the 08 November 1999 1200 UTC. The flow is non dissipative (regime
I) on 07 November 1999 0000 UTC above the two sites. At 0600 UTC,
the shallow water theory predicts a wake regime with reverse flow (regime
IIb) at the two sites. From 07 November 1999 1200 UTC, the theory
predicts a wake regime triggered by a pierced fluid surface. As the thermal
inversion is located below the mountain crest, the channelling effect up-
stream STC is more efficient. TLN is in the wake regime predicted by the
theory that gives an explanation for the early cessation of the TLN winds
(see Figure 3b). The presence of wake is confirmed by Jiang et al. (2003).
This discussion concerns the well-marked mistral situations when the
whole Alps ridge is affected by a similar flow. Indeed, the conclusions made
up for the MAP IOP 15 mistral event can be transposed to interpret a
similar transition deep/shallow mistral that occurred from 16 to 18 June
2001.
Figure 9. Shallow water flow regimes at STC and TLN from 07 November 1999 0000 UTC to
08 November 1999 1200 UTC. Each point corresponds with the radiosounding launching at
Lyon and is associated with the duration from the onset of the mistral that occurs on the 06
November 1200 UTC to the radio sounding launching.
18

5.2. THE SUMMER MISTRAL
For summer weaker mistral situations of the 21–23 June and 01 July, a linear
theory analysis is carried out. However, the time resolution of the upstream
conditions at Lyon is coarser (12 h).
Figure 10 presents the vertical soundings of the horizontal wind and the
potential temperature at Lyon and Nımes for the weak mistral event. For
clarity of the figure and since the low-level mistral observed by the wind
profilers is stronger during nighttimes, only the soundings at 0000 UTC are
displayed. The incident conditions are less pronounced that the autumn event
with wind speed less than 10 m s)1 below 2 km AGL (Figure 10a). Hence,
the mistral at the exit of the Rhone valley (Figure 10b) is below 15 m s)1 and
looks like a LLJ as the wind profilers reveal (Figure 4). Note that the mistral
at Nımes is more intense than the mistral reported by the two wind profilers.
Figure 10. Vertical profiles of (a) the wind speed and direction at Lyon, (b) the wind speed and
direction at Nımes, (c) the potential temperature at Lyon and (d) the potential temperature at
Nımes on the 21 June 2001 0000 UTC (dashed grey line), 22 June 2001 0000 UTC (dashed black
line), 23 June 2001 0000 UTC (solid grey line) and 24 June 2001 0000 UTC (solid black line).
Wind speeds are given in m s)1, wind direction in degrees and potential temperature in K.
19

The analysis of the stratification (Figure 10b) shows that the low-level layers
are continuously stratified and no well-mixed layer occurs as in autumn.
Thus, only the linear theory is applied to interpret the wind data.
Table V gives the linear flow regime for the weak mistral event and Fig-
ure 12a reports the results in the linear regime. The theory generally predicts
that the flow is governed by the splitting around the Alps and the Massif
Central. The nocturnal LLJ observed by the wind profilers (Figure 5) likely
results from the channelling by the Rhone valley. Moreover, the mistral
observed at Nımes and by a sodar set up at Avignon during ESCOMPTE
located nearer the Rhone valley axis (see Figure 1 for its exact location) is
2 m s)1 stronger than the coastal mistral observed at AIX and STC.
However, the theory fails to describe the wind structure changes from day-
times to nighttimes.
Firstly, as the synoptic situation is not very pronounced, the Alps is not
only affected by incident northerly flow. During daytimes, the coastal mistral
is affected by sea breezes and by thermally driven convection over ground,
observed by various platforms of the instrumental network. These local
thermal effects that are strong enough to lift up the mistral above 2 km AGL
(Figure 4) disturb the validity of the linear theory. During nighttime, the land
breeze partly accelerates the low-level mistral giving birth to a LLJ.
Moreover, nocturnal radiative cooling increases the stratification in the
TABLE V
Linear theory regime for the STC and AIX sites during the 21–23 June and 1 July mistral
events, h is the mountain height, r is the horizontal aspect ratio, Nh/U is the dimensionless
mountain height. The regimes are referred to MW mountain waves, WB wave breaking, FS
flow splitting (from Smith, 1989).
Date Relief STC and AIX
h (m) R Nh/U regime
21 June 0000 UTC Alps 500 1.8 0.4 MW
21 June 1200 UTC Alps 500 1.8 1.2 FE+WB
22 June 0000 UTC Alps 2500 0.3 4.7 FS
22 June 2100 UTC Massif Central 1000 0.8 1.9 FS
23 June 0000 UTC Massif Central 1000 0.8 2.7 FS
23 June 0600 UTC Massif Central 1000 0.8 3.6 FS
24 June 1200 UTC Alps 500 1.8 2.2 FS
30 June 1200 UTC Massif Central 1000 0.8 3.5 FS
01 July 0000 UTC Massif Central 1000 0.8 0.9 MW
01 July 1200 UTC Alps 500 1.8 0.5 MW
02 July 0000 UTC Alps 2500 0.3 4.0 FS
20

atmospheric boundary layer. It results in nocturnal summer conditions that
are more similar in term of stratification with the winter conditions
explaining the onset of the nocturnal LLJ. The local thermal effects are not
obviously considered in the upstream conditions.
Secondly, the incident wind direction profile exhibits low-level wind
shears, particularly outlined on 22 June 2001 0000 UTC (Figure 10b) that
render difficult the computation of Nh/U and r of the linear theory.
Linear theory can be used to interpret the moderate summer events of the 01
July. Figure 11 displays the vertical soundings of the horizontal wind and the
potential temperature at Lyon and Nımes from 30 June 1200 UTC to 02 July
0000 UTC. The mean wind speed measured at Lyon as the mistral is fully
developed is around10 ms)1below2 kmAGL(Figure 11a). The incidentwinds
veer fromnorth-westerly to north-easterly. The resulting flowobserved atNımes
experiences a marked low-level acceleration (Figure 11b) especially at 02 July
0000 UTCwhen the winds stop at AIX and STC (Figure 5). The analysis of the
Figure 11. The same as Figure 10 on 30 June 2001 1200 UTC (dashed grey line), 01 July 2001
0000 UTC (dashed black line), 01 July 2001 1200 UTC (solid grey line) and 02 July 2001 0000
UTC (solid black line).
21

potential temperature profiles (Figures 11c and d) shows that the low-level
layers are less stable. Thewell-mixed depth of themistral is thus clearly visible at
Nımes and gets progressively thinner with time (from 2 to 1 km).
Figure 12. Linear regimes for the flow at STC and AIX for the (a) 21–23 June and (b) 01 July
mistral events. Each point corresponds with the radiosounding launching at Lyon and is
associated with the duration from the onset of the mistral that occurs on the (a) 21 June 0000
UTC and (b) 30 June 1200 UTC to the radio sounding launching.
22

Table V gives the linear flow regime for the moderate mistral event and
Figure 12b reports the results in the linear regime. The theory predicts a FS
regime at the onset of the mistral, consistent with the weak winds below
5 m s)1 measured at Lyon. Then, the MW regime corresponds with the deep
mistral structure as in the autumn case. FS is predicted at the mistral
breakdown. This regime can be linked with channeling effects that trigger a
LLJ at STC (Figure 5a) and at Nımes (Figure 11a). However, the theory fails
to describe the small-scale effects responsible for the differences in the wind
structure of STC and AIX. For instance, the breakdown of the deep mistral
at AIX is associated with a LLJ at STC. Strong variability occurs at a 30-km
horizontal scale and the weak time resolution of the vertical soundings
prohibits the interpretation of the flow with the linear theory. Aircraft data
obtained by the Dornier (Corsmeier et al., 2004) show that AIX is located at
the limit of the eastern mistral shear line that borders the Alps wake. That
feature is also observed during the 28 June 2001 mistral episode (Drobinski
et al., 2004). The presence of the wake is predicted by the shallow water
theory of Schar and Smith (1993) since the thermal inversion at 2 km AGL
pierces the mountain height (2.5 km) in a northeasterly incident flow.
6. Summary
This paper examines the inhomogeneity and unsteadiness aspects of the
mistral LLJ dynamics using a network of UHF wind profilers that was
operated during the MAP and ESCOMPTE field experiments that took place
in autumn 1999 and summer 2001, respectively. Some interpretations of the
observed wind structure are carried out by the use of the linear theory of
Smith (1989) and the shallow water theory of Schar and Smith (1993).
Both theories show that the wind structure observed downstream the Alps
and the Massif Central results from the time evolution of the upstream
conditions especially when synoptic conditions are well marked. They predict
that the FS process plays a major role to explain the shallow mistral at STC.
The LLJ, triggered by north-easterly upstream winds, is strengthened by the
channelling effect explaining the cause of its persistence. The linear theory
indicates that the LLJ at TLN results from WB occurring in downslope
windstorms. The loss of momentum in associated hydraulic jumps develops a
wake with reverse flow explaining the early cessation of the TLN winds.
Confirmations of such processes can be found in non-hydrostatic numerical
simulations that highlight a tropopause foliation over the Alps during the 06–
07 November 1999 mistral event (Hoinka et al., 2003). Thus, the theories
evidence that although the STC and TLN low-level jets look similar, their
origins are very different.
23

Simple theories can not be applied for weaker mistral events as local effects
play a major role for the wind structure. If the mistral is weak, its LLJ
structure is removed by the sea breezes and convection over heated land and
lifted up above the atmospheric boundary layer. During nighttime, the
summer mistral dynamics are similar to the winter dynamics linked with the
advection of relative cold air embedded in the stable boundary layer.
Moreover, the nocturnal summer mistral is accelerated by the land breeze.
These arguments give possible explanations for its nocturnal LLJ structure.
Our study is a first step to understand the strong time and spatial vari-
ability of the mistral. Future work will focus on channelling and downslope
processes with the help of the hydraulic theory. Furthermore, high resolution
numerical simulations will be performed to describe the interaction between
the mistral and the gravity wave activity in the lee of the Alps and the
possible role of these waves on the mistral breakdown and also on the mis-
tral/sea-breeze interactions.
Acknowledgements
The CNRS, the INSU/PATOM, Meteo-France, and EDF are gratefully
acknowledged for their financial and/or logistical support. The authors are
also thankful for the efforts made by the number of international committees,
working groups and staffs during the MAP and ESCOMPTE Special
Observing Periods. Special thanks are given to Y. Pointin from the Univer-
sity of Clermont Ferrand for his help to retrieve the ECMWF data and to
Philip Currier from the company Degreane for his work on the wind-profiler
and its associated software. The anonymous referee is also gratefully
acknowledged for helpful suggestions
References
Aebischer, U. and Schar, C.: 1998, ‘Low-level Potential Vorticity and Cyclogenesis to the Lee
of the Alps’, J. Atmos. Sci. 55, 186–207.
Bleck, R. and Mattocks, C.: 1984, ‘A Preliminary Analysis of the Role of the Potential
Vorticity in Alpine Lee Cyclogenesis’, Contrib. Atmos. Phys. 57, 357–368.
Blondin, C. and Bret, B.: 1986, ‘Numerical Study of the Mistral with a Mesoscale Model’, in
preprint Scientific results of the Alpine experiment (ALPEX), GARP Publication Series,
WMO/TD, pp. 549–563.
Bordreuil, C., Barbia, A., and Comte, P.: 1973, ‘Vent du Nord Ouest a Marseille de 1882 a
1970’, Monographie 88 de la Meteorologie nationale.
Bougeault, P., Binder, P., Buzzi, A., Dirks, R., Houze, R., Kuettner, J., Smith, R. B.,
Steinacker, R., and Volkert., H.: 2001, ‘The MAP Special Observing Period’, Bull. Amer.
Meteorol. Soc. 82, 433–462.
24

Buzzi, A. and Speranza, A.: 1986, ‘A Theory of Deep Cyclogenesis in the Lee of the Alps. Part
I: Modifications of Baroclinic Instability by Localized Topography’, J. Atmos. Sci. 42,
1521–1535.
Buzzi, A. and Tibaldi, A.: 1978, ‘Cyclogenesis in the Lee of the Alps: A Case Study’, Quart. J.
Roy. Meteorol. Soc. 104, 271–287.
Corsmeier, U., Behrendt, R., Drobinski, P., and Kottmeier, C.: 2004, ‘The Mistral and its
Effect on Air Pollution Transport and Vertical Mixing’, Atmos. Res., in press.
Cros, B., Durand, P., Cachier, H., Drobinski, P., Frejafon, E., Kottmeier, C., Perros, P. E.,
Peuch, V. H., Ponche, J. L., Robin, D., Sa, F., Toupance, G., and Wortham, H.: 2004, ‘The
ESCOMPTE Program: An Overview’, Atmos. Res. 69, 241–279.
Drobinski, P., Dusek, J., and Flamant, C.: 2001a, ‘Diagnostics of Hydraulic Jump and Gap
Flow in Stratified Flows over Topography’, Boundary-Layer Meteorol. 98, 475–495.
Drobinski, P., Flamant, C., Dusek, J., Flamant, P. H., and Pelon, J.: 2001b, ‘Observational
Evidence and Modelling of an Internal Hydraulic Jump at the Atmospheric Boundary-
layer Top during a Tramontane Event’, Boundary-Layer Meteorol. 98, 497–515.
Durran, D.: 1986, ‘Another Look at Downslope Windstorms. Part I: The Development of
Analogs to Supercritical Flow in an Infinitely Deep, Continuously Stratified Fluid’, J.
Atmos. Sci. 93, 2527–2543.
Egger, J.: 1972, ‘Numerical Experiments on the Cyclogenesis in the Gulf of Genoa’, Contrib.
Atmos. Phys. 45, 320–346.
Egger, J.: 1988, ‘AlpineLeeCyclogenesis: Verification ofTheories’, J.Atmos. Sci. 45, 2187–2203.
Flamant, C.: 2003, ‘Alpine lee Cyclogenesis Influence on Air–Sea Heat Exchanges and Marine
Atmospheric Boundary Layer Thermodynamics over the Western Mediterranean during a
Tramontane/Mistral Event’, J. Geophys. Res. 108(C3), 8057, 1029/2001JC001040.
Georgelin, M. and Richard, E.: 1996, ‘Numerical Simulation of Flow Diversion around the
Pyrenees: A Tramontana Case Study’, Mon. Wea. Rev. 124, 687–700.
Hoinka, K. P., Hagen, M., Volkert, H., and Heimann, D.: 1990, ‘On the Influence of the Alps
on a Cold Front’, Tellus 42A, 140–164.
Hoinka, K. P., Richard, E., Poberaj, G., Busen, R., Caccia, J. L., Fix, A., and Mannsetein, H.:
2003, ‘Analysis of a Potential Vorticity Streamer Crossing the Alps during MAP IOP-15 on
6 November 1999’, Quart. J. Roy. Meteorol. Soc. 129, 588, 609–632.
Jiang, Q., Smith, R. B., and Doyle, J. D.: 2003, ‘The Nature of the Mistral: Observations and
Modelling of Two MAP Events’, Quart. J. Roy. Meteorol. Soc. 129, 857–876.
Long, R. R.: 1953, ‘Some Aspects of the Flow of Stratified Fluids: I. A Theoretical Investi-
gation’, Tellus 5, 42–58.
Mayencon, R.: 1982, Meteorologie Pratique, Editions Maritimes D’Outre-Mer, 336 pp.
Millot, C.: 1979, ‘Wind Induced Upwellings in the Gulf of Lions’, Oceanol. Acta 2, 261–274.
Orieux, A. and Pouget, E.: 1984, ‘Le mistral: Contribution a l’etude de ses aspects synoptiques
et regionaux’, Monographie 5 de la Meteorologie nationale.
Pettre, P.: 1982, ‘On the Problem of Violent Valley Winds’, J. Atmos. Sci. 39, 542–554.
Rhein, M.: 1995, ‘Deep Water Formation in the Western Mediterranean’, J. Geophys. Res.
10(C4), 6943–6959.
Schar, C. and Smith, R. B.: 1993, ‘Shallow-Water Flow Past Isolated Topography. Part I:
Vorticity Production and Wave Formation’, J. Atmos. Sci. 50, 1373–1400.
Smith, R. B.: 1985, ‘On Severe Downslope Winds’, J. Atmos. Sci. 42, 23, 2597–2603.
Smith, R. B.:1989, ‘Hydrostatic flow over Mountains’, Advances in Geophysics, Vol. 31,
Academic Press, 1–41.
Smolarkievicz, P. K. and Rotunno, R.: 1989, ‘Low Froude Number Flow Past Three
Dimensional Obstacles. Part I: Baroclinically Generated Lee Vortices’, J. Atmos. Sci. 46,
1154–1164.
25

Sprenger, M. and Schar, C.: 2001, ‘Rotational Aspects of Stratified Gap Flows and Shallow
Foehn’, Quart. J. Roy. Meteorol. Soc. 127, 161–188.
Tafferner, A. and Egger, J.: 1990, ‘Test of Theories of Lee Cyclogenesis: ALPEX Cases’,
J. Atmos. Sci. 47, 2417–2428.
Wrathall, J. E.: 1985, ‘The Mistral and Forest Fires in Provence-Cote d’Azur-South France’,
Weather 40, 119–124.
26
Related Documents