An Irrigation Crash Course: How to Calculate Your Orchard’s Water Needs David Doll UCCE Merced 1‐19‐2011 North San Joaquin Valley Almond Day

Welcome message from author
This document is posted to help you gain knowledge. Please leave a comment to let me know what you think about it! Share it to your friends and learn new things together.
Transcript
An Irrigation Crash Course: How to Calculate Your Orchard’s Water Needs
David DollUCCE Merced
1‐19‐2011North San Joaquin Valley Almond Day
Oh No, another irrigation sermon…
• Increases Crop Yield, reduces shrivels
• Help ease harvest and reduce damage to trees
• Doesn’t waste energy (Why pay PG&E more than we have too?)
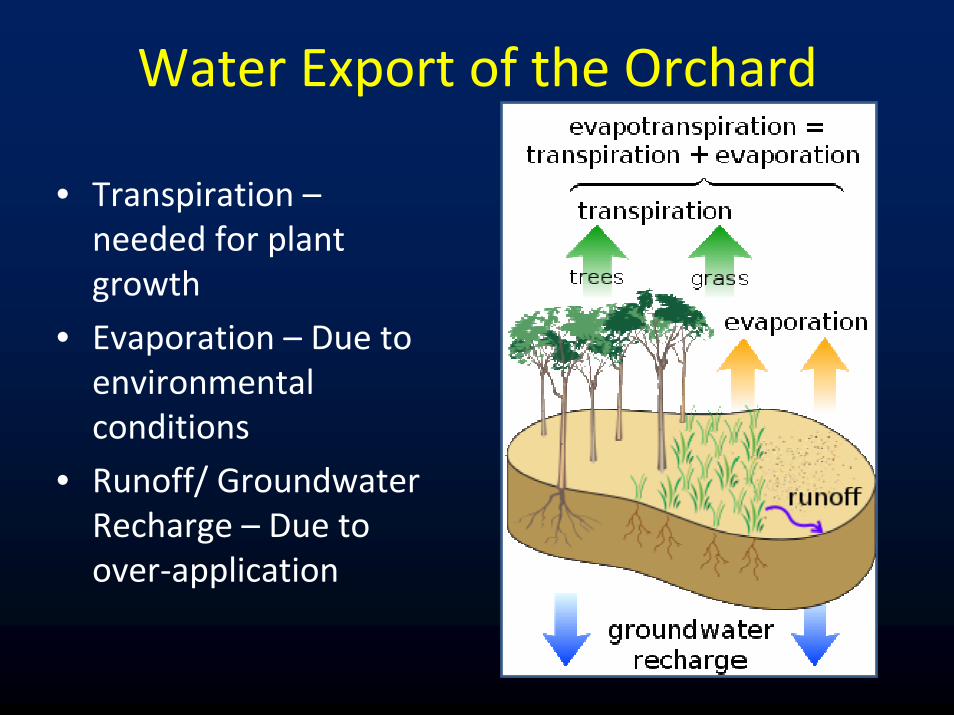
Water Export of the Orchard
• Transpiration –needed for plant growth
• Evaporation – Due to environmental conditions
• Runoff/ Groundwater Recharge – Due to over‐application
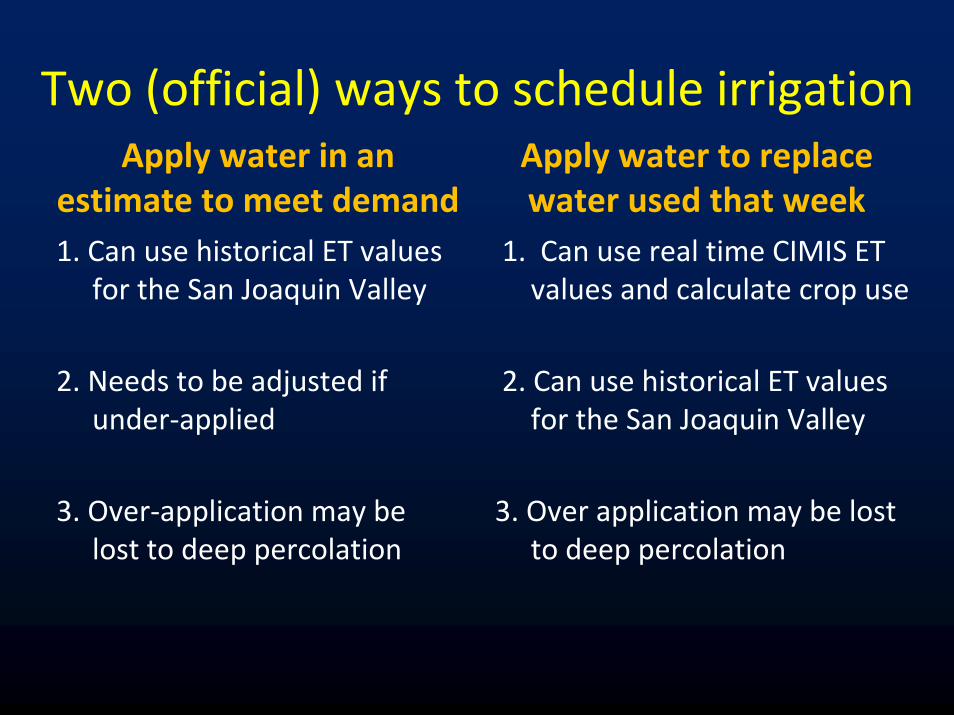
Two (official) ways to schedule irrigationApply water in an
estimate to meet demandApply water to replace water used that week
1. Can use historical ET values for the San Joaquin Valley
2. Needs to be adjusted if under‐applied
3. Over‐application may be lost to deep percolation
1. Can use real time CIMIS ET values and calculate crop use
2. Can use historical ET values for the San Joaquin Valley
3. Over application may be lost to deep percolation

How do we calculate water use?Known, VariableEvapo‐transpiration of the
reference crop (grass)
ETc = ETo x kc
Evapo‐transpiration of the Crop of Interest (almonds)
Crop Coefficient – ratio of water need of crop v/s water
need of grassUnknown
Known, Fixed

How do we figure out Eto?1). CIMIS
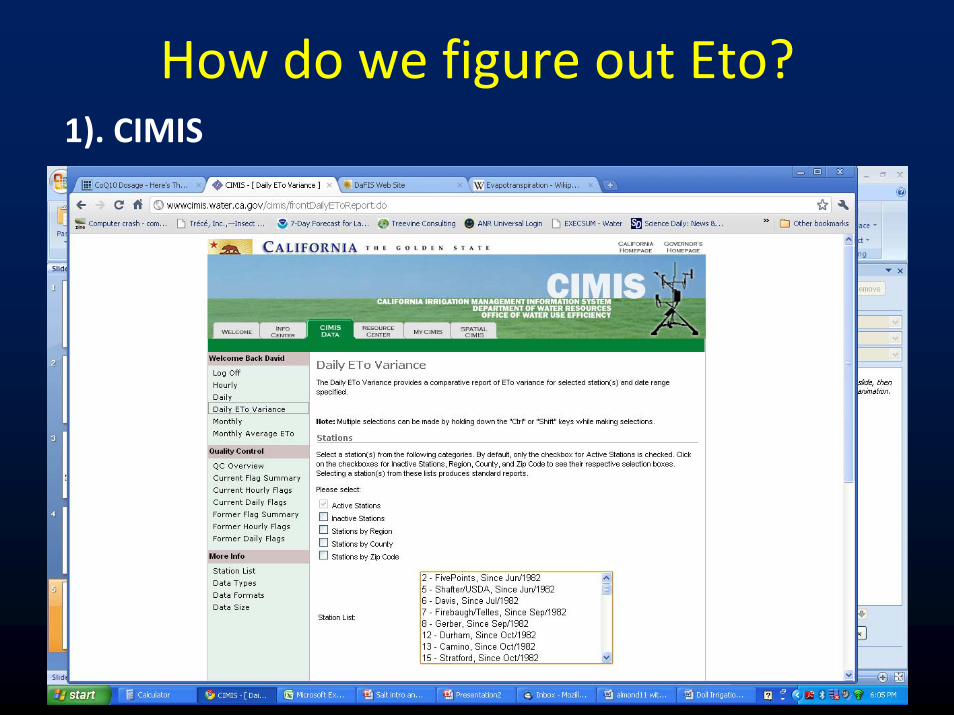
How do we figure out Eto?1). CIMIS
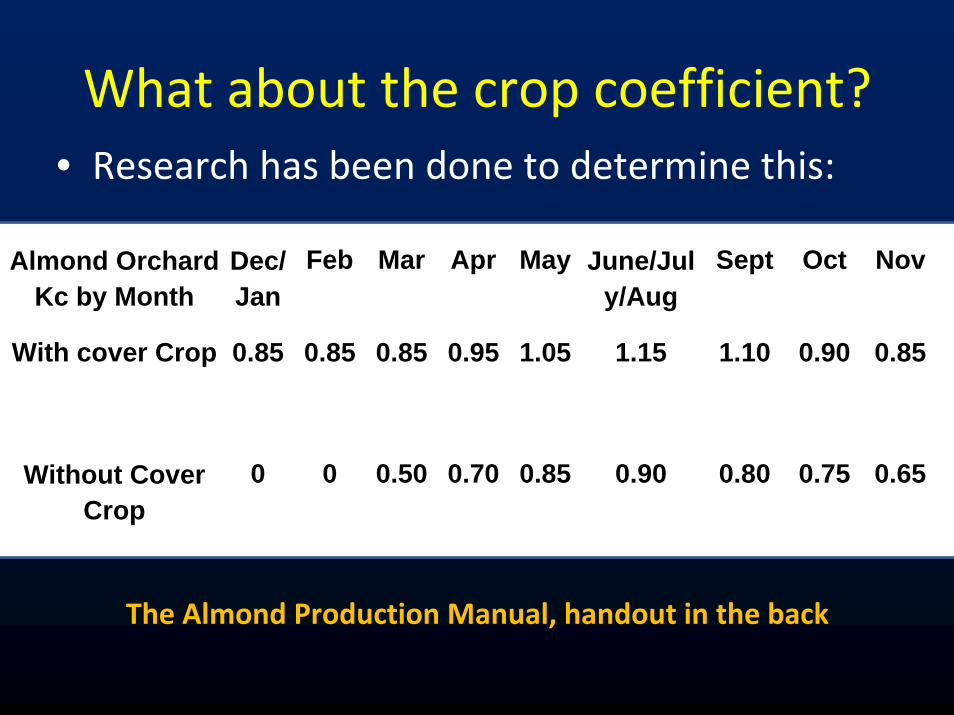
What about the crop coefficient?• Research has been done to determine this:
Almond Orchard Kc by Month
Dec/Jan
Feb Mar Apr May June/July/Aug
Sept Oct Nov
With cover Crop 0.85 0.85 0.85 0.95 1.05 1.15 1.10 0.90 0.85
Without Cover Crop
0 0 0.50 0.70 0.85 0.90 0.80 0.75 0.65
The Almond Production Manual, handout in the back
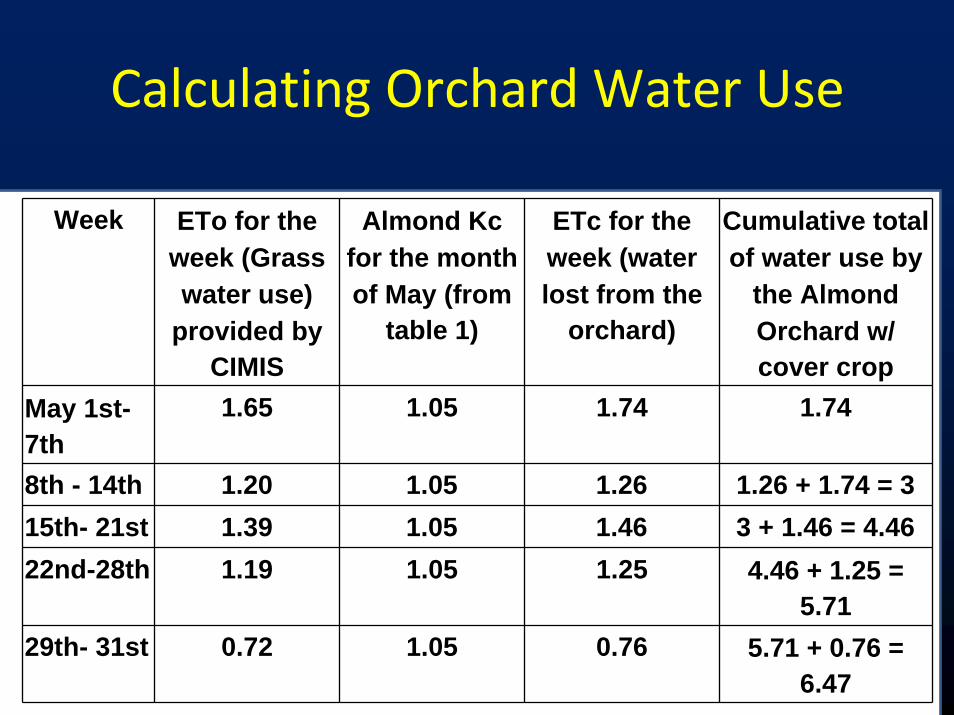
Calculating Orchard Water Use
Week ETo for the week (Grass water use)
provided by CIMIS
Almond Kc for the month of May (from
table 1)
ETc for the week (water lost from the
orchard)
Cumulative total of water use by
the Almond Orchard w/ cover crop
May 1st-7th
1.65 1.05 1.74 1.74
8th - 14th 1.20 1.05 1.26 1.26 + 1.74 = 315th- 21st 1.39 1.05 1.46 3 + 1.46 = 4.4622nd-28th 1.19 1.05 1.25 4.46 + 1.25 =
5.7129th- 31st 0.72 1.05 0.76 5.71 + 0.76 =
6.47
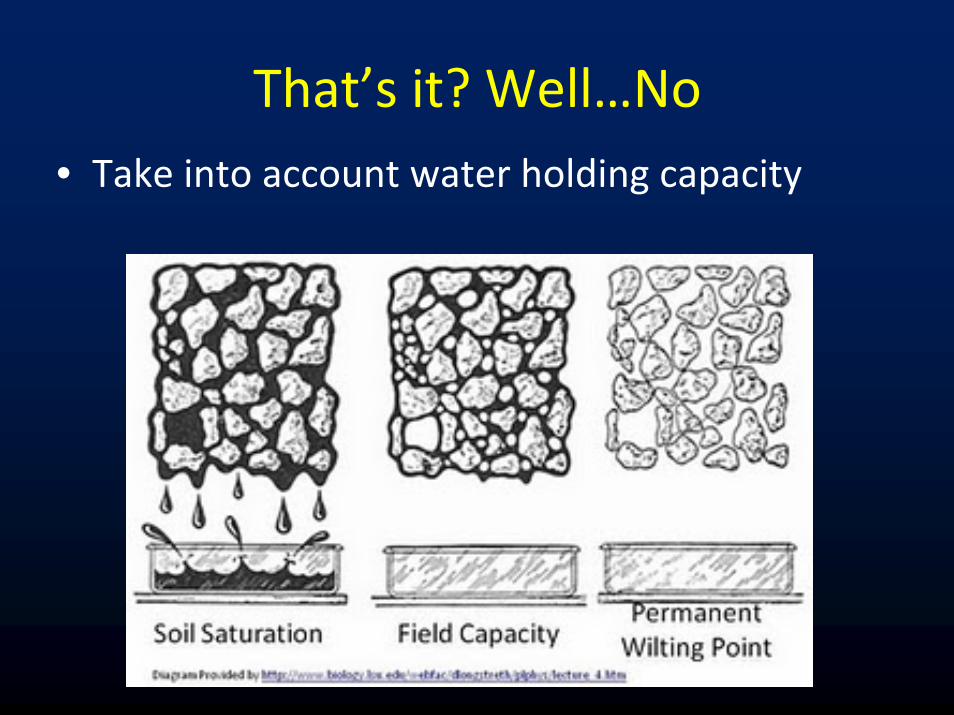
That’s it? Well…No• Take into account water holding capacity
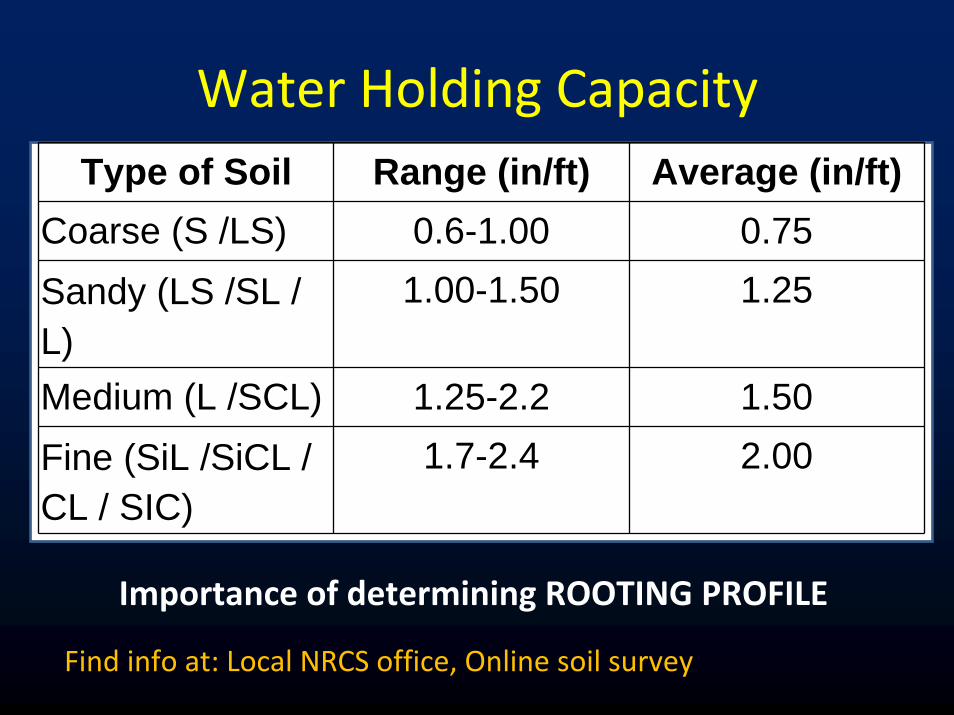
Water Holding CapacityType of Soil Range (in/ft) Average (in/ft)
Coarse (S /LS) 0.6-1.00 0.75Sandy (LS /SL / L)
1.00-1.50 1.25
Medium (L /SCL) 1.25-2.2 1.50Fine (SiL /SiCL / CL / SIC)
1.7-2.4 2.00
Importance of determining ROOTING PROFILE
Find info at: Local NRCS office, Online soil survey
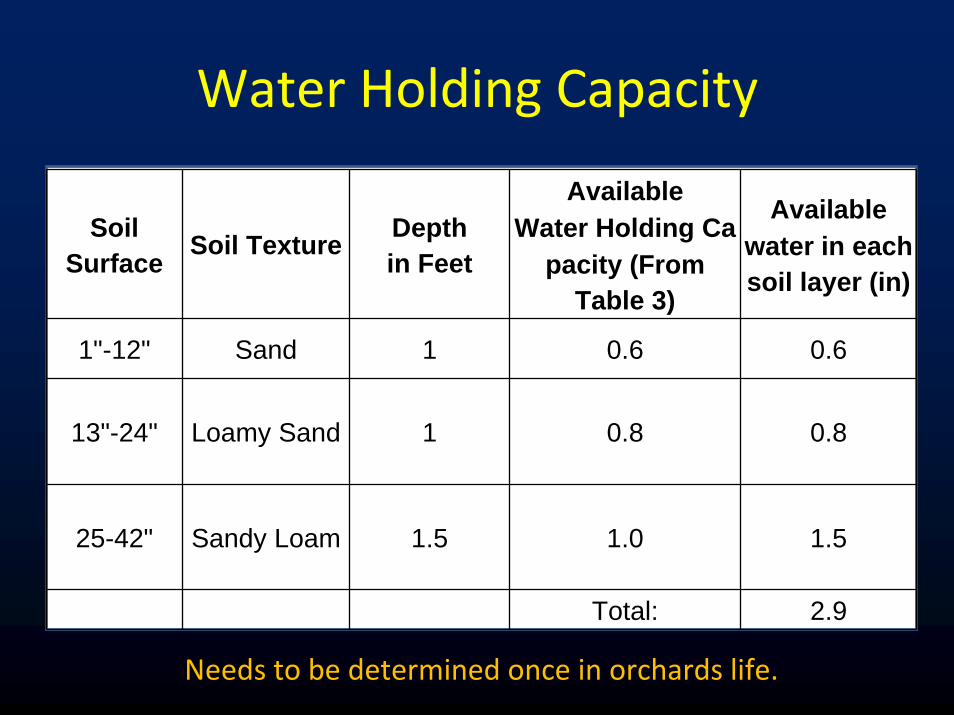
Water Holding Capacity
Soil Surface Soil Texture Depth
in Feet
Available Water Holding Ca
pacity (From Table 3)
Available water in each soil layer (in)
1"-12" Sand 1 0.6 0.6
13"-24" Loamy Sand 1 0.8 0.8
25-42" Sandy Loam 1.5 1.0 1.5
Total: 2.9
Needs to be determined once in orchards life.
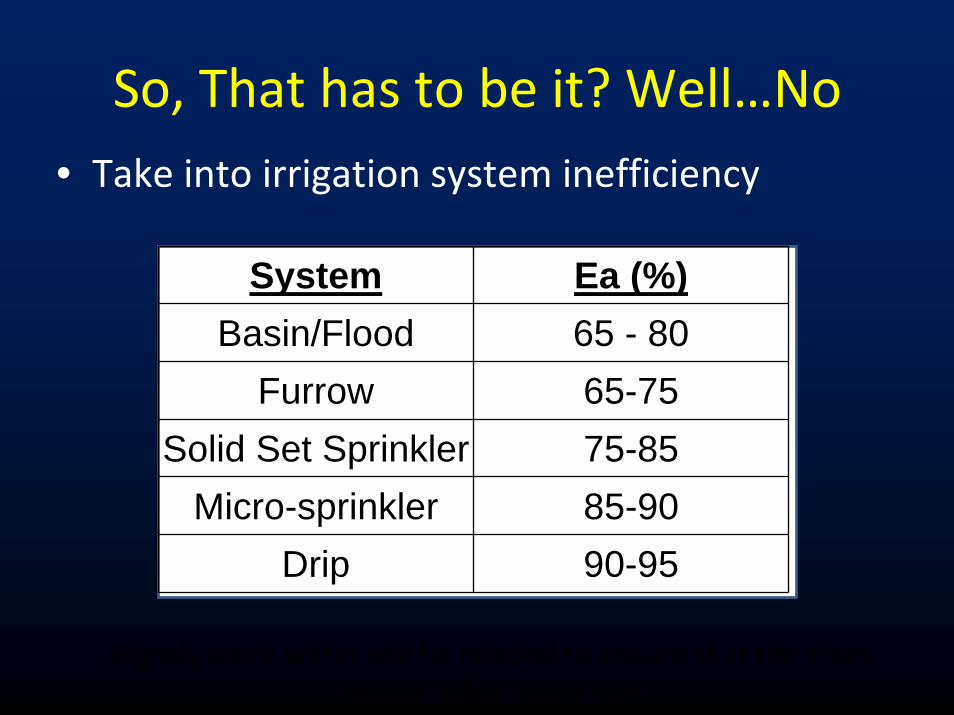
So, That has to be it? Well…No• Take into irrigation system inefficiency
System Ea (%)Basin/Flood 65 - 80
Furrow 65-75Solid Set Sprinkler 75-85
Micro-sprinkler 85-90Drip 90-95
Slightly more water will be needed to ensure that the trees receive adequate water
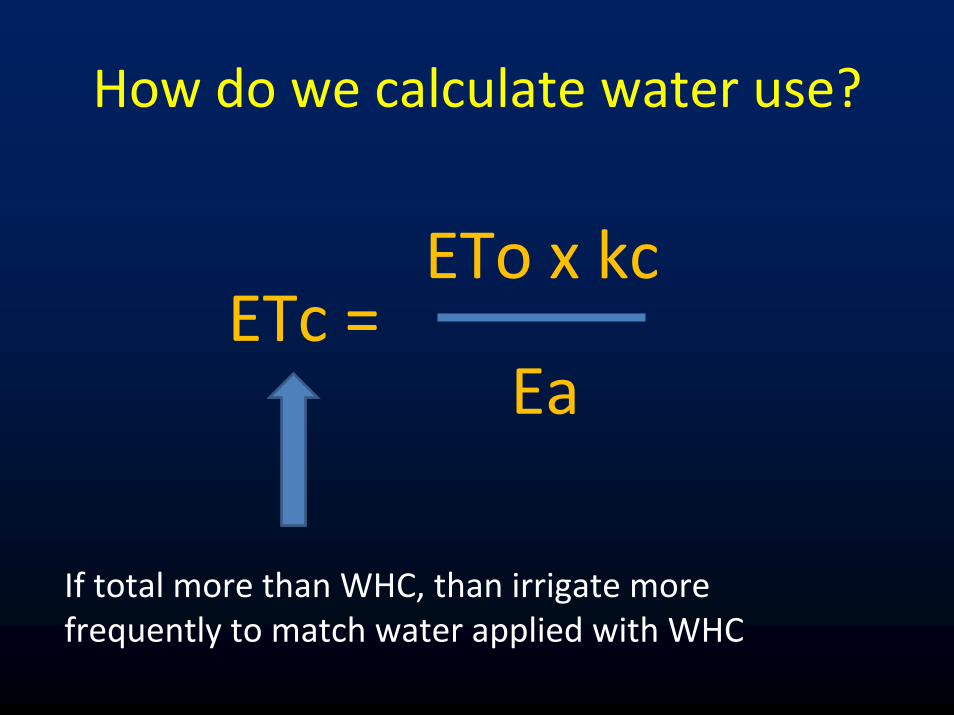
How do we calculate water use?
ETo x kc
EaETc =
If total more than WHC, than irrigate more frequently to match water applied with WHC
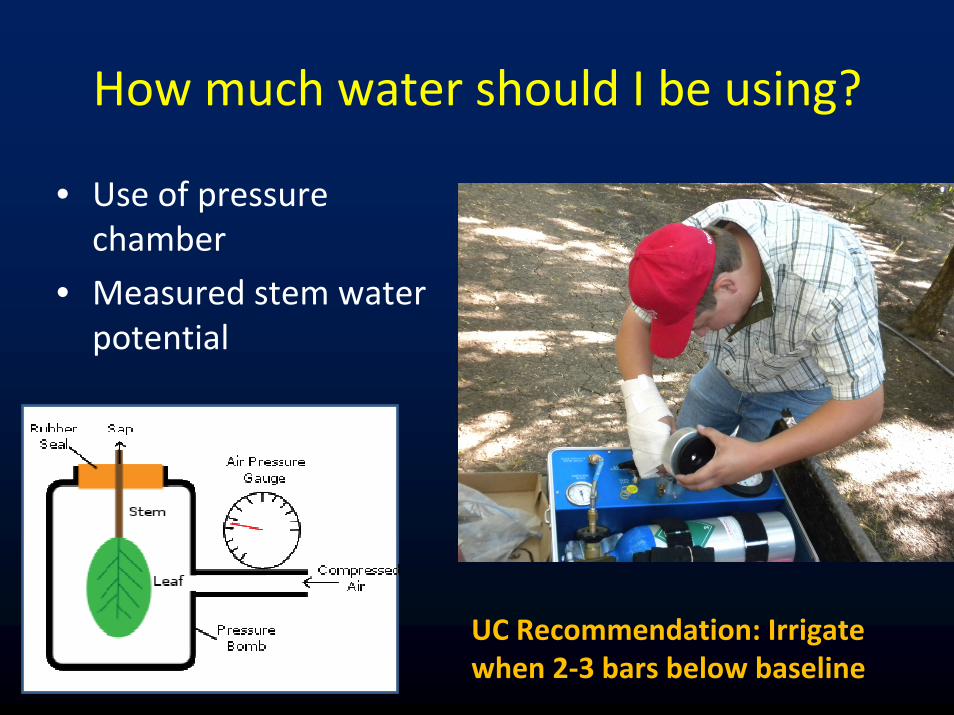
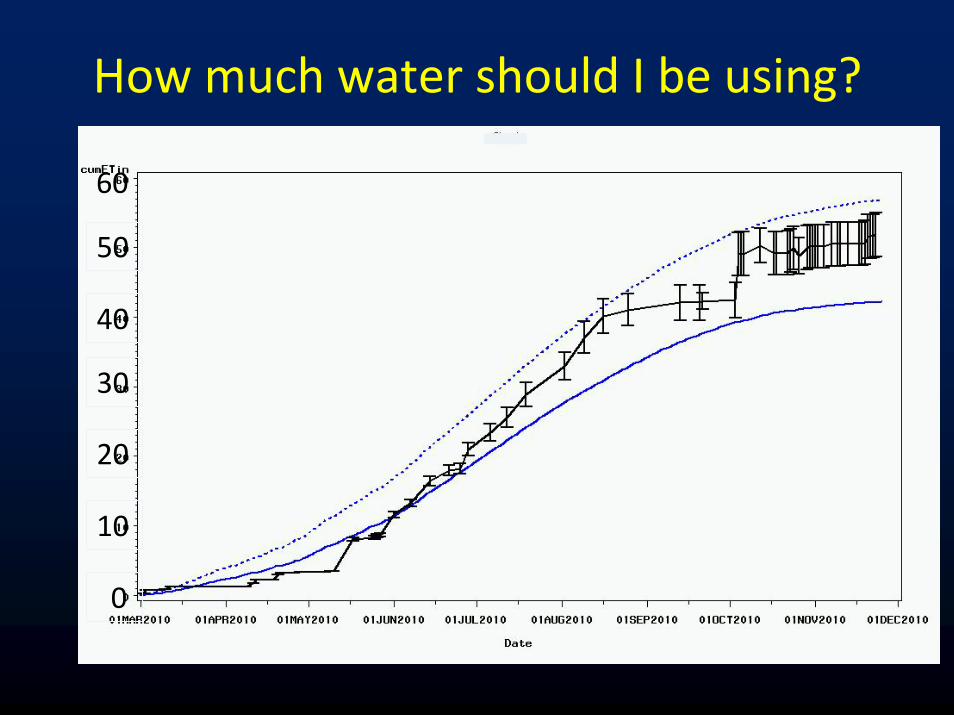
How much water should I be using?
• Use of pressure chamber
• Measured stem water potential
UC Recommendation: Irrigate when 2‐3 bars below baseline
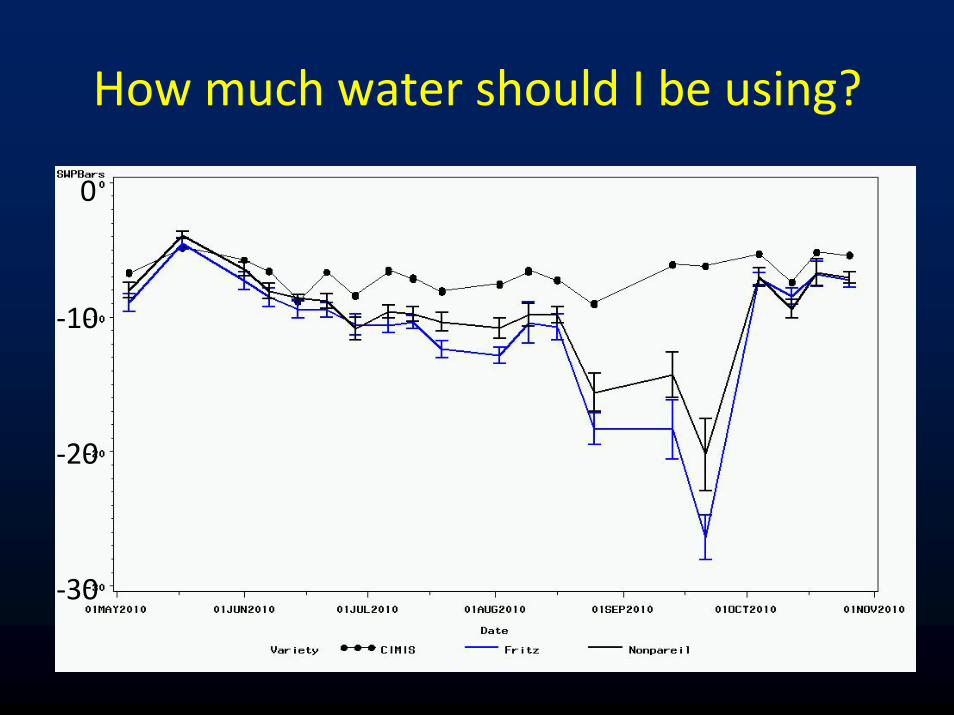
How much water should I be using?
0
‐10
‐20
‐30
How much water should I be using?
60
50
40
30
20
10
0

How much water should I be using?
0
‐10
‐20
‐30

How much water should I be using?
60
50
40
30
20
10
0
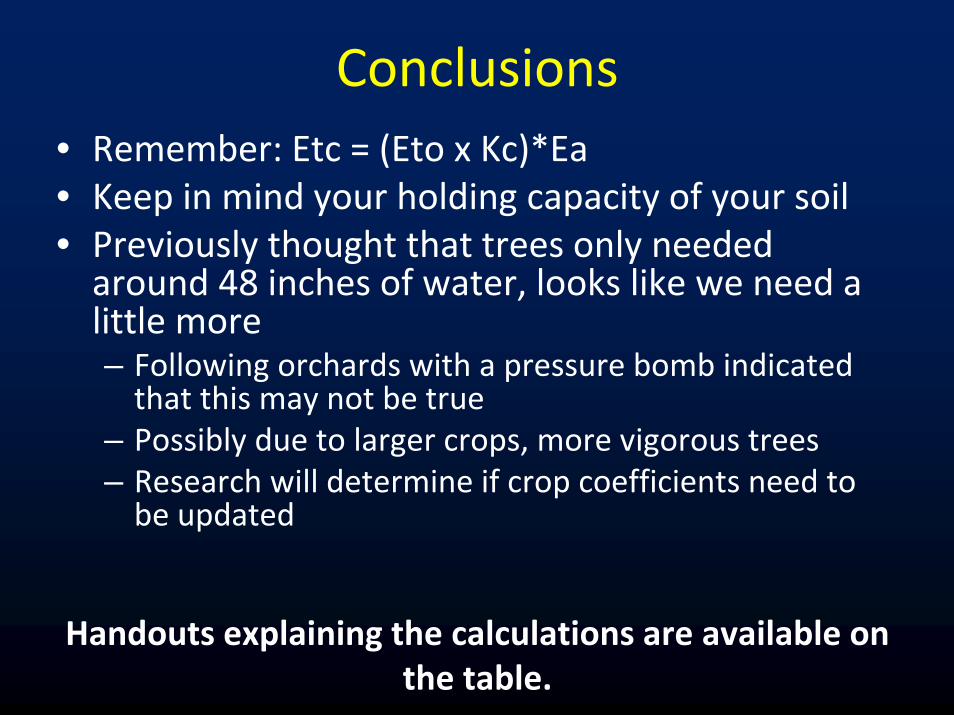
Conclusions• Remember: Etc = (Eto x Kc)*Ea• Keep in mind your holding capacity of your soil• Previously thought that trees only needed around 48 inches of water, looks like we need a little more– Following orchards with a pressure bomb indicated that this may not be true
– Possibly due to larger crops, more vigorous trees– Research will determine if crop coefficients need to be updated
Handouts explaining the calculations are available on the table.

Questions?
Weekly almond update at
www.thealmonddoctor.com
Or just search: “The Almond Doctor”
Related Documents