The Economic and Social Benefits of the TAFE System 1 + An Investment in Productivity and Inclusion: The Economic and Social Benefits of the TAFE System By Alison Pennington Centre for Future Work at the Australia Institute August 2020

Welcome message from author
This document is posted to help you gain knowledge. Please leave a comment to let me know what you think about it! Share it to your friends and learn new things together.
Transcript

The Economic and Social Benefits of the TAFE System 1
+
An Investment in Productivity and Inclusion: The Economic and Social Benefits of the TAFE System
By Alison Pennington
Centre for Future Work at the Australia Institute
August 2020

The Economic and Social Benefits of the TAFE System 2
About The Australia Institute
The Australia Institute is an independent public policy think tank based in Canberra. It is funded by donations from philanthropic trusts and individuals and commissioned research. We barrack for ideas, not political parties or candidates. Since its launch in 1994, the Institute has carried out highly influential research on a broad range of economic, social and environmental issues.
Our Philosophy
As we begin the 21st century, new dilemmas confront our society and our planet. Unprecedented levels of consumption coexist with extreme poverty. Through new technology we are more connected than we have ever been, yet civic engagement is declining. Environmental neglect continues despite heightened ecological awareness. A better balance is urgently needed.
The Australia Institute’s directors, staff and supporters represent a broad range of views and priorities. What unites us is a belief that through a combination of research and creativity we can promote new solutions and ways of thinking.
Our Purpose—‘Research That Matters’
The Institute publishes research that contributes to a more just, sustainable and peaceful society. Our goal is to gather, interpret and communicate evidence in order to both diagnose the problems we face and propose new solutions to tackle them.
The Institute is wholly independent and not affiliated with any other organisation. Donations to its Research Fund are tax deductible for the donor. Anyone wishing to donate can do so via the website at https://www.tai.org.au or by calling the Institute on 02 6130 0530. Our secure and user-friendly website allows donors to make either one-off or regular monthly donations and we encourage everyone who can to donate in this way as it assists our research in the most significant manner.
Level 1, Endeavour House, 1 Franklin St Canberra ACT 2601 Tel: (02) 6130 0530 Email: [email protected] Website: www.tai.org.au
About the Centre for Future Work
The Centre for Future Work is a research centre, housed within The Australia Institute, to conduct and publish progressive economic research on work, employment and labour markets.
It serves as a unique centre of excellence on the economic issues facing working people: including the future of jobs, wages and income distribution, skills and training, sector and industry policies, globalisation, the role of government, public services and more. The Centre also develops timely and practical policy proposals to help make the world of work better for working people and their families.
www.futurework.org.au
About the Author
Alison Pennington is Senior Economist with the Centre for Future Work. Her research focus is on work in Australia today, and in the future. She received a Master of Political Economy from the University of Sydney.
The author thanks without implication Jonathan Guy and Jim Stanford for helpful comments.

The Economic and Social Benefits of the TAFE System 3
Table of Contents
Introduction and Summary ........................................................................................................ 4
Benefits .................................................................................................................................. 5
Costs ....................................................................................................................................... 7
Cost-Benefit Comparisons ..................................................................................................... 8
Policy Implications ................................................................................................................. 9
Overview of this Paper ........................................................................................................... 9
The Crisis of Australian VET Policy ........................................................................................... 11
Reduced Enrolments ............................................................................................................ 12
Reduced Funding ................................................................................................................. 15
TAFE System Eroded ............................................................................................................ 17
The COVID Recession, Jobs and Skills ...................................................................................... 20
Review of Published Research ................................................................................................. 22
Costs of the TAFE System ......................................................................................................... 27
Benefits of the TAFE System .................................................................................................... 34
Economic Benefits of TAFE Production ............................................................................... 34
Labour Market Benefits ....................................................................................................... 39
Fiscal Savings and Social Benefits ........................................................................................ 46
Wider Social Benefits ........................................................................................................... 49
Comparing the Costs and Benefits ........................................................................................... 52
Conclusion and Recommendations ......................................................................................... 55
Appendix .................................................................................................................................. 58
Deriving TAFE’s Share of VET-Qualified workers ................................................................. 58
Calculating Unemployment & Benefit Payments ................................................................ 59
Calculating Healthcare Savings Benefits .............................................................................. 61
References ............................................................................................................................... 64

The Economic and Social Benefits of the TAFE System 4
Introduction and Summary
Australia currently faces its most significant economic challenge in many decades. COVID-19
has resulted in the shutdown of large segments of the economy and the destruction of
hundreds of thousands of jobs. With private incomes collapsing, business confidence
shattered and global supply chains disrupted, it will take many years to rebuild the economy
and enable Australians to start working again to their full potential. There is no doubt that
young workers will be hardest hit by high unemployment and underemployment in coming
years.
Training will play a vital role in reorienting the economy after the pandemic, facilitating
crisis-accelerated transitions across industries and supporting millions of workers (both new
entrants to the labour force, and existing workers displaced by the pandemic and its after-
effects) to prepare for future jobs. But Australia’s vocational education and training (VET)
system requires urgent rebuilding to ensure it can support new skills acquisition, job-
creation, and opportunity – including for those segments of Australia’s population hardest-
hit by the crisis (such as young people, women, and workers in regional communities).
Unfortunately, the VET sector enters this tumultuous period having already experienced a
profound and multidimensional crisis from policy failures and fiscal mismanagement during
previous years. These problems remain entrenched. Understanding where policy went
wrong will be critical to ensuring that VET plays its proper role in a comprehensive public
policy-led national reconstruction effort.
Enrolments in apprenticeships and traineeships had already collapsed after 2012. Current
projections now predict a further 30% drop in new apprenticeships (with 130,000 fewer
positions) resulting from the pandemic to 2023 (Mitchell Institute, 2020). Yet even as the
number of apprentices contracts, employers report prolonged skills shortages in technical
and trades occupations; meanwhile, the number of young people neither in education nor
in work is exploding. Dramatic restructuring of the VET system from the 2000s, based on
market-based delivery of programs underpinned by massive public subsidies paid to private
providers, failed to create the stable, high-quality vocational education system that the
economy needs so badly now. Private providers received enormous public subsidies, only to
come and go—sometimes even collapsing mid-program, or leaving students with poor-
quality credentials. At the same time, governments have dramatically cut funding to the
longest-standing and most reliable national provider of VET education: Australia’s once
world-renowned Technical and Further Education (TAFE) institutes. Coordinated and
effective ties between students, TAFE institutes, industry and employers have been
undermined. Once-reliable vocational pathways have been deeply damaged.

The Economic and Social Benefits of the TAFE System 5
In this report we present robust and up-to-date evidence on the broad economic benefits of
the TAFE system to Australia’s future economy. This report makes a new contribution to the
study of the economic impacts of both VET broadly, and the TAFE system specifically, in
Australia. We adopt a multidimensional approach to measuring the economic and wider
social benefits of vocational education. Our cost-benefit methodology is guided both by a
review of the extant literature, and by original research to identify and quantify the broad
economic and social benefits of vocational education. To calculate the wide-ranging
economic impacts and social benefits of the TAFE system, we use a range of quantitative
data from multiple official sources—including the Australian Bureau of Statistics (ABS); the
National Centre for Vocational Education Research (NCVER); the Commonwealth
Department of Education and Training; the Commonwealth Department of Employment,
Skills, Small and Family Business; and the Organisation for Economic Co-operation and
Development (OECD).
Here are our key findings:
BENEFITS
Despite years of significant funding pressure and policy confusion, the TAFE system
continues to make a strong and disproportionate economic and social contribution to the
Australian economy. The economic and social benefits arising from the direct activity of
TAFE institutes, and the highly-skilled higher-earning workforce that the system has helped
develop, are substantial. As outlined below, our quantitative benefits assessment has been
organised into four benefits ‘streams’: each capturing different ways in which the TAFE
system interacts with, and impacts the economy. In addition, we consider wider social
benefits that the TAFE system generates, but which are harder to quantify.
The Economic Footprint of the TAFE System
The direct operation of TAFE institutes produces about $3 billion per year in additional
value-added in Australia, including around $2.3 billion in wages, salaries and other
employment benefits paid annually. Purchases and supply chain inputs associated with
TAFEs extend and multiply this impact on the broader national and regional economies,
generating another $1.6 billion per year in ‘upstream’ economic benefits. Counting the
indirect jobs supported in the TAFE supply chain, a total of $3 billion in employment
incomes is generated by TAFE institutes each year. In turn, that income translates into an
additional $1.5 billion in incremental consumer spending on Australian-made goods and
services. Including the direct activity of the TAFEs, its supply chain, and ‘downstream’
consumer spending impacts, we estimate that a total of over $6 billion in economic activity,
supporting 48,000 positions (directly and indirectly), is generated by the presence and
activity of Australia’s TAFE institutes.

The Economic and Social Benefits of the TAFE System 6
Increased Earnings and Productivity
Students who complete VET qualifications with TAFE institutes move into the labour force
with skills that generate higher earnings compared to the earnings of workers without post-
school qualifications. Employees and owner-managers with VET qualifications (including
Certificate I/II/III/IV, Diploma and Advanced Diploma) receive a wage premium of 39%
compared with those whose highest educational attainment is Year 12 or below.
In addition, a more skilled workforce yields significant productivity benefits to employers, as
well as higher tax revenues for government. The total annual benefit that the TAFE system
generates thanks to its accumulated contribution to the skills of Australians is estimated at
$84.9 billion. Some of this is paid in higher incomes to workers; some of it is captured in
higher profits by employers. And some of it is paid in incremental taxation revenues to
government, which we estimate are worth $25 billion per year—several times more than
governments currently allocate to the cost of running the entire TAFE system.
Stronger Employment Outcomes
After training, TAFE graduates are more likely to be employed, and less likely to be
unemployed, than workers with less training. Moreover, with increased access to skilled
workers, industry can expand production and employ more people, increasing total output
across the economy. We estimate the TAFE system has increased the employability of the
VET-educated population, relative to those without post-school education, resulting in an
increase in employment of around 486,000 positions.
Reduced Fiscal Outlays
The TAFE system increases employability, thereby lowering unemployment and supporting a
healthier workforce and society. An important consequence of this is reduced social
assistance and public healthcare expenditures. We estimate the annual value of reduced
social expenses at some $1.5 billion per year.
Combined Benefits
Table 1 provides a summary of the annual impacts of TAFE across these key economic
indicators. The total annual benefit (driven by the accumulated historic investment in the
TAFE-trained workforce) is estimated at $92.5 billion. That represents around 4.5% of
Australian GDP. Those benefits can be traced back to the extra employability, productivity
and incomes (and associated savings on social benefit costs) demonstrated by the TAFE-
educated workforce.

The Economic and Social Benefits of the TAFE System 7
Table 1 TAFE Annual Economic Impact Results
TAFE Economic Footprint $6.1 billion
Higher Earnings and Productivity (Includes Higher Tax Revenues)
$84.9 billion ($25 billion)
Fiscal Savings (Social Benefits) $1.5 billion
Total Benefit $92.5 billion
Total Annual Costs $5.7 billion
Wider Social Benefits
The substantial economic benefits supported by the TAFE system, quantified in Table 1, do
not tell the whole story about the importance of TAFEs to our all-round economic and social
well-being. The TAFE system also underpins a wide range of broader social benefits that are
harder to quantify. For example, TAFEs promote stronger economic and labour market
outcomes in regional areas. They help ‘bridge’ access to further education and jobs
pathways for special and at-risk groups of young Australians. They ensure greater social
cohesion, and help to reduce crime. TAFE students are more likely to come from the lowest
quintile of society according to socio-economic disadvantage,1 more likely to be Aboriginal
or Torres Strait Islander, and more likely to identify as having a disability compared with
students of private VET providers or universities. All these features confirm that TAFEs are
critically important in addressing systemic inequality in Australia’s economy and society.
COSTS
The costs of operating the TAFE system accrue to governments, students and employers in
the delivery of vocational education through TAFE institutes. Compared to the preceding
inventory of direct and indirect economic and social benefits, the costs of operating the
TAFE system are modest by any measure. We estimate the combined costs of the TAFE
system—including government funding for training and administration, employer and
student assistance, loans and income support payments, student fees, and employer
apprenticeship and traineeship training costs—at $5.7 billion per year. That represents only
about 0.3% of Australia’s GDP.
1 NCVER statistics measure disadvantage among VET and university students according to the ABS Index of
Relative Socio-economic Disadvantage (IRSD). IRSD is a socio-economic index that summarises a range of
indicators about the economic and social conditions of individuals and households within an area, including
income and educational attainment. Low quintile scores indicate greater disadvantage relative to higher
quintiles (NCVER, 2020).

The Economic and Social Benefits of the TAFE System 8
COST-BENEFIT COMPARISONS
The TAFE system has made a leading, decades-long contribution to training and skills in the
Australian economy. On the basis of historical enrolment data, we estimate that 72.5% of
Australian workers currently holding VET qualifications received their training through the
TAFE system. Hence, Australia’s historic investment in quality public vocational education
generates an enormous and ongoing dividend, in the form of the enhanced productivity,
higher earnings, increased tax payments, and reduced social benefit costs associated with
those workers. This is a valuable and continuing payoff to the funds that were invested in
TAFEs: both now and in the past.
There is no doubt that the benefits of TAFE education to individuals, employers, the
government and wider society far outweigh the costs. As noted, the combined annual costs
for operating the TAFE system’s 35 institutes were modest—$5.7 billion. In contrast, the
annual economic benefits generated thanks to investments in TAFE-provided training were
estimated at $92.5 billion. In other words, the flow of annual benefits resulting from the
present and past operation of the TAFE system exceed the current annual costs of operating
that system by a factor of 16 times.
Keep in mind that the flow of these economic benefits resulting from a better-skilled
workforce is the legacy of Australia’s historic commitment to high-quality public vocational
education. But that commitment has been undermined in recent years by reductions in
fiscal support for public VET, and failed policy experiments with privatised, market-
delivered, but publicly-subsidised VET programs. As a result, the flow of economic benefits
generated by well-trained, better-paid VET graduates is in jeopardy today. Australia is not
replacing its stock of high-quality TAFE graduates – which means that over time, that flow of
economic benefits will inevitably decline. Reported problems encountered by many
industries and employers in recruiting and retaining adequately-skilled workers in numerous
occupations attests to the growing costs of Australia’s underinvestment in reliable, publicly-
delivered VET.
A fitting analogy can be drawn to other long-term investments that deliver an ongoing flow
of benefits – but which must be adequately maintained if that flow of benefits is to
continue. Imagine a well-built house: it generates value each year that someone lives in it.
But if the house is not maintained, and its structural integrity assured, then that flow of
benefits will quickly erode. Australia’s economy today is reaping an enormous flow of
economic benefits from a ‘house’ that was built by our TAFE system: $92.5 billion in annual
productivity, income, tax, and social benefits. But the TAFEs today have been structurally
damaged by neglect and outright policy vandalism. If we want to continue reaping those
benefits of a superior productive TAFE-trained workforce, we must repair that damage –
and quickly. With the COVID-19 pandemic ushering in an era of unprecedented disruption
and transition, this is the moment to strengthen Australia’s investments in the TAFE system.

The Economic and Social Benefits of the TAFE System 9
We can make our vocational training system once again the envy of the world, and ensure
that our economy, our communities, and our governments continue to reap the benefits of
a productive, well-trained workforce.
POLICY IMPLICATIONS
Australia desperately needs a thorough overhaul of VET sector policy, and a lasting
commitment to repairing a badly-damaged VET system. As the economy staggers in the face
of the COVID-19 pandemic and resulting global recession, we need expanded access to VET
education, stronger pathways from training to work, and a more cohesive and coordinated
post-school education system. Revitalised TAFE institutes, as the most reliable ‘anchors’ of
vocational training, must be at the centre of that reconstruction process.
There is a fitting historical analogy for the present imperative to repair our VET system,
starting with the TAFEs. After the Second World War, Australia launched a coordinated
national training strategy, as a key part of a National Reconstruction Plan aimed at ensuring
returning soldiers would have productive employment opportunities – and making sure the
economy did not slip back into a stubborn depression.2 We need a similarly comprehensive
national strategy for skills and training today, starting with the urgent restoration of public
funds to the most experienced, reliable and high-quality, national-level, vocational training
provider in Australia: the TAFE system.
Our findings suggest there is strong economic rationale for strengthening and expanding
VET access for young, at-risk groups, and for all workers who lack post-school qualifications.
Australia will squander the demonstrated and ongoing economic benefits generated by our
investments in TAFE institutes, and unduly limit our post-COVID reconstruction
opportunities, if we do not act quickly to reinstate the funding and critical role that TAFE
plays in the VET system.
OVERVIEW OF THIS PAPER
The remainder of this paper is organised as follows. First, we review the history of
underfunding and failed market-based policies that have left Australia’s VET system in such
poor shape to respond to the crisis of the pandemic and resulting recession. The next
section then discusses how this legacy of policy failure has left the VET system poorly
prepared to confront the unprecedented labour market challenges arising from the COVID-
2 The National Reconstruction Plan was launched by the Commonwealth Government in 1942, years before the
eventual cessation of hostilities, and featured several complementary elements: including building national
manufacturing and infrastructure, extending public education and vocational training, expansionary macro-
economic policies, and a commitment to full employment. For more on Australia’s experience with 1940s
reconstruction, see MacIntyre (2015).

The Economic and Social Benefits of the TAFE System 10
19 pandemic and associated recession. The following section reviews the methodology and
findings of other published research, which has also attempted to analyse the costs and
benefits of public and social programs. The next sections of the report review and quantify
the benefits and costs associated with the TAFE system in detail, broken into various
categories and components. The benefits include the direct economic injections resulting
from the operation of TAFE institutes, the superior productivity and income flows resulting
from the TAFE-trained workforce, and the broader (often non-quantifiable) social benefits
produced thanks to a more accessible public training system. The costs include expenses of
operating the TAFE system allocated to governments, students, and employers. After
comparing these costs and benefits of the TAFE system, the final section provides a
concluding discussion of policy implications arising from these findings. A technical appendix
provides more details regarding several of the methodological issues confronted in the cost-
benefit analysis.

The Economic and Social Benefits of the TAFE System 11
The Crisis of Australian VET Policy
Strong vocational education and training (VET) systems are vital to the success of dynamic,
innovative economies and inclusive labour markets. Australia’s VET system once provided
well-established and dependable education-to-jobs pathways, but a combination of policy
mistakes and fiscal mismanagement plunged the VET system into a lasting and
multidimensional crisis. A recent index comparing education systems and labour market
outcomes across 80 countries ranked Australia’s VET system, once the envy of the world, as
20th. For mid-level skills capability, the ranking was even lower: 38th in the world (Lanvin &
Monteivo, 2020).3
Multiple policy failures produced this outcome:
• Both state/territory and Commonwealth levels of governments have failed to
provide adequate long-term fiscal support to vocational training, with post-
secondary education expenditures increasingly focused on the university sector.
• A policy experiment in establishing a ‘contestable market’ for vocational education
services that decentralised offerings, course delivery and student recruitment to
unaccountable for-profit training providers also failed. Poor-quality programs and
providers proliferated, with the result that VET skills coordination and planning is in
disarray.
• Enormous public subsidies for private VET providers were introduced under the
poorly controlled VET FEE-HELP loans system—introduced first in 2007, and then
expanded in 2012 through demand-driven arrangements. The VET FEE-HELP loans
regime wasted public resources, and spurred unethical and unproductive practices in
the for-profit VET system. At the same time that up-front fees for VET courses were
introduced, Commonwealth funding for university enrolments was uncapped. When
coupled with the existing HECS-HELP regime (which allows for full fee deferral),
vocational education was effectively discouraged—even for those students for
whom vocational education was better aligned with their skills and interests. The
unequal funding treatment between post-secondary funding regimes continues to
distort higher education decision-making by young Australians.
• Despite the government’s own 2016 review into VET, which recommended fee caps
and tighter regulation (Department of Education and Training, 2016), the
Productivity Commission’s (2020b) interim report on national VET reforms
3 Other indications of access and mobility problems in Australia’s education-to-jobs system are low rankings
for matching labour market demand to workforce supply (ranked 17th), the provision of lifelong learning
(14th), and access to growth opportunities (14th).

The Economic and Social Benefits of the TAFE System 12
responding to the COVID-19 crisis has worryingly recommended the same policies
that landed the sector in hot water before the pandemic. Measures recommended
by the Productivity Commission include uncapping fees, expanding access to student
income-contingent loans, and replacing direct public subsidies to providers with a
student voucher system. These policies would reinforce the failure of previous
market-driven models.
• While experimenting in marketisation, most state/territory governments and the
Commonwealth Government ruthlessly cut the budgets of the public TAFE system—
Australia’s longest-standing, quality, publicly accountable core provider of vocational
education. Consequently, the TAFE system’s vital ‘anchor’ function as a high-quality
public institution – working in cooperation with industries, and embedded in
communities – is in jeopardy.
REDUCED ENROLMENTS
After a short-lived surge in enrolments once VET FEE-HELP was extended across the sector,
program enrolments in vocational training (including apprenticeships and traineeships) have
fallen sharply. Eligibility criteria and oversight were tightened in 2015–16 in response to
numerous scandals (and VET FEE-HELP was replaced by the new VET Student Loans
Scheme4). However, without any corresponding commitment to resource more genuine VET
streams as alternatives to dodgy for-profit providers, this only reinforced the enrolment
decline.
This failure to seize the opportunity to repair the damage of marketisation during the 2015–
16 government VET review has seen the number of program enrolments begin to decline
precipitously – and that decline has accelerated during the COVID-19 pandemic. Table 2
shows that program enrolments across the total VET sector declined by around 450,000
between 2015 and 2018. By number of enrolments, the decline has been highest for private
training providers and for TAFE institutes; but as a proportion of previous enrolments, the
decline has been experienced broadly across most providers. TAFE institutes broadly
maintained their 32% share of all VET enrolments from 2015 through 2018.
4 The Commonwealth Government implemented the VET Student Loans program on 1 January 2017, replacing
the existing VET FEE-HELP scheme for new students. The new VET Student Loans provide eligible students
with an income-contingent loan to pay their tuition fees for VET qualifications at the Diploma level and
above. Like university HECS loans, students are only required to repay loans when their income after
graduation exceeds a minimum threshold.

The Economic and Social Benefits of the TAFE System 13
Table 2 Program Enrolments by VET Provider (2015–18)
Provider Type 2018 Change 2015–18
% of all Enrolments
2015
% of all Enrolments
2018
Private Training Providers
1,391,359 –260,592 54% 53%
TAFE Institutes 833,134 –155,806 32% 32%
Enterprise Providers 83,851 –2618 3% 3%
Community Education Providers
102,488 +845 3% 4%
Schools 144,090 –32,135 6% 5%
Universities 67,602 –7148 2% 3%
Total 2,622,523 –457,455 100% 100%
Source: NCVER, 2018.
Apprenticeship and traineeship positions have been another casualty of the Australian VET
system crisis—falling dramatically since 2012. Figure 1 shows that the number of
apprentices and trainees in training plunged by almost half after 2012, to just 275,000 in
2017. That decline levelled off and recovered just slightly; but there were only 5000
additional apprentices and trainees in training by June 2019. However, even that modest
growth was subsequently lost because of the severe impacts of the coronavirus crisis on
employment and recruitment. The Mitchell Institute (2020) predicts a further 30% drop in
new apprenticeships (representing a further decline of 130,000 fewer apprenticeships) from
the virus shutdowns through to 2023. That comes on top of the pre-pandemic decline of
more than 200,000 apprentices and trainees removed from the skills pipeline compared
with 2012 levels. If the Mitchell Institute forecast is realised, total apprenticeship and
traineeship numbers will have declined by 70% since 2012.
Since the TAFE system is the dominant provider of apprenticeships and traineeships—
delivering around half of all government-funded programs in 20185—it is not a coincidence
that Australia’s crisis in apprenticeship numbers has coincided with funding cuts to TAFE.
Apprenticeships require long-term investment and commitment from both the apprentice
and the employer. The OECD (2010, p. 49) acknowledges that this relationship is best
established through public funding arrangements, since VET skills yield wide returns to
employers and the economy, and pure market models cannot adequately reflect these
returns in course fees to students. As a result, without public funding all actors suffer
through under-provision of skills.
5 ‘Government-funded programs’ refers to all Commonwealth and state/territory government-funded training
delivered by technical and further education (TAFE) institutes, as well as by other government providers
(including universities), community education providers and private training providers.

The Economic and Social Benefits of the TAFE System 14
Figure 1. Total Apprentices and Trainees in Training, 2005–19.
Source: NCVER, Apprentices and Trainees (June 2019). Annual averages.
Indeed, the establishment of private market principles for VET delivery and the VET FEE-
HELP scheme increased both the cost of education for individuals (many of whom could not
afford the new fees) and the employer risk (and costs) of investing long-term in their future
workforce. This retreat of government from vocational skills and training has reinforced
limited-horizon, more apprehensive attitudes among employers, who now invest less in
workforce training and skills—particularly given the context of increased competition and
access to an abundant supply of underutilised labour. An Australian Industry Group (AiG
2018) survey of firms employing a total of over 110,000 employees found that only half
these firms planned to increase training expenditure in future years. The same survey
reported that employers are facing stubborn skills shortages, particularly in trades and
technicians.
Decline in VET training programs has occurred alongside continued growth in the overall
workforce—and the associated demand to expand training provision. Expressed as a share
of total employment, the decline in apprentices and trainees in training has been even more
severe. Figure 2 illustrates the decline in the overall rate of vocational education undertaken
across the Australian economy from 2012 to 2019 (before the pandemic struck). In 2019,
total participation in apprenticeships and traineeships represented only 2.1% of Australian
employment—just half the 2012 rate. This constitutes one of the weakest vocational
education participation rates of any industrial country.

The Economic and Social Benefits of the TAFE System 15
Figure 2. Apprentice and Trainee Training Rate, 2005–19.
Source: Author’s calculations from NCVER, Apprentices and Trainees (June 2019) and ABS
Catalogue 6202.0. Annual averages.
REDUCED FUNDING
The combination of reduced funding for public VET education and the introduction of VET
FEE-HELP triggered a damaging cycle of cumulative causation: reduced enrolments allowed
government to further cut funding, thereby both reducing course offerings and the quality
of vocational training, which further reduced the standing of the TAFE system among
students and employers, and discouraged enrolments even further.
Figure 3 presents ABS annual data on government spending by education sector for the
financial years 2005–06 to 2017–18. 6 The data provide total operating expenditure on
education and training by Commonwealth and state/territory governments, and
6 Data for the last four financial years from ABS 5518.0.55.001 provide government expenditure figures under
the following classifications: ‘school’, ‘tertiary’ and ‘other education’ only. The VET and university sectors are
combined under ‘tertiary education’. We calculate a proxy for VET expenditure from the ‘Control n.f.d.’
sector which represents expenditure on public universities (e.g. tertiary education – Control n.f.d = VET).
However, this figure does not include state–Commonwealth consolidations. This may explain why our final
funding figures are higher than those reported in other studies utilising the same ABS catalogue (e.g. Pilcher
and Torii, 2017). In addition, we report figures in real 2017–18 (Australian) dollars. Nominal data have been
converted to real terms using the ABS State and Local Government Final Consumption deflator.

The Economic and Social Benefits of the TAFE System 16
expenditure of public entities including government schools, TAFE institutes and public
universities. All spending from public funds by private providers is included.
Figure 3. Real Government Funding by Sector (2005/6 to 2017/18).
Source: Author’s calculations from ABS Catalogue 5518.055.001, Table 2. Figures adjusted to
2018 dollars.
The figures show that government VET spending has languished far below funding for
schools and universities over the last decade, declining by 1% in real terms since 2005–06 to
only $6.9 billion in 2017–18. Over the same period, real spending on primary and secondary
schools increased by 23% from $42.7 billion to $52.9 billion—consistent with the growth in
everyday operating costs due to both increasing student numbers and improved per capita
spending (Pilcher & Torii, 2017). Meanwhile, government expenditure on universities
increased the most of all education sectors, with a total $30.2 billion spent in 2017–18—
more than 45% above 2005–06 levels (in real terms). University spending growth escalated
from 2012, when the government introduced uncapped funding based on enrolments—the
same year that the VET FEE-HELP loans system was introduced. These contradictory policies
have led to stark funding divergences between VET providers and universities, reflecting the
failure of policy makers to create a more coherent and balanced tertiary education system.
Calculating total government expenditure per enrolment by sector paints an even starker
picture of funding inequities between universities and VET providers in tertiary education
(as indicated in Table 3). Government spends just $6,479 per year per full-time equivalent

The Economic and Social Benefits of the TAFE System 17
(FTE) VET enrolment, compared to $40,495 per year per FTE enrolment for universities,7 and
$13,574 per year for each primary and secondary school enrolment. This gross imbalance in
government funding to VET hinders Australia’s ability to deliver high-quality vocational
education and to prepare for future jobs.
Table 3 Government Funding Per Enrolment by Sector (FTE)
(2017/18)
Total FTE Enrolments Funding Per FTE Enrolment ($)
VET 1,070,735 $6,479
Schools 3,893,834 $13,574
University 746,093 $40,495
Source: Author’s calculations from ABS Catalogues 5518.0.55.001, Table 2, and 4221.0; Department of Education and Training, uCube; NCVER, Total VET Students and Courses. School enrolments combine government, catholic and private schools.
TAFE SYSTEM ERODED
The past decade of failed policy experimentation in VET delivery has decimated the TAFE
system. The number of TAFE providers has been cut by almost 40% within the last five years
alone—only 35 TAFE providers remain nationally.8 TAFE institutes once functioned as
‘anchors’ of the VET system: a network of stable, well-funded, publicly accountable and
trusted institutions that provided a full range of vocational courses (including course
offerings considered too unprofitable to deliver in the private sector). The TAFE system
oversaw most apprenticeships, and it innovated new curriculums and teaching methods. In
1996, 83% of students undertaking publicly funded VET were registered at TAFE institutes
(NCVER, 2018).
In contrast, from the late 1990s, Australia began instituting training market-oriented policies
to complement the wider neoliberal push for labour market deregulation. The introduction
of the ‘User Choice’ policy in 1998 marked the official emergence of a newly minted market
system for VET (Toner, 2018), whereby TAFE institutes were supposed to compete with
private providers on the ‘same ground’ for (publicly subsidised) student dollars. In 2008,
Australian governments made all public VET funding ‘contestable’. Numerous systems were
7 Government spending per FTE university enrolment has not been adjusted for HECS loan repayment. 8 The number of TAFE providers nationally has declined from 53 in 2014, to only 35 in 2018 – a 39% reduction
in TAFE institutes (Table 5A.7; Productivity Commission, 2020a).
The Economic and Social Benefits of the TAFE System 18
introduced to price and allocate public training funds, including tendering processes,
voucher systems and uncapped pricing under the VET FEE-HELP scheme.
However, decades of delivering a full infrastructure of public vocational education left the
TAFE system with ongoing fixed and operating costs that private providers did not incur
(including infrastructure, capital projects and the maintenance of industry and schools
partnerships). Some private providers developed gimmicky marketing schemes (for
example, offering ‘free’ iPads for new students that were, of course, hidden within tuition
costs), and poorly designed and delivered courses proliferated nationally. TAFE institutes
were stranded, while public resources flowed to private VET provision. This forced the cash-
strapped TAFE system to pare back offerings, further undermining its standing among
students and employers as a reputable and stable skills provider. By 2018, only 61% of
government-funded VET students were enrolled in TAFE institutes (NCVER, 2018).
Wheelahan (2018) reports that the total hours of training offered by TAFE institutes
nationally fell by 30% between 2009 and 2016, compared with a near-doubling of hours
provided by private providers over the same period.
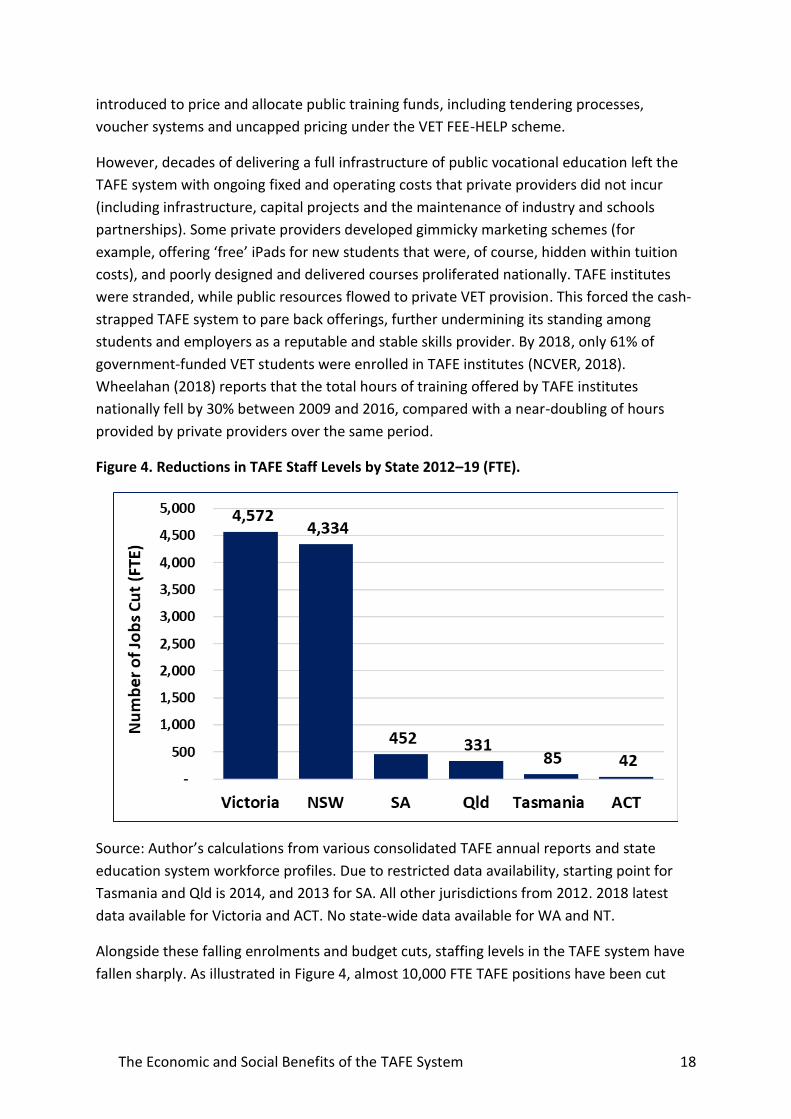
Figure 4. Reductions in TAFE Staff Levels by State 2012–19 (FTE).
Source: Author’s calculations from various consolidated TAFE annual reports and state
education system workforce profiles. Due to restricted data availability, starting point for
Tasmania and Qld is 2014, and 2013 for SA. All other jurisdictions from 2012. 2018 latest
data available for Victoria and ACT. No state-wide data available for WA and NT.
Alongside these falling enrolments and budget cuts, staffing levels in the TAFE system have
fallen sharply. As illustrated in Figure 4, almost 10,000 FTE TAFE positions have been cut

The Economic and Social Benefits of the TAFE System 19
since 2012 across six states and territories.9 The two largest TAFE systems—Victoria and
NSW—have been the worst hit, with nearly 9000 FTE positions cut just from these states.
Not surprisingly, an environment of job cuts and restricted funding leads to increased
pressures on TAFE employees. A recent survey of TAFE employees by the Australian
Education Union (2020) confirmed increasing workload pressures across all teaching levels.
The average TAFE institute teacher is now performing an additional day of work per week
unpaid; and 93% of respondents reported that the pace or intensity of their work had
increased since 2016.
9 Figure 4 includes those 6 states and territories which publish TAFE workforce data.

The Economic and Social Benefits of the TAFE System 20
The COVID Recession, Jobs and Skills
The retreat of public-funded VET will make it all the harder for Australia’s labour market to
respond to the major employment shocks precipitated by the COVID-19 pandemic.
Deliberate shutdowns of large sections of the economy to protect public health have caused
an unprecedented economic crisis. The resulting economic contraction is faster and deeper
than the Depression of the 1930s, with falling employment, GDP, incomes and tax revenues.
The pandemic has certainly shocked the labour market, with true unemployment rising far
beyond what official ABS figures indicate. Official unemployment rose to above 7% in the
first months of the recession—a very serious level. However, if we include those who were
‘employed’ but who did not work any hours, those who did not actively seek work (and thus
were considered outside of the labour force), and the equivalent loss of jobs resulting from
the steep decline in average hours lost across the workforce (on a FTE basis), an effective
unemployment rate of around 20% is indicated.10
Young workers have been hardest hit by the shutdowns, due to their heavy employment in
vulnerable customer-facing service sectors like retail, hospitality and personal services.
Between March and April 2020, hours lost for young workers aged 15–24 were double that
of older age groups, and their participation rate declined by 6% compared to 2% for workers
aged 25–54 (Borland, 2020). But employment outcomes had already been worsening for
young workers since the GFC. More than 600,000 people aged 15–24 were not ‘fully
engaged’ in either employment or education in 2019 (defined as being either in full-time
education or employment or in part-time combinations of both). This is an increase of over
130,000 from 2007.11 Earnings lost from young people’s time out of employment, education
or training are estimated at 1% of GDP (or over $16 billion per year in 2016; OECD, 2016).
The pandemic will only increase youth dislocation. Through failure to harness a generation
brimming with skills and capacity, COVID-19 will also increase the costs of long-term youth
unemployment on young people’s lives, their families and the wider economy. Despite the
dire need for sustained public investment to generate jobs in the crisis, the Commonwealth
Government has yet to commit to any generalised or targeted long-term jobs-generating
measures.
Another major trend impacting skills and employment, and that will be accelerated by the
pandemic, is the rapid change in the composition of Australia’s business community. Recent
years have witnessed the loss of thousands of medium and large firms. ABS firm data show
that there are 20,000 fewer medium-sized firms (employing 20–199 people), and over 2000
10 Author’s calculations from ABS Catalogue 6202.0. 11 From ABS Catalogue 6227.0.

The Economic and Social Benefits of the TAFE System 21
fewer large firms (employing more than 200 people), than there were 15 years ago.12
Meanwhile, more than 5,000 small firms employing less than 20 people, and an astonishing
200,000 micro-firms employing less than five people were created over the same period.
Investment in skills, new capital formation and innovation are all very low in small firms,
since they lack the financial resources and the economies of scale required to invest in long-
term workforce planning. This is why small firms are typically unlikely to have dedicated
training staff of their own (Hawke, 1998), and hence are especially dependent on the
training services provided through a public system. A smaller and weaker TAFE system will
not be able to address the increasingly inadequate training capabilities of Australia’s
growing community of very small businesses.
In sum, the Australian labour market faces a challenging period of structural change in the
years ahead, made all the more treacherous because of the uncertainty regarding
continuation of emergency income supports and wage subsidies (like JobSeeker and
JobKeeper). These structural changes demand institutions that can assist the gathering of
industry-level information on skills demands, as well as deliver training to assist in labour
(re)allocation as the economy tries to regain its footing after the pandemic. The federal
government’s independent National Skills Commission (NSC) established in June to forecast
jobs and skills in rapidly evolving conditions is mandated to address the present dearth of
labour market planning tools operating at the federal level. But initial indications from
government (including its ‘JobTrainer’ program announced in July) suggest that it still
refuses to acknowledge the central role of public VET services, and TAFE in particular, in
improving Australia’s skills system. Indeed, the Prime Minister’s announcement of the new
$2 billion program did not even mention TAFE, and is likely to reinforce the flow of public
monies into private VET providers.13
However, government has an historic opportunity in this pandemic to strengthen skills–jobs
planning by building on the essential role that TAFE institutes already play in labour market
planning and coordination. In each state, TAFE institutes work collaboratively with
government, industry and other educational institutions (including schools and universities)
to forecast future skills needs and to align program offerings to meet that demand.
Collaborative and flexible linkages are driven by the TAFE system’s public commitment to
skills and education, and these linkages can support government both to deliver on its
investments and to support employers by nurturing job clusters aligned to identified growth
areas in Australia’s recovery.
12 Author’s calculations from ABS 8165.0 Counts of Australian Businesses, including Entries and Exits. Table 13. 13 Prime Minister of Australia (2020).

The Economic and Social Benefits of the TAFE System 22
Review of Published Research
Economic Benefits of TAFE Institutes
There are no existing studies on the national economic impacts of the TAFE system. KPMG
(2018a, 2018b) has measured the benefits of TAFE institutes at the level of individual state
economies (Queensland and Victoria). Our study is the first national study to include the
Commonwealth costs and benefits of delivering TAFE, and to include the impacts of TAFE for
federal revenues and fiscal outlays for welfare and public healthcare.
KPMG’s Queensland TAFE study uses general equilibrium modelling to measure the
economy-wide impacts of TAFE operations. The study identifies several key economic
benefits from the TAFE system, including a wage premium to people with TAFE
qualifications of $529 million,14 improved employment outcomes worth $600 million, and
international exports (purchased by foreign TAFE students) of $134 million (all figures
annual). KPMG find that for an investment of $707 million in TAFE Queensland in 2017, the
total economic value realised to the state’s economy was some $1.8 billion. Hence, for
every $1 spent, a total of $2.55 value-added is created.
KPMG use the same methodology for a parallel study of the social and economic benefits of
the Victorian TAFE system. They find that Victoria’s TAFE institutes generated $2.9 billion
per annum in Gross State Product (GSP) from higher workforce participation and earnings,
along with additional economic demand generated by these improved labour market
outcomes, by the TAFE system’s direct operations, and by international export
contributions. For every $1 spent on Victorian TAFE, the TAFE institutes returned $2.19 to
the state economy.
Cost-benefit studies for vocational education and other education systems
A range of cost-benefit studies have considered the economic impacts of broader education
systems. For example, Birch et al. (2003) conduct a comprehensive cost-benefit study of the
adult and community education sector in Australia. They adopt a human capital model to
develop estimates of economic impacts on individuals (including, for example, course fees
and deferred earnings) and on communities (for example, income to the sector’s providers,
14 It should be noted here that the KPMG methodology uses a different approach to estimating the value of
higher wages resulting from TAFE training, from the one we utilise in the discussion below. The KPMG model
estimates the value of higher wages accruing only to those workers who graduate TAFE in the specific
reference year considered, in order to generate a flow of benefits that can be associated strictly with the
costs invested in TAFE for that same year, and thus calculate a return on that year’s public investment. In
contrast, we measure the aggregate annual wage benefits resulting from the historic accumulation of TAFE-
provided skills in the workforce at the present time; this flow of benefits is much larger than the narrower
conception considered by KPMG.

The Economic and Social Benefits of the TAFE System 23
wages and salaries, additional tax revenues). Three scenarios are adopted, with the ‘most
likely’ returning net community and private labour market benefits exceeding $3 billion.
Multiple studies of early childhood education demonstrate the net economic benefits of
investing in public childcare. These studies develop additional bridging steps in their
methods to trace capabilities developed through education in early years through to higher
education (and then the workforce). PwC on behalf of The Front Project (2019) has
conducted the most comprehensive cost-benefit analysis in the Australian context for early
childhood education. They estimate $2 billion in costs for 15 hours of childhood education
for one year before school, compared to $4.8 billion in benefits.15 This produces a benefit-
cost ratio of $2 in benefits generated for every $1 spent.
Some studies report cost-benefit analyses for workplace-integrated education and training
through apprenticeships. The Centre for Economics and Business Research (CEBR) in the UK
(2014) measures the wage premium by taking the total number of jobs requiring
apprenticeships, quantifying total earnings in these jobs, and comparing to earnings in
counterfactual jobs that do not require apprenticeship completion for entry. They find
economic gains in higher wages, productivity and government revenues totalling £31 billion
per year. Higher employment levels reduce government expenditure on unemployment
benefit payments by £370 million per year, and benefits to organisations while training
apprentices in reduced wages bills are worth an additional £2 billion per year. For each £1 of
public money spent, apprenticeships generate an additional £21 for the national economy.
The Conference Board of Canada (2019) develops two main benefit ‘streams’ for calculating
the economic benefits and costs of high school education completion. The first model
captures the economic footprint of high schools as economic actors in their own right—
including direct, indirect and induced economic impacts. The sum of all these effects
represents the overall impact of the sector’s economic footprint. They find that, including
indirect and induced impacts, a 1% increase in public education spending in Ontario
supports around 4200 additional jobs. An increase in fiscal spending on education of 1% (or
an additional CA$291 million in spending on education services) leads to an additional
CA$371 million in economic activity—demonstrating an economic multiplier of 1.3-to-1.
The second Conference Board stream uses a scenario approach in three areas of
government spending—social assistance, healthcare and criminal justice—to quantify the
fiscal savings from raising the high school graduation rate. They identify annual cost savings
of CA$5 million in social assistance (and a cumulative saving of CA$1 billion to 2040);
CA$6 million in annual savings for public healthcare (or CA$1 billion in cumulative savings to
2040); and CA$5 million in reduced annual criminal justice spending, compounding to
another CA$1 billion in aggregate savings.
15 The study discounts long-run future benefits at 3% per year.

The Economic and Social Benefits of the TAFE System 24
Our study considers both of these ‘streams’ (the economic footprint of the education
system’s operation, and the fiscal savings arising from improved life chances for graduates)
in assessing the economic impacts of TAFE.
Higher wages and employability
There is a significant body of academic and policy literature demonstrating the strong
earnings and employment returns to VET. A UK study by Conlon and Patrignani (2013) find
an earnings premium associated with completing VET of 2–4% per year in the workforce for
seven years post-qualification attainment, and a 3–4% increase in the probability of
employment.
Several international and Australian studies have estimated the earnings returns to
vocational education, typically by comparing the earnings of VET graduates with those of
Year 12 or below–Year 12 earners. For example, a recent Australian study on returns to
education by Gong and Tanton (2018) uses Household, Income and Labour Dynamics in
Australia (HILDA) survey data to assess the returns to post-school qualifications compared
with Year 12 between 2006 and 2016. No wage premium to vocational education compared
with Year 12 is identified (for either males or females). A key limitation of the findings is the
exclusion of self-employed workers (who are typically higher-paid VET qualification-
holders). Moreover, a comparator of Year 12 alone is less relevant to measuring the benefits
of VET qualifications, for several reasons: including that many students enter VET without
having completed Year 12. A more appropriate baseline to measure the impacts of VET
would include school leavers and the unemployed. This is confirmed by the significant
negative wage premium identified for not finishing Year 12 of around 10% for males and 8%
for females.
Long and Shah (2008) assess returns to VET compared with a composite group of workers
whose highest level of schooling was Year 12 or below. Incomes of the self-employed, as
well as the unemployed, are included. Confirming that VET is an important pathway for
school leavers, the study finds that rates of return to VET are higher for those whose highest
school qualification was Year 10, as compared to Year 12 (particularly for females). The
study finds that the individual return on investment for males undertaking Diplomas or
Certificates III/IV and for females undertaking Diplomas exceeds 20% for full-time study.16
Rates of return increase greatly for part-time students, due to lower forgone earnings.
Leigh (2008) also identifies significant individual returns to vocational education, and
describes the source of returns: around one-third of the gains arise from higher
productivity, and two-thirds from higher labour force participation. Compared with an
educational attainment of Year 11 or below, Wilkins and Lass (2018) find a 25% wage
16 Individual return on investment is the additional income earned through the VET qualification, minus the
costs of enrolling in VET courses, which include course fees, income forgone while studying, non-completion
costs, and impacts of subsidies on individual VET course outlays.

The Economic and Social Benefits of the TAFE System 25
premium to Certificate III/IV-holding males (but no significant premium for females), and a
39% and 14% premium to Diploma- and Advanced Diploma-holders among males and
females, respectively.17
One international study on increased female labour force participation due to access to low-
fee childcare in Quebec, Canada, is useful for the present study’s assessment of increased
employability (Fortin et al., 2018). The authors estimate that an additional 70,000 women
entered the workforce due to enhanced childcare access, raising total employment by 1.7%
and GDP by CA$5 billion. This influx of new wage incomes and GDP returned an estimated
CA$2 billion in government revenues and social assistance savings, far exceeding net
expenditure of CA$2 billion on the enhanced access program—showing that this policy
literally more than paid for itself.
Additional productivity benefits
Once the wage and employment returns associated with holding a particular qualification
are calculated, the productivity gained by the qualification can be estimated. Some studies
assume that returns to educational qualifications reflect the individual worker’s marginal
productivity (for example, KPMG 2018a, 2018b). Hayward et al. (2014) vary this assumption,
allowing for productivity increases greater than wages, recognising that if the productivity of
an individual were not greater than their cost, employers would lack an incentive to employ
that individual.
A longitudinal UK study by Dearden et al. (2005) finds that only half of the benefit of training
accrued to the individual in higher wages; the rest was captured by employers and/or
consumers through enhanced profit share and/or lower output prices. This finding is
consistent with Australian research, which has identified a long-term decline in labour’s
share of total national income, as well as a weaker relationship between wages and labour
productivity.18 In that context, the productivity benefits of vocational education cannot be
proxied by a wage premium alone.
Education and health
There is substantial international and Australian evidence of strong links between education
and health outcomes. This is partly explained by an observed correlation between education
and health determinants—such as risk taking, smoking, and using (or not using) preventive
services (Australian Institute of Health and Welfare, 2019; Feinstein et al., 2006). A UK study
17 The absence of a wage premium for full-time employed women holding Certificate III/IV qualifications
compared to Year 11 and below reflects entrenched low-wages environments that are typical of the
undervalued feminised industries into which these qualifications provide entry, such as healthcare and
community and social services. 18 See, for example, Flanagan and Stilwell (2018) and the research referenced therein.

The Economic and Social Benefits of the TAFE System 26
finds that individuals with higher vocational degrees were less likely to visit the GP than
individuals with no post-school qualifications (Windmeijer and Santos Silva, 1997).
In Australia, Stanwick et al. (2006) find that Australian males whose highest qualification
attainment was a Diploma or an Advanced Diploma were 0.5% more likely to have better
physical health and 1% more likely to have better mental health than those who had
reached Year 11 or below. The Mitchell Institute finds that 42% of male and female school
leavers of working age have a long-term health condition, compared to only 26% of the
general working-age population (Lamb and Huo, 2017).

The Economic and Social Benefits of the TAFE System 27
Costs of the TAFE System
This section outlines the direct costs of delivering the TAFE system in its current (downsized)
condition. Table 4 provides a summary of the various cost categories included in our analysis
for 2018 (these are the most recent data currently available). We have considered all direct
costs of TAFE delivery, including government funding for training and administration,
employer and student assistance, loans and income support payments, student fees, and
employer costs for training apprentices and trainees. We do not include certain indirect VET
costs associated with education, such as tax expenditure (forgone revenues for government)
and opportunity costs (forgone earnings for students).
Table 4 Summary of TAFE Costs Items and Annual Costs
Item Estimated Annual
Cost (2018)
Government Total funding (Commonwealth and state/territory, including capital costs)
$3.17 billion
Employer assistance $84 million
Study assistance $17 million
Administration and governance $77 million
VET Student Loans and Trade Support Loans
$243 million
Income support payments $59 million
Total Government $3.65 billion
Students Student fees $1.13 billion
Employer Apprenticeship and traineeship training costs
$934 million
TOTAL $5.71 billion
Source: Author’s compilation from NCVER (2019c); student fees across consolidated state/territory figures from TAFE Annual Reports 2018–19 for NSW, ACT, South Australia and Queensland; WA from Office of Auditor General, Appendix 3: Universities’ and TAFEs’ expenditure and sources of revenue. Apprenticeship costs derived from ABS 6306.0 (see Footnotes 26-27).
Where specific TAFE institute data were available, this was utilised in our analysis. Where
disaggregated data by VET provider type were not available, our estimates of TAFE institute
costs were based on the TAFE system’s share of all VET students in 2018 (including private
providers), or on the TAFE institutes’ share of all students undertaking vocational education

The Economic and Social Benefits of the TAFE System 28
with public providers. All student population data are sourced from NCVER. Each cost item
has been calculated on an annual basis.
TAFE Delivery and Administration
NCVER (2019c) collates data on total government funding for Australian VET including
funding allocations across Commonwealth and state/territories. Certain funding activities
can be split by provider type, including private, public and other categories. ‘Public’ provider
funding includes total government funding for VET activities to TAFE institutes, skills
institutes, polytechnics and universities. Total VET provider-level figures include funding for
VET delivery (all funding for the delivery of training outcomes, including operational/base
and block funding, and subsidies targeted at supporting access), as well as capital funding
(major capital projects and acquisitions to host VET training). Using NCVER total VET student
data, we estimate the TAFE system’s share of VET students studying within public providers
(92%) and then scale the total public VET funding for 2018 by the TAFE student share. The
total annual cost of TAFE VET delivery (including capital costs) is thus estimated at
$3.2 billion.
Other funding activities reported separately in NCVER’s government funding inventory (and
not included in the funding by provider data) relevant to the costs of TAFE delivery include
employer assistance, student assistance, and system administration and governance
funding. The proportion of these total VET costs attributed to TAFE institutes is calculated
based on their 14% share of total VET students in 2018. Note that:
• Employers receive government assistance to engage in VET, including funding for
workforce training, and incentives to take on apprentices and trainees. General
assistance for employers to engage in VET information and administrative support
includes tax exemptions, offsets and rebates. The total annual cost of employer
subsidies for TAFE students is estimated at $84 million.
• Students receive assistance for equipment, travel and other non-tuition costs
associated with undertaking VET study. Student assistance funding includes loans,
grants and subsidies to VET students. The proportion of this student assistance
flowing to TAFE students is estimated at $17 million.
• The costs of administering the national VET system, including supply and services,
and of employee expenses within each jurisdiction’s VET portfolio (including direct
administration and governance costs of the providers, including TAFE institutes) are
captured within the cost of system administration and governance of TAFE institutes.
This is estimated to be $77 million.

The Economic and Social Benefits of the TAFE System 29
Student Loans
Student loans represent additional costs within the TAFE system delivery. The
Commonwealth Government provides funding for two income-contingent loan schemes:
the VET Student Loans program (which includes grandfathered VET FEE-HELP loans) and the
Trade Support Loans Scheme.19 Government provisions for VET loans are presented
separately in NCVER’s government funding tables. NCVER reports the total VET Student
Loan amount in the reporting year, rather than the ultimate net costs to government of
administering the loans. Actual costs would account for repayment of most of the loans over
a given period of time.20
Given the lack of government data on actual VET Student Loan costs by provider type (public
and private providers), and the ambiguous status of government financing of VET loans
(such as a 2019 decision to absorb $500 million in ‘dodgy debts’ associated primarily with
private providers), we elect to use NCVER’s total loan amount figures as proxies for
government student loan costs. The cost of all income-contingent VET Student Loans to
TAFE students is calculated as a proportion of all VET Student Loans paid to students
enrolled at public institutions. The TAFE institutes’ proportion of public loan costs is based
on their 2018 share of all public students (92%).21 The total cost of income-contingent VET
Student Loans to TAFE students is therefore $175 million.
Eligible apprentices can apply for assistance with the costs of living and learning through the
Trade Support Loans Scheme. Loans of up to $21,078 for eligible apprentices are distributed
over four years (Commonwealth Government, 2019). The total cost of Trade Support Loans
to TAFE students is calculated based on the TAFE system’s share of apprentices and trainee
students in the VET system in 2018 (32%). The estimated annual cost of Trade Loans to TAFE
students is therefore $68 million.22
19 While the Commonwealth is the main funder of income-contingent loans, states and territories contribute
50% to the cost of loan debts not expected to be repaid by government-funded students. These payments
are transferred from states and territories to the Commonwealth each year. In 2018, the value of these
transfers was $8.5 million (NCVER, 2019c). 20 NCVER’s loans reporting includes the value of grandfathered VET FEE-HELP ‘dodgy debts’ (in addition to new
loans made under the new VET Student Loans). As stated above, government has elected to absorb at least
$500 million of these debts in 2019, indicating that total loan amounts would still be acceptable indicators of
government loan costs to students of private providers until the new loans system applies and the sector
recuperates. 21 TAFE institutes are the dominant provider of government-funded VET however there are a smaller number
of other government providers including community education providers. 22 This estimate does not include the smaller Living Away From Home Allowance (LAFHA) program, which is a
weekly payment to apprentices starting at $77.17 each week in the first year of the apprenticeship. Payments
reduce to $25 each week in the third year.

The Economic and Social Benefits of the TAFE System 30
The total cost of income-contingent loans to TAFE students and apprentices totals to $243
million: $175 million for VET Student Loans and $68 million for Trade Support Loans.
Student Income Support Payments
Many TAFE students can receive additional income support while undertaking study. Study
allowance and support payments considered in our calculation include:
• Youth Allowance (which is the primary income support payment for full-time
students and apprentices aged 16–24)
• Austudy (which is a separate income support program for students who commence
full-time studies or training when they are 25 years or older)
• ABSTUDY (which is a specifically designated income support payment to Indigenous
students in secondary and post-school education).
According to the most recent available data on Youth Allowance payments to students and
apprentices by sector from the Department of Social Services, the vast majority (78%) of all
payments at June 2016 went to students in higher education. A further 14% of recipients
were undertaking VET, while 5% were undertaking schooling and 2% apprenticeships (and
1% were unspecified).23 The combined total income support share relevant to the VET
sector is 16% (including VET and apprenticeships) (Department of Social Services, 2016)
Meanwhile, Department of Education and Training higher education data show that the
proportion of domestic students enrolled full-time (a criteria for Youth Allowance student
payment eligibility) in university education has remained steady from 2016–18 (Department
of Education and Training, 2017). The number of VET students studying full-time declined by
10% between 2016 and 2018 (NCVER, 2018b). We assume that these changes to full-time
rates have had a negligible impact on 2016 income support payment data. We also assume
that Austudy and ABSTUDY payments are distributed across sectors in the same proportions
as Youth Allowance.
Total government spending on Youth Allowance, Austudy and ABSTUDY was $2.6 billion in
2018.24 We first estimate that 16% of that total income support spending was received by
VET students (including apprentices). We then calculate the TAFE system’s share as a
23 The Department of Social Services produces two Youth Allowance payment trends reports: (1) all Youth
Allowance income support payments paid to young people who are seeking paid work and undertaking
activities (like study and training) to improve employment prospects; and (2) Youth Allowance payments to
students and apprentices. We refer to data on payments to students and apprentices only. Most of the
recipients of this payment are university students, since they are more likely to undertake study on a full-
time basis (which is a requirement for payment eligibility). 24 2018 Actuals. From Budget 2018–19, Department of Social Services Budget Statements, Table 2.1.2: Program
components of Outcome 1.

The Economic and Social Benefits of the TAFE System 31
proportion of all VET students in 2018 (14%). Annual government spending on income
support to TAFE students is therefore estimated at $59 million.
Student Fees
Most VET providers (including TAFE institutes) charge students fees for the administration of
courses, for tuition, and for the provision of materials and amenities. These fees vary
according to the type of course and its duration as well as the institution providing the
course. Table 5 presents the annual costs of student fees by each state and territory.
Consolidated annual reports for all TAFE institutes operating within the jurisdiction were not
available for Victoria or Northern Territory. For these jurisdictions, NCVER student data for
full-year training equivalent students were utilised to derive estimations of total student
fees.
Table 5 TAFE Student Fees and Other User Charges by Jurisdiction
Total Student Fees and Other User Charges ($ million)
TAFE Student Full-Time Training Equivalents
(FTE)
Cost per FTE
QLD $238.9 27,625 $8649
NSW $373.2 106,545 $3503
SA $88.7 13,400 $6622
WA $123.9 36,505 $3394
ACT $11.8 5650 $2083
TAS $13.5 5695 $2364
NT* $7.1 3380 $2089
VIC* $272.4 77,870 $3499
Total $1129.51 276,670 Avg. $4083
Source: Total fees include student fees and other user charges. Consolidated state/territory figures from TAFE Annual Reports 2018–19 for NSW, ACT, South Australia and Queensland. WA figure from Office of Auditor General, Appendix 3: Universities’ and TAFEs’ expenditure and sources of revenue. Reporting for ‘Sales of Goods and Services’ used for NSW due to no separate reporting of fees. *Figures for Victorian and NT jurisdictions estimated based on Full-Year Training Equivalent student data in comparable jurisdictions (assuming Victoria FYTEs = 73% of NSW, and NT FYTEs = 60% of ACT). Student FYTEs data from NCVER Government Funded Students and Courses 2018. FTYE TAFE figures include other government providers.
Total student fees (and other user costs) charged to TAFE students in 2018 were
approximately $1.1 billion. The average annual cost of student fees per full-time training

The Economic and Social Benefits of the TAFE System 32
equivalent was $4082. TAFE students in Queensland pay the highest fees ($8649 per FTE),
while those in the ACT pay the lowest ($2083 per FTE).
Apprenticeship Training Costs to Employers
Apprenticeships are a system of regulated training where the apprentice, a paid employee,
combines on-the-job training and work experience with formal (usually off-the-job) training.
TAFE institutes facilitate around half of all apprenticeship and traineeship programs, and
most apprenticeships are in skilled trades (such as plumbing, hairdressing and carpentry).
Traineeships, meanwhile, combine off-the-job training with an approved training provider
with on-the-job training and practical work experience. Traineeships are more common in
vocational occupations (such as business administration and tourism) and are typically
shorter in duration than apprenticeships: typically lasting 1–2 years compared with the 3–4
years of an apprenticeship.
Training contracts require employers to create paid employment upon completion of the
apprenticeship, which means that employers also determine the number of apprenticeships
at any given time. Apprenticeships and traineeships are the strongest vocational pathways
available to full-time employment or self-employment.
Employers benefit in the long run from taking on apprentices, via higher productivity,
reduced recruitment and retention costs, and increased output. A UK study by CEBR (2014)
estimated annual output gains accruing to businesses through hiring apprentices of £1.8
billion. In the short run, employers incur the costs of training apprentices by providing
instruction, training and supervision for the on-the-job component of the course.
Apprentices are paid at a lower hourly rate to offset the training costs incurred by
employers, and upon completion they can either transfer into standard employment or
commence self-employment as qualified tradespeople.
We calculate the employer costs of apprenticeships delivered under the TAFE system based
on the time sacrificed by other employees to provide on-the-job training. There were
approximately 100,300 apprentices and trainees studying in TAFE institutes in 2018 (most
recent data). This represents half of all government-funded apprenticeship programs and
32% of 310,000 total VET apprenticeships and traineeships in 2018 (NCVER, 2019a). Over
90,000 TAFE apprenticeship and traineeship students (around 91%) studied on a part-time
basis, while 9% studied on a full-time basis. We derive an estimate of the average number of
hours taken by senior employees to train apprentices and trainees per week using ABS data
on the average weekly working hours of part-time apprentices (19 hours per week) and full-
time apprentices (40 hours per week).25
25 ABS Catalogue 6306.0, Table 1, non-managerial employees. Average total weekly hours paid to part-time
apprenticeships, traineeships and employees with a disability (male and female) is 19 hours, and 40 hours for
full-time programs.

The Economic and Social Benefits of the TAFE System 33
We supplement ABS data with a review of part-time apprentice hours schedules within state
skills regulations, which propose the breakdown of hours between structured off-the-job
training (46% of weekly hours) and employment (54% of weekly hours).26 These ratios are
scaled to the ABS working hours data with the reasonable assumption that 40% of
mandated employment time is spent in supervision and training, to reach an estimate of
four hours lost each week to train apprentices undertaking their program on a part-time
basis, and nine hours per week for full-time apprentices. Training hours estimates are
combined with average hourly wage data from the ABS to find the wage value of sacrificed
time.27 The estimated annual employer cost of training TAFE apprentices and trainees is
approximately $8400 per part-time apprentice per year and $18,800 per full-time
apprentice per year, or $934 million per year for all TAFE apprentices.28
Total TAFE System Costs
As summarised earlier in Table 4, we estimate that the total combined cost for delivering
VET through TAFE institutes for 2018—including government funding for training and
administration, employer and student assistance, loans and income support payments,
student fees, and employer apprenticeship and traineeship training costs—was
$5.71 billion. This amounts to 0.3% of Australia’s annual GDP: a very modest investment
indeed.
26 Skills authorities within each state or territory regulate the minimum hours that must be undertaken in on-
the-job and off-the-job training for apprenticeships and traineeships. We use the Victorian Registration and
Qualifications Authority’s (2017) training:employment ratio of at least 13 hours per week for part-time
apprenticeships, comprising seven hours of employment (54%) and six hours of structured off-the-job
training (46%), and we adjust for ABS figures. We assume that 40% of mandated employment time is spent in
supervision and training. 27 From ABS Catalogue 6306.0, Table 1 Non-managerial employees. This database provides average hourly pay
for adult, junior and apprentice employees. We assume that workplace supervisors and trainers are more
likely to be adult, non-managerial workers. Average hourly earnings for an adult employee in 2018 were
$40.10. This average is for both full-time and part-time, and male and female, employees. 28 The net cost to employers is much lower after employer assistance subsidies are factored in.

The Economic and Social Benefits of the TAFE System 34
Benefits of the TAFE System
We now consider the various economic, fiscal and social benefits generated as a result of
Australia’s present and past investments in quality public vocational education through the
TAFE system.
ECONOMIC BENEFITS OF TAFE PRODUCTION
Direct Economic Activity
Australia’s TAFE system constitutes a major economic industry in its own right: generating
billions of dollars in economic activity and revenue, supporting tens of thousands of jobs
and producing billions of dollars of value-added services each year. Hence consideration of
the economic value of TAFE institutes should commence with a description of those direct
economic contributions, as summarised in Table 6.
Table 6 Direct Economic Footprint of TAFE Institutes
(2018)
Total Revenues $3.7 billion
Enrolled Students 833,000
Direct FTE Employment 30,0001
Direct Total Employment 45,6282
Wages and Salaries Paid $2.3 billion
Supplies and Inputs Purchased $1.6 billion3
Source: Author’s compilation and calculations from TEQSA (2018), NCVER (2019a), and ABS Catalogue 5209.0.55.001. 1. FTE, estimated based on state TAFE reporting and KPMG (2018b). 2. Total employees at 2019, reported by Knight et al. (2020), Table 1. 3. 2016–17.
Table 6 summarises several indicators of the direct economic contribution made to Australia
by TAFE institutes.29 Total revenues for the TAFE system in 2018 were approximately
29 Because of a lack of consistent and consolidated data on TAFE system finances, employment and other
indicators, these data have been compiled from numerous sources and hence should be interpreted as
estimates of the general magnitude of the economic impact of the TAFE system.

The Economic and Social Benefits of the TAFE System 35
$3.7 billion, funded through a combination of direct government support, indirect aid to
students, student tuition fees and other sources of income.30
The system enrolled some 833,000 students in 2018, representing around one-third of all
students who participated in vocational training that year. However, that share is
misleading, because the typical TAFE student participates in a more intensive and longer-
lasting course of study than students in most private vocational programs (which often
consist solely of individual courses or micro-credentials). Despite their reduced funding base
and staff resources, TAFE institutes provide over half of all vocational instruction hours
(Zoellner, 2019).
We estimate that there are approximately 30,000 FTE employment positions supported by
the TAFE system.31 About two-thirds of these are for instructor positions, and one-third are
for various administration and support functions (Productivity Commission, 2011). Barely
one-third of TAFE positions are full-time permanent jobs; the rest are part-time and casual
roles (Productivity Commission, 2011). Therefore, the number of individuals employed at
some point in the year through the TAFE system is much larger than the 30,000 FTE roles.
NCVER recently estimated that there are 45,628 total employees of TAFE institutes (Knight
et al., 2020). Total employment in TAFE institutes has declined by about one-quarter (or
some 10,000 FTE positions) in the last several years, as a direct result of the funding crisis
affecting the whole system. Nevertheless, TAFE institutes remain important employers. This
is especially true in many regional communities, where TAFE institutes are often both the
only local source of tertiary education and one of the most important regional employers.
Together, TAFE institutes generate around $2.3 billion in total wages, salaries and other
employment benefits.32 This represents an important injection of economic confidence and
spending power into Australia’s economy. This is especially so at a point in history when
wage income has been growing at the slowest sustained rate in the entire post-war era, and
consumer spending and confidence has now been hammered by the COVID-19 pandemic
and the economic crisis resulting from it.
Supply Chain Purchases
The economic stimulus generated by the TAFE system’s provision of VET extends well
beyond the walls of the TAFE institutes themselves. TAFE institutes also spend many
hundreds of millions of dollars per year on supplies and services purchased from a wide
range of other businesses and sectors. These purchases extend and multiply the impact of
the TAFE system’s activity on the broader national and regional economies. These are
30 The revenues received by TAFE institutes constitute only a portion of the total costs of the TAFE system
(catalogued in the previous section), since some of those costs are incurred by other actors (including
students and employers), not by the TAFE institutes themselves. 31 This is an estimate of full-time equivalent employment, based on state TAFE reporting and KPMG (2018a). 32 This figure is calculated from TEQSA (2018).

The Economic and Social Benefits of the TAFE System 36
termed ‘upstream’ economic benefits—extending up into the myriad of supply and service
sectors which sell goods and services to TAFE institutes. They are especially important to
smaller businesses in the regional areas served by TAFE institutes located outside of the
major capital cities.
An estimate of the scale of these upstream supply chain linkages can be gleaned from
Australian Bureau of Statistics (ABS) data regarding input-output linkages between various
industries in Australia’s economy. The ABS database does not have a separate category for
TAFE institutes, which are consolidated in those statistics within a broader tertiary
education category. But on the reasonable assumption that the quantity and mix of supply
purchases is broadly similar for TAFE institutes to those of other tertiary education
providers, the upstream purchases of TAFE institutes can be estimated as a proportion of
total tertiary education purchases.
Table 7 TAFE Supply Chain (2016–17)
Supply Industry Purchases
($m) Supported
Employment
Agriculture 7.8 40
Mining 8.4 6
Manufacturing 110.1 252
Utilities 36.2 30
Construction 46.6 131
Trade 130.3 261
Hospitality Services 29.8 300
Transport 115.5 420
Information Services 162.6 343
Property and Finance 342.6 1066
Computer and Technical 172.9 844
Administration Services 209.3 2062
Public and Safety 77.0 575
Education Services 47.7 750
Other Services 99.4 832
Total Supply Purchases 1596.2 7912
Source: Author’s calculations from ABS Catalogues 5209.0.55.001 and 8155.0, and TEQSA (2016), as described in text.
Table 7 describes these supply chain purchases by the TAFE system. The ABS database
indicates that tertiary education institutions buy inputs and supplies from 113 different

The Economic and Social Benefits of the TAFE System 37
industry groupings—a supply chain that reaches into every state and major sector of the
national economy. Table 7 groups those purchases into 15 major sectors. Together, these
sectors receive about $1.6 billion worth of purchases per year from the TAFE system.
The biggest suppliers in dollar purchases to the TAFE system include property services,
administration services, computer and technical services, trade, transportation, and
manufacturing. But there is virtually no segment of Australia’s economy which does not
receive some significant incremental business as a result of the supply chain purchases from
the TAFE system.
Moreover, since this business contributes incrementally to the scale and viability of those
supplying firms, it also underpins significant quantities of employment in those other
industries. On the basis of average employment content ratios prevailing in each of the
major supplying industries, Table 7 also lists the number of jobs supported in those
industries as a result of their sales to the TAFE system. Across the whole set of supply
industries, about 8000 jobs (in addition to the direct positions within TAFE institutes
themselves) are supported by the ongoing supply purchases of the TAFE system. Again, the
industries receiving the largest boosts to employment thanks to upstream linkages to the
TAFE system include administration, property services, and computer and technical support.
Downstream Linkages and Consumer Spending
A third category of economic benefit generated by the production activity and employment
of the TAFE system must also be considered in evaluating the overall economic impact of
TAFE institutes. There is a significant volume of incremental consumer expenditure
generated by both direct employment within the TAFE system and the jobs supported
upstream in the TAFE supply chain. These are called ‘downstream’ benefits, since they occur
as a consequence of the payment of incremental wages and salaries to people employed as
a result of the TAFE system’s activity.
These spillover effects of public sector direct and indirect employment on downstream
consumer spending are particularly important during periods of broader economic
weakness—such as in Australia today, given the pronounced economic slowdown that has
taken hold in recent months. These downstream stimulus effects are stronger for purchases
(like labour-intensive services, such as vocational education) that generate greater flows of
direct income for domestic residents, as compared to more capital- or import-intensive
purchases. (For these latter, more of the expenditure’s effect is dissipated away from the
state and national economies.)
The wages and salaries generated by TAFE institutes total to about $3 billion per year:
including $2.3 billion paid to people directly employed by TAFE (from Table 6 above), along
with an additional amount corresponding to the incomes of workers employed in the TAFE
system supply chain. On average in Australia, consumers spend two-thirds of their

The Economic and Social Benefits of the TAFE System 38
incremental income on final consumption spending (after deducting taxes and personal
savings).33 Expenditure in Australia on average encompasses an import penetration ratio of
just over 20%: that is, one dollar of every five is spent on imported goods and services.34
This implies that around 50 cents of each dollar in incremental income is spent on
Australian-made goods and services.35
Therefore, the $3 billion in incremental employment income generated by TAFE institutes
and the TAFE system supply chain translates into an additional $1.5 billion in incremental
consumer spending on Australian-made goods and services. On the basis of average
employment ratios across the whole range of produced goods and services, this supports an
additional 10,000 jobs.
Combined Economic Impacts
Table 8 summarises the combined employment impacts arising from the direct production
activity of TAFE institutes, their upstream linkages (through supply industries) and their
downstream linkages (through the range of consumer goods and service industries). In total,
some 48,000 positions are supported, directly and indirectly, thanks to the presence and
activity of Australia’s TAFE system. At a moment in Australia’s economic history when
further growth and job-creation is threatened by unprecedented uncertainty and risk, both
at home and abroad, this positive anchoring function of high-quality, public vocational
education is especially crucial.
Table 8 Combined Upstream and Downstream Linkages
A. Direct Employment 30,000
B. Employment in First-Tier Suppliers 8000
C. Employment in First-Round Consumer Spending
10,000
D. Total Employment (A + B + C) 48,000
Source: Author’s calculations as described in text from ABS Catalogues 5209.0.55.001, 8155.0, and 5206.0.
33 Author’s calculations from ABS Catalogue 5206.0, Table 20. 34 Author’s calculations from ABS Catalogue 5206.0, Table 3. 35 More precisely, 79% (domestic expenditure share) of 67% (average expenditure propensity) equals 53%
(average propensity to spend on domestic production).

The Economic and Social Benefits of the TAFE System 39
LABOUR MARKET BENEFITS
Another important impact of TAFE is felt through the earnings and productivity of TAFE-
trained workers once they graduate and find employment. We include here several
channels through which TAFE training enhances the labour market prospects and economic
contribution of workers, including: greater labour force participation and employability;
higher earnings for TAFE graduates; benefits for employers through increased productivity;
and increased revenues for governments (through higher tax revenues resulting from higher
incomes).
These labour market benefits are not limited to TAFE graduates, but also flow to other
stakeholders. Increasing the supply of skilled labour to the economy allows employers to
more easily fill labour shortages and to harness a larger and more productive workforce.
With increased access to skilled workers, industry can expand production and employ more
people, increasing total output across the economy.
Higher Earnings for TAFE-Qualified Workers
TAFE graduates are not only more likely to be employed but they are also more productive
in their jobs. TAFE graduates go on to work in many economically and socially valuable
sectors such as construction and industrial trades, resources, community and social services,
and various private services. The TAFE system has delivered value-adding skills and
qualifications to the majority of all employed people with VET qualifications.
We estimate the earnings benefits of VET qualifications (including Certificates I/II/III/IV,
Diplomas and Advanced Diplomas), compared to the earnings of employed workers without
post-school qualifications, in the following manner. Average weekly earnings were obtained
for all employed people with a VET qualification (Diploma, Advanced Diploma, or Certificate
I/II, III/IV36), and then compared to those for workers without post-school qualifications.37
On an annual basis, this indicates an annual earnings premium of almost $19,000 derived by
workers with a VET qualification as their highest post-school qualification (compared to
those with no post-school education). This represents a wage premium to VET graduates of
39%, which is within the broad range of wage premia identified in other studies.38 Across
the entire workforce of VET-qualified workers in Australia (some 3.5 million workers in 2019,
36 No separate data for Certificate I/II were available. We used ‘other’ post-school qualifications as a proxy for
Certificate I/II. 37 Data from ABS Catalogue 6333.0, Table 5.1. 38 Wilkins and Lass (2018) find a 39% and 14% premium to Diploma- and Advanced Diploma-holders compared
to Year 11 attainment among males and females, respectively, and a 25% wage premium to Certificate III/IV-
holding males. (They find no significant premium for females.)

The Economic and Social Benefits of the TAFE System 40
based on data from the same ABS source), this translates into combined additional earnings
returned to VET qualifications of some $68 billion.39
Not everyone in the Australian workforce who holds a VET qualification received that
qualification through the TAFE system, however. So we estimate the proportion of the
current stock of workers holding a VET qualification who are likely to have received that
qualification from a TAFE institute (or another government-provided institution).40 TAFE
institutes were the predominant VET provider from 1970s until the early 1990s, when
deregulation policies gradually increased the number of private non-TAFE graduates
entering the workforce.
Since labour force data regarding the proportion of Australian workers holding a VET
credential do not identify the source of that credential (that is, whether it came from a TAFE
institute or some other form of institution), we estimate the proportion of the current
workforce holding VET qualifications which came from the TAFE system by converting data
on the annual flow of TAFE graduates (as a proportion of all VET graduates) into an
estimated share of the cumulative stock of VET graduates. This method takes account of the
changing flow of total VET activity over time, the changing importance of TAFE versus non-
TAFE providers, and variability in both longevity and labour force participation for various
age cohorts (see the Appendix for more detail).
Following this approach, we estimate the proportion of TAFE-qualified workers (as a share
of the stock of all workers with VET qualifications) as 72.5%. We use that parameter to scale
the number of currently employed Australian workers with VET qualifications and thus to
estimate the proportion who received their qualifications from a TAFE institute or another
government-funded institution. If 72.5% of higher earnings resulting from VET qualifications
come from the TAFE system, we estimate the additional earnings of all TAFE-qualified
workers (relative to earnings of workers without post-school training) at $49.3 billion in
2019.
Increased Participation and Employability
A TAFE education significantly improves the employment outcomes of its graduates after
they enter the labour market. NCVER survey data (2019b) confirm this employability
39 Some other research has attempted to control for other worker characteristics (such as age, gender,
occupation and other variations across workers) by estimating a ‘pure’ return to education. Meanwhile, some
research even accounts for ‘self-selection’ by workers (whereby workers who are inherently more productive
are assumed to pursue higher education, including VET, and hence their higher earnings are attributed to
their personal capacities rather than to their education). In our judgment, however, a simpler aggregate
estimate of the earnings premium achieved by VET graduates is a more meaningful and legitimate expression
of the increased earnings potential of VET graduates, regardless of the precise decomposition of that
earnings premium between a worker’s training and their personal capacities. 40 NCVER’s historical data do not distinguish TAFE from other direct government providers.
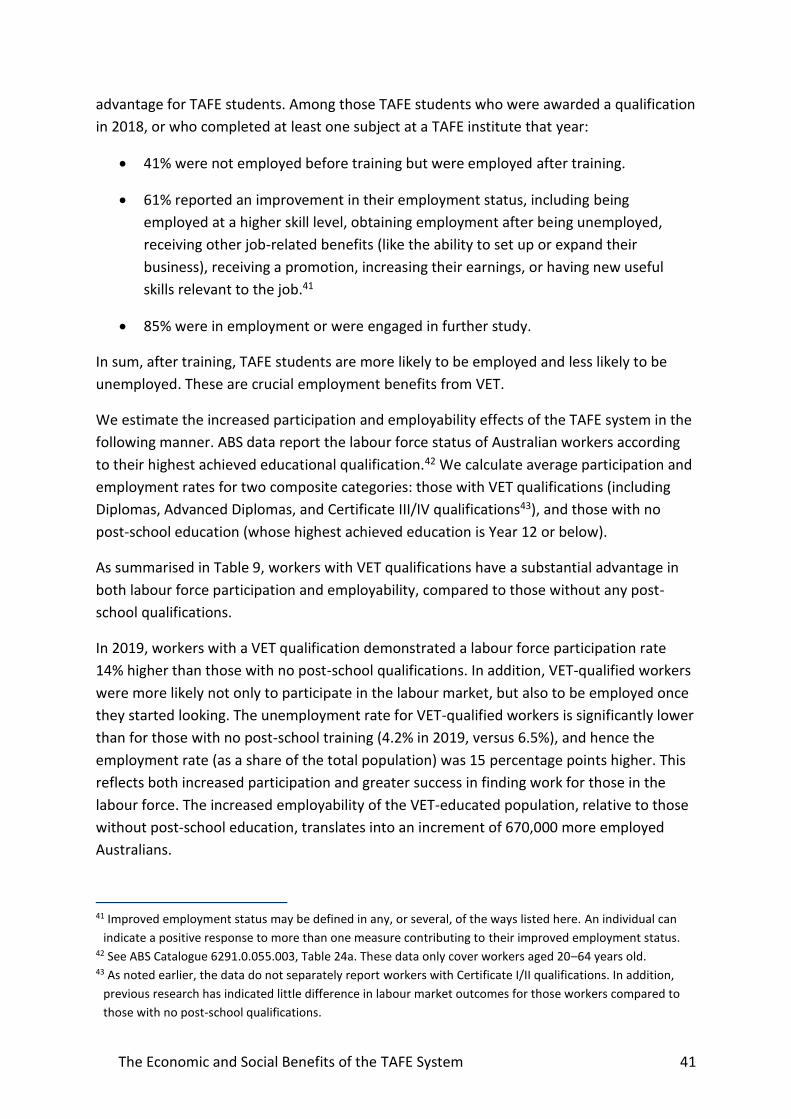
The Economic and Social Benefits of the TAFE System 41
advantage for TAFE students. Among those TAFE students who were awarded a qualification
in 2018, or who completed at least one subject at a TAFE institute that year:
• 41% were not employed before training but were employed after training.
• 61% reported an improvement in their employment status, including being
employed at a higher skill level, obtaining employment after being unemployed,
receiving other job-related benefits (like the ability to set up or expand their
business), receiving a promotion, increasing their earnings, or having new useful
skills relevant to the job.41
• 85% were in employment or were engaged in further study.
In sum, after training, TAFE students are more likely to be employed and less likely to be
unemployed. These are crucial employment benefits from VET.
We estimate the increased participation and employability effects of the TAFE system in the
following manner. ABS data report the labour force status of Australian workers according
to their highest achieved educational qualification.42 We calculate average participation and
employment rates for two composite categories: those with VET qualifications (including
Diplomas, Advanced Diplomas, and Certificate III/IV qualifications43), and those with no
post-school education (whose highest achieved education is Year 12 or below).
As summarised in Table 9, workers with VET qualifications have a substantial advantage in
both labour force participation and employability, compared to those without any post-
school qualifications.
In 2019, workers with a VET qualification demonstrated a labour force participation rate
14% higher than those with no post-school qualifications. In addition, VET-qualified workers
were more likely not only to participate in the labour market, but also to be employed once
they started looking. The unemployment rate for VET-qualified workers is significantly lower
than for those with no post-school training (4.2% in 2019, versus 6.5%), and hence the
employment rate (as a share of the total population) was 15 percentage points higher. This
reflects both increased participation and greater success in finding work for those in the
labour force. The increased employability of the VET-educated population, relative to those
without post-school education, translates into an increment of 670,000 more employed
Australians.
41 Improved employment status may be defined in any, or several, of the ways listed here. An individual can
indicate a positive response to more than one measure contributing to their improved employment status. 42 See ABS Catalogue 6291.0.055.003, Table 24a. These data only cover workers aged 20–64 years old. 43 As noted earlier, the data do not separately report workers with Certificate I/II qualifications. In addition,
previous research has indicated little difference in labour market outcomes for those workers compared to
those with no post-school qualifications.

The Economic and Social Benefits of the TAFE System 42
Table 9 Actual and Counterfactual Employment by Qualification
(2019)
Population
(000)
Labour Force (000) and
Participation Rate (%)
Employment (000) and
Employment Rate (%)
Employment at No-Post-
School Employment
Rate (000)
Difference (000)
VET-Qualified
4493.8 3831.5 (85.3%)
3671.6
(81.7%) 3000.7 670.9
No Post-School
5104.3 3645.6 (71.4%)
3408.4 (66.8%)
TAFE Contribution
486.4
Source: Author’s calculations from ABS Catalogue 6291.0.55.003, Table 24b. Includes ages 20–64 only.
Not all that improvement in employability can be ascribed to the qualifications received by
those who participated in VET. In some cases, there are underlying factors (at the individual,
occupational or regional level) which explain both lower education and lower labour force
participation and employability by varying groups of Australians. Nevertheless, the
aggregate employment advantage that is clearly associated with obtaining VET qualifications
(most of which were attained from TAFE institutes) certainly defines an upper bound of the
potential labour market expansion generated by Australia’s historic investment in vocational
training.
Additionally, not all workers holding VET qualifications received those qualifications from a
TAFE institute. As explained above, on the basis of historical data on VET enrolments by type
of provider since 1981, we estimate that 72.5% of those Australian workers with VET
qualifications received their training in the TAFE system. We thus estimate that the TAFE
system has increased employment by around 486,000. Most of that gain reflects stronger
labour force participation by TAFE graduates; a smaller portion (about one-eighth) reflects
lower unemployment for TAFE graduates in the labour force.44
Productivity Benefits for Businesses
If we calculate GDP according to the income approach, we find that national income is equal
to the sum of labour and non-labour incomes. Only some of a given increase in GDP
44 As discussed below, we estimate that unemployment among TAFE graduates is lower in 2019 by about
65,000 positions compared to the counterfactual of them having the same unemployment rate as workers
with Year 12 or lower.

The Economic and Social Benefits of the TAFE System 43
(through creation and consumption of extra goods and services) is reflected in a higher
wages bill paid to additional workers (labour’s share). The remaining share is paid out to
other factors, including increased business profits, mixed income, and value-added taxes to
government. Therefore, some of the economic benefits arising from the superior
productivity of TAFE graduates is not captured in their higher earnings; some is captured in
higher profits at the companies they work for.
In fact, for decades in Australia, productivity growth has usually outstripped real wage
growth (principally due to a secular decline in employee bargaining power). This means that
workers produce far more real output with each hour of labour than they receive in their
wages. The result is that labour’s slice of the economic pie (including wages, bonuses and
superannuation entitlements) has declined from its peak in the mid-1970s. Since 2017, the
labour share of GDP has hovered around 47% (Stanford, 2018), the lowest since the ABS
began collecting quarterly GDP data. Recent data confirm that the labour share of GDP
remains at this historically low level.45
We estimate the non-wage benefits of increased productivity from the additional skills of
workers with TAFE qualifications in the following manner. To estimate the value of
productivity benefits generated by TAFE-qualified workers but captured by businesses, we
treat total returns to TAFE qualifications as the labour share of the total productivity
benefits of those qualifications. We assume that business captures a proportional share of
those productivity benefits in line with the relative scale of the business profits share
(flowing to both incorporated and unincorporated firms) in overall GDP.
In 2019, business operating surpluses and mixed income equalled some $675 billion (over
three-quarters of which was received by corporations46), equivalent to 72.2% of total labour
compensation. We thus estimate the total benefits flowing to employers as a result of the
superior productivity benefits of TAFE-qualified workers at $35.6 billion (72.2% of the
earnings premiums received by TAFE-qualified employees).
The combined additional income generated by the productivity benefits arising from TAFE
qualifications (including higher earnings for TAFE graduates, and higher business profits for
their employers) thus amounted to $84.9 billion in 2019.
45 Labour’s share of GDP averaged 46.85% in the calendar year 2019. Calculated from ABS Catalogue 5206.0.
Table 7 (seasonally adjusted). 46 Some mixed income can be attributed to the labour effort of owner-managers of unincorporated
enterprises, in addition to the return to their invested capital. Since neither portion of that income is
captured in labour compensation (which covered employees only), it is reasonable to consider both
components of mixed income in this estimation.

The Economic and Social Benefits of the TAFE System 44
Addressing Skills Shortages
There is another distinct channel through which quality vocational education delivered by
the TAFE system makes a crucial contribution to the growth, productivity and profitability of
the Australian economy. It is well known that Australian employers in several sectors
continue to experience pressing shortages of skilled labour, across a wide array of
occupations. For example, the Department of Education, Skills and Employment (2019) lists
35 different broad occupational categories experiencing significant shortages as of 2018.
Many of the occupations in short supply are vocational in nature, and so those shortages
could be ameliorated through an expansion of vocational training. It is especially perverse
that Australian employers continue to be held back by the unavailability of skilled labour,
when there simultaneously exists a large pool of unemployed and underemployed workers
(including many young people) who hunger for decent work. Presumably, these workers
would gladly accept the opportunity of a relevant, in-demand career path, instead of trying
to survive on low-wage and insecure work in hospitality or other service sectors.
Adjustments in relative wages are not proving sufficient or successful in facilitating market-
driven corrections to these shortages (Leal, 2019). Instead, a more proactive and hands-on
approach to workforce training and planning is clearly required, to better match the supply
of trained workers with the obvious and unmet demand. Indeed, the simultaneous
existence of skills shortages alongside underutilised labour attests to the broader failure of
Australian vocational education policy.
The cost of these skills shortages is difficult to quantify, but there is no doubt it is high.
Employers experience unnecessary and escalating costs for recruitment and retention as
they compete with each other for skilled workers (NAB, 2017). New investment projects
may be constrained by the unavailability of labour. In just one skills-intensive sector of the
economy (technology), firms report billions of dollars of missed opportunities because of
their inability to recruit and retain qualified staff (Redrup, 2017).
There is a flip side to the costs arising from Australia’s existing skills shortages: they confirm
that our current workforce of skilled TAFE-trained workers is generating enormous value
and productivity to their employers, and to the whole economy, by virtue of their capacity
to perform badly needed skilled labour. We can only imagine the extent and severity of skills
shortages in the absence of the existing trained workforce, which is the legacy of our past
historical investments in the TAFE system and other vocational education. Investment and
export opportunities would be further constrained; Australia’s relatively weak progress in
applying new technologies would be slowed even further; and employers in dozens of
industries would face even more intense challenges to retain skilled workers.
The value of this contribution made by TAFE graduates in reducing skills shortages is
impossible to quantify—but it is certainly real. It is another reason why Australia’s fiscal
investment in quality, public VET must be quickly restored.

The Economic and Social Benefits of the TAFE System 45
Higher Government Revenues
Some of the economic benefits of increased earnings and productivity also flow through to
government in the form of higher tax revenues collected through personal income taxes,
business taxes, GST revenues and other forms of income. Considering all forms of tax
revenue, the federal government collects an average of over 23% of GDP, while state
governments collect another 6.4% (not counting federal transfers).
On this basis, the federal government received incremental tax revenues as a result of the
higher productivity and incomes associated with TAFE qualifications worth $19.6 billion in
2019. State and local governments, meanwhile, collected an additional $5.4 billion in
revenues. Across both levels of government, the incremental taxation revenues added up to
$25 billion (see Table 10)—4.4 times more than governments currently allocate to the costs
of running the TAFE system. This confirms that governments themselves benefit from
making these investments in high-quality, public vocational education.
Table 10 Tax Revenues Generated by TAFE Education
(2019)
Aggregate Tax Ratio (% GDP)
Incremental Tax Revenue from TAFE-Related
Productivity ($)
Commonwealth 23.1% $19.6 billion
State and Local 6.4% $5.4 billion
Total 29.5% $25 billion
Source: Author’s calculation as described in text. Tax share data calculated from ABS Catalogue 5206.0, Tables 18 and 19 (includes resource royalties).
Combined Benefits
In sum, students who complete VET qualifications at TAFE institutes move into the labour
force with better employment prospects and more skills. This drives higher earnings for
TAFE graduates compared to workers without post-school qualifications. Broader benefits
are also generated in the form of higher productivity, higher business profits and stronger
tax revenues for governments.

The Economic and Social Benefits of the TAFE System 46
Table 11 Summary of TAFE Labour Market Benefits
2019 ($)
Increased Employability 486,000 jobs
TAFE Earnings Premium $49.3 billion
Productivity Benefits to Employers $35.6 billion
Tax Revenues $25 billion*
Total $84.9 billion
Source: Author’s calculations as described in text. *Tax revenues are included within total earnings premium and productivity benefits.
Table 11 provides a summary of the annual benefits generated through the employment,
productivity and earnings of TAFE-trained workers in Australia. The total combined annual
benefit is $84.9 billion.
FISCAL SAVINGS AND SOCIAL BENEFITS
The benefits of VET qualifications flowing to individuals in the form of higher earnings and
employability, to employers via higher productivity and reduced skills shortages, and to
government in higher tax revenues also support a wider portfolio of social and fiscal
benefits. Below, we document the fiscal savings arising from a more educated, productive
and employable workforce in just two crucial areas of government expenditure: welfare and
healthcare. We also outline some of the wider (and hard-to-quantify) social benefits of the
TAFE system that flow from its public mandate to provide accessible, affordable education
to at-risk and special groups and regional communities.
Reduced Welfare Benefit Expenditure
Significant economic and social benefits of vocational education flow from the increased
ability of qualified and skilled people to work and earn. By increasing the number of people
working, the costs of unemployment (including the cost of welfare support payments) can
be reduced. We estimate the value of a reduction in welfare payments due to vocational
education attainment based on the unemployment rates for different levels of educational
attainment. We calculate the number of people who would likely have been unemployed
assuming no post-school qualifications (Year 12 and below) compared with VET
qualifications (Certificate III/IV, Diploma and Advanced Diploma). We assume that if
employees and owner-managers of incorporated enterprises (OMIEs) with an Advanced
Diploma, Diploma and Certificate III/IV did not have that qualification, they would face a
higher unemployment rate on par with those without post-school qualifications (see the

The Economic and Social Benefits of the TAFE System 47
Appendix for more detail on our method). On average in 2019, workers with VET
qualifications experienced an unemployment rate that was 2.3 percentage points lower
than those with Year 12 education or below.
We then consider the rates of unemployment support payments. At the time of writing, this
payment was Newstart Allowance, however, the payment was renamed ‘JobSeeker’ and an
additional Coronavirus Supplement payment was introduced as part of the Commonwealth
government’s COVID-19 response. We estimate the value of a reduction in welfare
payments based on the pre-crisis Newstart base rate (i.e. not including the Coronavirus
Supplement). However, we include other additional supplementary payments received by
almost all (99%) recipients of Newstart Allowance pre-crisis (including the Carer Payment,
Remote Area Allowance, transport allowances and the Energy Supplement)—ranging from
$11 to $240 per week (Department of Social Services, 2020). At the time of writing, these
loaded unemployment benefit rates are as follows: $291 per week, inclusive of
supplementary payments; $339 per week, inclusive of supplementary payments and Rent
Assistance; and $524 per week, inclusive of Family Tax Benefit and other supplementary
payments.47 We then take the number of potential unemployed persons and apply the
different loaded benefit rates depending on the proportion of overall Newstart Allowance
recipients who receive those additional payments (see the Appendix for full details of the
analysis).
Using this method, we estimate that 64,880 fewer people were unemployed in 2019
because of their TAFE qualification, generating a total annual saving of $1.2 billion to
government in reduced welfare benefit costs.
Reduced Health Expenditure
Education is also a powerful mechanism for enhancing the health and wellbeing of
individuals, and consequently reducing the need for associated costs of healthcare
provision. Education also helps promote healthier lifestyles, and it nurtures human
development for individuals, communities and families. Mitchell Institute research finds that
42% of male and female school leavers in the working-age population have a long-term
health condition, compared to only 26% of the general working-age population (Lamb &
Huo, 2017).
We can thus estimate the number of people with VET post-school qualifications who
otherwise would be likely to have long-term health conditions if they had not attained that
further education (based on the 16% difference between the 42% school leaver and 26%
general population health condition rates).48 We estimate that around 750,000 additional
47 The term ‘Other supplements and payments’ represents the average of Rent Assistance and supplementary
payments for recipients also receiving Family Tax Benefit. 48 Lamb and Huo (2017) did not report a long-term health condition rate for workers with educational
attainment above school leavers. Since the 26% rate for the general population also includes school leavers,

The Economic and Social Benefits of the TAFE System 48
workers with VET qualifications would have a long-term health condition if they had not
attained Year 12 or any post-school qualifications.49 Given the absence of information about
the average costs of long-term health conditions to healthcare budgets (and the multitude
of health outcomes), we do not attempt to calculate the costs of a typical long-term health
condition.
Instead, we calculate the cost of long-term health conditions based on the average number
of annual GP visits. A UK study finds that individuals with higher vocational degrees were
less likely to visit their GP than individuals with no post-school qualifications (Windmeijer
and Santos Silva, 1997). We use publicly available Medicare rebate data to estimate the
value of reduced demand to access public-subsidised (or bulk-billed) GPs. The average cost
of GP visits to government was $38.20 per consultation in 2019, including 1.5% indexation.50
Public health data indicate that the average Australian visits the GP six times per year.51 We
assume that persons with long-term health conditions present to GPs 50% more than the
working population average (a total of nine visits per year used by people with a long-term
condition). We estimate the healthcare cost saving based on both an increase in the number
of people presenting to GPs and an increase in number of GP visits for that group (see the
Appendix for full detail). We then scale the total fiscal saving benefit by the estimated
percentage of all employees holding VET qualifications who received those qualifications
from a TAFE institute (72.5%). The total annual reduction in health-related costs arising from
TAFE institute qualifications is thus estimated at $289 million.
Considering just these two dimensions of social costs (welfare payments and costs for GP
visits), it is clear that the TAFE system helps to reduce the fiscal expenses ultimately
associated with a lack of education (and the resulting individual and social problems that a
lack of education causes). The higher number of VET-qualified people in the workforce
delivers fiscal benefits to government via lower unemployment rates and a healthier
workforce. The estimated saving that TAFE institutes provide through associated savings on
social assistance and public healthcare is $1.5 billion per year (Table 12).
this likely understates the health advantages that holding a VET qualification confers. The true difference
would be greater than 16 percentage points. 49 We use Census population data because the positive effects of attaining VET qualifications, such as higher
lifetime earnings, continue to impact the health outcomes of people after working life. 50 Many doctors charge more than the Schedule fee, with an additional ‘gap fee’ passed onto patients. If GP
clinics bulk-bill patients or charge gap fees, in both instances the Schedule fee represents the full cost of each
GP visit to the government. (Medicare Schedule fees from Department of Health, 2018, Indexation of Medicare
Benefits Schedule (MBS) items from 1 July 2018.) 51 Independent Hospital Pricing Authority (2019), National Hospital Cost Data Collection Report; Public Sector,
Round 21 (Financial Year 2016–17), Table 4. Average cost per episode. Average GP visit data from The
Australia Institute of Health and Welfare (2019a).

The Economic and Social Benefits of the TAFE System 49
Table 12 Summary of Social Program Fiscal Savings from TAFE
Saving (2019)
Reduced Welfare Costs $1.2 billion
Reduced Healthcare Costs $289 million
Total $1.5 billion
Source: Author’s calculations from Henriques-Gomez (2019), Department of Social Services (2020), ABS Census (2016), Department of Health (2018), and The Australia Institute of Health and Welfare (2019a) as described in text.
WIDER SOCIAL BENEFITS
The high-quality vocational education opportunities provided through the TAFE system also
underpin a wide array of other social and community benefits that are harder to quantify,
but which must be considered in any evaluation of the TAFE system’s importance. Some of
the most important of these broader benefits include:
• training opportunities in regional areas which are not well served by universities or
other tertiary facilities that tend to be concentrated in capital and larger cities
• the provision of ‘bridging’ access to further education and jobs pathways for
disadvantaged and at-risk groups, who would otherwise have little likelihood of
entering promising vocations
• greater social cohesion, thanks to the TAFE system’s ability to engage young people
from all economic and cultural backgrounds in vocational pathways
• reductions in crime and other dimensions of social dysfunction, as a result of
incremental improvements in inclusion and economic participation.
As a public provider, the TAFE system fulfils a wider socio-economic mandate in its
education and training delivery. Unlike for-profit providers, TAFE institutes are motivated by
a commitment to ensuring access and equity in training, and to maximising the all-round
social benefits of their offerings. Public charters guide the TAFE system’s activities across a
range of key areas, regulating course breadth and range (even for low-demand courses,
which for-profit providers would quickly jettison) and providing education and training
in regional areas (which regularly experience higher youth unemployment rates). Indeed,
despite heavy subsidies to private providers to establish ‘markets’ for VET, TAFE institutes
are still the main provider of training in regional areas, due to the infeasibility of private
models in smaller population centres. TAFE program completers are also more likely to

The Economic and Social Benefits of the TAFE System 50
represent the bottom two quintiles for socio-economic disadvantage (NCVER, 2019a), and
are more likely to be of Aboriginal or Torres Strait Island descent, or to identify as having a
disability, compared with students of private VET providers.
By improving education and training affordability and access for these disadvantaged
students, the TAFE system provides critical pathways to employment and further education.
Private providers have neither the motivation nor (in most cases) the resources to provide
vital tailored supports (including flexible payment plans) for students who need them.
Another important benefit of higher education is enhancing the all-round socialisation of
students, preparing graduates to participate more fully and effectively in society. In this
regard, the TAFE system performs demonstrably better than private providers for each of
the ‘personal benefits’ indicators measured by NCVER’s student outcomes data (see Table
13). For example, 40% of TAFE completers between 2016 and 2019 reported that they
gained confidence from their training (compared with just 29% for private providers).
Almost one-third of all TAFE completers reported that they improved their communication
skills and made new friends through their training, compared with only 10–14% for private
providers. In addition, a TAFE education increased the standing and leadership qualities of
completers, with 12% saying that their training made them a role model in their community.
Table 13 Reported Personal Benefits of Undertaking Training
(2016–19)
Percent of Completions Reporting Each Benefit
TAFE Institutes Private Training Providers
Advance my skills generally 61% 53%
Gained confidence 40% 29%
Satisfaction of achievement 41% 30%
Improved communication skills
28% 14%
Made new friends 27% 10%
Seen as a role model for others in the community
12% 7%
Source: NCVER (2019b). VET Student Outcomes 2016–19. Accessed through VOCSTATS.
The TAFE system also provides a unique bridge to further study for Australians who have not
finished school, or who seek technical vocational qualifications to improve their future
employment prospects. Between 2016 and 2019, 22% of all people who completed a
program or subject through TAFE institutes went on to enrol in further study, compared to a
13% continued education rate for private providers.

The Economic and Social Benefits of the TAFE System 51
Another macro-social benefit of high-quality vocational education is greater social cohesion.
The most important pathway from education to social cohesion is through income, since
educational inequality reinforces income inequality across the life-cycle. Preston and Green
(2003) find that high educational inequality is related to negative social cohesion (measured
by indicators such as crime and social dislocation). They find that a more equitable
distribution of education increases institutional trust and decreases social exclusion.
Education also fosters greater political and civic participation—such as voting and
volunteering.
Furthermore, education is a proven means of reducing crime rates in the population.
Vocational qualifications can provide the economic resources (via higher earnings and
better job opportunities) that reduce incentives to engage in crime. Data linking educational
attainment to crime rates are not available in Australia, and we have not attempted to
calculate the fiscal savings of reduced crime. Nevertheless, the Australian Institute of Health
and Welfare (2018, 2019a, 2019b) shows that low educational attainment is a strong
predictor of involvement in the criminal justice system. Baldry et al. (2018) find that lower
levels of educational attainment are associated with poorer employment opportunities and
outcomes, generating higher unemployment that is, in turn, a risk factor for incarceration
and for reoffending post-release.
To the extent, therefore, that vocational education provides job pathways for more at-risk
groups (who disproportionately rely on TAFE programs), there are significant benefits in
crime reduction due to the TAFE system.
All of these broader social benefits resulting from high-quality public vocational education,
and the operation of the TAFE system specifically, are difficult to quantify in dollar terms.
But they must form part of our understanding of the broader effects of TAFEs in building not
just a stronger labour market, but a stronger society.

The Economic and Social Benefits of the TAFE System 52
Comparing the Costs and Benefits
Earlier, we reviewed a range of cost-benefit studies that have considered the net economic
impacts of education systems. Some of the key findings of these reports include KPMG’s
finding (2018a, 2018b) find that the TAFE system returns $2.55 value to the Queensland
economy for every $1 invested there, and $2.19 to the Victoria economy for every $1
investment there. The broader adult and community education sector is found to yield a net
benefit to the community and individuals exceeding $3 billion per year (Birch et al., 2003).
For every $1 spent on early childhood education, an additional $2 in economic benefits is
generated (The Front Project, 2019). Finally, apprenticeships in the UK and schools in
Canada were also found to deliver major net benefits to those national economies.
Table 14 summarises the economic benefits we have estimated, through the various
‘streams’ of economic impacts. As discussed earlier, TAFE institutes generate $6.1 billion per
year in direct spending on their operations and associated upstream and downstream
impacts across the broader national and regional economies: including direct value-added,
supply chain purchases, and downstream consumer spending. The TAFE-trained workforce
also generates $84.9 billion per year in ongoing labour market benefits from TAFE –
consisting of higher earnings for VET-qualified workers, increased productivity and profits
for employers, and higher tax revenues to government. We also trace important fiscal
savings to government resulting from a more engaged and healthier TAFE-trained
workforce, valued at $1.5 billion per year. Across these three streams alone, and not
counting the other, hard-to-quantity social impacts discussed above, we argue that
Australia’s current and historical investments in TAFE-provided vocational education are
supporting a massive annual flow of economic benefits, worth some $92.5 billion in 2019.
Table 14 Summary of Economic Benefits
Economic Benefits of TAFE Production $6.1 billion
Higher Earnings & Productivity —Additional Tax Revenues
$84.9 billion ($25 billion)
Lower Welfare and Health Spending $1.5 billion
Total Benefit $92.5 billion
Over Australia’s post-war history, the TAFE system made by far the largest contribution to
VET: we estimate that 72.5% of Australia’s current VET-qualified workforce obtained their
qualification from a TAFE institute. There is no doubt that the labour market benefits

The Economic and Social Benefits of the TAFE System 53
resulting from this accrued stockpile of TAFE-educated workers make an outsized and
continuing contribution to our national prosperity, despite the neglect and mismanagement
which have characterised governments’ approach to the TAFE system more recently.
Our historic investment in high-quality TAFE education supports an ongoing flow of
economic benefits that were worth $92.5 billion to the Australian economy in 2019.
Combined economic benefits generated by the TAFE system are broadly shared by many
sectors: workers, employers, government and communities. As described above, some of
these benefits are received by employees, including $49.3 billion in higher wages per year,
while some are received by employers through superior productivity valued at $35.6 billion
per year. In addition, government avoids $1.2 billion in annual welfare expenditures and
$289 million in healthcare costs. We estimate that the TAFE system has increased
employment among its graduates by around 486,000, and reduced unemployment by
65,000 (both compared to workers with no post-school qualifications).52
On balance, these economic benefits generated by Australia’s historic investments in TAFE
education – and received by individuals, employers, the government and wider society – far
outweigh the ongoing costs of maintaining the TAFE system, that we also outlined earlier in
this paper. The total combined costs for delivering VET through TAFE institutes in 2018 were
modest—only $5.7 billion, just one-quarter of 1% of Australia’s annual GDP. In other words,
the ongoing flow of economic benefits generated by the TAFE system are some 16 times
greater than the annual ‘maintenance’ costs which Australia is currently reinvesting in the
TAFE system. The incremental taxation revenues generated as a result of the superior
productivity and incomes of TAFE graduates alone are worth $25 billion per year: 4.4 times
more than the amount currently allocated to the costs of running the TAFE system.
However, that current rate of investment in TAFE is clearly inadequate to maintain the stock
of high-quality TAFE-trained skilled workers. As documented above, the TAFE system is in
crisis because of fiscal austerity, privatisation, and other policy failures. Without urgent
action to repair and rebuild the system, that massive ongoing flow of benefits will quickly
erode – as the current population of TAFE-trained skilled workers reaches retirement age,
and is not fully replaced by cohorts of younger graduates. In that regard, the costs of
inaction in repairing the TAFEs, as part of a broader reorganisation and repair of VET policy
more broadly, will quickly escalate.
There is an obvious analogy to other situations in which a person or community reaps
ongoing benefits from a prudent previous investment – but then neglects to adequately
maintain the value of that asset, and hence ultimately forgoes the value that it could
52 As discussed above, the increase in employment among TAFE graduates is much larger than the reduction in
unemployment, because the main source of improved employability among TAFE graduates is via their much
higher rates of labour force participation (supplemented by a more modest reduction in unemployment
among those in the labour force).

The Economic and Social Benefits of the TAFE System 54
otherwise produce. Imagine a house: a family makes a major investment to purchase it, and
then enjoys a flow of benefits (resulting from its usefulness as a residence, or perhaps even
its value as a rental property). If that house is not maintained, then it will gradually become
incapable of continuing to provide those benefits. The wealth-generating potential of what
was once a productive asset is squandered.
In this case, the productive ‘asset’ is the stock of TAFE-trained workers, with their superior
employability, productivity, incomes and tax payments. The ‘house’ that TAFE institutes
built in past decades, through high-quality, trusted vocational training, is crumbling. If
Australia wants to continue to reap the benefits of those workers, and the next generations
of skilled workers who must eventually take their places, then we must restore and repair
the ‘house’.
In other words, Australia must quickly step up its collective investments in the TAFE system
to maintain the benefits of a well-skilled technical workforce, and to ensure that that
ongoing $92.5 billion flow of annual quantifiable benefits (let alone the other, broader social
gains) continues. We are not investing enough to maintain the productive capacity of the
TAFE-trained workforce we need; we will pay a steep price for that failure in many ways,
including worsening skills shortages, reduced participation and employability, stagnant
productivity, and stagnant earnings. Indeed, all those signs of labour market dysfunction,
and more, are readily visible in Australia today.
Public investments in the TAFE system must therefore be expanded well beyond their
current, depressed scale. Previous funding cuts and the privatisation of so much VET activity
are already clearly undermining the ongoing flow of the benefits described above – as
evidenced by the downsizing of TAFE institutes and staff, the loss of hundreds of thousands
of apprenticeships and traineeships, and the historic plunge in the overall rate of VET
participation. As Australia confronts the urgent task of rebuilding the VET system in the
wake of the COVID-19 pandemic and resulting recession, it is essential that we repair and
expand the TAFEs, as the reliable centrepiece of a renewed and modernised vocational
education system – lest we ‘kill the goose that lays the golden egg’.

The Economic and Social Benefits of the TAFE System 55
Conclusion and Recommendations
The COVID-19 pandemic and resulting economic crisis presents the most significant
economic and social challenge to Australia in decades. Australia needs a comprehensive,
public-led national reconstruction program that dramatically expands our productive
capacity, the number of good jobs, and quality public services like the TAFE system. Mass
public investment in the skills and earning capabilities of Australian workers will pave our
post-COVID road to recovery.
This report affirms the necessity of moving ahead quickly with the fundamental repair of the
overall VET system in Australia. That rebuilding task must start with repairing and
revitalising TAFE, as the trusted, accountable and accessible anchor institutions of
Australia’s vocational training infrastructure. Despite years of funding cuts, the TAFE system
continues to make a strong and disproportionate economic and social contribution to the
Australian economy. The combined economic and social benefits arising from both the
direct activity of TAFE and the larger skilled higher-earning workforce that it creates are
enormous. We estimate the total economic benefits arising from just some of the channels
we have considered at $92.5 billion per year. There are other important but non-
quantifiable social benefits (including accessibility, regional economic development, and
social cohesion) that also must be kept in mind.
We make the following recommendations for specific actions to resolve the broader crisis in
vocational education, and to allow the TAFEs to once again play their full, critical role in the
reconstruction of the national economy after COVID-19:
• The government should re-establish an adequately funded and stable TAFE system as
the centrepiece of a revitalised Australian VET sector. Disruption to the VET skills
pipeline caused by the expansion of unaccountable private providers has deeply
damaged employer and public confidence in the system. As the longest-serving, most
experienced and trusted VET delivery system in Australia, the TAFE institutes are best
positioned to rebuild the VET skills pipeline and support the mass labour market
transitions precipitated by the COVID-19 economic crisis. Fulfilling its critical role as the
major provider of vocational education requires that a minimum 70% of total VET public
funding be provided to TAFE institutes, rather than funnelled (directly or indirectly) to
private providers.
• We need a new model of VET funding to end the clear disjuncture between universities
and the VET system – whereby prospective students face clear fiscal incentives to
choose university education over VET training, regardless of whether that is most
appropriate for their personal attributes or career prospects. This disjuncture underpins
ongoing failures to undertake long-term, coherent planning in the overall tertiary

The Economic and Social Benefits of the TAFE System 56
education sector. The new model of funding should reverse declining VET participation
trends and create a more cohesive and coordinated post-school education system.
• Mass youth unemployment requires additional long-term, sustained investments in
repairing jobs pathways for youth. The Commonwealth Government should undertake a
new free TAFE program to provide free TAFE courses in priority areas. This program
would include Commonwealth support for existing free TAFE programs in Victoria and
NSW. A program supporting 300,000 public-paid TAFE positions per year would cost
around $2 billion per year.
• Public-supported apprenticeships and traineeships should be dramatically expanded,
coordinated through TAFE institutes. To support the uptake of apprentices in
employment, the Commonwealth Government should offer a 50% wage subsidy for
employed apprentices, on the condition that they are still employed with their host
employer one year after program completion. A program supporting 100,000 subsidised
apprenticeships would cost about $2.5 billion per year.
• Since the VET sector will be ‘rudderless’ when it comes to establishing future skills
frameworks until governments develop a long-term industry policy agenda, TAFE
institutes should be engaged as active and central stakeholders in developing and
implementing a new generation of industry policy. Strategic, advanced, innovative and
high-value industries must be identified and nurtured to renew productivity growth,
improve export quality and boost research and innovation (which has perversely
diminished in Australia in recent years). Integration of skills and active sectoral
development policies can help turn back the clock on declining employer investment in
education and training, and it can also encourage partnerships on customised joint
training initiatives between specific TAFE institutes and firms or groups of firms. The
TAFE system can also serve as a source of high-quality employment opportunities for
VET graduates.
• Stronger regulation and quality assurance should determine the sustainability and
quality of existing publicly subsidised private providers. It should not be possible for new
additional private VET providers to be registered within this already-crowded,
uncoordinated sector.
• A comprehensive assessment of the post-school system should be undertaken. The
absence of integrated policy coordination across the two post-secondary education
systems has disrupted skills pathways for many young Australians. Prospective students
should be encouraged to consider VET study in the TAFE system alongside traditional
academic alternatives.
Rebuilding the economy after COVID-19 will take many years, but that historic challenge will
take even longer without a strong, coordinated, public-funded VET system to facilitate job

The Economic and Social Benefits of the TAFE System 57
transitions and open opportunities for young workers. Billions of dollars in public funding
have been wasted trying to build an inefficient, uncoordinated private VET training market
that has failed workers, business and government alike. The TAFE system is the most
experienced, reliable and high-quality national-level vocational training infrastructure, and it
is therefore best positioned to lead the VET sector response to skills system reconstruction.
This study has demonstrated that accumulated public investments in the TAFE system
continue to deliver significant economic, fiscal and social benefits to the nation. Australia
must now protect and extend these investments. Our recommendations are aimed at
rebuilding a VET system anchored by public-funded TAFE institutes, thus putting Australia in
the best possible position on its turbulent journey to skills system reconstruction.

The Economic and Social Benefits of the TAFE System 58
Appendix
This Appendix provides more detail on the methodology and data sources utilised in the
benefit calculations described in this report.
DERIVING TAFE’S SHARE OF VET-QUALIFIED WORKERS
In some cases, the labour market benefits accruing to workers (and their employers) holding
VET qualifications are not disaggregated statistically according to the specific source of that
credential (that is, whether it came from TAFE or some other form of institution).
We have therefore adopted the following methodology to estimate the proportion of VET
graduates currently in the Australian labour force, who received their qualifications from a
TAFE institute. Data were obtained on the total flow of VET students by year from 1981
through to 2018.53 For the period after 1995, VET enrolment data describe the proportion of
VET students who are enrolled in TAFEs and other government-funded institutions. For the
period prior to 1995, we assume that this proportion averaged 85%.54 We adjust the flow of
VET students in each year by the labour force participation rate corresponding to their
present age (from ABS Catalogue 6291.0.55.001, Table 1).
We also adjust the annual flow of VET students by a survival rate (obtained from the ABS life
expectancy tables, Catalogue 3302.0.55.001) to reflect the proportion of VET students in
each year who have survived to the present.55 For this step, we use the life expectancy table
for 2001 (approximately the mid-point of the timeframe covered by our sample; using year-
specific life-tables would make very little difference to the estimate). From this annual flow
of surviving, participating VET graduates (disaggregated into TAFE and non-TAFE
qualifications), we cumulate an estimated stock of VET graduates (again disaggregated into
TAFE and non-TAFE categories).
The estimated proportion of TAFE-qualified VET students in that overall cumulative stock of
VET-qualified workers is 72.5%. We use that parameter to scale the number of currently
employed Australian workers with VET qualifications, to estimate the proportion who
received their qualifications from a TAFE institute or another government-funded body.
53 The labour force participation rate of people who graduated from VET prior to 1981 is low, and so we do not
include that group. This is a conservative assumption in terms of the likely share of TAFE graduates, since VET
prior to 1981 was dominated by TAFEs. 54 In 1996, TAFEs accounted for 83% of VET students. That proportion was higher in earlier years, when TAFEs
dominated vocational education in Australia. This assumption is conservative, and it likely understates the
proportion of TAFE students in those earlier years. 55 This adjustment is only important for VET graduates from the very early years of our analysis.

The Economic and Social Benefits of the TAFE System 59
TAFE institutes are the dominant provider of government-funded VET (comprising 92% of all
public-funded students in 2018) with a smaller number of other government providers
including community education providers. This estimate takes account of the changing flow
of total VET activity over time, the changing importance of TAFE versus non-TAFE providers,
and variability in both longevity and labour force participation for various age cohorts.
For the various reasons described above, this approach likely underestimates the true
proportion of TAFE graduates in all VET qualification-holders—and hence underestimates
the current economic benefits arising from past TAFE education activity.
CALCULATING UNEMPLOYMENT & BENEFIT PAYMENTS
We use the following method to calculate the reduction in unemployment resulting from
workers receiving VET qualifications. Unemployment rates for highest education attainment
level are provided by ABS labour force data.56 An unemployment rate for VET-qualified
workers is calculated by adding up those with Advanced Diplomas, Diplomas and
Certificates III/IV. An unemployment rate for those with no post-school qualifications is
similarly calculated as the sum of all workers with Year 12 equivalent or below. No data are
available for Certificate I/II level VET qualifications, so they are not considered in the
comparison.57
Table A1 Actual and Counterfactual Unemployment by Qualification
(2019)
Labour Force (000)
Unemployment (000)
Unemployment Rate (%)
Unemployment at No-Post-School Rate (000)
Difference (000)
VET-Qualified 3831.5 159.9 4.17% 249.4 89.5
No Post-School
Qualification 3645.6 237.3 6.51%
TAFE 64.9
Source: Author’s calculations from ABS Catalogue 6291.0.55.003, Table 24b. Includes ages 20–64 only.
We assume that if workers with an Advanced Diploma, Diploma or Certificate III/IV did not
have that qualification, they would face a higher unemployment rate on par with those
without post-school qualifications. Their achievement of VET qualifications has thus reduced
56 ABS Catalogue 6291.0.55.003, Table 24b. Includes ages 20–64 only. 57 Most research indicates that there is little difference in employment and earnings outcomes between
workers holding Certificates I/II and those without post-school qualifications.

The Economic and Social Benefits of the TAFE System 60
unemployment by a total of 89,500 in 2019 (see Table A1). As explained above, only a
portion (72.5%) of that reduction in unemployment is attributable to TAFE training (since
some VET-qualified workers received their training through other streams). The total
reduction in unemployment attributed to TAFE is 64,880.
We then consider the rates of unemployment support payments. At the time of writing, this
payment was Newstart Allowance, however, the payment was renamed ‘JobSeeker’ and an
additional Coronavirus Supplement payment was introduced as part of the Commonwealth
government’s COVID-19 response. We estimate the value of a reduction in welfare
payments based on the pre-crisis Newstart base rate (i.e. not including the Coronavirus
Supplement). However, we include other additional supplementary payments received by
almost all (99%) recipients of Newstart Allowance pre-crisis (including the Carer Payment,
Remote Area Allowance, transport allowances and the Energy Supplement).
Table A2 presents the schedule of Newstart Allowance and related payments for
unemployed people, and estimates the total number of recipients receiving each tier of
benefits (based on information provided by government during June 2017 Senate Estimates;
see Henriques-Gomez, 2019). In addition to the basic Newstart Allowance, 52% of recipients
received an additional weekly payment of $7.30 through the Clean Energy Supplement; 28%
received an additional $55.18 per week through both the Clean Energy Supplement and
Rent Assistance payments; and around 20% received an additional $240 per week through
Family Tax Benefit and other supplements.
Departmental data for July 2019 record 710,000 Newstart Allowance recipients (similar to
the 2017 level). Therefore, we apply the 2017 results for both the number of Newstart
Allowance recipients receiving benefits today and the proportion of all recipients receiving
additional payments to 2019. Since the loaded Newstart Allowance rates obtained from the
2017 Senate Estimates process are a composite average arising from a combination of non-
specified supplementary payments, we increase all loaded Newstart Allowance payments by
CPI (to account for indexation of benefits between 2017 and 2019).58 Newstart Allowance–
only rates were obtained from the Department of Social Services (2020).
We then take the number of potential unemployed persons scaled for TAFE and apply the
different loaded benefit rates depending on the proportion of overall Newstart Allowance
recipients who receive those additional payments. From this we can calculate an annual cost
saving representing the reduced flow of unemployment benefits to TAFE-trained workers.
We estimate that 64,880 fewer people who were unemployed in 2019 because of their TAFE
qualification, and this generated a total annual saving of $1.2 billion to government in
reduced welfare benefit costs.
58 Newstart Allowance is indexed to prices.

The Economic and Social Benefits of the TAFE System 61
Table A2 Unemployment Benefit Recipients by Additional Payments
Estimated Total
Recipients 2019
Average Cost of
Additional Payments
% of Total Newstart
Allowance Recipients
Payment per
Recipient ($2019)
Estimate of # of Below-
TAFE Recipients
Annual Cost
Savings ($2019 million)
Newstart Only
5000 - 1% $279.5 649 $9.5
Newstart and Supplement Payments
380,544 $11.4 52% $290.9 33,738 $511.7
Newstart, Supplement Payments and Rent Assistance
207,852 $52.98 28% $338.8 18,166 $320.9
Newstart, Family Tax Benefit and Other Supplements and Payments*
138,508 $244.1 19% $523.6 12,327 $336.5
Total TAFE 64,880 $1178.6
Source: Newstart Allowance and additional payments data in Henriques-Gomez (2019). Department of Social Services (2020) for 2019 payment rates. Single, no children rate $279.50 per week; single with dependent children rate used for Family Tax Benefit recipients of $302.35 per week. All additional payments increased by CPI. ‘Supplement payments’ cover a range of payments including Carer Payment, Remote Area Allowance, transport allowances and the Energy Supplement. Annual cost assumed payments received all year (52.14 weeks). TAFE proportion of total VET welfare benefit saving estimated at 72.5%. *‘Other supplements and payments’ represent the average of Rent Assistance and supplementary payment recipients also receiving Family Tax Benefit.
CALCULATING HEALTHCARE SAVINGS BENEFITS
To calculate government savings on healthcare spending due to the improved health
outcomes of TAFE graduates, we estimate the number of people with VET post-school
qualifications who otherwise would be likely to have long-term health conditions if they had
not attained that further education. Mitchell Institute research finds that 42% of male and

The Economic and Social Benefits of the TAFE System 62
female school leavers in the working-age population have a long-term health condition,
compared to only 26% of the general working-age population (Lamb & Huo, 2017). The
authors do not report a long-term health condition rate for workers with educational
attainment above school leavers. Since the 26% rate for the general population also includes
school leavers, the 16% difference likely understates the true health advantages of holding a
VET qualification over school leavers.
To calculate the number of VET-qualified workers who would have had a long-term health
condition had they not attained Year 12 or other post-school qualifications, we use Census
2016 (most recent) population data, since the positive effects of attaining VET qualifications
(such as higher lifetime earnings) continue to impact the health outcomes of people well
after working life. We estimate that around 750,000 additional workers with VET
qualifications would have a long-term health condition if they had not attained Year 12 or
any post-school qualifications. Given the absence of information about the average costs of
long-term health conditions to healthcare budgets (and the multitude of health outcomes),
we do not calculate the costs of a typical long-term health condition.
Instead, we calculate the cost of long-term health conditions based on the average number
of annual GP visits. This method is informed by a UK study by Windmeijer and Santos Silva
(1997), who find that individuals with higher vocational degrees were less likely to visit their
GP than individuals with no post-school qualifications. We use publicly available Medicare
rebate data to estimate the value of reduced demand to access public-subsidised (or bulk-
billed) GPs. The national public healthcare system—Medicare—provides rebates to GPs for
100% of the Schedule fee per consultation. The Schedule fee was $38.20 per consultation in
2019, including 1.5% indexation (Department of Health, 2018). Many doctors charge more
than the Schedule fee, with additional ‘gap fees’ passed onto patients. In both cases, where
clinics bulk-bill patients (with no additional fees) or where they charge gap fees, the
Schedule fee represents the full cost of each GP visit to government. Public health data
indicate that the average Australian visits the GP six times per year.59 We assume that
persons with long-term health conditions present to GPs 50% more often than the working
population average (total of nine visits per year).
We estimate the healthcare cost saving based on both an increase in the number of people
presenting to GPs, and an increase in number of GP visits for that group. We then scale the
total fiscal saving benefit by the estimated percentage of all employees holding VET
qualifications who received those qualifications from TAFE (72.5%). The total annual
reduction in health-related costs arising from TAFE qualifications is thus estimated at
$289 million. More detail of the annual healthcare savings is provided in Table A3.
59 Independent Hospital Pricing Authority (2019), National Hospital Cost Data Collection Report; Public Sector,
Round 21 (Financial Year 2016–17), Table 4. Average cost per episode. Average GP visit data from The
Australia Institute of Health and Welfare (2019a).

The Economic and Social Benefits of the TAFE System 63
Table A3 Annual Healthcare Savings
Total Population
Total Population with
Long-Term Health
Condition (26%)
Number of VET People with Long-Term
Health Condition if
42% Rate
Total People in
Better Health
GP Visits at 26% Rate
(6 per year)
GP Visits at 42% Rate
(9 per year)
Total Annual GP
Visits Reduced
Total Annual Saving
($ Million)
Certificate I and II Level 16,196 4211 6802 2591 25,266 61,221 35,955 1.4
Advanced Diploma and Diploma Level
15,462 4020 6494 2474 24,121 58,446 34,326 1.3
Advanced Diploma and Associate Degree Level
721,054 187,474 302,843 115,369 1,124,844 2,725,584 1,600,740 61.1
Diploma Level 951,406 247,366 399,591 152,225 1,484,193 3,596,315 2,112,121 80.7
Certificate III and IV Level
2,995,132 778,734 1,257,955 479,221 4,672,406 11,321,599 6,649,193 254.0
Total 4,699,250 1,221,805 751,880 7,330,830 17,763,165 10,432,335 398.5
Scaled for TAFE (72.5%) 3,406,956 288.9
Source: Population by highest educational attainment from ABS Census (2016). Cost of ‘GP visits’ set at $38.20 as per Department of Health (2018) Indexation of Medicare Benefits Schedule (MBS) items from 1 July 2018. Annual average GP visit data from The Australia Institute of Health and Welfare (2019a).

The Economic and Social Benefits of TAFE 64
References
Australian Education Union (2020). National Survey Reveals Budget-cut Impact to TAFE
(Available at: http://www.aeufederal.org.au/news-media/media-
releases/2020/jul/090720).
Australian Industry Group (2004). Australia’s Skills Gap: Costly, Wasteful and
Widespread (Sydney: Australian Industry Group).
Australian Industry Group (2018). Skilling: A National Imperative, Survey report
(Sydney: Australian Industry Group).
Australian Institute of Health and Welfare (2018). Australia’s Health (Canberra:
Commonwealth Government).
Australia Institute of Health and Welfare (2019a). Healthy Community Indicators
(Available at: https://www.aihw.gov.au/reports-data/indicators/healthy-community-
indicators).
Australian Institute of Health and Welfare (2019b). The Health of Australia’s Prisoners
2018 (Canberra: Commonwealth Government).
Auwalin, I., N. Alick, and K. Siwaporn (2019). ‘Labour Supply and Skills Shortages in
Australia’, The 2nd International Conference on Islamic Economics, Business, and
Philanthropy (ICIEBP), KnE Social Sciences, pp. 1249–65.
Baldry, E., D. Bright, J. Cale, A. Day, L. Dowse, and M. Giles (2018). A Future Beyond the
Wall: Improving Post-Release Employment Outcomes For People Leaving Prison: Final
Report (Sydney: UNSW Sydney).
Birch, E., P. Kenyon, P. Koshy, and N. Wills-Johnson (2003). Exploring the social and
economic impacts of adult and community education (National Centre for Vocational
Education Research (NCVER)).
Borland, J. (2020). ‘COVID‐19 and the Australian Labour Market: What Do the Data Tell
Us Happened between March and April?’, Labour market snapshot #60, Department of
Economics, University of Melbourne.
Burke, G. (2018). Changes in Funding in Australian Vocational Education and their
Effects (Melbourne: L.H. Martin Institute, University of Melbourne).

The Economic and Social Benefits of TAFE 65
Centre for Economics and Business Research (CEBR) (2014). Economic Impact of
Apprenticeships: A CEBR Report for the Skills Funding Agency (London: CEBR).
City & Guilds Group (2015). The Economic Benefits of Vocational Education and
Training in the UK.
Commonwealth Government (2019). Financial Support for Australian Apprentices
(Available at: https://www.australianapprenticeships.gov.au/aus-apprenticeships-
incentives).
Conference Board of Canada (2019). ‘The Economic Case for Investing in Education’,
prepared for Ontario Secondary School Teachers’ Federation, June.
Conlon, G., and P. Patrignani (2013). A Disaggregated Analysis of the Long Run Impact
of Vocational Qualifications, BIS Research Paper Number 106.
Dearden, L., H. Reed, and J. Van Reenen (2005). ‘The Impact of Training on Productivity
and Wages: Evidence from British Panel Data’, Economic History Working Papers,
London School of Economics and Political Science, Department of Economic History.
Deloitte Access Economics (2019). The Path to Prosperity: Why the Future of Work is
Human (Sydney: Deloitte Touché Tohmatsu).
Department of Education (2016). Redesigning VET FEE-HELP: Discussion Paper
(Canberra: Department of Education).
Department of Education and Training (2015). Selected Higher Education Statistics—
2015 Student Data (Canberra: Department of Education and Training).
Department of Education and Training (2017). Selected Higher Education Statistics—
2017 Student data and uCube (Canberra: Department of Education and Training).
Department of Education, Skills and Employment (2019). Historical List of Skill
Shortages in Australia (Canberra: Department of Education, Skills and Employment).
Department of Health (2018). Indexation of Medicare Benefits Schedule (MBS) Items
from 1 July 2018 (Canberra: Australian Government).
Department of Social Services (2016). Youth Allowance Payment Trends and Profiles
Report—June 2016 (Canberra: Department of Social Services).
Department of Social Services (2016). Payment Trends and Profiles Report - June 2016
(Canberra: Department of Social Services).

The Economic and Social Benefits of TAFE 66
Department of Social Services (2020). How Much Can You Get (Available at:
https://www.servicesaustralia.gov.au/individuals/services/centrelink/newstart-
allowance/how-much-you-can-get).
Feinstein, L., R. Sabates, T.M. Anderson, A. Sorhaindo, and C. Hammond (2006). ‘What
are the Effects of Education on Health? Measuring the Effects of Education on Health
and Civic Engagement’, Proceedings of The Copenhagen Symposium, OECD.
Ferguson, H., and M. Harrington (2019). Education and Training: Budget Review 2019–
20 Index (Canberra: Parliament of Australia, available at
https://www.aph.gov.au/About_Parliament/Parliamentary_Departments/Parliamenta
ry_Library/pubs/rp/BudgetReview201920/EducationTraining).
Flanagan, F. and F. Stilwell (2018). “Editorial: Causes and Consequences of Labour’s
Falling Income Share and Growing Inequality,” Journal of Australian Political Economy
81, pp. 5-10.
Fortin, P., L. Godbout, and S. St-Cerny (2018). ‘Impact of Quebec’s Universal Low-Fee
Childcare Program on Female Labour Force Participation, Domestic Income, and
Government Budget’.
Gong, X., and R. Tanton (2018). Returns to Education in Australia 2006–2016
(Canberra: National Centre for Social and Economic Modelling (NATSEM), University of
Canberra).
Hawke, G. (1998). ‘Learning, Workplaces and Public Policy’, in J. McIntyre and M.
Barrett (Eds.), VET Research: Influencing Policy and Practice, Proceedings of the First
National Conference of the Australian Vocational Education and Training Research
Association, Sydney.
Hayward, H., E. Hunt, and A. Lord (2014). The Economic Value of Key Intermediate
Qualifications: Estimating the Returns and Lifetime Productivity Gains to GCSEs, A
Levels and Apprenticeships, Research Report, December.
Henriques-Gomez, L. (2019). ‘Newstart: What are the Facts about the Unemployment
Payment?’, The Guardian, 15 May.
Independent Hospital Pricing Authority (2019). National Hospital Cost Data Collection
Report; Public Sector, Round 21 (Financial Year 2016–17) (Available at
https://www.ihpa.gov.au/publications/national-hospital-cost-data-collection-report-
public-sector-round-21-financial-year).
Lamb, S., and S. Huo (2017). Counting the Costs of Lost Opportunity in Australian
Education, Mitchell Institute Report No. 02/2017.

The Economic and Social Benefits of TAFE 67
Leigh, A. (2008). ‘Returns to Education in Australia’, Economic Papers, vol. 27, no. 3,
pp. 233–49.
Long, M., and C. Shah (2008). Private Returns to Vocational Education and Training
Qualifications (Prepared for National Centre for Vocational Education Research
(NCVER). Centre for the Economics of Education and Training, Monash University).
Knight, G., I. White, and P. Granfield (2020). Understanding the Australian Vocational
Education and Training Workforce (National Centre for Vocational Education
Research).
KPMG (2018a). The Importance of TAFE Queensland to Queensland’s Prosperity.
November (Melbourne: KPMG).
KPMG (2018b). The Importance of TAFE to Victoria’s Prosperity (Melbourne: KPMG).
Lanvin, B., and F. Monteivo (2020). Global Talent Competitiveness Index 2020: Global
Talent in the Age of Artificial Intelligence (Report prepared on behalf of Insead, Google
& Adecco).
Leal, H. (2019). ‘Firm-level Insights into Skills Shortages and Wages Growth’, RBA
Bulletin, Reserve Bank of Australia, March.
Macintyre, S. (2015). Australia's Boldest Experiment: War and Reconstruction in the
1940s (Sydney: NewSouth Publishing).
Maxwell. R. (2018). How Employers Can Play A Role in Averting Australia’s Skills
Shortage (Bathurst: Verto).
Mitchell Institute (2020). ‘New Modelling Warns Youth Unemployment to Skyrocket as
Apprenticeships Disappear’, Mitchell Institute (available at
http://www.mitchellinstitute.org.au/news/new-modelling-warns-youth-
unemployment-to-skyrocket-as-apprenticeships-disappear/).
National Australia Bank (NAB) (2017). ‘Skills Shortage Holding Back Australian
Business’, National Australia Bank, 5 September.
National Centre for Vocational Education Research (NCVER) (2018). Historical Time
Series of Government-Funded Vocational Education and Training From 1981 to 2018
(Adelaide: NCVER).
National Centre for Vocational Education Research (NCVER) (2019a). Total VET
Students and Courses 2018 (Adelaide: NCVER).

The Economic and Social Benefits of TAFE 68
National Centre for Vocational Education Research (NCVER) (2019b). VET Student
Outcomes (Adelaide: NCVER).
National Centre for Vocational Education Research (NCVER) (2019c). Australian
Vocational Education and Training Statistics: Government Funding of VET 2018—Data
(Adelaide: NCVER).
Noonan, P. (2016). VET Funding in Australia: Background, Trends and Future Directions
(Melbourne: Mitchell Institute).
Noonan, P., and S. Pilcher (2018). Participation in Tertiary Education in Australia:
Modelling and Scenario Analysis (Melbourne: Mitchell Institute).
O’Dwyer, L., and I. White (2019). The Dynamics of Qualifications: Implications for VET
(Adelaide: National Centre for Vocational Education Research).
Organisation for Economic Co-operation and Development (OECD) (2010). Learning for
Jobs (available at: http://www.oecd.org/education/skills-beyond-
school/Learning%20for%20Jobs%20book.pdf).
Organisation for Economic Co-operation and Development (OECD) (2016). ‘Investing in
Youth: Australia’, Investing in Youth (Paris: OECD Publishing).
Organisation for Economic Co-operation and Development (OECD) (2020). ‘Youth Not
in Employment, Education or Training (NEET)’, indicator.
Pilcher, S., and K. Torii (2017). Expenditure on Education and Training in Australia 2017,
Report No. 05/2017 (Mitchell Institute, Victoria University).
Preston, J., and A. Green (2003). The Macro-Social Benefits of Education, Training and
Skills in Comparative Perspective, Wider Benefits of Learning Research Report No. 9
(Centre for Research on the Wider Benefits of Learning).
Prime Minister of Australia (2020). ‘JobTrainer Skills Package for Economic Recovery
and Growth,’ 16 July (Available at: https://www.pm.gov.au/media/jobtrainer-skills-
package-economic-recovery-and-growth).
Productivity Commission (2011). Vocational Education and Training Workforce
(Canberra: Productivity Commission).
Productivity Commission (2020a). Report on Government Services 2020 (Canberra:
Productivity Commission).
Productivity Commission (2020b). National Agreement for Skills and Workforce
Development Review (Canberra: Productivity Commission).

The Economic and Social Benefits of TAFE 69
Quality Indicators for Learning and Teaching (2019). 2019 Graduate Outcomes Survey.
Quiggan, J. (2018). ‘The Failure of Vocational Education and Training Policy in
Australia’, submission to the Senate Education and Employment References
Committee Inquiry into Vocational Education and Training in South Australia, January.
Redrup, Y. (2017). ‘Skills Shortage Risks $139b Digital Economy’, Australian Financial
Review, 23 May (Available at: https://www.afr.com/technology/skills-shortage-risks-
139b-digital-economy-deloitte-access-economics-and-acs-20170518-gw7hcc).
Rice, J.M., D. Edwards, and J. McMillan (2019). Education Expenditure in Australia
(Canberra: Australian Council for Education Research).
Richardson, S. (2007). What Is A Skill Shortage? (Adelaide: National Centre for
Vocational Education Research).
Ryan, C.A. (2002). Individual Returns to Vocational Education and Training
Qualifications: Their Implications for Lifelong Learning (Adelaide: NCVER).
Stanford, J. (2018). ‘The Declining Labour Share in Australia: Definition, Measurement,
and International Comparisons’, Journal of Australian Political Economy, no. 81, pp.
11–32.
Stanwick, J., O. Koon, and T. Karmel (2006). Vocational Education and Training, Health
and Wellbeing: Is There a Relationship? (National Centre for Vocational Education
Research).
TAFE Directors Australia (2019). VET Reform and Joyce Review (Available at:
https://staging.tda.edu.au/wp-content/uploads/2020/01/VET-Reform-Joyce-
Review.pdf).
Tertiary Education Quality and Standards Agency (TEQSA) (2016). Key Financial Metrics
on Australia’s Higher Education Sector—2nd edition (Melbourne: TEQSA).
Tertiary Education Quality and Standards Agency (TEQSA) (2018). Key Financial Metrics
on Australia’s Higher Education Sector—4th edition (Melbourne: TEQSA).
The Front Project (2019). A Smart Investment for a Smarter Australia: Economic
Analysis of Universal Early Childhood Education in the Year Before School in Australia
(Prepared by PwC), June.
Toner, P (2018). ‘A Tale of Mandarins and Lemons: Creating the Market for Vocational
Education and Training’, in D. Cahill and P. Toner, Wrong Way: How Privatization and
Economic Reform Backfired (Carlton, Vic: LaTrobe University Press), pp. 59–84.

The Economic and Social Benefits of TAFE 70
Victorian Registration and Qualifications Authority (2017). Minimum Hours for
Employment and Training Policy (Victoria Government).
Wheelahan, L. (2018). ‘New Figures Quantify the Extent of the TAFE Disaster’, Stop
TAFE Cuts, blog post, 23 June (Available at:
https://www.stoptafecuts.com.au/blog/newfigures-quantify-extent-tafe-disaster).
Wilkins, R., and I. Lass (2018). The Household, Income and Labour Dynamics in
Australia Survey: Selected Findings from Waves 1 to 16 (Melbourne Institute of Applied
Economic and Social Research, University of Melbourne).
Windmeijer, F. A., and J. M. C. Santos Silva (1997). ‘Endogeneity in Count Data Models:
An Application to Demand for Health Care’, Journal of Applied Econometrics, no. 12,
pp. 281–294.
Yu, S., and D. Oliver (2015). The Capture of Public Wealth by the For-Profit VET Sector
(Sydney: Workplace Research Centre).
Zoellner, D. (2019). ‘Beyond Community Service Obligations: The Institutional Logics
and Public Value of TAFE’, TAFE Directors Australia, Canberra.
Related Documents