An investigation of the three-dimensional thermo/hydro/mechanical behaviour of large scale in-situ experiments Troy Alexander Melhuish Geoenvironmental Research Centre Cardiff School of Engineering Cardiff University Thesis submitted in candidature for the degree of Doctor of Philosophy at Cardiff University December 2004

Welcome message from author
This document is posted to help you gain knowledge. Please leave a comment to let me know what you think about it! Share it to your friends and learn new things together.
Transcript
An investigation of the three-dimensional
thermo/hydro/mechanical behaviour o f large
scale in-situ experiments
Troy Alexander Melhuish
Geoenvironmental Research Centre
Cardiff School o f Engineering
Cardiff University
Thesis submitted in candidature for the degree o f Doctor of
Philosophy at Cardiff University
December 2004
UMI Number: U204219
All rights reserved
INFORMATION TO ALL USERS The quality o f this reproduction is dependent upon the quality o f the copy submitted.
In the unlikely event tha t the author did not send a complete manuscript and there are m issing pages, these will be noted. Also, if material had to be removed,
a note will indicate the deletion.
UMI’Dissertation Publishing
UMI U204219Published by ProQuest LLC 2013. Copyright in the Dissertation held by the Author.
Microform Edition © ProQuest LLC.All rights reserved. This work is protected against
unauthorized copying under Title 17, United States Code.
ProQuest LLC 789 East E isenhower Parkway
P.O. Box 1346 Ann Arbor, Ml 48106-1346

DECLARATION
This work has not previously been accepted in substance for any degree and is not being
concurrently submitted in candidature for any degree.
(candidate)
STATEMENT 1
This thesis is the result o f my own investigations, except where otherwise stated. Other
sources are acknowledged by footnotes giving explicit references. A bibliography is
appended.
Signed .. 7 ........................................ (candidate)
Date ................... ...........................................................................
STATEMENT 2
I hereby give consent for my thesis, i f accepted, to be made available for photocopying and
for inter-library loan, and fo r the title and summary to be made available to outside
organisations.
Signed ...........7 /. (candidate)
Date S . U X - j M . ..........................................

Acknowledgements
I would first like to thank SKB, AECL, the EPSRC and the University o f Wales, Cardiff
fo r providing the necessary resources and opportunity that allowed me to undertake this
research.
I would also like to offer a special thank you to both o f my supervisors, Dr. Peter Cleall
and Prof. Hywel Thomas, fo r their advice, support and encouragement throughout the
course o f this research period. Their help is greatly appreciated.
M y thanks also go to a ll o f m y friends and colleagues at the Geoenvironmental Research
Centre, particularly Dr. Suresh Seetharam and Dr. Deping D ing for their technical
assistance and cooperation at the various stages during this study.
The completion o f this thesis has been greatly helped by the support and understanding o f
m y fam ily and my ‘new’ family. I am a very fortunate person indeed.
Finally, I would like to thank my w ife, Sarah. Her optimism and unreserved love have
helped me reach the top o f the mountain.
SummaryThis thesis presents an investigation o f the three-dimensional thermo/hydro/mechanical behaviour o f large scale in-situ experiments for the disposal o f high-level nuclear waste. Two experiments are investigated in this work, which include principally the Prototype Repository Experiment and secondly the Tunnel Sealing Experiment.
A comprehensive numerical modelling exercise is performed in this investigation to study the coupled flow and deformation behaviour in the experiments. This is undertaken by applying the fin ite element modelling code COMPASS (COde for Modelling PArtially Saturated Soils) developed at C ard iff University. This is a mechanistic model which describes heat transfer, moisture migration, solute transport and air transfer in a material coupled w ith stress/strain behaviour. A standard fin ite element method is used for spatial discretisation and a fin ite difference method is used for temporal discretisation.
Due to the size and com plexity o f the experiments, sophisticated fin ite element models are analysed. To provide the fac ility to tackle highly computationally demanding simulations COMPASS has been developed via the application o f iterative solution methods, parallel computing techniques and three-dimensional visualisation techniques.
In the simulation o f the Prototype Repository experimental data was available concerning the thermal, hydraulic and mechanical fields, and therefore a systematic exercise to compare the results is presented. Key mechanisms seen in the experiment are captured in the analyses and the model simulates well both the thermal and hydraulic behaviour in the barrier materials. W ith respect to the deformation behaviour the model identifies important trends and provides reasonable agreement w ith the observed behaviour.
In the simulation o f the Tunnel Sealing Experiment the behaviour o f the clay bulkhead is investigated with a lim ited amount o f experimental evidence available. Preliminary comparisons w ith the observed behaviour show that the thermal fie ld is slightly over predicted. However, key trends in the mechanical response are identified and the hydraulic behaviour is captured reasonably well.
Contents
Chapter 1 Introduction
1.1 Study objectives 1 -7
1.2 Research background 1 -8
1.3 Scope and lim itations 1-10
1.4 Thesis overview 1-11
Chapter 2 Literature Review
2.1 Introduction 2-1
2.2 Coupled heat, moisture and air flow in unsaturated soil 2-3
2.2.1 Conclusions 2-5
2.3 Deformation behaviour in unsaturated soil 2-5
2.3.1 Elastic constitutive relationships 2-6
2.3.2 Elasto-plastic constitutive relationships 2-8
2.3.3 Conclusions 2-12
2.4 Coupled flow and deformation behaviour in unsaturated soils 2-13
2.4.1 Conclusions 2.17
2.5 Laboratory experiments based on the concept for the disposal 2-18
o f high-level nuclear waste
2.5.1 Laboratory bench top experiments 2-18
2.5.2 Large scale mock-up experiments 2-21
2.5.2.1 AN D R A, France 2-21
2.5.2.2 FEB EX, Spain 2-21
2.5.2.3 M cG ill University, Canada 2-23
2.5.2.4 Tokai Works, Japan 2-24
2.5.3 Conclusions 2-24
2.6 Large scale in-situ experiments based on the concept fo r the 2-25
disposal o f high-level nuclear waste
2.6.1 Large scale in-situ benchmarking exercises 2-25
2.6.1.1 D ECO VALEX 2-25
2.6.1.1.1 D ECO VALEX I 2-26
2.6.1.1.2 D ECO VALEX II 2-26
2.6.1.1.3 D ECO VALEX II I 2-27
2.6.1.2 CATSIUS C LA Y 2-28
2.6.2 Other large scale in-situ experiments 2-29
2.6.2.1 The Mol/Dessel Nuclear Site, Belgium 2-29
2.6.2.1.1 CERBERUS 2-30
2.6.2.1.2 CACTUS 2-30
2.6.2.1.3 ATLAS and PRACLAY 2-30
2.6.2.2 A tom ic Energy o f Canada Limited, AEC L 2-31
2.6.2.2.1 The Isothermal Test 2-31
2.6.2.2.2 The Buffer/Container Experiment 2-32
2.6.2.2.3 The Tunnel Sealing Experiment 2-33
2.6.2.3 Aspo Hard Rock Laboratory (HRL), Sweden 2-33
2.6.2.3.1 The TRUE Block Scale Project 2-33
2.6.2.3.2 Backfill and Plug Test Project (BPTP) 2-34
2.6.2.3.3 Canister Retrieval Test 2-35
2.6.2.3.4 Temperature Buffer Test (TBT) 2-36
2.6.2.3.5 The Prototype Repository Project 2-36
2.6.3 Conclusions 2-37
2.7 Solution methods 2-38
2.7.1 Development o f solution methods 2-38
2.7.2 Preconditioning 2-40
2.7.2 Conclusions 2-41
2.8 High performance computing 2-41
2.8.1 Development o f H igh performance computing 2-42
2.8.2 Application o f H igh performance computing to the 2-43
fin ite element method
2.8.3 Parallel preconditioned iterative solutions 2-44
2.8.4 High performance computing at C ard iff University 2-45
2.8.5 Conclusions 2-46
2.9 Conclusions 2-47
Chapter 3 Theoretical Formulation3.1 Introduction 3-1
3.2 Moisture transfer 3-2
3.2.1 Mechanisms o f liquid water flow 3-4
3.2.1.1 Micro/macro interaction effects on moisture flow 3-6
3.2.2 Mechanisms o f vapour flow 3-7
3.2.3 Governing differential equation for water flow 3-10
3.3 Dry air transfer 3-13
3.4 Heat transfer 3-16
3.5 Deformation behaviour 3-21
3.5.1 Stress-strain relationship 3-23
3.5.2 Elasto-plastic constitutive relationships 3-24
3.5.2.1 Material behaviour under elastic condition 3-24
3.5.2.2 Y ie ld function 3-26
3.5.2.3 Flow rule 3-27
3.5.2.4 Hardening laws 3-28
3.5.3 Governing equation for deformation 3-29
3.6 Conclusions 3-31
Chapter 4 Finite Element Formulation and Computer
Modelling4.1 Introduction 4-1
4.2 Spatial discretisation o f the governing equations for flow and deformation 4-2
4.2.1 Spatial discretisation o f the governing equation for moisture
transfer
4-2
4.2.2 Spatial discretisation o f the governing equation fo r heat transfer 4-6
4.2.3 Spatial discretisation o f the governing equation fo r air transfer 4-7
4.2.4 Spatial discretisation o f the governing equation fo r deformation
variables
4-8
4.3 Temporal discretisation o f the coupled flow and deformation formulation 4-11
4.4 Software 4-14
4.5 Solution methods 4-15
4.6 Three-dimensional visualisation 4-15
4.7 Conclusions 4-16
Chapter 5 The Prototype Repository Project5.1 Introduction 5-1
5.2 Svensk Kambranslehantering AB (SKB) 5-3
5.2.1 Storage and disposal o f high-level nuclear waste 5-3
5.2.2 The Aspo Hard Rock Laboratory 5-5
5.3 The Prototype Repository Experiment 5-7
5.3.1 Background 5-7
5.3.2 Principal issues 5-8
5.3.3 Configuration 5-9
5.3.4 Timescale 5-9
5.4 Characterisation o f the rock mass in the Prototype Repository Project 5-11
5.4.1 Stage 1 - Mapping the tunnel 5-11
5.4.1.1 Geology 5-12
5.4.1.2 Fractures and joints 5-13
5.4.1.3 Thermal properties 5-14
5.4.1.4 Inflow measurements 5-15
5.4.1.5 Mechanical properties 5-16
5.4.1.6 Rock stress conditions 5-17
5.4.2 Stage 2 - Pilot and exploratory boreholes 5-17
5.4.2.1 D rilling campaigns 1, 2 and 3 5-18
5.4.2.2 Interference test campaigns 1 and 2 5-19
5.4.2.3 Injection test campaigns 1 and 2 5-20
5.4.2.4 Lead-through holes 5-20
5.4.2.5 Main conclusions from Stage 2 5-20
5.4.3 Stage 3 — Deposition holes 5-21
5.5 Instrumentation installed in the Prototype Repository 5-23
5.5.1 Position o f the instrumentation 5-23
5.5.2 Measurements o f temperature 5-24
5.5.3 Measurement o f the water saturation process 5-24
5.5.4 Measurement o f total pressure 5-25
5.5.5 Measurement o f pore water pressure 5-25
5.6 Conclusions 5-25
Chapter 6 Preliminary Results from the Prototype
Repository ExperimentIntroduction 6-1
Results and comments fo r Section I 6-2
6.2.1 Deposition hole 1 6-3
6.2.1.1 Temperature 6-3
6.2.1.2 Relative humidity 6-3
6.2.1.3 Total pressure 6-4
6.2.2 Deposition hole 3 6-5
6.2.2.1 Temperature 6-5
6.2.2.2 Relative hum idity 6-6
6.2.2.3 Total pressure 6-7
6.2.3 Backfill 6-8
6.2.3.1 Temperature 6-8
6.2.3.2 Total suction 6-9
6.2.3.3 Total pressure 6-9
6.2.4 Temperature in the rock 6-9
6.2.4.1 Near deposition hole 1 6-10
6.2.4.2 Near deposition hole 2 6-10
6.2.4.3 Near deposition hole 3 6-10
6.2.4.4 Near deposition hole 4 6-11
Results and comments fo r Section II 6-11
6.3.1 Deposition hole 5 6-11
6.3.2 Deposition hole 6 6-12
Conclusions 6-13
Chapter 7 Simulation of the Prototype Repository
Experiment
7.1 Introduction 7-1
7.2 Material Parameters 7-3
7.2.1 Introduction 7-3
7.2.2 M X-80 bentonite buffer 7-3
7.2.2.1 Thermal material parameters 7-4
1.2.22 Hydraulic material parameters 7-5
7.2.2.3 Mechanical material parameters 7-7
7.2.3 M X-80 bentonite pellets 7-8
7.2.3.1 Thermal material parameters 7-8
7.2.3.2 Hydraulic material parameters 7-8
7.2.3.3 Mechanical material parameters 7-9
7.2.4 B ackfill 7-10
7.2.4.1 Thermal material parameters 7-11
7.2.4.2 Hydraulic material parameters 7-11
7.2.4.3 Mechanical material parameters 7-12
7.2.5 Host rock 7-12
7.2.5.1 Thermal material parameters 7-12
7.2.5.2 Hydraulic material parameters 7-13
7.2.5.3 Mechanical material parameters 7-15
7.2.6 Fractures 7-16
7.2.7 Concrete plugs 7-16
7.2.8 Conclusions 7-17
7.3 Geometric Models 7-19
7.3.1 Full three-dimensional repository model 7-19
7.3.2 Three-dimensional tunnel section model 7-20
7.3.3 Two-dimensional axisymmetric model 7-20
7.4 Simulation o f the pre-heating phase o f the experiment 7-21
7.4.1 Hydraulic simulation o f the granite rock 7-21
7.4.2 In itia l and boundary conditions 7-21
7.4.3 Simulation numerics 7-22
7.4.4 Simulation results 7-23
7.4.5 Conclusions 7-25
Thermal simulation o f the experiment 7-26
7.5.1 Initia l and boundary conditions 7-26
7.5.2 Simulation numerics 7-27
7.5.3 Simulation results 7-27
7.5.4 Conclusions 7-29
Thermal-Hydraulic simulation o f the experiment 7-30
7.6.1 Investigation o f vapour transfer in the M X-80 buffer 7-30
7.6.1.1 Small scale heating tests 7-31
7.6.1.2 Large scale tests 7-32
7.6.1.3 Conclusions 7-33
7.6.2 In itia l and boundary conditions 7-34
7.6.3 Simulation numerics 7-35
7.6.4 Simulation results - short-term comparisons 7-35
7.6.4.1 Deposition Hole 1 7-36
7.6.4.1.1 Temperature 7-36
7.6.4.1.2 Relative Hum idity 7-37
7.6.4.2 Deposition Hole 3 7-38
7.6.4.2.1 Temperature 7-38
7.6.4.2.2 Relative Humidity 7-39
7.6.4.3 Deposition Hole 5 7-41
7.6.4.4 Deposition Hole 6 7-42
7.6.4.5 Backfill 7-43
7.6.4.5.1 Temperature 7-43
7.6.4.5.2 Degree o f Saturation 7-44
7.6.4.6 Temperature in the rock 7-46
7.6.5 Simulation results - long-term predictions 7-47
7.6.5.1 Temperature 7-47
1.6.52 Relative Humidity 7-49
7.6.6 Conclusions 7-50
Thermal-Hydraulic-Mechanical simulation o f the experiment 7-53
7.7.1 Initia l and boundary conditions 7-53
7.7.2 Simulation numerics 7-54
7.7.3 Sensitivity analysis o f material parameters fo r pelletised region 7-55
7.7.4 Simulation results 7-56
7.7.4.1 Deposition hole 1 7-57
7.7.4.1.1 Thermal and hydraulic response 7-57
7.7.4.1.2 Total Pressure 7-57
7.7.4.1.3 Void Ratio 7-58
7.7.4.2 Deposition hole 3 7-60
7.7.4.2.1 Thermal and hydraulic response 7-60
7.7.4.2.2 Total Pressure 7-60
7.7.4.2.3 V oid Ratio 7-61
1.1 A 3 Development o f Total Pressure in the Backfill 7-61
7.7.4.4 Development o f Stress in the Rock 7-62
7.7.4.5 Conclusions 7-63
Discussion 7-66
Conclusions 7-70
Chapter 8 Simulation of the Tunnel Sealing Experiment
8.1 Introduction 8-1
8.2 The Tunnel Sealing Experiment 8-3
8.3 Material parameters 8-4
8.3.1 Bentonite/sand clay bulkhead 8-4
8.3.1.1 Hydraulic and thermal material parameters 8-5
8.3.1.2 Mechanical material parameters 8-7
8.3.2 Granite rock 8-8
8.3.2.1 Hydraulic and thermal material parameters 8-8
8.3.2.2 Mechanical material parameters 8-9
8.3.3 Sand materials 8-10
8.3.3.1 Hydraulic and thermal material parameters 8-10
8.3.3.2 Mechanical material parameters 8-11
8.3.4 Steel plate 8-12
8.3.4.1 Hydraulic and thermal material parameters 8-12
8.3.4.2 Mechanical material parameters 8-12
8.3.5 Reinforced concrete ring 8-13
8.3.5.1 Hydraulic and thermal material parameters 8-13
8.3.5.2 Mechanical material parameters 8-13
8.3.6 Conclusions 8-14
8.4 Simulation Pre-Phase I 8-15
8.4.1 Hydraulic simulation o f granite prior to Phase I 8-15
8.4.1.1 Initia l and boundary conditions 8-15
8.4.1.2 Simulation numerics 8-15
8.4.1.3 Simulation results 8-16
8.4.1.4 Conclusions 8-17
8.5 Simulation o f Phase I 8-18
8.5.1 Hydraulic simulation o f Phase I 8-18
8.5.1.1 In itia l and boundary conditions 8-18
8.5.1.2 Simulation numerics 8-19
8.5.1.3 Simulation results 8-20
8.5.1.3.1 Analysis_H_l 8-20
8.5.1.3.2 Analysis_H_2 8-21
8.5.1.3.3 Analysis_H_3 8-22
8.5.1.4 Conclusions 8-22
8.5.2 Hydraulic-Mechanical simulation o f Phase 1 8-23
8.5.2.1 In itia l and boundary conditions 8-23
8.5.2.2 Simulation numerics 8-24
8.5.2.3 Simulation results 8-24
8.5.2.3.1 Analysis_H-M_l 8-24
8.5.2.3.2 Analysis_H-M_2 8-26
8.5.2.3.3 Analysis_H-M_3 8-26
8.5.2.4 Conclusions 8-27
8.6 Simulation o f Phase II 8-29
8.6.1 Thermal simulation o f Phase II 8-29
8.6.1.1 In itia l and boundary conditions 8-29
8.6.1.2 Simulation numerics 8-30
8.6.1.3 Simulation results 8-30
8.6.1.4 Conclusions 8-31
8.6.2 Hydraulic simulation o f Phase II 8-31
8.6.2.1 Initial and boundary conditions 8-31
8.6.2.2 Simulation numerics 8-32
8.6.2.3 Simulation results 8-32
8.6.2.4 Conclusions 8-32
8.6.3 Thermal-Hydraulic simulation o f Phase II 8-33
8.6.3.1 In itia l and boundary conditions 8-33
8.6.3.2 Simulation numerics 8-33
8.6.3.3 Simulation results 8-34
8.6.3.3.1 Thermal expansion o f water not considered 8-34
8.6.3.3.2 Thermal expansion o f water considered 8-34
8.6.3.4 Conclusions 8-35
8.6.4 Thermal-Hydraulic-Mechanical simulation o f Phase II 8-36
8.6.4.1 Initia l and boundary conditions 8-36
8.6.4.2 Simulation numerics 8-36
8.6.4.3 Simulation results 8-37
8.6.4.4 Conclusions 8-38
8.7 Preliminary comparison o f the experimental behaviour
with the simulated behaviour 8-39
8.7.1 Hydraulic behaviour during Phase I 8-39
8.7.2 Mechanical behaviour during Phase I 8-40
8.7.3 Thermal behaviour during Phase II 8-41
8.7.4 Conclusions 8-42
8.8 Conclusions 8-43
Chapter 9 Conclusions and suggestions for further
research
9.1 Introduction 9-1
9.2 Status o f research into the disposal o f high-level nuclear waste 9-2
9.3 Combining COMPASS w ith a pre and post-processor for 9-3
three-dimensional analyses
9.4 Interfacing COMPASS w ith a three-dimensional Visualisation Suite 9-3
9.5 Increasing the performance and efficiency o f COMPASS 9-4
9.6 Investigation o f the TH M behaviour o f the Prototype
Repository Experiment 9-5
9.7 Investigation o f the TH M behaviour o f the Tunnel Sealing Experiment 9-7
9.8 General conclusions 9-9
9.9 Suggestions for further research 9-10
References
Notationa Constant used in equations (2.4), (2.5), (2.6) and (2.7)
A Plastic modulus, defined in equation (3.137)
As Defined in equation (3.115)
A t Defined in equation (3.116)
A Defined in equation (4.60)
b Constant used in equations (2.4), (2.5), (2.6), (2.7) and (7.2)
bxi by, bz Two-dimensional body forces
b Vector o f body force
B Strain-displacement matrix, defined in equation (4.44)
c Constant used in equations (2.4), (2.5), (2.6) and (2.7)
C Corrected value, defined in equations (4.65) and (4.66)
cm Defined in equation (3.67)
Cal Defined in equation (3.65)
caT Defined in equation (3.66)
Cau Defined in equation (3.68)
Cla Defined in equation (3.46)
C" Defined in equation (3.44)
CIT Defined in equation (3.45)
C lu Defined in equation (3.47)
cm Compressive index w ith respect to suction, defined in equation (2.2)
Cpda Specific heat capacity o f dry air
Cp, Specific heat capacity o f liquid
Cps Specific heat capacity o f solid particles
Cpy Specific heat capacity o f vapour
c, Compressive index w ith respect to net stress, defined in equation (2.2)
C to Defined in equation (3.91)
Cn Defined in equation (3.89)
Crr Defined in equation (3.90)
C tu Defined in equation (3.92)
cm Defined in equation (3.144)
C„ Defined in equation (3.142)
Q r Defined in equation (3.143)
Cm Defined in equation (3.145)
c Defined in equation (4.60)
C „ Defined in equation (4.35)
c„ Defined in equation (4.33)
C.T Defined in equation (4.34)
C«u Defined in equation (4.36)
c„ Defined in equation (4.17)
c„ Defined in equation (4.15)
C|T Defined in equation (4.16)
C,u Defined in equation (4.18)
Ct . Defined in equation (4.26)
Cti Defined in equation (4.24)
C'tt Defined in equation (4.25)
Ctu Defined in equation (4.27)
Cua Defined in equation (4.56)
CU| Defined in equation (4.54)
C„T Defined in equation (4.55)
cuu Defined in equation (4.57)
d Constant used in equations (2.4), (2.5), (2.6) and (2.7)
Datms Molecular d iffus iv ity o f vapour through air
Dm Coefficient o f water content changes w ith respect to suction, defined in
equation (2.3)
Dmv Defined in equation (7.9)
D, Coefficient o f water content changes w ith respect to net stress, defined in
equation (2.3)
D tv Defined in equation (7.9)
D Elasticity matrix
Dep Elasto-plastic stress-strain matrix
e Void ratio
es Void ratio at saturation
eo In itia l void ratio
E Young’ s modulus
Ess Sink/source term
/ Flow area factor
F Applied force
F i Y ie ld function as defined in equation (3.121)
F 2 Y ield function as defined in equation (3.123)
fa Defined in equation (4.39)
fi Defined in equation (4.22)
f r Defined in equation (4.31)
f„ Defined in equation (4.58)
F* Approximate heat flux normal to the boundary surface
g Gravitational constant
G Shear modulus
Gs Specific weight
h Relative humidity
H c Heat capacity o f the soil
H s Henry’ s volumetric coefficient o f solubility
/ Iteration level
Ja Defined in equation (3.71)
Ji Defined in equation (3.51)
J t Defined in equation (3.97)
k Constant related to the cohesion o f the soil, defined in equation (3.122)
k, Intrinsic permeability o f pore liquid
ka Effective permeability o f pore air
K Bulk modulus
K a Unsaturated conductivity o f pore air
K aa Defined in equation (3.70)
K ai Defined in equation (3.69)
Kfracture Saturated hydraulic conductivity o f a representative fracture
K/ Unsaturated hydraulic conductivity
Km M odified hydraulic conductivity due to micro/macro effects
K la Defined in equation (3.50)
K/i Defined in equation (3.48)
K it Defined in equation (3.49)
Krock Saturated hydraulic conductivity o f the rock mass
K sa, Saturated hydraulic conductivity
K Ta Defined in equation (3.96)
K ji Defined in equation (3.94)
K tt Defined in equation (3.95)
K va Defined in equation (4.12)
Ky, Defined in equation (4.10)
k vT Defined in equation (4.11)
K „ Defined in equation (4.38)
K „ Defined in equation (4.37)
Ki« Defined in equation (4.21)
K,, Defined in equation (4.19)
K jT Defined in equation (4.20)
K t , Defined in equation (4.30)
k t1 Defined in equation (4.28)
K tt Defined in equation (4.29)
L Latent heat o f vaporisation
M Slope o f the critical state line
m Unit vector
n Porosity
n Direction cosine normal to the surface, defined in equation (4.8)
Ns,N r Shape functions
N(s) Intercept o f the normal compression line for a soil at suction s
N(0) Intercept o f the normal compression line for the saturated soil
N M atrix o f shape functions
P Net mean stress
P a lm s Atmospheric pressure
Pi In itia l net mean stress
Pc Reference stress
Ps Parameter controlling suction effect on cohesion
Po Preconsolidation stress at a suction s
P'o Preconsolidation stress o f saturated soil
Po A ir entry value, defined in equation (7.6)
P Strain matrix
q Deviatoric stress
Q Heat flux per unit area
Q\ Plastic potential fo r LC yield surface, defined in equation (3.124)
Q2 Plastic potential fo r SI yield surface, defined in equation (3.125)
r Radial distance from centre o f deposition hole
r Parameter controlling the maximum stiffness o f the soil
Ra Residual error introduced due to approximation
Rda Specific gas constant for dry air
Rv Specific gas constant fo r water vapour
s Suction at a temperature T
Si In itia l suction
sm M atric suction
s0 Osmotic suction
sr Suction at reference temperature Tr
s, Total suction
s0 Critical value o f suction - suction hardening parameter
Sa Degree o f saturation o f pore air
Si Degree o f saturation o f pore water
t Time
T Temperature
Tr Reference temperatureA
T Approximate value o f temperature
T r Approximate traction, defined in equation (4.51)
( V f ) a/V T Ratio o f the microscopic temperature gradient in pore space to the macroscopic temperature gradient
T5 Temperature vector, defined in equation (4.13)
Ts Time differential o f temperature, as defined in equation (4.59)
TLabs Matrix o f absolute tolerances
TLrei M atrix o f relative tolerances
ua Pore-air pressure
uda Partial pressure o f dry air
u, Pore-water pressure
Partial pressure o f water vapour
Approximate value o f pore air pressure
Approximate value o f pore water pressure
Defined in equation (4.1)
Defined in equation (4.1)
Displacement vector
Pore air pressure vector, defined in equation (4.13)
Pore water pressure vector, defined in equation (4.13)
Displacement vector, defined in equation (4.13)
Approximate value o f displacement
Time differential o f pore air pressure, as defined in equation (4.59)
Time differential o f pore water pressure, as defined in equation (4.59)
Tim e differential o f displacement, as defined in equation (4.59)
Specific volume
Initia l specific volume
Specific volume due to suction changes
Mass flow factor
Volume o f solids
Velocity o f air
Velocity o f liquid
Velocity o f water vapour
Approximate velocity o f free air flux normal to the boundary surface
Approximate velocity o f dissolved air flux normal to the boundary surface
Approximate liqu id velocity normal to the boundary surface
Approximate pressure vapour velocity normal to the boundary surface
Approximate diffusive vapour velocity normal to the boundary surface
Water content
Global coordinates
Constant used in equation (7.2)
Parameter fo r non-associated flow rule
Coefficient o f thermal expansion
Parameter controlling the rate o f increase o f soil stiffness w ith suction
Material parameter defined in equations (7.5), (7.6), (8.7) and (8.8)
Parameter related to the degree o f saturation, defined in equation (2.1)
Plastic multipliers determined through plastic consistency conditions
Parameter used in equation (7.1)
Incremental volume
Total strain
Strain vector
Elastic component o f strain
Plastic component o f strain
Elastic deviatoric strain
Plastic deviatoric strain
Elastic component o f strain due to stress changes
Elastic component o f strain due to suction changes
Elastic component o f strain due to temperature changes
Volumetric strain
Total volumetric plastic strain
Volumetric plastic strain due to stress changes
Volumetric plastic strain due to suction changes
Defined in equation (4.62)
U nit weight o f liquid
Angle o f friction for saturated soils
Stiffness parameter for changes in net mean stress in the elastic region
Stiffness parameter for changes in suction in the elastic region
Coefficient o f thermal conductivity o f saturated soil
Stiffness parameter for changes in suction for virgin states o f the soil
Coefficient o f thermal conductivity o f unsaturated soil
Stiffness parameter for changes in net mean stress for virg in states o f saturated soil
Stiffness parameter fo r changes in net mean stress for virgin states o f the soil
Absolute viscosity o f air

Mi Absolute viscosity o f pore liquid
e Volumetric water content
ea Volumetric content o f air
e, Volumetric liquid content
Ores Residual water content, defined in equation (7.2)
@sat Saturated water content, defined in equation (7.2)
ev Volumetric vapour content
% Surface energy at temperature T
%r Surface temperature at reference temperature Tr
Po Density o f saturated soil water vapour
Pb Bulk density
Pd Dry density
Pda Density o f dry air
Pi Density o f liquid water
Ps Density o f solid particles
P v Density o f water vapour
a Total stress
cr' Effective stress
cr" Net stress
CT|, 0 2 , O3 Principal stresses
°x > ° z Normal stresses
^XZl zx Shear stresses
rv Tortuosity factor
V Poisson’s ratio
m Integration constant, defined in equation (4.61)
>P Capillary potential
r e Element boundary surface
3 Defined in equation (4.62)
V Gradient operator
Q Heat content o f moist soil
Q c Element domain
4- Variable vector
C Residual force, defined in equation (4.67)

Chapter 1 Introduction
Chapter 1
Introduction
Most radioactive waste is produced by the nuclear power industry. It is estimated that over
30 countries now operate between 400 and 500 nuclear power reactors worldwide.
Following the introduction o f the United Nations Framework Convention on Climate
Change (United Nations, 1992) and the adoption o f the Kyoto Protocol in 1997 many
countries have agreed to reduce their emissions o f greenhouse gases and to promote more
sustainable, renewable sources o f energy by 2012. The use o f fossil fuels to generate
energy has declined and nuclear power has become a more viable alternative. Nuclear
energy produces v irtua lly no greenhouse gases, but public concern over safety, transport
and disposal o f radioactive wastes means that the responsible employment o f nuclear
power w ill like ly remain limited. It now accounts for about 6.8 % o f global energy
supplies.
More recently, decommissioning o f nuclear sites has become a major issue in
governmental policy as facilities reach the end o f their useful lives. It is estimated that by
2010 there w ill be almost 250 nuclear power plants awaiting decommissioning (BNFL,
2004). This presents a number o f challenges to the nuclear power industry in terms o f safe
demolition, maintenance, and the generation o f additional radioactive waste.
In the nuclear power industry radioactive fuel undergoes a cycle o f extraction, preparation,
use and disposal. Throughout the course o f this cycle there are hazards that threaten health
and property and that, in some instances, present society w ith enormous social and ethical
questions. Handling the waste from the reactors is an important environmental issue and
the method in which it is handled depends largely on the local conditions and the type o f
waste. The fuel is considered spent when approximately 75 % o f the Uranium-235 has
been fissioned. Many o f the by-products o f this process are extremely toxic and their
storage and disposal present many d ifficu lt problems. Not only are these elements highly
radioactive, but they also continue to generate heat. Both the radioactivity and the heat
decline through the process o f radioactive decay but this process can take thousands o f
years fo r the elements to reach safe radiation levels. The current systems in place for the
1-1
Chapter 1 Introduction
storage o f radioactive waste are land-based and comprise o f deep geological storage,
storage at moderate depths and storage at the surface.
Radioactive waste is classified under four levels depending on the intensity o f the
radioactivity and the duration o f the half-life. Very Low-Level Waste (V LLW ) covers
wastes w ith very low concentrations o f radioactivity. It arises from a variety o f sources,
including hospitals and industry in general. Because V L L W contains little total
radioactivity, it can be disposed o f safely w ith domestic refuse either directly at landfill
sites or indirectly after incineration. Low-Level Waste (LLW ) includes metals, soils,
building rubble and organic materials, which arise principally as lightly, contaminated
miscellaneous scrap. Metals are mostly in the form o f redundant equipment. Organic
materials are mainly in the form o f paper towels, clothing and laboratory equipment that
have been used in areas where radioactive materials are used, such as hospitals, research
establishments and industry. Intermediate-Level Waste (ILW ) is waste w ith radioactivity
levels exceeding the upper boundaries for LLW . ILW arises mainly from the reprocessing
o f spent fuel, and from general operations and maintenance o f radioactive plant. The
major components o f IL W are metals and organic materials, w ith smaller quantities o f
cement, graphite, glass and ceramics. This waste is often stored in repositories on the
ground surface or in blasted chambers at a moderate depth under ground. In many
countries this waste is processed to reduce the volume and activity (by means o f
combustion) or it can be transformed into more chemically durable, environmentally safer
products through a process o f vitrification. High-Level Waste (H LW ) is the fourth and
final level and comes prim arily from the nuclear power industry. It is extremely hazardous
and is characterised by an extremely long ha lf-life and high activity level. Currently, no
country has a complete system in place for the permanent disposal o f spent nuclear fuel
and so the high-level waste is placed in intermediate storage in either water-cooled or air-
cooled storage systems.
In the U K the amount o f radioactive waste is very small compared w ith the total industrial
and domestic waste produced each year and accounts for approximately 0.02 % o f the total
waste (BNFL, 2004). Each year the U K produces around 40 m illion cubic metres o f
industrial waste compared to 16,000 cubic metres o f nuclear waste. Figures published by
DEFRA/NIREX in 2001 showed that there were 1,960 m3 o f high-level waste, 75,400 m3
1-2
Chapter 1 Introduction
o f intermediate-level waste and 14,700 m3 o f low-level waste held in the U K (NIREX,
2004).
Given the dangers o f accidental radioactive release into the environment, long-term
disposal must meet acceptable criteria o f safety. Since the lifetimes o f fission products are
extraordinarily long, safe disposal presents unprecedented technological and societal
problems. Technologically, the method o f disposal must ensure a high degree o f isolation
for many thousands o f years, thus requiring containment materials and disposal facilities
that are known to be stable fo r periods o f this magnitude. Furthermore, the technology
requires a great deal o f research and development and needs to be cost effective to
facilitate the disposal.
There is a broad international consensus regarding the principles for long-term disposal o f
spent nuclear waste, and in the majority o f countries, these systems are under development.
The methods are based on systems with several barriers located in isolation at great depths
in geological formations. This means that the placement o f wastes in rock or sedimentary
formations needs to remain intact and free from any seismic or anthropogenic interference
for many thousands o f years. Such formations exist both on land and beneath the oceans,
although identifying them does present further problems. However, attempts to develop an
acceptable disposal technique have proven d ifficu lt. The continued generation o f decay
heat may cause unstable molten conditions in some o f the disposal media, and there have
been concerns that these conditions might lead to rock fractures that in turn could permit
migration o f radioactive nuclides into groundwater. Therefore, several countries have
undertaken extensive research programmes into the feasibility o f the deep geological
disposal concept.
The structure and design o f the disposal schemes depend on the geological conditions on
site, but also on the different requirements and laws that exist in the various countries.
In Belgium, the National Radioactive Waste Agency (ONDRAF-NIRAS) is responsible for
the final disposal o f radioactive waste. They are interested in deep clay layers, and much
o f the recent research has focussed on the boom clay formation underlying the Mol
research centre.
AEC L (Atom ic Energy o f Canada Limited) is responsible fo r research and development on
a final repository for high-level waste in Canada. Final disposal is planned to take place in
1-3

Chapter 1 Introduction
granitic rock approximately 500 metres beneath the surface. The fuel w ill be encapsulated
in copper canisters and surrounded by bentonite clay.
Finland selected a site fo r its deep geological repository near the nuclear power plant in
O lkiluoto in 2000. W ork at the final repository is expected to start in 2020.
In Germany they are studying how salt formations can be used to store spent nuclear fuel.
BfS, Bundesamt fur Strahlenschutz (the Federal Office fo r Radiation Protection), has been
given responsibility by the federal government for final disposal o f radioactive waste.
Final disposal is planned to take place in salt formations in Gorleben. However, doubts
have been expressed about using the salt dome for final disposal and an expert group,
AkEnd, has been appointed to arrive at selection criteria for finding suitable sites for a
future repository. The goal is that all radioactive waste w ill be disposed o f at one site.
SKB (Svensk Kambranslehantering AB) the Swedish Nuclear Fuel and Waste
Management Company is responsible for the handling, transport, storage and disposal o f
all nuclear waste produced by the Swedish nuclear power stations. The proposed disposal
concept shares many characteristics w ith that adopted by AEC L and site investigation
work is currently underway to select a suitable repository site.
In Switzerland, research conducted by NAG RA has focused on both crystalline bedrock
and opalinus clay and currently two sites at Northern Aargau and Zurcher Weinland are
being considered.
In the UK, they reprocess both some o f their own spent nuclear fuel and some from other
countries. This reduces the waste quantities but generates radioactive liqu id residues that
are cast in glass, encapsulated and placed in intermediate storage until such time as they
can be deposited in a geological formation. Planning application for a rock
characterisation fac ility at Sellafield was rejected in 1997 and N IREX is now developing
the site specific Sellafield design into a series o f generic repository designs for use at other
potential sites in the UK.
In the USA they are studying a volcanic type o f rock in Nevada, known as tu ff and it is
envisaged that the first geological repository for high-level waste w ill be in operation by
2010. The current plans are to locate this facility below the Yucca Mountain in an
unsaturated zone.
1-4
Chapter 1 Introduction
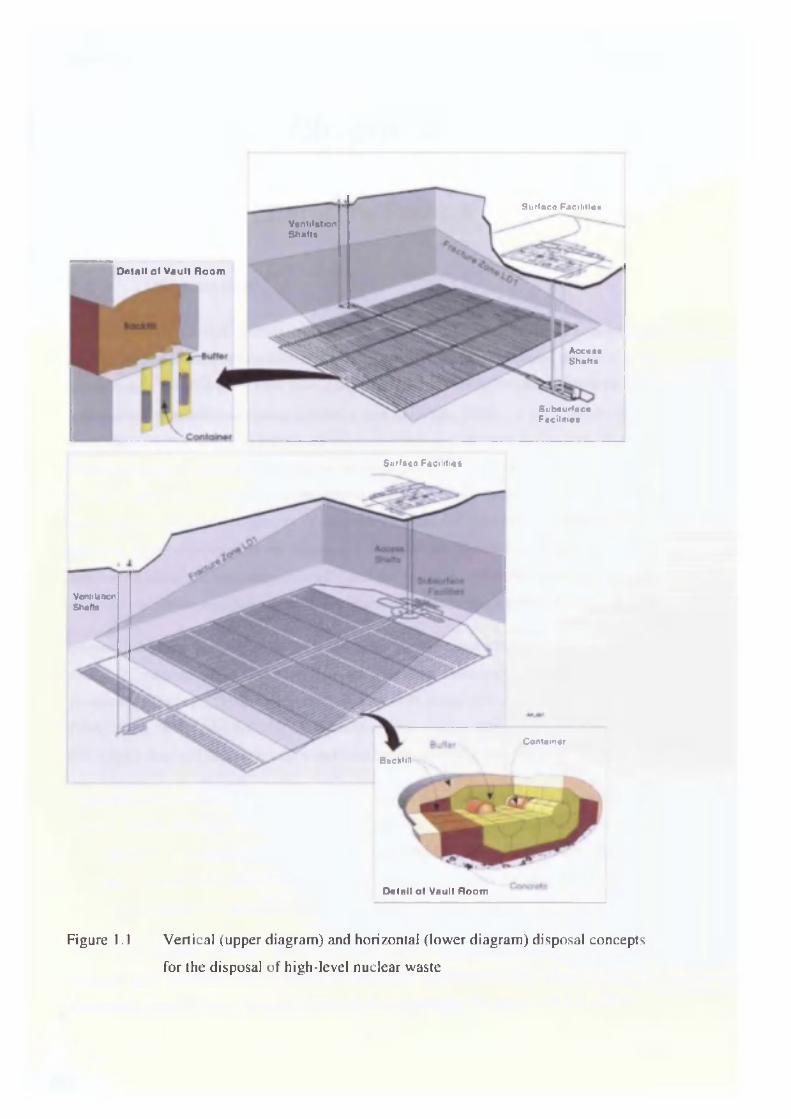
The majority o f the disposal schemes under development are designed around a m ulti
barrier concept (see Figure 1.1). This concept contains some or all o f the follow ing
components - the radioactive waste itself, the waste container, an engineered buffer
material, the natural barrier and the tunnel backfill and seals. Each component o f this
system provides certain functions and when coupled together it is envisaged that the m ulti
barrier concept w ill provide an effective means for the long-term disposal o f high-level
nuclear waste. A great deal o f research and experimental work has been conducted to
investigate this disposal concept and in particular the use o f unsaturated clays to form the
buffer barrier has become the primary focus in a number o f research programmes
(Chapman and M cKinley, 1987). The use o f swelling clays such as bentonite from the
montmorillonite fam ily have been given a great deal o f attention due to its advantageous
properties, these were defined by Felix et al. (1996) as - a high swelling potential and
relatively low dry densities, naturally sealing any fractures that may develop in the
bentonite as it dries under high temperatures; a high sorption capacity, to prevent
radionuclide and chemical transfer into the groundwater; and, a low permeability to liquid
and gas, thus isolating the waste canister from corrosive elements in the groundwater.
The experimental work performed to date has varied from small scale laboratory tests
focussing on specific phenomena to large scale in-situ experiments intended to investigate
coupled thermo/hydro/mechanical behaviour o f the multi-barrier materials on a fu ll scale
under realistic conditions. These experiments not only highlight the feasibility o f the
proposed concepts fo r disposal but also provide a great deal o f quality information to
improve knowledge and understanding and to develop and validate computer models to
predict the long-term transient behaviour o f the systems.
A number o f large scale in-situ experiments are currently being conducted worldwide and
in particular this thesis focuses on the numerical modelling o f principally, SKB’s Prototype
Repository Experiment and secondly, AEC L’ s Tunnel Sealing Experiment.
The Prototype Repository Experiment is currently being performed at the Aspo Hard Rock
Laboratory in Sweden. The project is an international, EC-supported activity co-ordinated
by SKB w ith additional partners from Sweden, Finland, Spain, Germany, U K and Japan.
Its principal aim is to investigate, on a full-scale, the integrated performance o f engineered
barriers and near-field rock o f a deep repository in crystalline rock w ith respect to heat
1-5

Chapter 1 Introduction
evolution, mechanics, water permeation, water chemistry, gas evolution and microbial
processes under natural and realistic conditions (Svemar and Pusch, 2000).
In the Tunnel Sealing Experiment two different types o f bulkheads are subjected to both
hydraulic and thermal gradients. One o f the bulkheads is fabricated using a high
performance concrete and the other is made from highly compacted bentonite. As both
these experiments involve complex coupling processes there is a requirement for a highly
sophisticated numerical code to simulate the potential thermo/hydro/mechanical behaviour
o f the materials in a large scale three-dimensional model.
The foundation o f this research work is based on the fu lly coupled heat, moisture, air and
deformation model developed by Thomas and Sansom (1995), Thomas and He (1994,
1995, 1998) and Thomas and Cleall (1999). This work has been incorporated into a finite
element modelling code called COMPASS (COde fo r M odelling PArtia lly Saturated
Soils), a mechanistic model where the various aspects o f soil behaviour are included in an
additive manner. In this way the approach adopted describes heat transfer, moisture
migration, solute transport and air transfer coupled w ith stress/strain behaviour in the
material.
The conservation o f energy equation governs the flow o f heat. In COMPASS this
approach includes flow o f heat due to conduction, convection and the latent heat o f
vaporisation.
The conservation o f mass equation governs the flow o f moisture which is considered a
combination o f liquid and vapour transfer. Liquid and vapour flows caused by pressure
gradients are governed by Darcy’ s Law and vapour transfer due to diffusion is represented
by a modified Philip and de Vries approach (Philip and de Vries, 1957; Ewen and Thomas,
1989).
The movement o f dry air w ithin the soil is also governed by the conservation o f mass
equation. In the approach the movement o f dry air includes both the bulk flow o f free air,
which is represented by Darcy’ s Law, and the movement o f dissolved air in the pore liquid,
which is represented by Henry’s Law.
1-6
Chapter 1 Introduction
The stress/strain approach adopted in the model for the behaviour o f soils under load is
governed by an elasto-plastic constitutive relationship based on the state surface approach
and is controlled by the stress equilibrium equation.
Approximation techniques and numerical methods are required to attain accurate solutions
to the above complex coupled theoretical model. A numerical solution o f the formulation
is achieved by the implementation o f fin ite element techniques for spatial discretisation
and fin ite difference techniques fo r temporal discretisation.
To ensure the model provides accurate, realistic predictions fo r a number o f different
materials under varying conditions comprehensive verification and validation exercises
have been performed in previous work. The numerical model has then been applied to the
two large scale in-situ tests described above. In the Prototype Repository Experiment
comparisons between experimental and numerical results are presented and discussed. For
the Tunnel Sealing Experiment the numerical analysis was conducted as part o f a
programme o f predictions requested by AEC L w ith only lim ited experimental data
available, and therefore only preliminary comparisons are made.
In order to undertake these large scale analyses the modelling infrastructure o f the
numerical model COMPASS has been developed, via the use o f data visualisation
techniques, parallel computing and iterative solution techniques. In addition to this the
COMPASS code has been successfully interfaced w ith both a pre and post-processing
software package capable o f generating large three-dimensional fin ite element models and
a fu lly interactive three-dimensional visualisation facility, based in C ard iff University.
1.1 Study objectives
The primary objectives o f this research may be summarised as follows:
1. To review the past and current status o f experimental programmes and numerical
studies in relation to the investigation o f the multiple-barrier concepts for the
disposal o f high-level nuclear waste in deep geological repositories.
2. To effectively combine and integrate the numerical code COMPASS w ith a suitable
pre and post-processing piece o f software to generate large scale three-dimensional
models and fin ite element meshes.
1-7
Chapter 1 Introduction
3. To interface COMPASS w ith the highly sophisticated three-dimensional
visualisation suite recently installed at the Geoenvironmental Research Centre. This
is to be used to visualise and interpret results from the large scale numerical analyses
investigated in this study.
4. To increase the performance and efficiency o f COMPASS to tackle large scale three-
dimensional problems via the application o f high performance computing techniques
and implementation o f parallel computing methods.
5. To investigate the three-dimensional thermo/hydro/mechanical behaviour o f the
buffer, backfill and host rock in the Prototype Repository Experiment and to compare
the simulated results to the experimentally measured results.
6. To investigate the fu lly coupled thermo/hydro/mechanical behaviour o f the highly
compacted bentonite bulkhead and host rock in the Tunnel Sealing Experiment and
make prelim inary comparisons with experimental data.
1.2 Research background
This section summaries research work that has been conducted previously at the
Geoenvironmental Research Centre at C ard iff University in relation to the scope o f this
study. A thorough literature review is presented in Chapter 2.
Thomas (1985) presented a two-dimensional numerical solution o f a theoretical model
representing heat and mass transfer in unsaturated soil. Vapour flow was modelled by
incorporating the de Vries approach (de Vries, 1958) and the latent heat o f vaporisation
was represented using Luikov (1966). The model was further developed (Thomas, 1987;
Thomas, 1988a; Thomas 1988b) to include non-linearity o f material parameters and
revised time stepping schemes were investigated (Thomas and Rees, 1988; Thomas and
Rees, 1990).
Experimental work on heat and moisture redistribution in unsaturated medium sand
surrounding a heated rod was conducted by Ewen and Thomas (1987). A range o f tests
involving different combinations o f in itia l moisture contents and heat output levels were
carried out. The observed behaviour from this work was later simulated via a numerical
model based on the variables o f moisture content and temperature (Ewen and Thomas,
1-8
Chapter 1 Introduction
1989). The theoretical formulation was based upon the Philip and de Vries approach
(Philip and de Vries, 1957) but w ith amendments to the vapour transfer diffusivities.
Thomas and K ing (1991) presented a coupled theory o f heat and moisture transfer based on
capillary potential and temperature. The governing equations were solved using the finite
element method and it was found that there was good agreement between the numerical
results and the experimental results from Ewen and Thomas (1987).
The approach presented by Thomas and K ing (1991) was further updated to include the
effects o f elevated pore air pressure (Thomas and Sansom, 1995). This model was
validated against a series o f laboratory controlled heating tests on medium sand (Ewen and
Thomas, 1989; King, 1991; Thomas and Li, 1991) and a good correlation between the
experimental and numerical results was obtained. An extension o f the above formulation
to incorporate three-dimensional simulation and visualisation was presented by Thomas et
al. (1998b).
Thomas and Rees (1990, 1993) addressed the coupling o f the flow models w ith models for
deformation behaviour through the application o f a numerical model to simulate
experimentally measured seasonal ground movements. This was then followed by a
coupled moisture transfer and deformation model to simulate isothermal consolidation in
unsaturated soil (Thomas et al., 1992). The deformation behaviour o f the soil was
represented by the non-linear elastic state surface approach presented by Lloret and Alonso
(1985). This model was later applied in the simulation o f seasonal ground movements
presented by Thomas and Zhou (1995).
As part o f the assessment o f the performance o f high-level nuclear waste disposal schemes
Thomas and He (1994) incorporated an elasto-plastic constitutive relationship (Alonso et
al., 1990) into the coupled thermo/hydro/mechanical model to describe the behaviour o f
deformable unsaturated soils. The model has more recently been developed to incorporate
highly expansive soil behaviour (Thomas and Cleall, 1999). Non-reactive chemical solute
and contaminant transport capabilities were also included (Thomas and Cleall, 1997).
Sloper (1997) presented a new three-dimensional numerical model to describe fu lly
coupled heat, moisture and air transfer through unsaturated soil. The development and
verification o f the new fin ite element formulation was also presented. Particular attention
was also given to the pre and post-processor visualisation o f the three-dimensional
1-9
Chapter 1 Introduction
numerical results. A small test problem was used to illustrate three-dimensional coupled
flow processes and highlighted the requirement for scientific visualisation. Parallel
computing techniques were also investigated and allowed more computationally
demanding problems to be addressed.
M itchell (2002) presented a fu lly coupled thermo/hydro/mechanical model to investigate
the behaviour o f two large scale in-situ experiments, namely the Isothermal Experiment
and the Buffer/Container Experiment. In particular, the saturation and swelling behaviour
o f bentonite buffers were investigated. Thomas et al. (2003a) later presented some o f the
research conducted into the Isothermal Experiment where the re-saturation behaviour o f
the buffer was investigated. To correctly capture the rates o f resaturation o f the bentonite
buffer material the micro/macro behaviour was investigated. A new hydraulic conductivity
relationship was incorporated into the numerical formulation. This yielded significant
improvements in the analysis results. This area o f research has formed the foundation to
the work presented in this study.
Hashm (1999) developed a two-dimensional model for coupled moisture and reactive multi
chemical solute transport in unsaturated soils. This work was further developed and
Seetharam (2003) presented a coupled thermo/hydro/chemical/mechanical model whereby
any number o f chemical components could be accommodated. However, these research
areas are beyond the scope o f the work presented in this thesis.
1.3 Scope and limitations
The scope and limitations o f the above mentioned theoretical and numerical formulations
are described below.
I. Soils are recognised as exhibiting a degree o f heterogeneity. However, due to a lack
o f experimental data, in the present model the unsaturated soil is assumed to be
isotropic and homogeneous. This lim itation only applies to an individual element in
the numerical formulation and therefore problems containing different soil types may
be used w ithin an analysis.
1-10
Chapter 1 Introduction
2. Hysteresis effects have been observed in the moisture retention relationship between
the degree o f saturation and the suction. However, in this formulation the effects o f
hysteresis are not included.
3. The temperature range that can be modelled is between 0 °C and 100 °C, and the
phenomena o f freezing and boiling are excluded from the formulation. It should be
noted that although some high-level nuclear waste disposal concepts are designed on
maximum temperatures in excess o f 100 °C, the large scale in-situ experiments
investigated in this work are designed to ensure that the temperature remains below
that o f boiling.
4. The constitutive model representing the stress/strain behaviour is valid fo r slightly
and moderately swelling soils. Both cyclic and monotonic loading paths may be
accommodated in this relationship.
5. Due to the h ighly coupled and non-linear nature o f the governing equations an
approximate solution o f the proposed model is achieved via the implementation o f
numerical methods. In particular, the fin ite element method is used to achieve spatial
discretisation and the fin ite difference method is used to achieve temporal
discretisation.
1.4 Thesis overview
This thesis consists o f eight further chapters and a summary o f the contents o f each chapter
is presented below.
Chapter 2 presents a focussed review o f recent developments in the theoretical modelling
o f coupled heat, moisture, air and deformation behaviour in an unsaturated soil.
Furthermore, a review o f small scale laboratory experiments and large scale in-situ
experiments associated w ith high-level nuclear waste repository development and design is
presented. The numerical modelling work conducted as part o f this work is also detailed.
Finally, a b rie f summary is presented on the solution methods and high performance
computing techniques that are available for analysing large fin ite element problems.
Chapter 3 presents the theoretical formulation o f the governing differential equations for
the thermal, hydraulic and mechanical behaviour o f unsaturated soils. The governing
1-11
Chapter 1 Introduction
equations are expressed in terms o f four primary variables; pore water pressure (u/), pore
air pressure (ua), temperature (7) and displacement (u), and the associated derivations and
assumptions are described.
Chapter 4 presents the numerical formulation for the solution o f the governing differential
equations presented in Chapter 3. A fin ite element method is implemented to spatially
discretise the equations, and a backwards difference mid-interval time-stepping algorithm
is used to achieve temporal discretisation. Also presented is a description o f the software,
solution methods and three-dimensional visualisation facilities used in this investigation.
Chapter 5 presents a detailed review o f SKB’s Prototype Repository Project. The chapter
firs tly concentrates on the development and current role o f SKB as the Swedish agency in
charge o f the handling, transport, storage and disposal o f the nuclear waste. The Aspo
Hard Rock Laboratory is examined in detail and its main objectives and current
experimental programmes are highlighted. The chapter then presents the Prototype
Repository Project and discusses the experimental set-up, the characterisation o f the rock
mass and the instrumentation installed in the experiment.
Chapter 6 presents the preliminary experimental results from the Prototype Repository
Experiment. A t the time o f writing the experiment is s till in its early stages and therefore
only the results from the first 710 days are discussed. The key results from Section I and II
o f the experiment are presented and cover temperature, relative hum idity and total stress
measurements in the buffer, backfill and host rock.
Chapter 7 presents the fu lly coupled thermo/hydro/mechanical model that has been used to
simulate SKB’ s Prototype Repository Experiment. Firstly, the material parameters are
defined for the relevant material types. A detailed description o f the fin ite element meshes
adopted fo r this analysis is then presented. The results from the numerical investigations
are then presented and compared against corresponding experimental results. The findings
from the simulation work are then discussed, w ith the key conclusions presented.
Chapter 8 presents the coupled thermo/hydro/mechanical model that has been used to
simulate AEC L’s Tunnel Sealing Experiment. The material parameters are defined for the
relevant material types and this is followed by a description o f the fin ite element meshes
adopted for the analyses. The results from the predictions are then presented and discussed
1-12

Chapter 1 Introduction
in detail and preliminary comparisons are made w ith the experimental behaviour. The
main conclusions from this numerical study are then presented.
Finally, in Chapter 9 the overall conclusions from this work are presented and discussed.
Suggestions fo r future research into this area are highlighted.
1-13
S u r fa c e F a c ih l lo i
VentilationS tia lu
D e ta il o l V a u lt R oom
A c c e i*S h a lt *
S u b e u rta ceF a c ilw e a
S u rfa ce F a c ilit ie s
V e n ti la to rS ta lls
Container
B a c k f i ll
D eta il o l Vau lt Room
Figure 1.1 Vertical (upper diagram) and horizontal (lower diagram) disposal concepts
for the disposal o f high-level nuclear waste
Chapter 2 Literature Review
Chapter 2
Literature Review
2.1 Introduction
The study o f flow and deformation behaviour o f partially saturated soils has been o f great
interest to engineers and researchers fo r many years. Since unsaturated soil is a three-
phase system consisting o f solid particles, liquid and gas its behaviour is more complex
than that o f saturated soil phases (Fredlund and Rahardjo, 1993). It is the interaction o f
these phases that govern this behaviour and have dominated research in this area. In recent
years the study o f unsaturated soils has gathered further momentum and global attention
due to its proposed application in the current concepts for the long-term disposal o f high-
level radioactive waste. A variety o f research programmes have been performed and are
currently being conducted to investigate the thermo/hydro/mechanical behaviour o f these
engineered materials both experimentally and theoretically. Therefore, the intent o f this
chapter is to present a review o f the recent literature covering these subjects.
Section 2.2 presents a review o f coupled heat, moisture and air transfer in unsaturated
soils. A number o f excellent reviews on this flow behaviour have been presented
previously (Thomas, 1980; Ewen, 1987; Rees, 1990; King, 1991; Sansom, 1995; Cleall,
1998; Wang, 2000; M itchell, 2002). Therefore, this section offers a concise summary o f
this subject area and focuses on the significant developments in coupled flow behaviour.
In Section 2.3 a review o f the deformation behaviour o f unsaturated soil is presented. This
subject matter has again been reviewed in detail by Cleall (1998), Wang (2000) and
M itchell (2002) and hence this section concentrates principally on both elastic constitutive
relationships and elasto-plastic constitutive relationships. Further attention is also given to
recent developments in constitutive modelling.
Section 2.4 presents a review o f the theoretical and numerical formulations for coupled
transient heat, moisture and deformation processes in unsaturated soils. Coupled flow and
deformation models have been given a great deal o f attention in recent years and therefore
2-1
Chapter 2 Literature Review
the intention o f this section is to summarise the earlier work and to augment it w ith a
review o f more current developments.
Section 2.5 presents a detailed investigation o f laboratory experiments based on the
concept for the disposal o f high-level nuclear waste. In this section both recent small scale
laboratory bench top experiments and large scale mock-up experiments are discussed.
In Section 2.6 a review o f large scale in-situ experiments associated w ith high-level
nuclear waste repository development and design is presented. This section describes both
the experiments carried out as part o f a benchmarking exercise and also other large scale
in-situ experiments designed to increase knowledge about the complex
thermo/hydro/mechanical processes occurring at a realistic scale. The numerical
modelling work conducted as part o f this work is also detailed.
In Section 2.7 a review o f the available solution methods for performing fin ite element
analyses is presented. This section highlights the development o f these methods and the
available preconditioning to improve the efficiency o f the analyses. Owen (2000) has
comprehensively reviewed this work and hence only a short summary is presented here.
Section 2.8 presents a review o f the advances in high performance computing and the
development o f techniques such as parallel computing, which have enabled large scale
three dimensional analyses to be performed in this work. Again, a lu ll review o f this work
can be found in Owen (2000).
Finally the overall conclusions o f this literature review are given in Section 2.9.
2-2
Chapter 2 Literature Review
2.2 Coupled heat, moisture and air flow in unsaturated soil
This section presents a chronological review o f the development o f theoretical and
numerical formulations representing fu lly coupled heat, moisture and air flow in
unsaturated soil. A number o f extensive reviews on this work have been presented in
previous studies (Thomas, 1980; Ewen, 1987; Rees, 1990; King, 1991; Sansom, 1995;
Cleall, 1998; Wang, 2000; M itchell, 2002) and therefore the fo llow ing section presents a
summary o f the key developments in this area for the sake o f completeness and relevance.
A one-dimensional mathematical model using three partial differential equations to
describe heat, moisture and air flow was developed by Dakshanamurthy and Fredlund
(1981). As a simplification the model did not consider the coupling between heat and
moisture transfer and it was assumed that flu id permeability was constant. The model was
implemented to solve four example problems involving flow in unsaturated soils under
hydraulic and temperature gradients. It was found that the model performed reasonably
well in capturing the observed behaviour. This work was followed by Couvillion and
Hartley (1986) who presented a model to investigate the movement o f thermally induced
drying fronts in an unsaturated sandy soil. A similar approach was adopted in the
formulation, however the liquid component o f moisture flow used the Philip and de Vries
(1957) approach to relate moisture flux to temperature and moisture content gradients. An
explicit fin ite difference technique was applied to solve the governing equations but
resulted in numerical difficulties. Therefore, the heat transfer equation was simplified and
the air phase was removed in order to provide a solution.
In the same year Geraminegrad and Saxena (1986a) presented a coupled thermo-elastic
model for heat, moisture and air flow in partially saturated media. Again the Philip and de
Vries (1957) model was employed for heat and moisture flow. The transfer o f air
dissolved w ithin the pore liquid was considered in the gas continuity equation, and volume
changes in the soil due to pore pressure changes were also included. A fin ite element
formulation was proposed but again the solution encountered numerical difficulties. To
alleviate the problem the researchers removed the air phase and applied the revised model
to a series o f examples obtained from the literature.
Pollock (1986) developed three coupled non-linear partial differential equations based on
the Whitaker approach (Whitaker, 1977). A numerical solution was achieved in terms o f
2-3

Chapter 2 Literature Review
temperature, degree o f liquid saturation and total gas pressure by a fin ite difference
technique with Newton-Raphson linearisation. The model was used to simulate a one
dimensional transport process in a large scale hypothetical nuclear waste repository over a
period o f one thousand years.
Connell and Bell (1993) developed a numerical model to predict the climatic influences on
liquid and vapour transport processes in waste dumps. In contrast to the established
approach, thermodynamic equilibrium between liquid and vapour phases was not assumed
in this formulation. L iquid flow was described by Richards’ equation (Richards, 1931),
which neglects the influence o f thermal and air pressure effects on liquid flow. Vapour
flow was assumed to comprise o f viscous vapour flux and diffusive vapour flux. Darcy’ s
Law defined the former while the latter was described using the dusty gas model
(Thorstenson and Pollock, 1989). The governing equations were solved using a moving
node fin ite element method. A numerical simulation o f isothermal infiltration in Yolo light
clay was presented and it was found that the results showed good agreement w ith those
obtained by alternative models.
Thomas and Sansom (1995) developed a theoretical formulation to represent coupled heat,
moisture and air transfer in unsaturated soil. In the formulation the liquid phase was
considered to be water containing dissolved air, and the air phase was considered to be a
binary mixture o f dry air and water vapour. Three fu lly coupled governing differential
equations were developed. Liquid flow was represented by Darcy’s Law, whilst the flow
o f water vapour was represented by implementing the modified Philip and de Vries (1957)
approach, after Ewen and Thomas (1989). In addition, the effects o f vapour flow due to
bulk flow o f air were included. The governing equation for dry air flow included the bulk
flow o f dry air and the flow o f air dissolved in the liquid. Thermal effects on the dry air
flow were also incorporated into the formulation. The governing equation for heat flow
covered heat transfer by conduction, convection and latent heat o f vaporisation. The three
coupled equations were solved spatially using the fin ite element method, and temporally
by a fin ite difference time-stepping scheme. The model was used to simulate coupled heat,
moisture and air transfer in a highly compacted unsaturated sand. The results showed a
good correlation with results derived from an independent model presented by Pollock
(1986).
2-4
Chapter 2 Literature Review
Experimental and numerical investigations on the movement o f moisture in highly
compacted bentonite under temperature gradients were presented by Kanno et al. (1996).
Based on the assumption that the vapour flow area increased linearly as volumetric air
content increased, it was observed that there was a good correlation between the numerical
and experimental results.
Thomas and Ferguson (1999) proposed a fu lly coupled heat and mass transfer theoretical
model to describe the migration o f gas through a clay liner in a municipal landfill site.
Darcy’ s Law and Fick’s Law represented liquid and energy flows respectively. The
migration o f liquid, heat, air and contaminant gas were considered independently with
system variables o f capillary potentials, temperature, pore air pressure and molar
concentration o f the contaminant gas. Good correlation was observed between the
numerical results and the analytical solution and the research showed the importance o f the
effect o f temperature on the transport o f contaminated gas.
2.2.1 C o n clu sio n s
In this section developments in the theoretical and numerical formulations for coupled
heat, moisture and air flow in unsaturated soil over the last three decades have been
presented. These models use governing differential equations to describe the heat,
moisture and air flow based on established flow laws. In more recent years these
thermo/hydraulic formulations have become fu lly coupled w ith deformation models and
the focus o f the research has been in developing thermo/hydro/mechanical formulations to
represent behaviour in both two and three-dimensional problems. These developments w ill
be addressed in the fo llow ing sections.
2.3 Deform a tion beha viour in unsa tura ted soil
This section reviews the development o f theories to describe the deformation behaviour o f
unsaturated soils and the representation o f this behaviour w ith constitutive models. There
are a range o f extensive reviews available on this subject (Alonso et al., 1987; Fredlund
and Rahardjo, 1993; Delage and Graham, 1996; Wheeler and Karube, 1996; Sultan et al.,
2002) and therefore this section is divided into two parts. Section 2.3.1 provides a
2-5
Chapter 2 Literature Review
focussed summary o f the development o f elastic constitutive relationships and Section
2.3.2 presents a review o f elasto-plastic constitutive relationships.
2.3.1 E lastic constitu tive relationships
The development o f constitutive relationships for unsaturated soils led from the effective
stress theories adopted for saturated soils. Biot (1941) investigated three-dimensional
consolidation o f an elastic linear isotropic soil. An effective stress state variable was used
to describe the deformation behaviour. This was defined as the difference in total stress
and pore air pressure (a - ua) and pore water pressure, «/.
Bishop (1959) presented one o f the first theoretical models to explain the deformation
behaviour o f unsaturated soil based on the effective stress concept as;
cr' = ( a - u a) + x {u a — « ,) (2 .1)
where, x is a parameter related to the degree o f saturation and varies between zero for a dry
soil and one for a saturated soil. This equation extended Terzaghi’s classical concept that
“ all measurable effects o f a change in stress...are exclusively due to changes in the
effective stress” (Terzaghi, 1936).
In response to this approach the effective stress concept was investigated by a number o f
researchers (Jennings and Burland, 1962; Bishop and Blight, 1963; Aitchison, 1965;
Burland, 1965). It was concluded that the proposed effective stress law, while appearing to
explain shear strength behaviour, could not provide an adequate relationship between
volume change and effective stress for most soils. Coleman (1962) and Bishop and Blight
(1963) suggested the use o f two stress state variables instead. These variables were net
stress (cr - ua) and matric suction (ua - u[).
Following a series o f oedometer and triaxial tests, Matyas and Radhakrishna (1968)
proposed the use o f state variables and state surfaces to relate changes in the degree o f
saturation, S/ and the void ratio, e to the two independent stress parameters, (a - ua) and
( ua - u[). It was discovered that the state surfaces were unique for monotonic loading
sequences and increases in the degree o f saturation. These findings were later reinforced
by Barden et al. (1969).
2-6
Chapter 2 Literature Review
Fredlund and Morgenstem (1977) conducted a series o f null tests and established that the
stress state variables, (c - ua) and (ua - «/), adequately described a stress system for
unsaturated soil. A third stress state variable, {a - ui) could also be defined and it was
proposed that any two o f the stress state variables could be used to form a suitable stress
system for unsaturated soil.
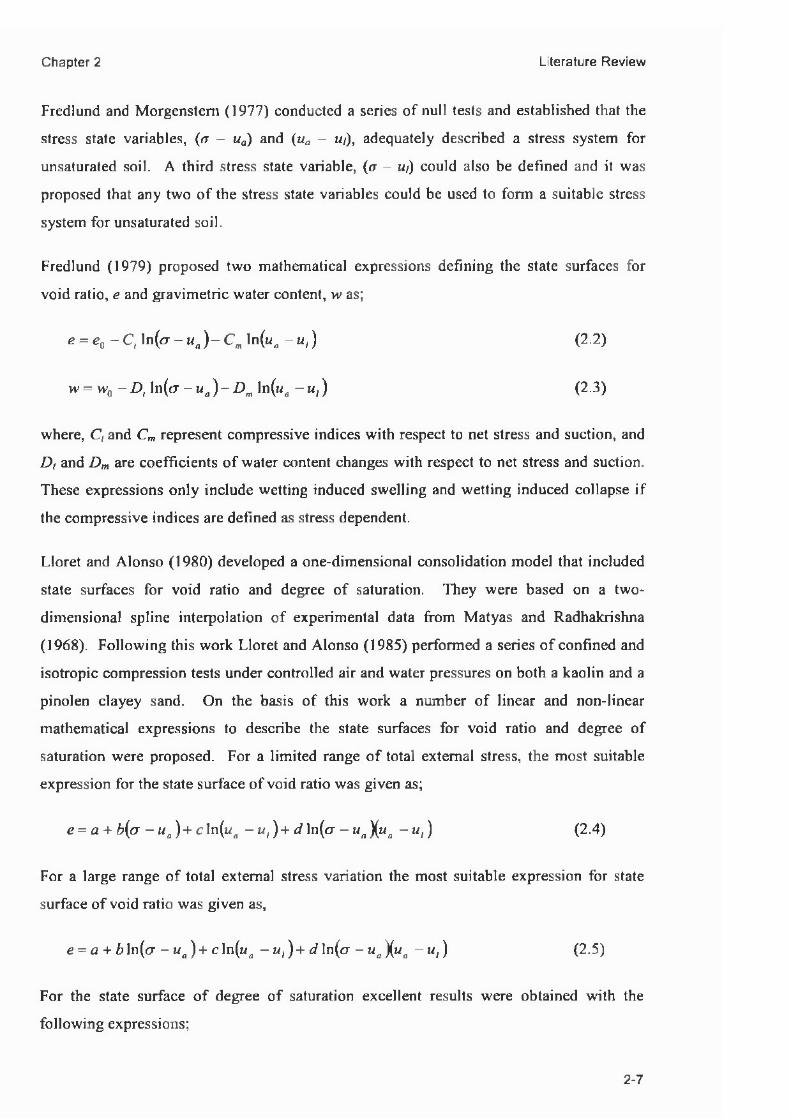
Fredlund (1979) proposed two mathematical expressions defining the state surfaces for
void ratio, e and gravimetric water content, w as;
where, C, and Cm represent compressive indices with respect to net stress and suction, and
D, and Dm are coefficients o f water content changes w ith respect to net stress and suction.
These expressions only include wetting induced swelling and wetting induced collapse i f
the compressive indices are defined as stress dependent.
Lloret and Alonso (1980) developed a one-dimensional consolidation model that included
state surfaces fo r void ratio and degree o f saturation. They were based on a two-
dimensional spline interpolation o f experimental data from Matyas and Radhakrishna
(1968). Following this work Lloret and Alonso (1985) performed a series o f confined and
isotropic compression tests under controlled air and water pressures on both a kaolin and a
pinolen clayey sand. On the basis o f this work a number o f linear and non-linear
mathematical expressions to describe the state surfaces fo r void ratio and degree o f
saturation were proposed. For a lim ited range o f total external stress, the most suitable
expression for the state surface o f void ratio was given as;
e = a + b(u - ua) + cln(wfl - u , ) + d \ n ( a - u a\ u a - u , ) (2.4)
For a large range o f total external stress variation the most suitable expression for state
surface o f void ratio was given as,
e = a + b ln(cr - u n) + c ln(«n - u, ) + d ln(rr - ua \ u a - u,) (2.5)
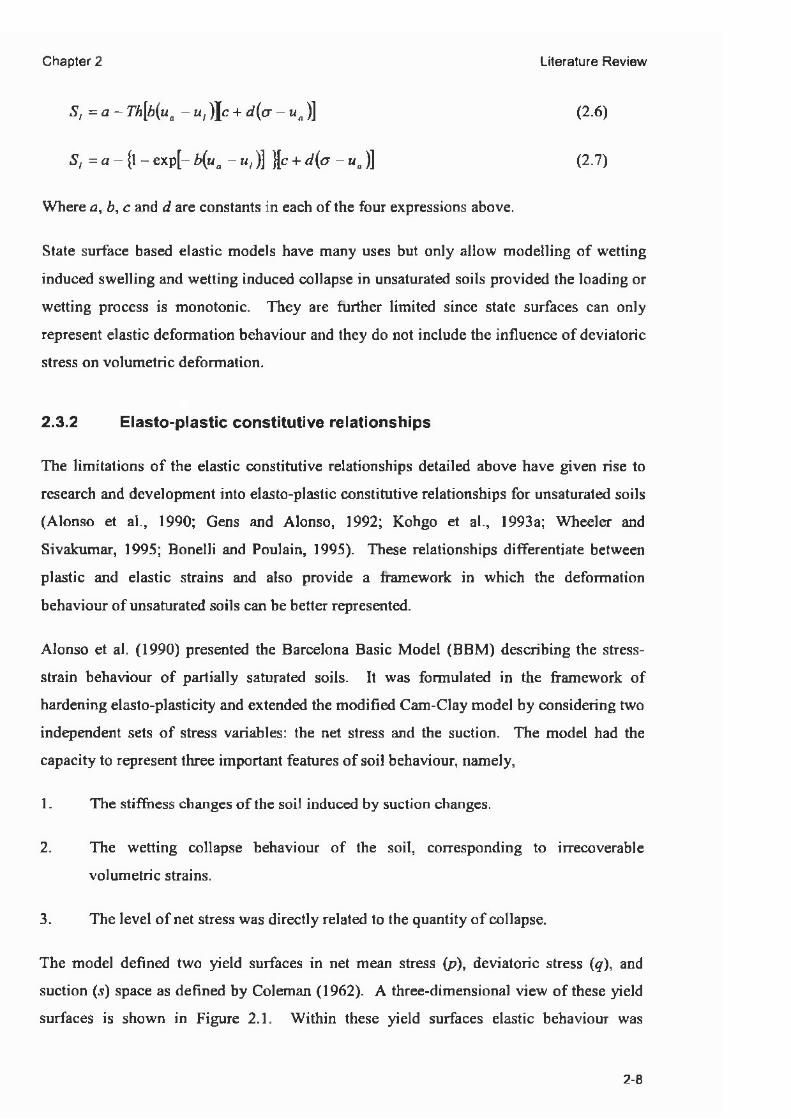
For the state surface o f degree o f saturation excellent results were obtained w ith the
fo llow ing expressions;
e = e0 - C , ln(cr- u a) - C m ln(«a - u, ) (2.2)
w = w 0 - D , ln(<r - ua) - D m ln(ufl - u,) (2.3)
2-7
Chapter 2 Literature Review
S, = a - Th[b(ua - u, )Jc + d(cr - ua)] (2.6)
S, = a - {l - exp[- b(ua - u , ) ] ^ c + d ( a - ua)] (2.7)
Where a, b, c and d are constants in each o f the four expressions above.
State surface based elastic models have many uses but only allow modelling o f wetting
induced swelling and wetting induced collapse in unsaturated soils provided the loading or
wetting process is monotonic. They are further lim ited since state surfaces can only
represent elastic deformation behaviour and they do not include the influence o f deviatoric
stress on volumetric deformation.
2.3.2 E lasto-p lastic constitu tive relationships
The limitations o f the elastic constitutive relationships detailed above have given rise to
research and development into elasto-plastic constitutive relationships for unsaturated soils
(Alonso et al., 1990; Gens and Alonso, 1992; Kohgo et al., 1993a; Wheeler and
Sivakumar, 1995; Bonelli and Poulain, 1995). These relationships differentiate between
plastic and elastic strains and also provide a framework in which the deformation
behaviour o f unsaturated soils can be better represented.
Alonso et al. (1990) presented the Barcelona Basic Model (BBM ) describing the stress-
strain behaviour o f partially saturated soils. It was formulated in the framework o f
hardening elasto-plasticity and extended the modified Cam-Clay model by considering two
independent sets o f stress variables: the net stress and the suction. The model had the
capacity to represent three important features o f soil behaviour, namely,
1. The stiffness changes o f the soil induced by suction changes.
2. The wetting collapse behaviour o f the soil, corresponding to irrecoverable
volumetric strains.
3. The level o f net stress was directly related to the quantity o f collapse.
The model defined two yield surfaces in net mean stress (p), deviatoric stress (q), and
suction (s) space as defined by Coleman (1962). A three-dimensional view o f these yield
surfaces is shown in Figure 2.1. W ith in these yield surfaces elastic behaviour was
2-8
Chapter 2 Literature Review
assumed. When the stress state reached the yield surfaces plastic straining occurred. For
isotropic stress states w ith q = 0, the yield surfaces were defined by two yield curves,
namely, the loading-collapse curve (LC) and suction-increase curve (SI). The LC and SI
yield curves in (p, q), and (p, s) space are shown graphically in Figures 2.2(a) and 2.2(b)
respectively. A constitutive equation for specific volume was proposed by Alonso et al.
(1990) where the stiffness parameter fo r stress changes w ithin the plastic region, 2(5), was
defined as being a function o f suction. Furthermore, an expression for 2(5) was presented
which related the increase o f soil stiffness with increasing suction.
A number o f experimental investigations have been conducted (Josa, 1988; Wheeler and
Sivakumar, 1995; Cui and Delage, 1996) which provide reliable evidence over the
existence o f the LC yield curve. The results o f which showed that the shape o f the LC
yield curve demonstrated the same trends presented by Alonso et al. (1990). Furthermore,
the mathematical representation o f the LC curve has been developed. Josa et al. (1992)
proposed an expression that gave a maximum possible collapse on wetting, and Wheeler
and Sivakumar (1995) proposed an expression based on results from a series o f suction-
controlled triaxial tests on compacted kaolin.
The experimental evidence over the existence o f the SI yield curve is less convincing. The
model presented by Alonso et al. (1990) defined a yield curve that represented the
development o f irreversible strains when a previously unattained level o f suction was
reached. This model was based upon the experimental results presented by Yong et al.
(1971) and Josa et al. (1987) which showed that during a drying wetting cycle irreversible
plastic shrinkage strains were produced. Hence, due to a lack o f further evidence Alonso
et al. (1990) assumed that the suction at yield is independent o f the stress, and the SI yield
curve took the form o f a straight line parallel to the p axis.
Alonso et al. (1995) presented the coupled flow-deformation analysis o f an in-situ
isothermal wetting experiment. Two constitutive models were employed in the simulation;
a state surface approach and an elasto-plastic relationship. When the numerical results
were compared against experimental records an excellent correlation was observed. It was
highlighted that the elasto-plastic model required additional material parameters compared
to the state surface model and that they were more d ifficu lt to establish. Furthermore, it
was shown that the numerical results were highly dependent on some o f the key
2-9
Chapter 2 Literature Review
parameters, particularly the hardening parameter, and that these were d ifficu lt to measure
experimentally.
Gens and Alonso (1992) established an elasto-plastic framework for modelling unsaturated
expansive clays. Some o f the basic concepts from this work were adopted by Cui et al.
(2002) w ith the addition o f a critical swelling curve (CSC). This curve accounted for the
effects o f the hydraulic-mechanical coupling on the volume change behaviour o f heavily
compacted swelling clay, considered for the possible use as an engineering barrier in the
deep geological disposal o f radioactive waste. The non-linear model required only six
material parameters and provided satisfactory predictions for both hydration tests and
mechanical compression tests. However, the model was lim ited in that it only considered
the volume change behaviour o f isotropically compacted clays under isotropic stress, and
oedometric compacted clays under oedometric stress.
Sultan et al. (2002) extended an earlier elasto-plastic model by Hueckel and Baldi (1990)
to include additional plastic mechanisms to take into account the over-consolidation ratio
(OCR) during thermal expansion or shrinkage behaviour. It was proposed that a thermal
yield curve (TY ) should be introduced to take account o f thermally induced volume
changes under both normal and high OCR’ s.
The above models employ net stress, deviatoric stress and suction as stress state variables.
However, a number o f other models have been suggested which use alternative stress state
variables (Kohgo et al., 1993a, 1993b; Jommi and di Prisco, 1994; Kato et al., 1995;
Bolzon et al., 1996). These models attempt to sim plify the elasto-plastic formulations by
adopting alternative combinations o f more complex stress state variables. A review o f
these models has been presented elsewhere (Wheeler and Karube, 1996; Gens, 1995).
Efforts have been made to model the mechanical behaviour o f expansive clays using dual
porosity models. Alonso et al. (1999) presented a two level formulation to model the
behaviour o f expansive clays. The behaviour o f the macrostructure followed the model
developed fo r unsaturated soils by Alonso et al. (1990) and the behaviour o f the
microstructure was adapted from the work o f Gens and Alonso (1992) in order to include
the possibility o f the micropores being partially saturated. The mechanical coupling
between both levels o f structure was defined through a drying function and a wetting
function. These were based on experimental evidence and expressed the change in
2-10
Chapter 2 Literature Review
macrostructural void ratio due to a change in microstructural void ratio and are dependent
on the level o f compaction o f the macrostructure. The model was able to represent the
dependency o f strain on stress-suction paths, the accumulation o f expansion strain during
suction cycles at low confining stress, the accumulation o f compression strain during
suction cycles at high confining stress, strain fatigue during drying-wetting cycles,
macropore invasion by expanded microstructure and development o f macroporosity during
strong drying. Comparison w ith experimental tests performed in a suction-controlled
oedometer apparatus showed that the model was able to capture the trends and data
qualitatively.
Gallipoli et al. (2003a) presented an improved relationship fo r the variation o f degree o f
saturation in an unsaturated soil, which incorporated the influence o f changes in void ratio.
This was combined w ith an elasto-plastic stress-strain model to represent irreversible
changes o f degree o f saturation caused by shearing. Experimental data from tests
performed by Sivakumar (1993) and Zakaria (1995) were used to demonstrate the success
o f the proposed new expression fo r degree o f saturation and excellent agreement was
reached in the results for the fu ll range o f stress paths. It was noted that this new
relationship fo r degree o f saturation was limited in that it did not take into account any
influence o f hydraulic hysteresis during wetting and drying cycles.
Wheeler et al. (2003) presented a new elasto-plastic framework fo r unsaturated soils that
did involve coupling hydraulic hysteresis and mechanical behaviour. The stress variables
employed were Bishop’s stress tensor and modified suction (suction multiplied by
porosity). W ithin the framework, plastic changes o f degree o f saturation influence the
stress-strain behaviour and plastic volumetric strains influence the water retention
behaviour. They developed a specific constitutive model for isotropic stress states so that
simulation results could be compared at a qualitative level w ith experimental results. Not
only did the model have the capability to capture the basic forms o f unsaturated soil
behaviour but also was able to simulate forms o f mechanical behaviour observed in
experimental tests that are not represented by existing constitutive models. These include
proper transitions between saturated and unsaturated response, irreversible compression
during the drying stages o f wetting-drying cycles, and the influence o f a wetting-drying
cycle on subsequent behaviour during isotropic loading. The model also provided a
realistic representation o f the variation o f degree o f saturation including the influence o f
2-11
Chapter 2 Literature Review
both hydraulic hysteresis and plastic volumetric strains. However it was acknowledged
that further research was needed to refine some o f the mathematical expressions w ithin the
constitutive model especially in the way in which the water retention behaviour was
modelled.
Gallipoli et al. (2003b) presented an elasto-plastic model that takes explicitly into account
the mechanisms w ith which suction affects mechanical behaviour as well as their
dependence on degree o f saturation. An innovative constitutive framework fo r unsaturated
soil was proposed that was able to explain the various mechanical features o f the material
by using physical descriptions o f the different effects o f suction on soil straining. The
proposed model was formulated in terms o f two constitutive variables related to these
suction mechanisms. These were the average skeleton stress, which includes the average
flu id pressure acting on the soil pores and an additional scalar constitutive variable related
to the magnitude o f the bonding effect exerted by meniscus water at the inter-particle
contacts. Based on experimental evidence it was assumed that, during the elasto-plastic
loading o f a soil element, the ratio o f void ratio, e, under unsaturated conditions to void
ratio, es, under saturated conditions is a unique function o f the bonding variable. This
single yield curve assumption was successfully validated against several sets o f published
experimental data for different materials. This assumption was incorporated into a fu ll
elasto-plastic stress-strain model and its performance was demonstrated by the comparison
between predicted and laboratory test results for a wide variety o f different stress paths.
This showed that the model was able to correctly capture the most important features o f the
mechanical behaviour o f unsaturated soils even though it was formulated in terms o f a
single yield curve. It was also observed that another advantage o f this approach was that a
reduced number o f laboratory tests were necessary for calibrating the proposed model and
for material parameter determination.
2.3.3 C on clu sion s
This section reviewed the recent developments o f theories to describe the deformation
behaviour o f unsaturated soils and highlighted that a good understanding o f the principal
processes has been achieved. Furthermore, a number o f elastic and elasto-plastic
constitutive models have been presented to describe several fundamental features o f the
mechanical behaviour o f unsaturated soils. More recently, attempts have been made to
2-12
Chapter 2 Literature Review
incorporate the effects o f suction, degree o f saturation and hydraulic hysteresis on
mechanical behaviour o f unsaturated soils w ith varying levels o f success.
2.4 Coupled flow and deformation behaviour in unsaturated
soils
This section presents a review o f the literature concerning theoretical models which couple
the flow effects o f heat, mass and air on deformation behaviour o f unsaturated soils.
Thorough reviews o f this work are available (Cleall, 1998; Wang 2000; M itchell, 2002)
and the intention o f this section is to provide a focussed review o f the previous work
combined w ith a review o f the most recent publications.
Barden (1965) proposed a consolidation model for unsaturated clay including four
governing equations fo r pore air pressure, pore water pressure, unsaturated flu id
conductivity and porosity. The flow equations were based on Darcy’s Law and the
unsaturated flu id conductivity was related to the degree o f saturation. The deformation
behaviour was described by a constitutive equation based on the effective stress approach
after Bishop (1960). An analysis o f a one-dimensional consolidation problem was
conducted by applying a fin ite difference solution to the governing equations.
A further one-dimensional consolidation model for unsaturated clay was presented by
Fredlund and Hasan (1979). They employed a modified version o f Terzaghi’ s theory,
(Terzaghi, 1943) to represent the vertical compression, which reverted back to its previous
form under saturated conditions. The pore water and pore air flow were described using
two mass continuity equations. The model was used to simulate a simple one-dimensional
consolidation problem w ith both loading and boundary conditions applied.
Lloret and Alonso (1980) proposed a coupled one-dimensional model for water, air and
deformation in an unsaturated soil. Again the pore water and pore air flow were based on
Darcy’ s Law and described using two mass continuity equations. Dissolved air was
included in the formulation but water vapour transfer was not included. The deformation
behaviour was based upon the state surface approach as presented by Matyas and
Radhakrishna (1968) whereby the stress state variables employed were net stress and
suction. A numerical solution was achieved via the fin ite element method fo r spatial
discretisation and a fin ite difference scheme for temporal discretisation. The model was
2-13


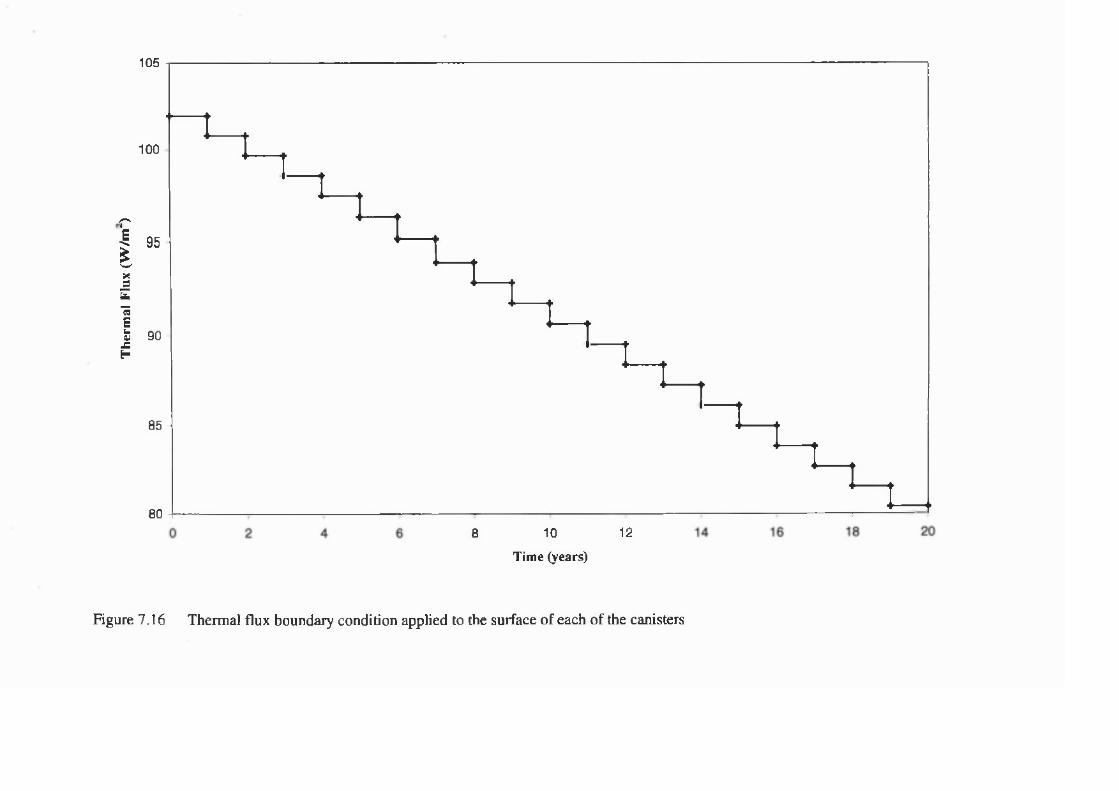
The
rmal
Flu
x (W
/nT
)
105
100
95
90
85
808 10 12
Tim e (years)
Figure 7.16 Thermal flux boundary condition applied to the surface o f each o f the canisters
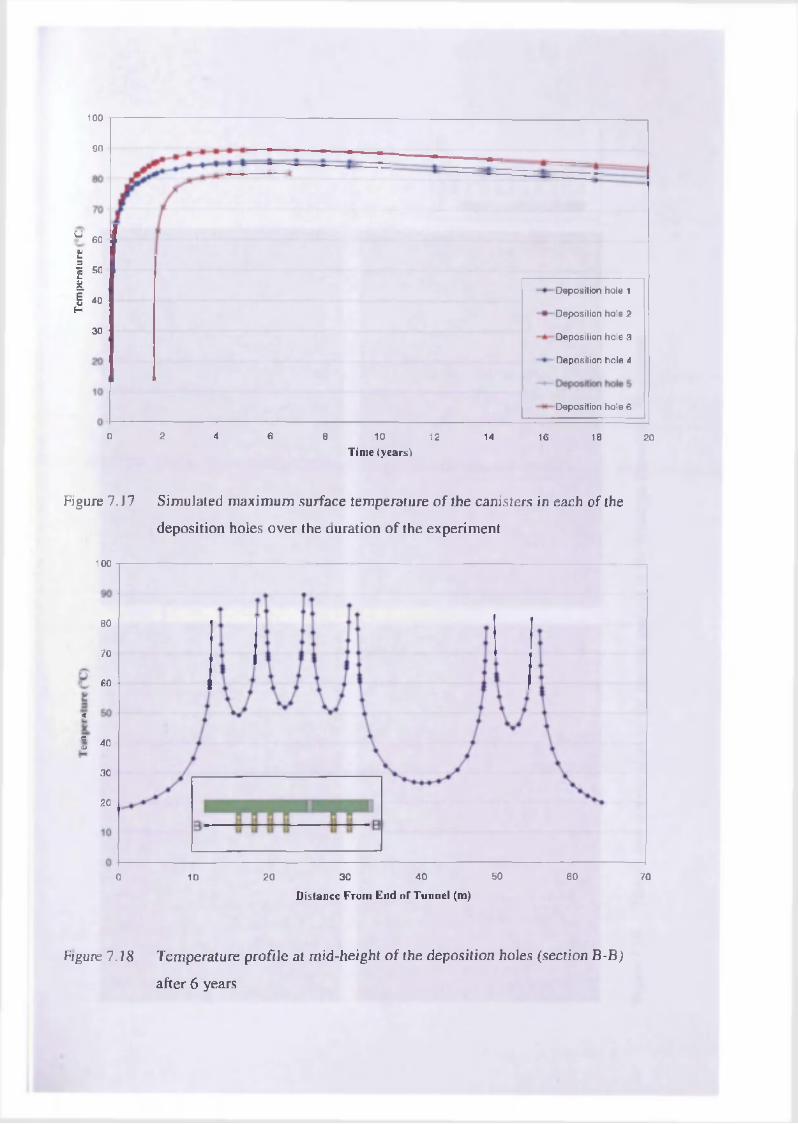
100
90
u 60
t3| 50
*l| 40
Deposition hole 1
Deposition hole 2
30Deposition hole 3
Deposition hole 4
Deposition hole 6
0 2 4 6 8 10 12 14 16 18 20
T im e (years)
Figure 7.17 Simulated maximum surface temperature o f the canisters in each o f the
deposition holes over the duration o f the experiment
100
80
70
60O
r.
=u 40
30
20
5020 30 40 60 700 10
Distance F rom End o f Tunne l (m)
Figure 7.18 Temperature profile at mid-height o f the deposition holes (section B-B)
after 6 years
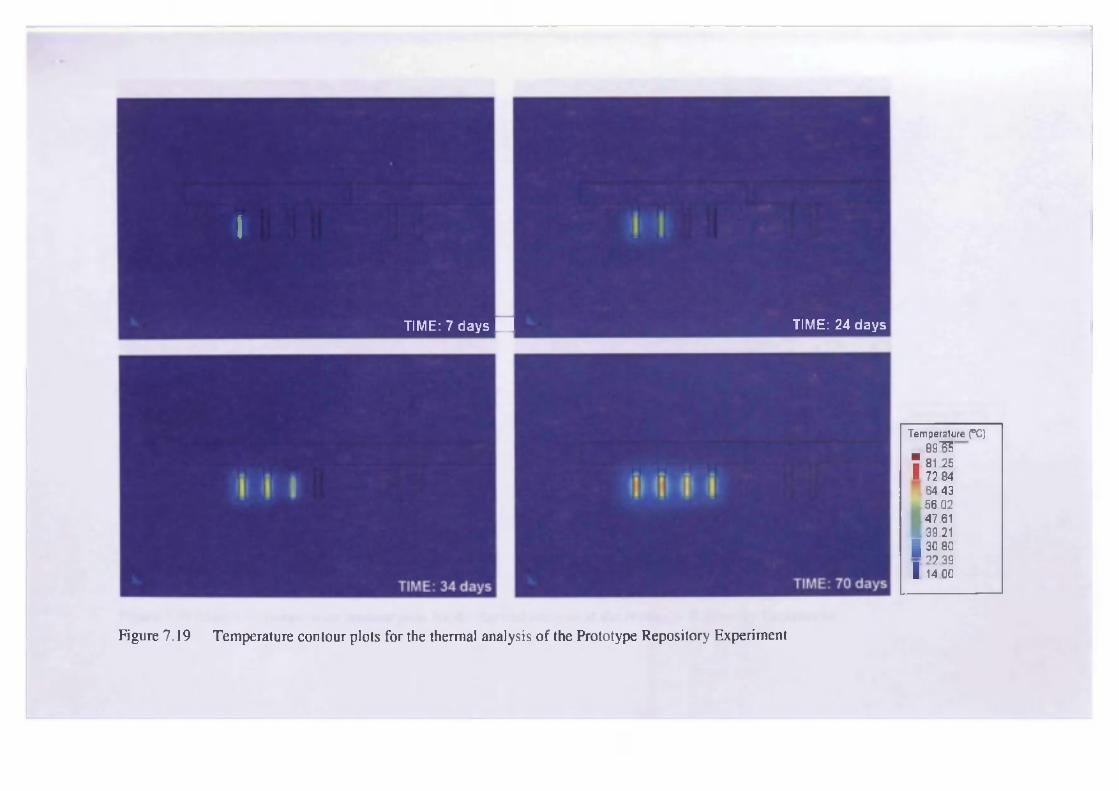
I
TIME: 7 days ■ TIME: 24 days
Temperature (°C)89"55n81.25
| 72 8464 4356.0247.6139.21i 30.8022.39I 14.00
Figure 7.19 Temperature contour plots for the thermal analysis o f the Prototype Repository Experiment
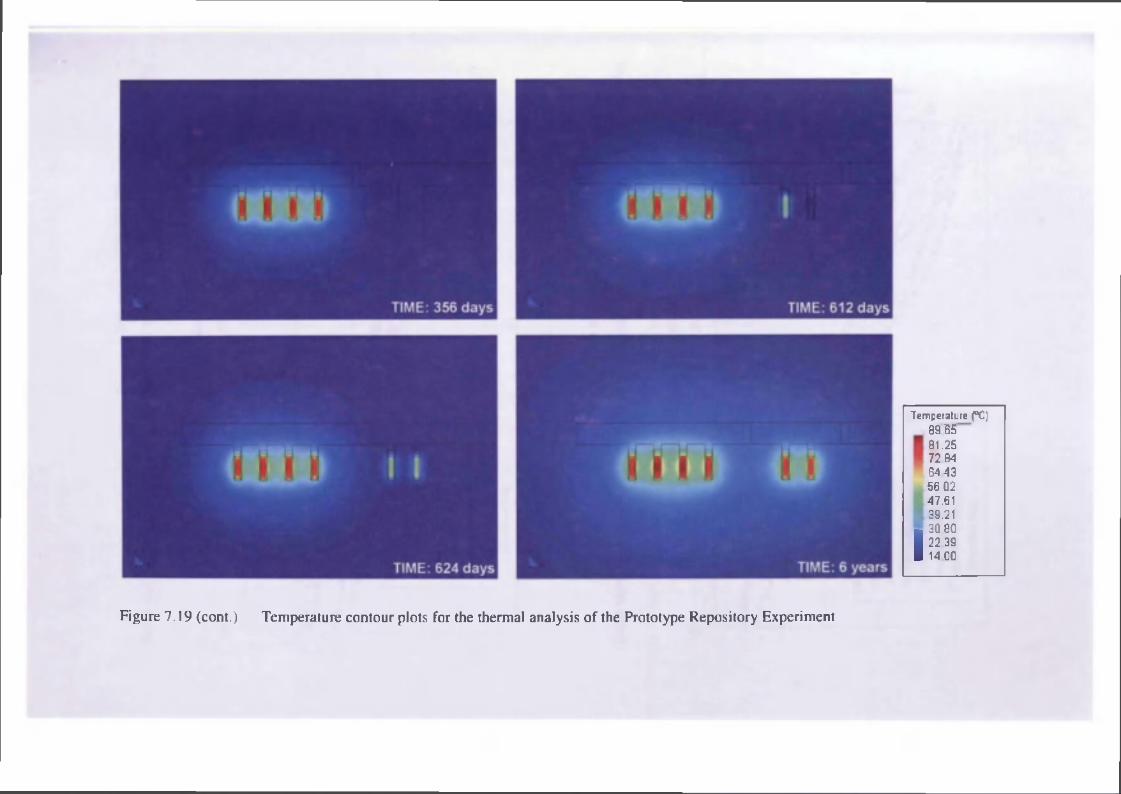
Temperature (°C)89.6581.2572.8464.43
. 56.0247.6139.21
Hi 30.80
M22.39
L i 14.00
Figure 7.19 (cont.) Temperature contour plots for the thermal analysis o f the Prototype Repository Experiment
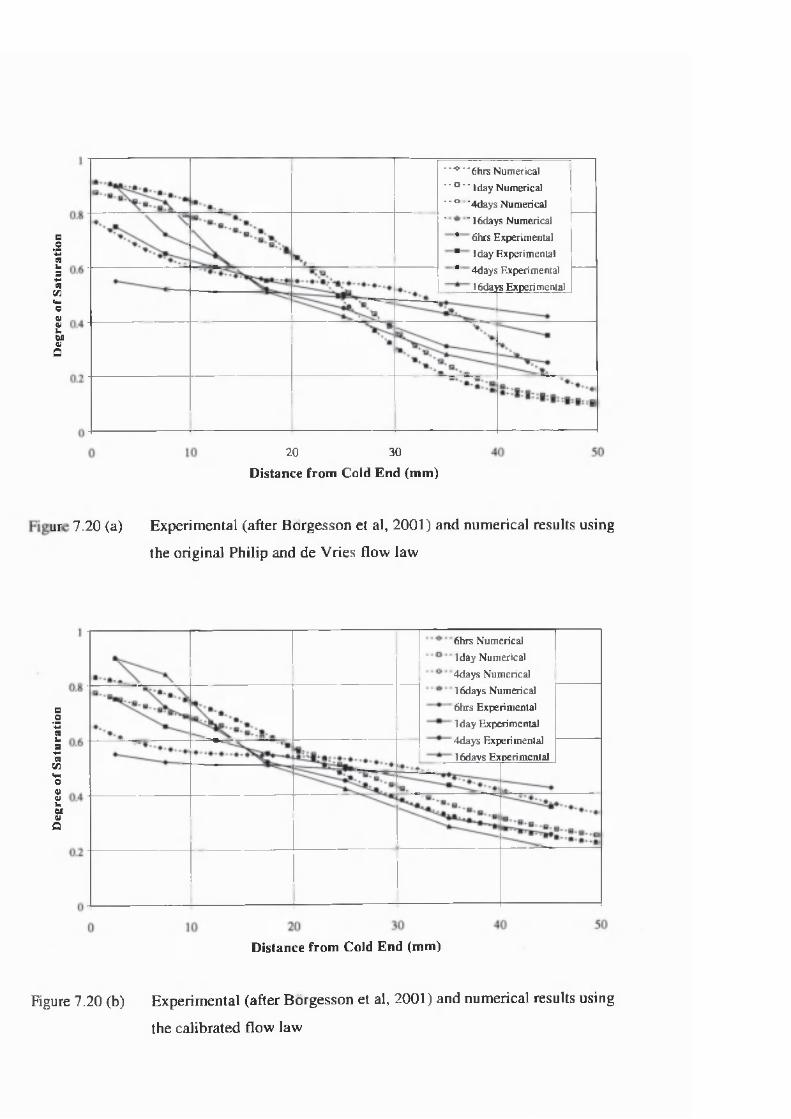
Deg
ree
of
Sa
tura
tion
Deg
ree
of
Sa
tura
tio
n
I6days Experimental
20 30
D istance from C old E nd (m m )
• * ♦ • • 6hrs Numerical ' ' ° ‘ ‘ 1 day Numerical ■ • ° - 4days Numerical
‘ " 16days Numerical
* 6hrs Experimental
■ lday Experimental• 4days Experimental
7.20 (a) Experimental (after Borgesson et al, 2001) and numerical results using
the original Philip and de Vries flow law
6hrs Numerical
lday Numerical
4days Numerical
16days Numerical
6hrs Experimental lday Experimental
4days Experimental
16davs Experimental
D istance from C old E nd (m m )
Figure 7.20 (b) Experimental (after Borgesson et al, 2001) and numerical results using
the calibrated flow law

140
130
120
110
100
8032 70
I 60
H 50
40 R adia l d is tance = 0 m (cylinder C2)
R ad ia l d is tance = 0 .585 m (ring R5)
R ad ia l d is tance = 0 m (cy linder C1)
9 103 5 6 7 81 2 40T im e (years)
Figure 7.21 (a) Temperature at different positions in the buffer using the original Philip
and de Vries flow law
1.0
0.9
0.8
0.7
0.6
0.5
0.4
R adia l d is tance = 0 m (cy linder C2)0.3
0.2 R adia l d is tance = 0 .585 m (ring R5)
0.1 R adia l d is tance = 0 m (cy linder C1)
0.0107 8 965430 1 2
T im e (years)
Figure 7.21 (b) Degree o f Saturation at different positions in the buffer using the
original Philip and de Vries flow law
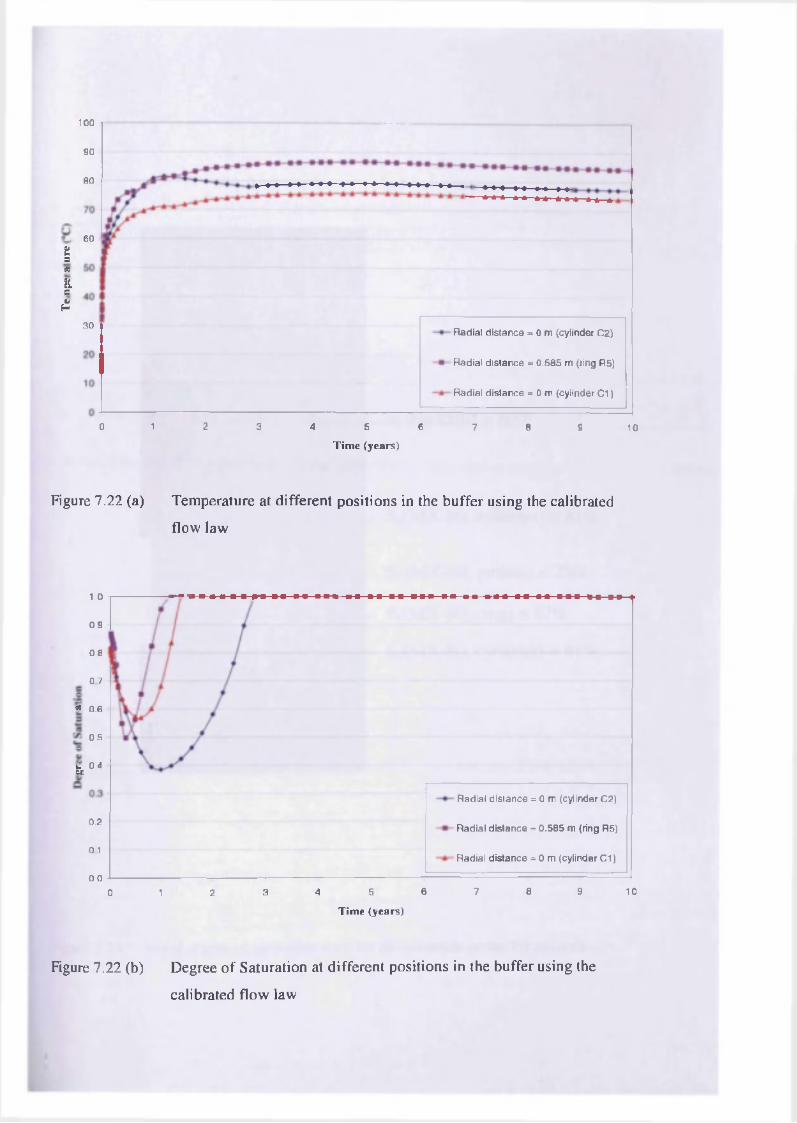
100
90
80
60
e3a
SL=&h
30R adia l d is tance = 0 m (cylinder C2)
R adia l distance = 0.585 m (ring R5)
R adia l distance = 0 m (cylinder C1)
20 1 3 4 5 6 7 8 9 10T im e (years)
Figure 7.22 (a) Temperature at different positions in the buffer using the calibrated
flow law
1.0
0.9
0.8
0.7
« 0.6
0.5
u 0.4 u
R adia l d is tance = 0 m (cylinder C2)
0.2R adia l distance = 0 .585 m (ring R5)
0.1Radial d is tance = 0 m (cylinder C1)
0.06 7 8 9 104 50 1 2 3
T im e (years)
Figure 7.22 (b) Degree o f Saturation at different positions in the buffer using the
calibrated flow law
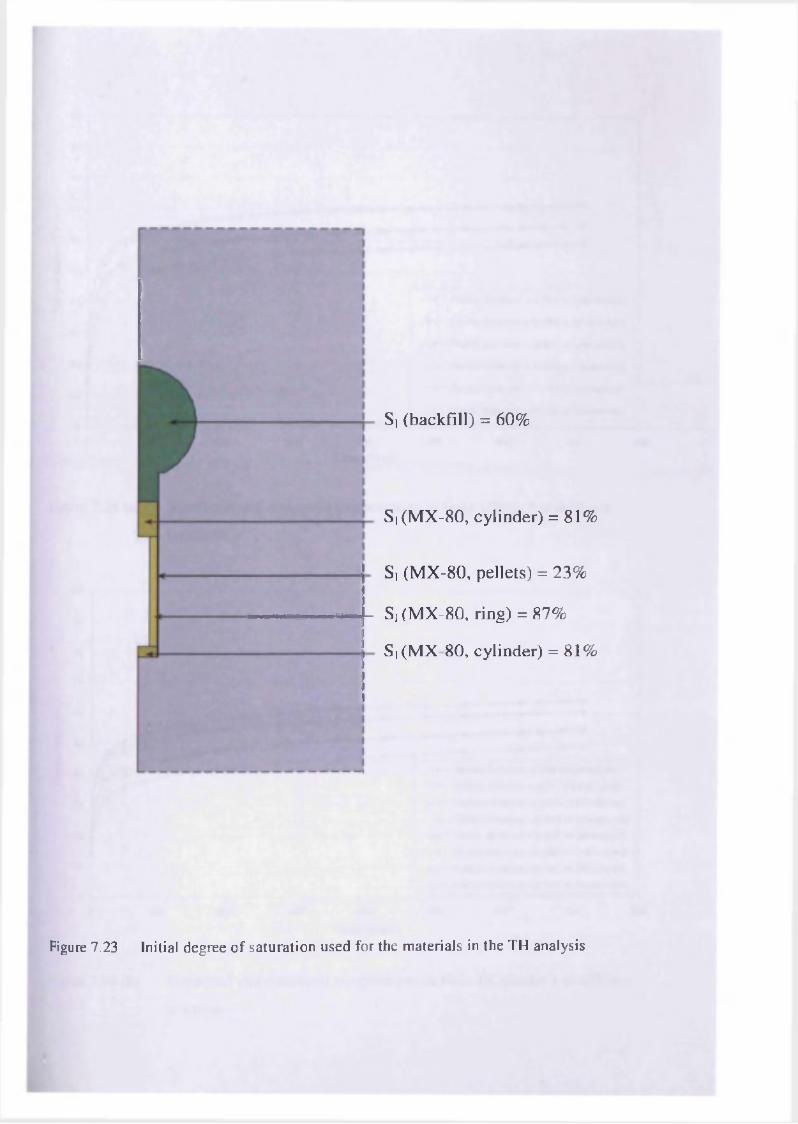
------------------
S| (b a c k f i l l) = 60%
S, (M X -80 , cylinder) = 81%
S, (M X -80 , pellets) = 23%
- S, (M X -80 , ring) = 87%
S| (M X -80 , cylinder) = 81%
Figure 7.23 Initial degree o f saturation used for the materials in the TH analysis
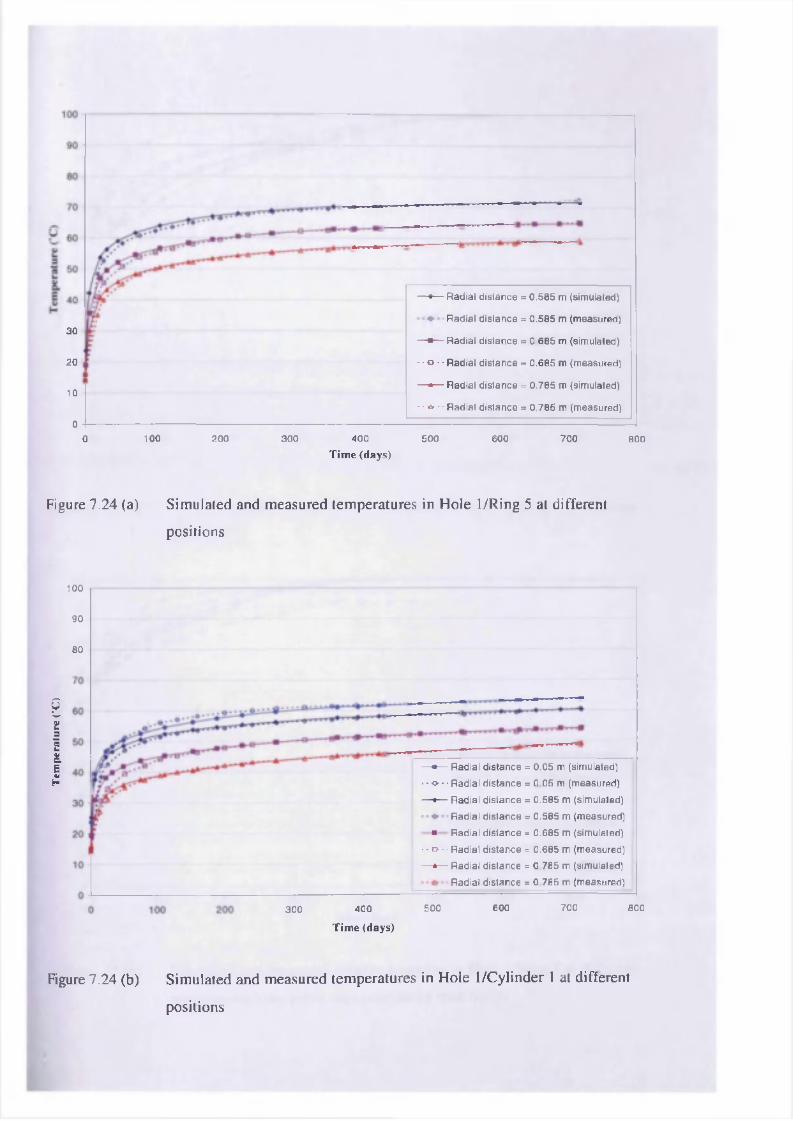
Tem
pera
ture
(’
C)
30
20
10
00 100 200 300 400 500 600 700 800
T im e (d a y s )
Figure 7.24 (a) Simulated and measured temperatures in Hole 1/Ring 5 at different
positions
— •— R adia l d is tance = 0 .585 m (simulated)
R adia l d is tance = 0 .585 m (measured)
— ■— R adia l d is tance = 0 .685 m (simulated)
- - o - • R adia l d is tance = 0 .685 m (measured)
— * — R adia l d is tance = 0 .785 m (simulated)
• - * - ■ R adia l d is tance = 0 .785 m (measured)
100
90
80
300 400 500 600 700 800
T im e (d a y s )
— • — Radial distance = 0 .05 m (simulated)
-•< > •• R adial d is tance = 0 .05 m (measured)
— •— Radial d is tance = 0 .585 m (simulated)
R adia l d is tance = 0 .585 m (measured)
■ Radial d is tance = 0 .685 m (simulated)
- -£>- • Radia l d is tance = 0 .685 m (measured)
— * — Radia l distance = 0 .785 m (simulated)
R adia l distance = 0 .785 m (measured)
Figure 7.24 (b) Simulated and measured temperatures in Hole 1/Cylinder 1 at diflerent
positions
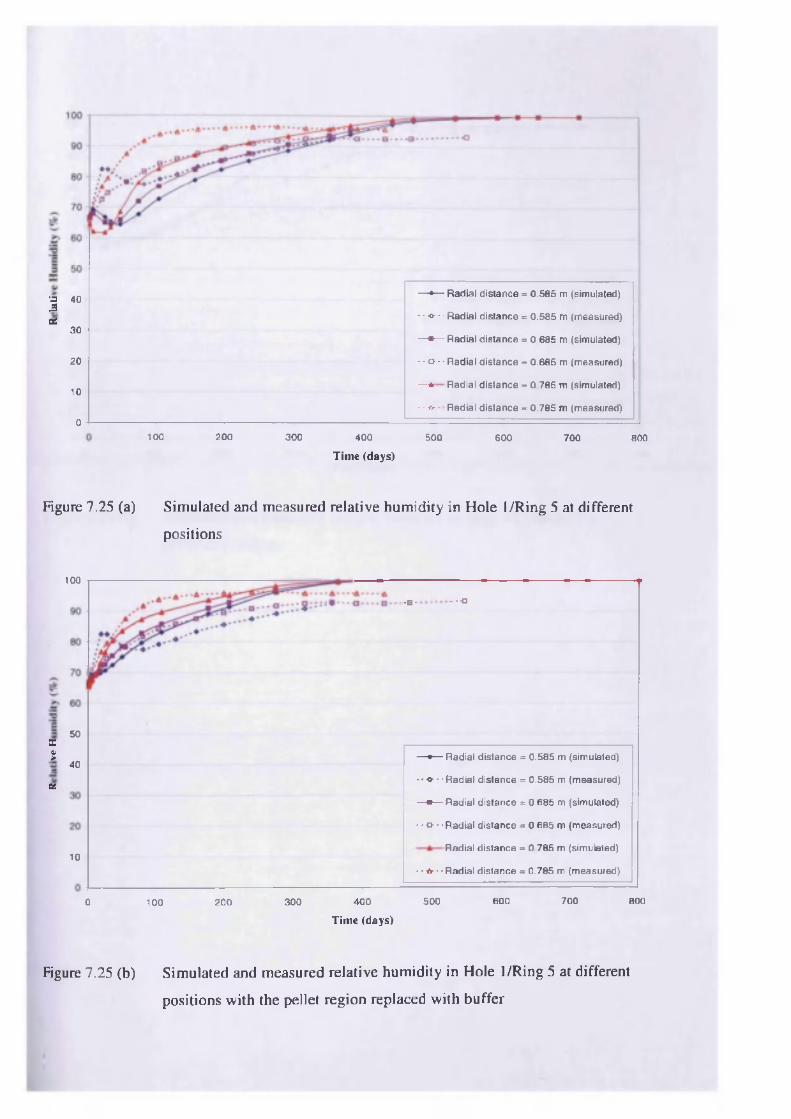
■s 40.2K
30
20
10
0
— •— Radia l d is tance = 0 .585 m (simulated)
• - « • • • Radia l d is tance = 0 .585 m (measured)
— ■— R ad ia l d is tance = 0.685 m (simulated)
- - o -• R ad ia l d is tance = 0 .6 85 m (measured)
— * ■ ■■ R adia l d is tance = 0 .785 m (simulated)
- - * - R adia l d is tance = 0 .785 m (measured)
100 200 300 400
T im e (days)
500 600 700 800
Figure 7.25 (a) Simulated and measured relative humidity in Hole 1/Ring 5 at different
positions
100
--■a-a-
50Xc*> — *— R adia l distance = 0 .585 m (simulated)
••«■■■ R adia l d is tance = 0 .585 m (measured)
— ■— R adia l d is tance = 0.685 m (simulated)
40
X
■ - o - • R adia l d is tance = 0.685 m (measured)
Radial d is tance = 0 .785 m (simulated)10
- • t r ■ ■ Radial d is tance = 0 .785 m (m easured)
700400 500 600 8000 200 300100
T im e (days)
Figure 7.25 (b) Simulated and measured relative hum id ity in Hole 1/Ring 5 at different
positions w ith the pellet region replaced w ith buffer
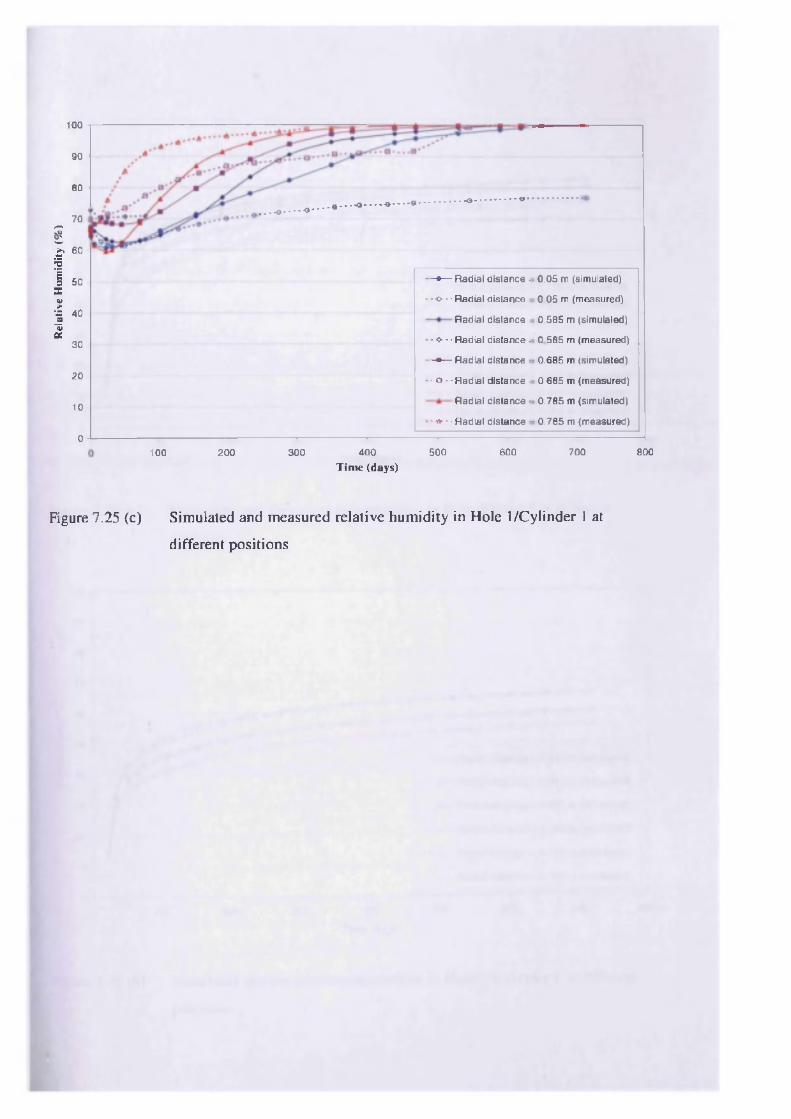
Rel
ativ
e H
umid
ity
(%
)
100
90
80
70
60
50
40
30
20
10
0
- • — R ad ia l distance -
• o - - Radia l distance :
Radia l distance •
• o- ■ ■ R adia l d is tance -
-Hi— Radia l distance ;
- o • • Radia l distance ■
Radia l d is tance .
- * - ■ R adia l d is tance :
0.05 m (simulated)
0.05 m (measured)
0 .585 m (simulated)
0 .585 m (measured)
0 .685 m (simulated)
0 .685 m (measured)
0 .7 85 m (simulated)
0 .7 85 m (measured)
100 200 300 400
T im e (days)500 600 700 800
Figure 7.25 (c) Simulated and measured relative humidity in Hole 1 /Cylinder 1 at
different positions
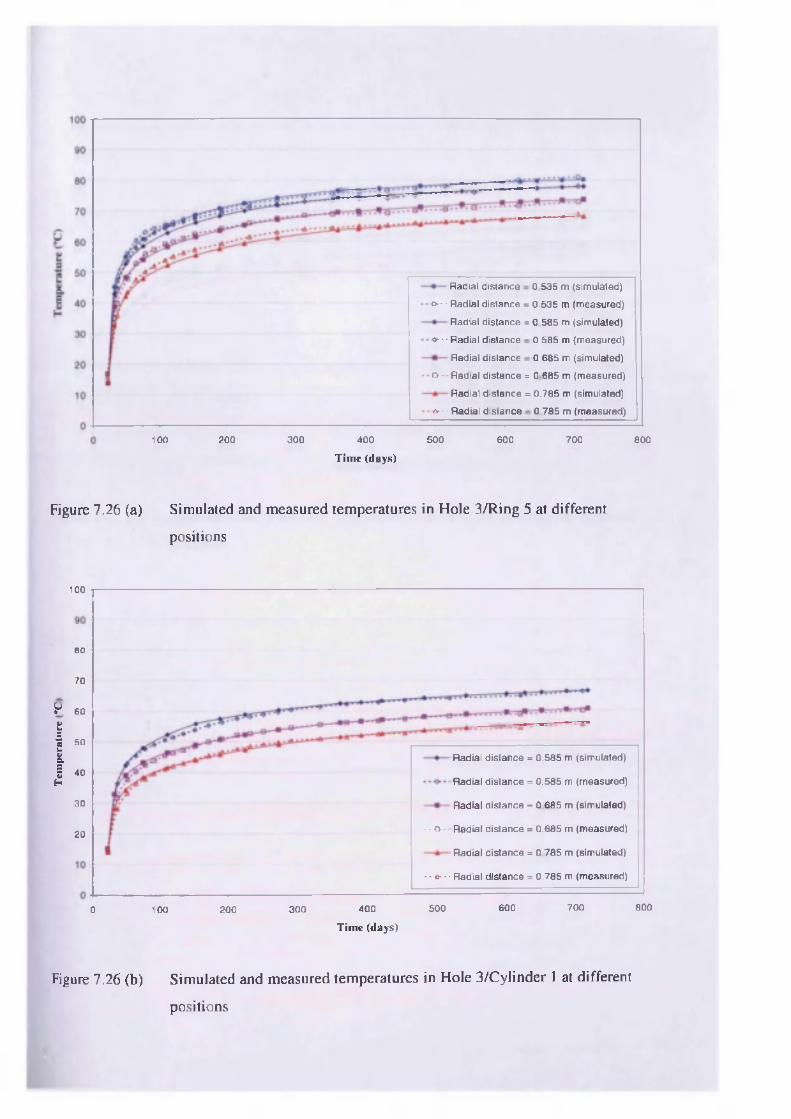
Radial d istance
o - • R adia l d istance =
Radial d is tance =
«• - • Radial distance
R adia l distance
t> - • R adia l d is tance =
Radial d is tance =
* - • R adial distance
0.535 m (simulated)
0.535 m (measured)
0 .585 m (simulated)
0 .585 m (measured)
0 .685 m (simulated)
0 .685 m (measured)
0 .785 m (simulated)
0 .785 m (measured)
100 200 300 400
T im e (d a ys )
500 600 700 800
Figure 7.26 (a) Simulated and measured temperatures in Hole 3/Ring 5 at different
positions
100
80
70
W 60
t3" 50
|| 40H
IRadial d is tance = 0 .585 m (simulated)
R adia l d is tance = 0 .585 m (measured)
30 R adia l d is tance = 0 .685 m (simulated)
- - o - R adia l d is tance = 0 .685 m (measured)20R adia l d is tance = 0 .785 m (simulated)
- • * • • • R adia l d is tance = 0 .785 m (measured)
800600 700400 5003000 100 200
T im e (d a y s )
Figure 7.26 (b) Simulated and measured temperatures in Hole 3/Cylinder l at different
positions
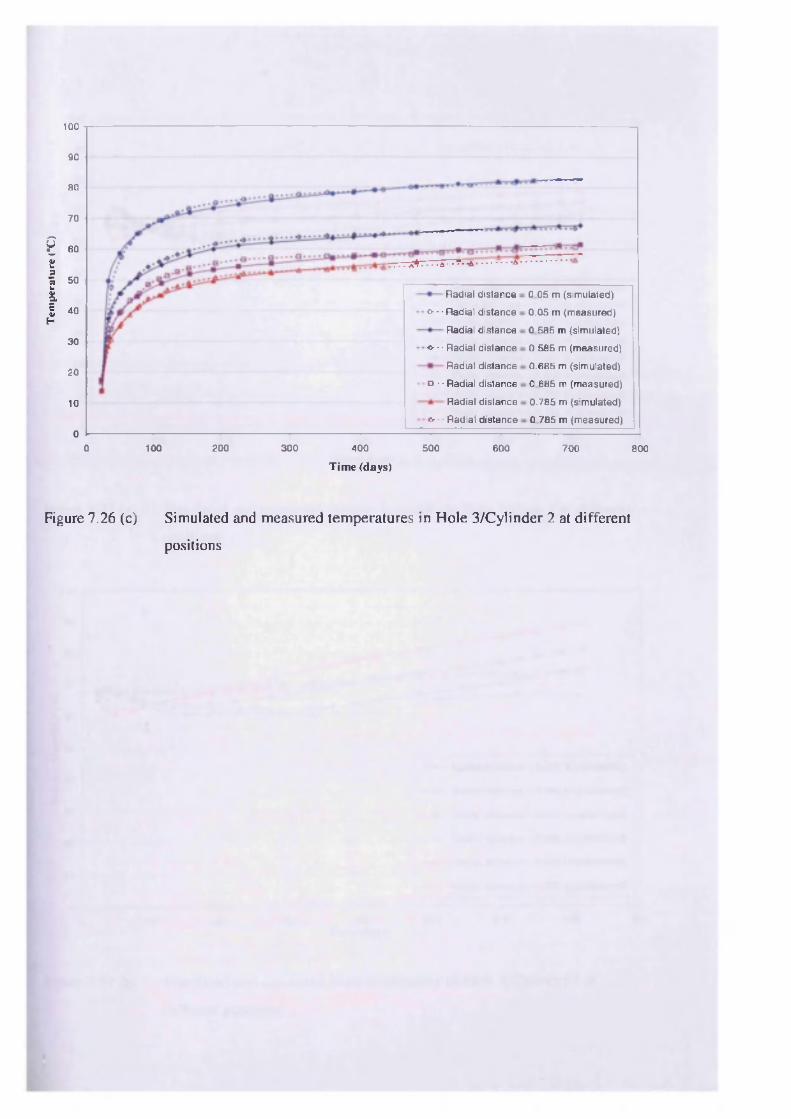
Te
mp
era
ture
<°
C)
100
90
80
70
60
50
40
30
20
10
00 100 200 300 400 500 600 700 800
T im e (d a y s )
Figure 7.26 (c) Simulated and measured temperatures in Hole 3/Cylinder 2 at different
positions
Radial distance
o ■ ■ R adial distance
Radial distance
o- ■ ■ R adia l d istance
Radial distance
o ■ • R adial distance
R adia l d istance
tr - ■ R adia l d is tance
0.05 m (sim ulated)
0.05 m (m easured)
0.585 m (simulated)
0 .5 85 m (m easured)
0 .685 m (simulated)
0 .685 m (m easured)
0 .7 85 m (simulated)
0 .785 m (m easured)
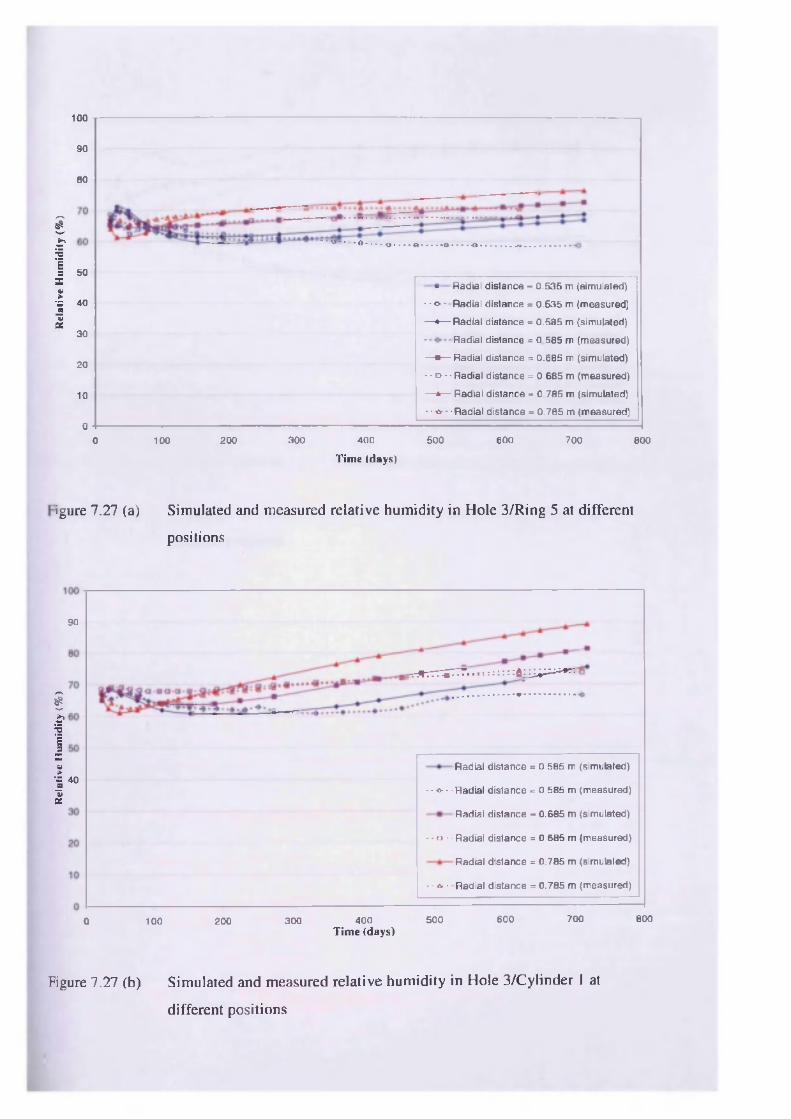
Rel
ativ
e H
umid
ity
(%)
^5'
Rel
ativ
e H
umid
ity
(%)
100
90
80
50
40
30
20
10
0 ■ -----------------------------------------------------------------------------------------0 100 200 300 400 500 600 700 800
T im e (days)
• R adia l d is tance = 0 .5 35 m (sim ulated)
- - o - • R adial d is tance = 0 .5 35 m (m easured)
— • — R adia l d is tance = 0 .585 m (simulated)
• R adia l d is tance = 0 .585 m (m easured)
— ■— Radial d is tance = 0 .685 m (sim ulated)
- - o - ■ R adia l d is tance = 0 .685 m (m easured)
— * — R adial d is tance = 0 .785 m (simulated)
• • * • • • R adia l d is tance = 0 .7 85 m (m easured)
ure 7.27 (a) Simulated and measured relative humidity in Hole 3/Ring 5 at different
positions
90
Radia l d is tance = 0 .585 m (simulated)40
- - -o- • • R adia l d is tance = 0.585 m (measured)
Radia l d is tance = 0 .685 m (simulated)
-•€>• • R adia l d is tance = 0 .685 m (m easured)
R ad ia l d is tance = 0 .785 m (simulated)
- • * - R adia l distance = 0 .785 m (measured)
700 8006005004000 100 200 300T im e (days)
Figure 7.27 (b) Simulated and measured relative hum id ity in Hole 3/Cylinder 1 at
different positions
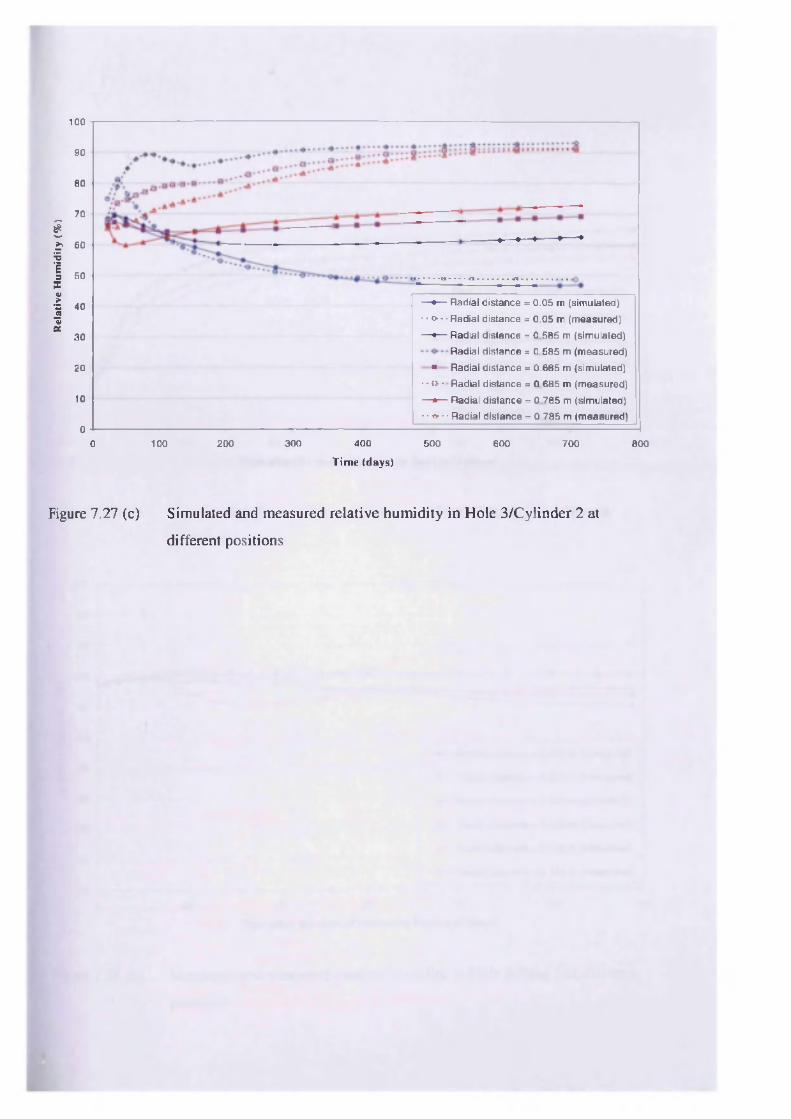
Rel
ativ
e H
um
idity
(%
)
100
90
80
70
60
50
40
30
20
10
00 100 200 300 400 500 600 700 800
T im e (d a y s )
Figure 7.27 (c) Simulated and measured relative humidity in Hole 3/Cylinder 2 at
different positions
— • — R adia l d is tance = 0 .05 m (sim ulated)
• •<>•• R adia l d is tance = 0 .05 m (m easured)
— •— Radial d is tance = 0 .585 m (sim ulated)
Radial d is tance = 0 .5 85 m (m easured)
■ R adia l d is tance = 0 .685 m (sim ulated)
• •€»•• R adia l d is tance = 0 .685 m (m easured)
— * — R adial d is tance = 0 .7 85 m (sim ulated)
• • * - ■ R adia l d is tance = 0 785 m (m easured)
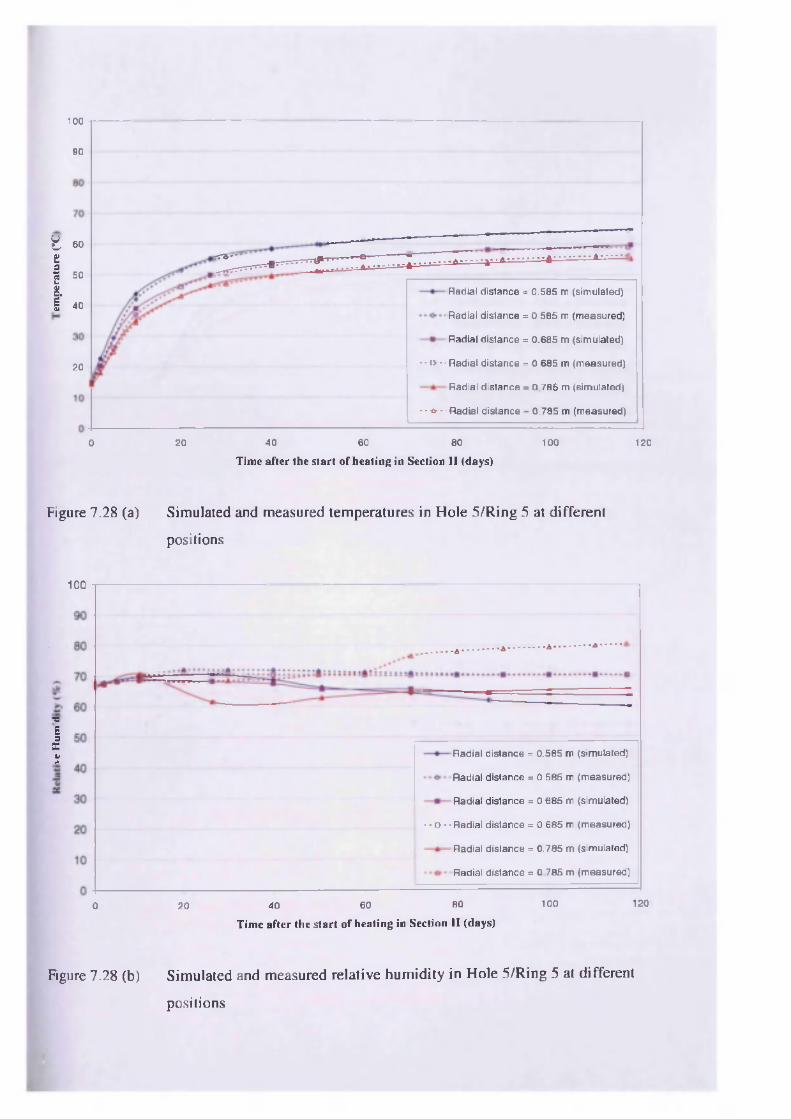
100
90
^ 60
tI 50u8.I 40
R adia l d is tance = 0 .585 m (sim ulated)
Radial d is tance = 0 .5 85 m (m easured)
Radia l d is tance = 0 .685 m (sim ulated)
• •«»-• R adia l d is tance = 0 .685 m (m easured)20Radia l d is tance = 0 .7 85 m (sim ulated)
• • * • • R adia l d is tance = 0 .785 m (m easured)
20 40 60 80 100 1200Tim e afte r the s ta rt o f heating in Section I I (days)
Figure 7.28 (a) Simulated and measured temperatures in Hole 5/Ring 5 at different
positions
100
s£9Xv■■ R adia l d is tance = 0 .585 m (sim ulated)
R adia l d is tance = 0 .585 m (m easured)
R adia l d is tance = 0 .685 m (sim ulated)
• •£»•• R adia l d is tance = 0 .685 m (m easured)
R adia l d is tance = 0 .785 m (simulated)
R adia l d is tance = 0 .785 m (m easured)
12080 100600 20 40
T im e a fte r the s ta rt o f heating in Section I I (days)
Figure 7.28 (b) Simulated and measured relative hum id ity in Hole 5/Ring 5 at different
positions
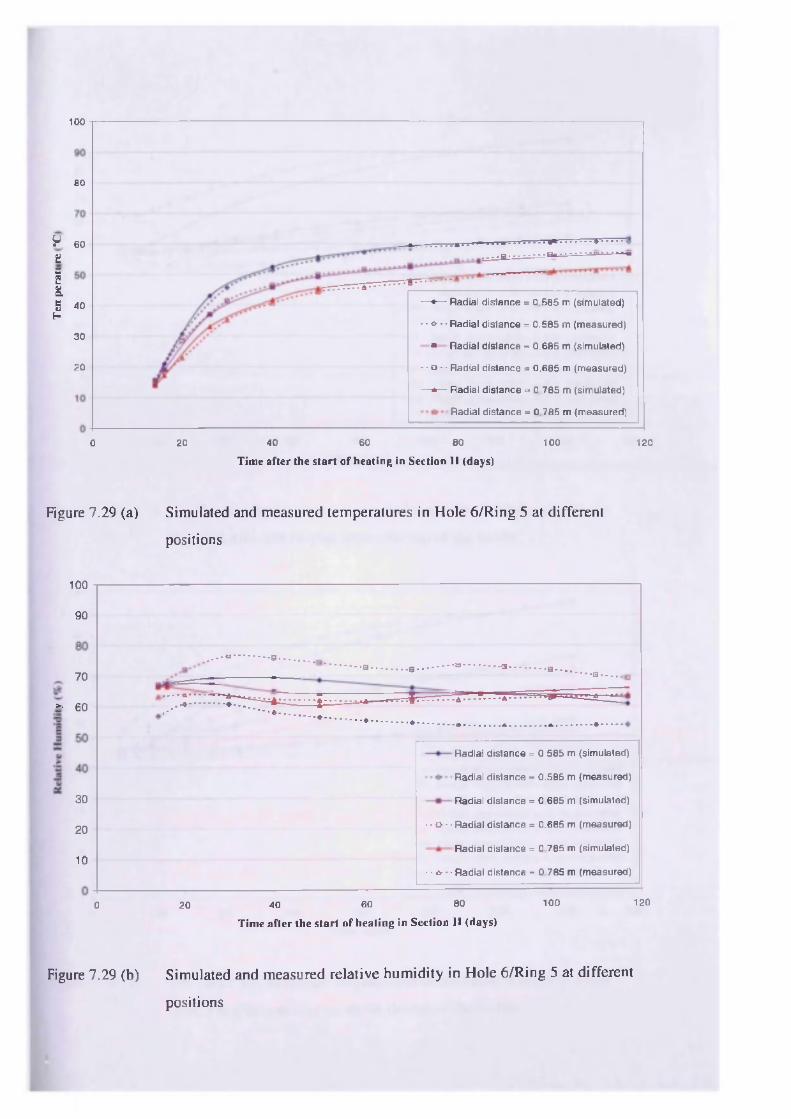
100
80
^ 60
t-1&£ 40H
— •— R adial d is tance = 0 .5 85 m (sim ulated)
- - « • • • R adia l d is tance = 0 .5 85 m (m easured)
■ R adia l d is tance = 0 .6 85 m (sim ulated)
- - o -• R adia l d is tance = 0 .685 m (m easured)
— * — Radial d is tance = 0 .7 85 m (simulated)
R adia l d is tance = 0 .785 m (m easured)
30
20
20 40 60 80 100 1200T im e a fte r the s ta rt o f heating in Section I I (days)
Figure 7.29 (a) Simulated and measured temperatures in Hole 6/Ring 5 at different
positions
100
90
70
>■ 60
R adia l d is tance = 0 .585 m (simulated)
R adia l d is tance = 0 .585 m (m easured)
30 R adial d is tance = 0 .685 m (simulated)
• • o - ■ R adia l d is tance = 0 .685 m (m easured)20R adia l d is tance = 0 .785 m (simulated)
10• • * - • R adia l d is tance = 0 .785 m (m easured)
1201008060400 20Tim e a fte r the s ta rt o f heating in Section I I (days)
Figure 7.29 (b) Simulated and measured relative hum id ity in Hole 6/Ring 5 at different
positions
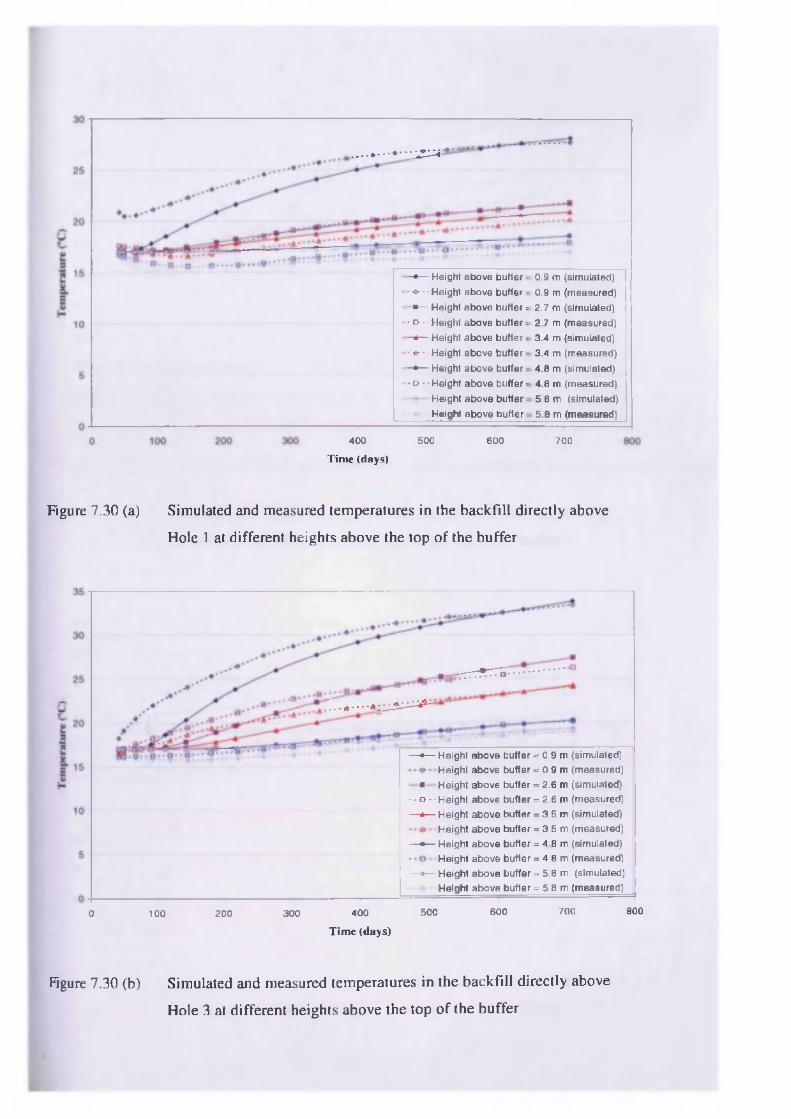
400
T im e (days)
- • — Height
- o - • Height
-■ — Height
•«»•• Height
- * — Height
- tr ■ ■ Height
- • — Height- o * - Height
Height
Height
500
above bu ffe r =
above bu ffe r =
above bu ffer =
above bu ffe r =
above bu ffe r =
above bu ffe r =
ab ove b u ffe r =
above b u ffe r =
above b u ffe r =
above bu ffe r =
600
0.9 m (simulated)
0.9 m (m easured)
2 .7 m (simulated)
2 .7 m (m easured)
3.4 m (simulated)
3.4 m (m easured)
4 .8 m (sim ulated)
4 .8 m (m easured)
5.8 m (sim ulated)
5 .8 m (m easured) 1--
700
Figure 7.30 (a) Simulated and measured temperatures in the backfill directly above
Hole 1 at different heights above the top o f the buffer
0 100 200 300 400 500 600 700 800
T im e (days)
— •— H eigh t ab ove bu ffe r = 0 .9 m (simulated) H eigh t above bu ffe r = 0 .9 m (m easured)
■ H e igh t above bu ffe r = 2 .6 m (sim ulated)
- - o • • H eigh t above bu ffe r = 2 .6 m (m easured)
— *— H eigh t ab ove bu tte r = 3 .5 m (sim ulated)
H eigh t above bu tte r = 3 .5 m (m easured)
— • — H eigh t above bu tte r = 4.8 m (sim ulated)
• H eigh t above bu tte r = 4 .8 m (m easured)
— • — H eigh t above bu tte r = 5.8 m (simulated) H eigh t above bu tte r = 5.8 m (measured)
Figure 7.30 (b) Simulated and measured temperatures in the backfill directly above
Hole 3 at different heights above the top o f the buffer
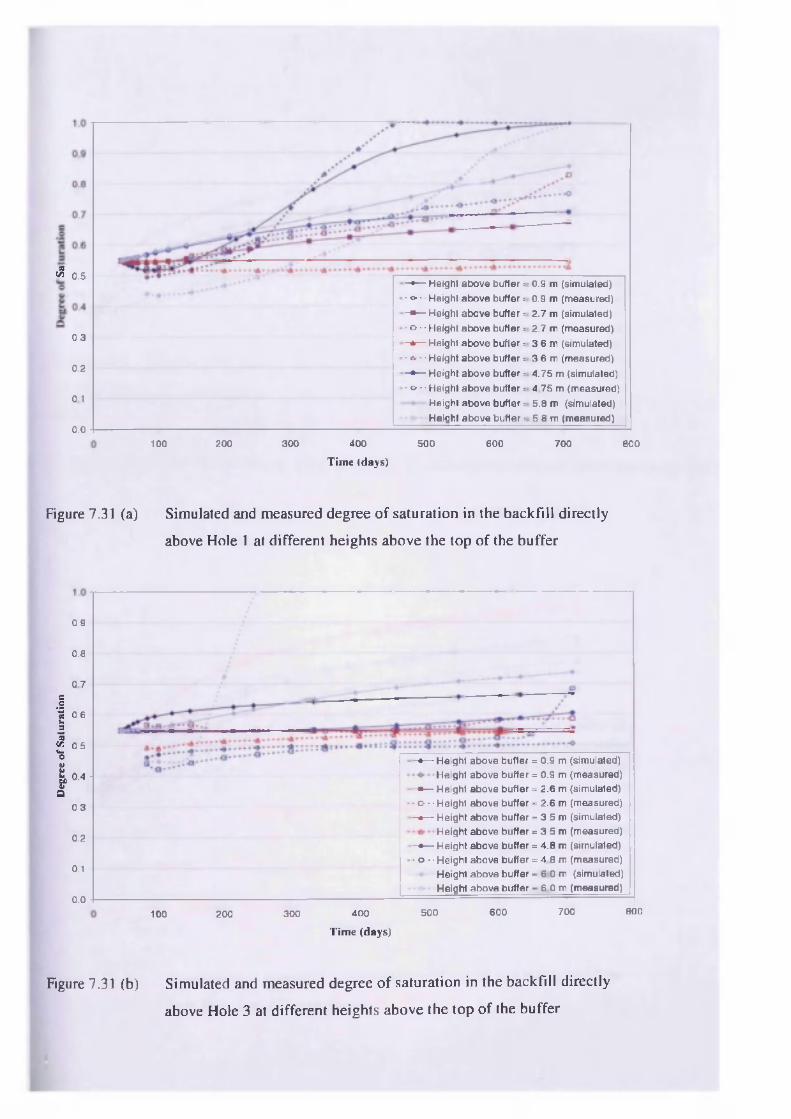
■™ 0.5
0.3
0.2
0.1
0.0
- * — Height• ■<>--Height
-■ — Height ■ o - ■ Height
- * — Height
• * - - Height
- * — Height
• O - • Height
Height
Height
above b u ffe r =
above b u ffe r =
above b u ffe r =
above b u ffe r =
above b u ffe r =
above b u ffe r =
above bu ffer =
above bu ffer =
above bu ffe r =
above bu ffe r =
0.9 m (sim ulated)
0.9 m (m easured)
2 .7 m (sim ulated)
2 .7 m (m easured)
3 .6 m (sim ulated)
3 .6 m (m easured)
4 .7 5 m (sim ulated)
4 .7 5 m (m easured)
5 .8 m (simulated)
5 .8 m (m easured)
100 200 300 400
T im e (d a y s )
500 600 700 800
Figure 7.31 (a) Simulated and measured degree o f saturation in the backfill directly
above Hole 1 at different heights above the top o f the buffer
0.9
0.8
0.7e.21 0.6b3S2 05
} “ < Q0.3
0.2
0.1
0.0
- • — Height
Height -■ — Height - o - • H eigh t
- * — H eigh t
H eigh t - • — H eigh t -£>-• Height
Height
Height
above
aboveaboveaboveaboveabove
aboveaboveaboveabove
bu ffe r = b u ffe r = b u ffe r =
bu ffe r = bu ffe r = bu ffe r = bu ffe r = bu ffe r = bu ffe r =
bu ffe r =
0 .9 m (simulated) 0 .9 m (m easured)2 .6 m (sim ulated)2 .6 m (m easured)3 .5 m (sim ulated)3 .5 m (m easured)
4 .8 m (sim ulated)4 .8 m (m easured) 6 .0 m (simulated) 6 0 m (m easured)
100 200 300 400
T im e (d a y s )
500 600 700 800
Figure 7.31 (b) Simulated and measured degree o f saturation in the backfill directly
above Hole 3 at different heights above the top o f the buffer
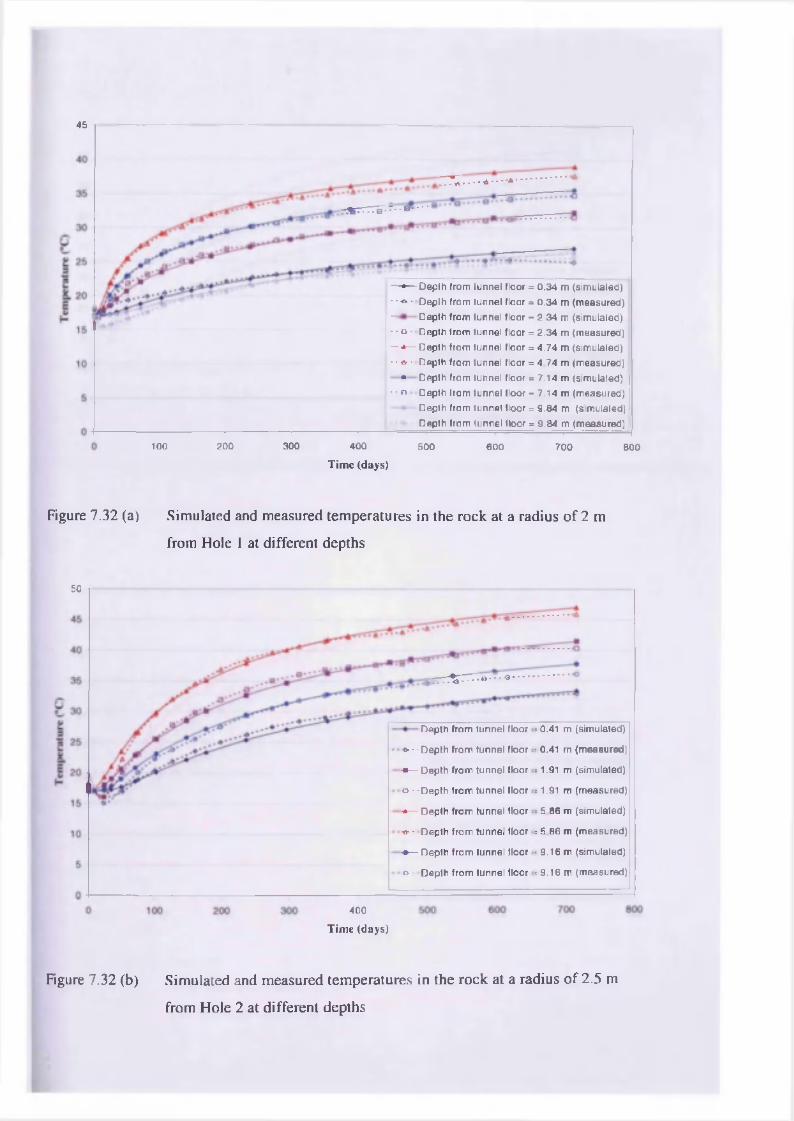
45
— •— D eplh from tunne l floo r = 0.34 m (simulated)
• - o - Depth from tunne l floo r = 0 .34 m (m easured)
— Dept h from tunnel floo r = 2 .34 m (simulated)
- - o ■ • D epth from tunnel floo r = 2 .34 m (measured)
— *— D epth from tunnel floo r = 4 .74 m (simulated)
! - • * • • D epth from tunnel floo r = 4 .74 m (measured)
• D epth from tunne l floo r = 7 .14 m (simulated)
•• o ■ D epth from tunne l floo r = 7.14 m (m easured)
— •— D epth from tunne l floo r = 9.84 m (simulated)
D epth from tunne l floo r = 9 .84 m (m easured)-------------- 1----------------------- ;----------------------- i-----------------------
100 200 300 400 500 600 700 800
T im e (d a ys )
Figure 7.32 (a) Simulated and measured temperatures in the rock at a radius o f 2 m
from Hole 1 at different depths
D epth from tunne l floo r
■o • - D epth fro m tunne l floo r
-■— D epth from tunne l floo r
° • - Depth from tunne l floo r
■*— Depth from tunne l floor
*■ - • D epth from tunne l floor
■*— D epth fro m tunne l floor
o ■ ■ D epth fro m tunne l floo r
= 0.41 m (simulated)
= 0.41 m (m easured)
= 1.91 m (simulated)
: 1.91 m (m easured)
: 5 .86 m (simulated)
= 5.86 m (measured)
= 9 .16 m (simulated)
= 9 .16 m (measured)
400
T im e (days)
50
Figure 7.32 (b) Simulated and measured temperatures in the rock at a radius o f 2.5 m
from Hole 2 at different depths
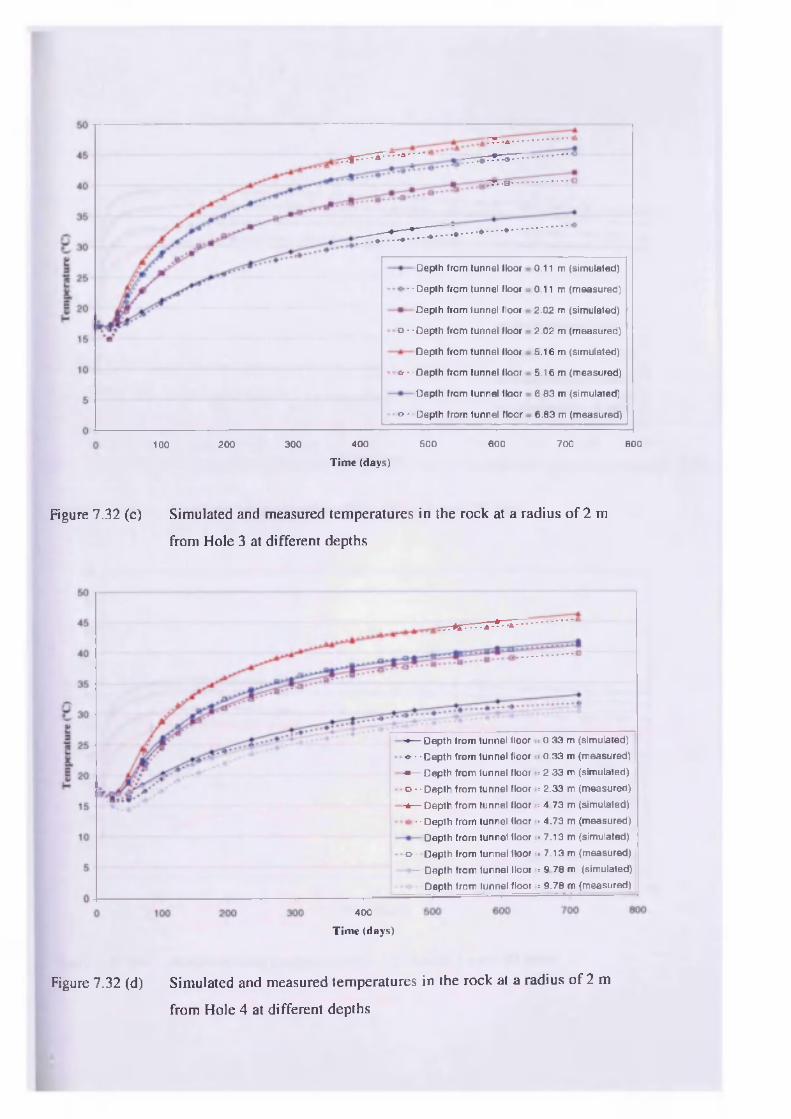
D eplh from tunne l floor
• ■ Depth from tunnel floor
Depth from tunnel floor
r> - • Depth from tunne l floor
Depth from tunne l floor
tr - • Depth from tunne l floor
Depth from tunne l floor
o - Depth from tunne l floo r
0.11 m (sim ulated)
0.11 m (m easured)
2.02 m (sim ulated)
2.02 m (measured)
5.16 m (sim ulated)
5.16 m (m easured)
6.83 m (simulated)
6.83 m (m easured)
100 200 300 400
T im e (d a ys )
500 600 700 800
Figure 7.32 (c) Simulated and measured temperatures in the rock at a radius o f 2 m
from Hole 3 at different depths
-«— D epth from
«- • - D epth from
« — D epth from
o - - D epth from
-*— D epth from
• • D epth from
D epth from
o • • D epth from
- D epth from
D epth from
tunne l floor
tun ne l floor
tunne l floor
tunne l floo r
tunne l floo r
tunne l floo r
tunne l floor
tunne l floor
tunne l floor
tunne l floor
: 0 .33 m (simulated)
: 0 .33 m (m easured)
: 2 .33 m (sim ulated)
; 2 .33 m (m easured)
: 4 .73 m (sim ulated)
: 4 .73 m (m easured)
= 7.13 m (simulated)
= 7 .13 m (m easured)
= 9 .78 m (sim ulated)
= 9 .78 m (m easured)
400
T im e (d a y s )
Figure 7.32 (d) Simulated and measured temperatures in the rock at a radius o f 2 m
from Hole 4 at different depths
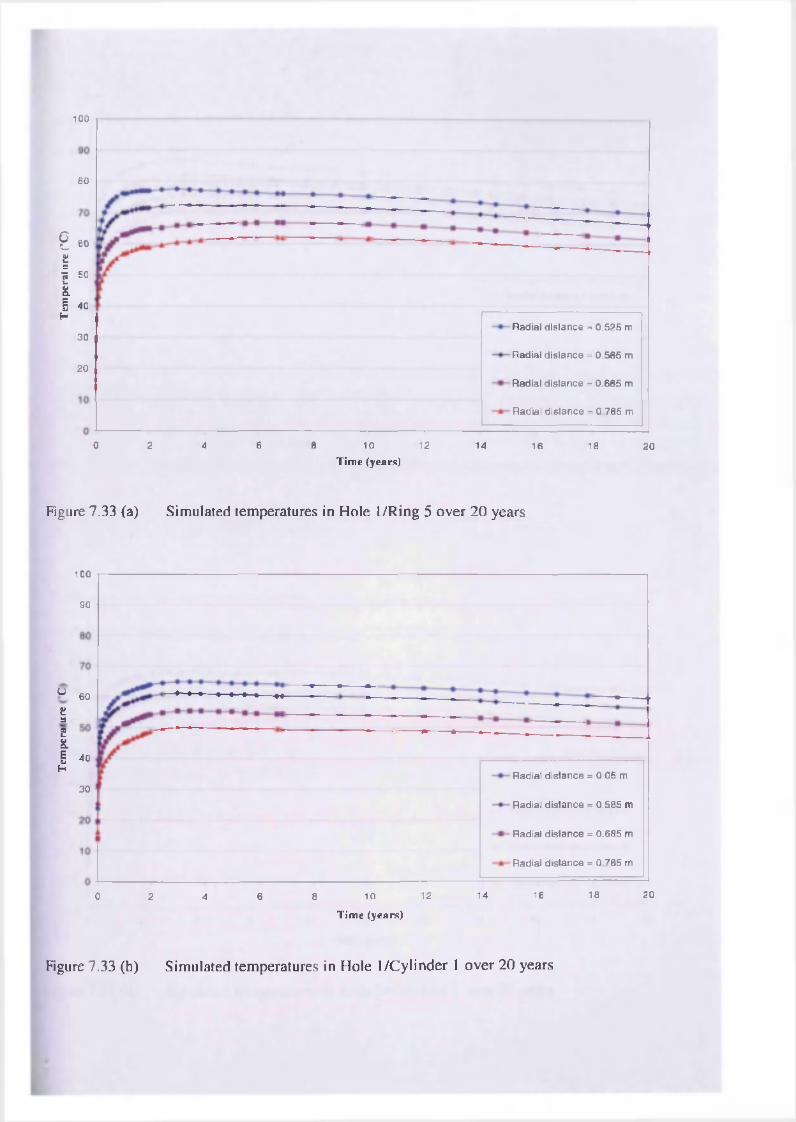
100
80
g£=
60
5 50im6i 40 H
Radia l d is tance = 0 .525 m30
Radia l d is tance = 0 .585 m20
Radia l d is tance = 0 .685 m
Radia l d is tance = 0 .785 m
0 2 4 6 8 1210 14 1816 20Tim e (years)
Figure 7.33 (a) Simulated temperatures in Hole l/R ing 5 over 20 years
100
90
u 60
£3E&1 40H
Radia l d is tance = 0.05 m30
Radia l d is tance = 0.585 m
Radia l d is tance = 0.685 m
Radial d is tance = 0.785 m
18 2014 160 122 6 8 104
T im e (years)
Figure 7.33 (b) Simulated temperatures in Hole l/C y lin de r 1 over 20 years
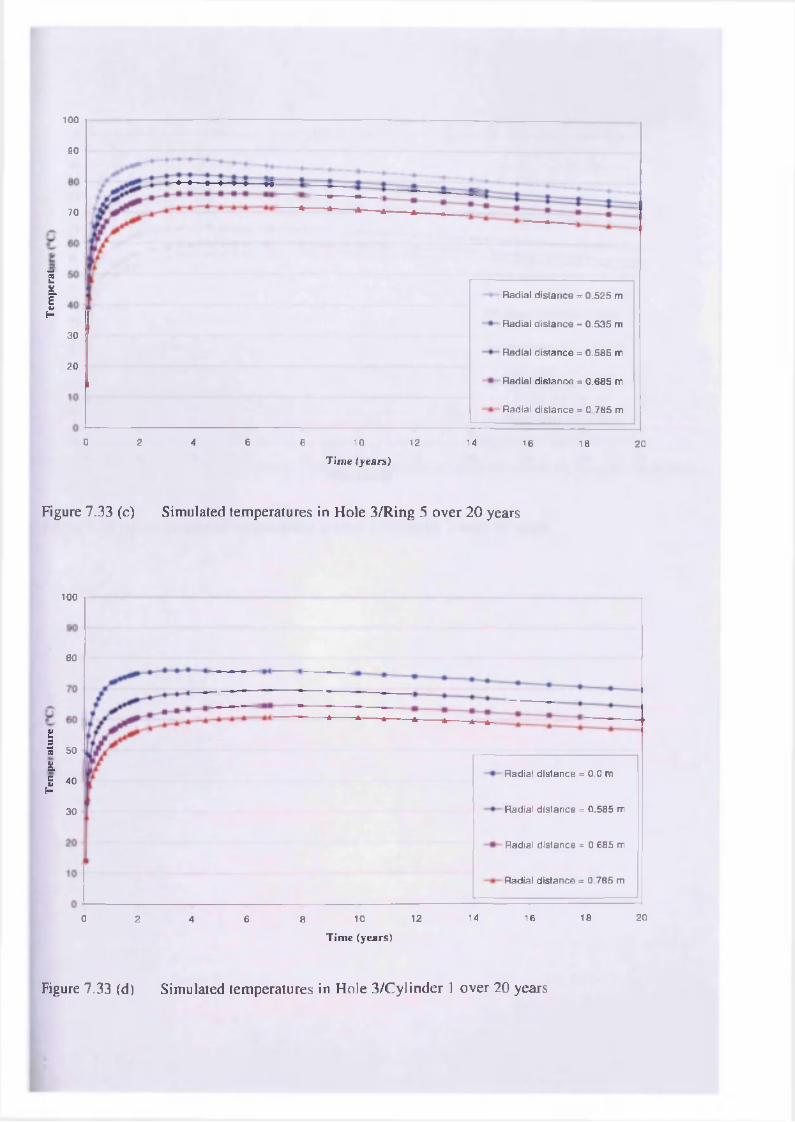
100
90
70
B&E£
Radial d is tance = 0 .525 m
R adia l d is tance = 0 .535 m30
R adia l d is tance = 0 .585 m20
R adia l d is tance = 0 .685 m
Radial d is tance = 0 .7 85 m
0 2 4 6 8 10 12 14 16 18 20T im e (years)
Figure 7.33 (c) Simulated temperatures in Hole 3/Ring 5 over 20 years
100
80
t33 50
&§ 40f-
Radial d is tance = 0.0 m
Radial d is tance = 0.585 m30
Radial d is tance = 0.685 m
Radial d is tance = 0 .785 m
14 18 200 12 162 4 6 8 10T im e (years)
Figure 7.33 (d) Simulated temperatures in Hole 3 /C ylinder l over 20 years
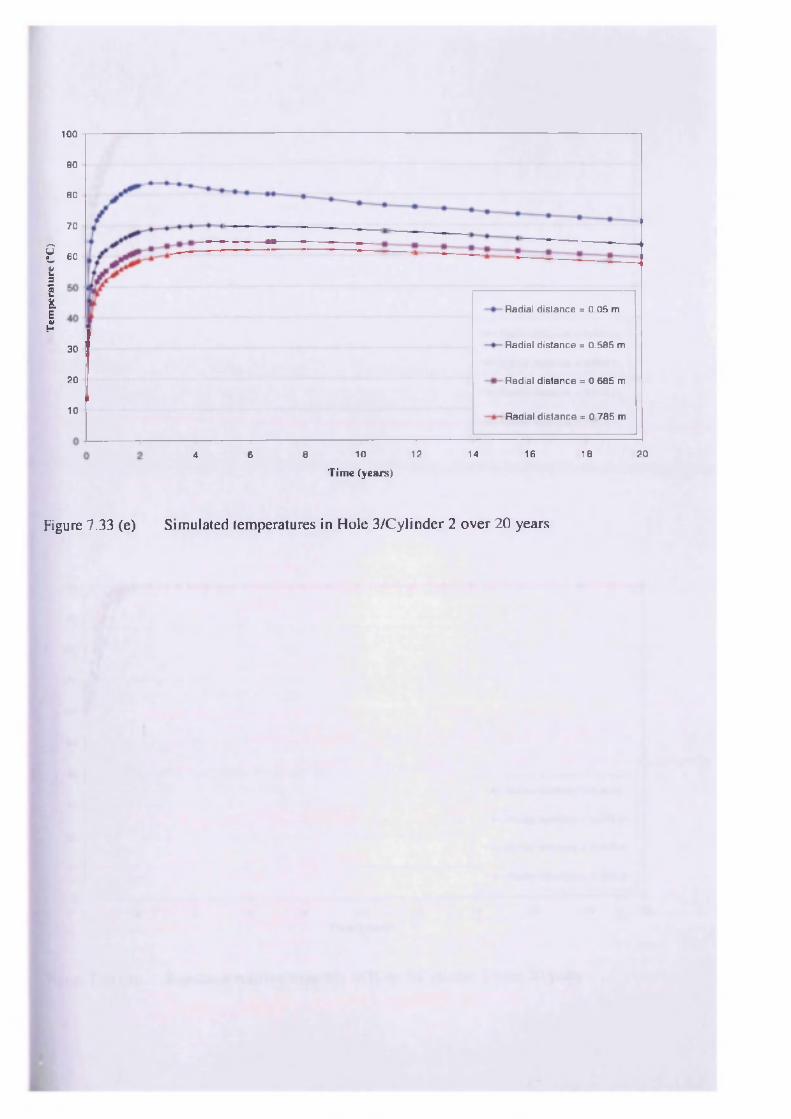
Tem
pera
ture
(”
C)
100
90
80
70
60
Radial d is tance = 0 .05 m
R adia l d is tance = 0 .585 m30
20 Radial d is tance = 0.685 m
10 R adia l d is tance = 0 .785 m
12 14 16 18 206 8 104
Tim e (years)
Figure 7.33 (e) Simulated temperatures in Hole 3/Cylinder 2 over 20 years
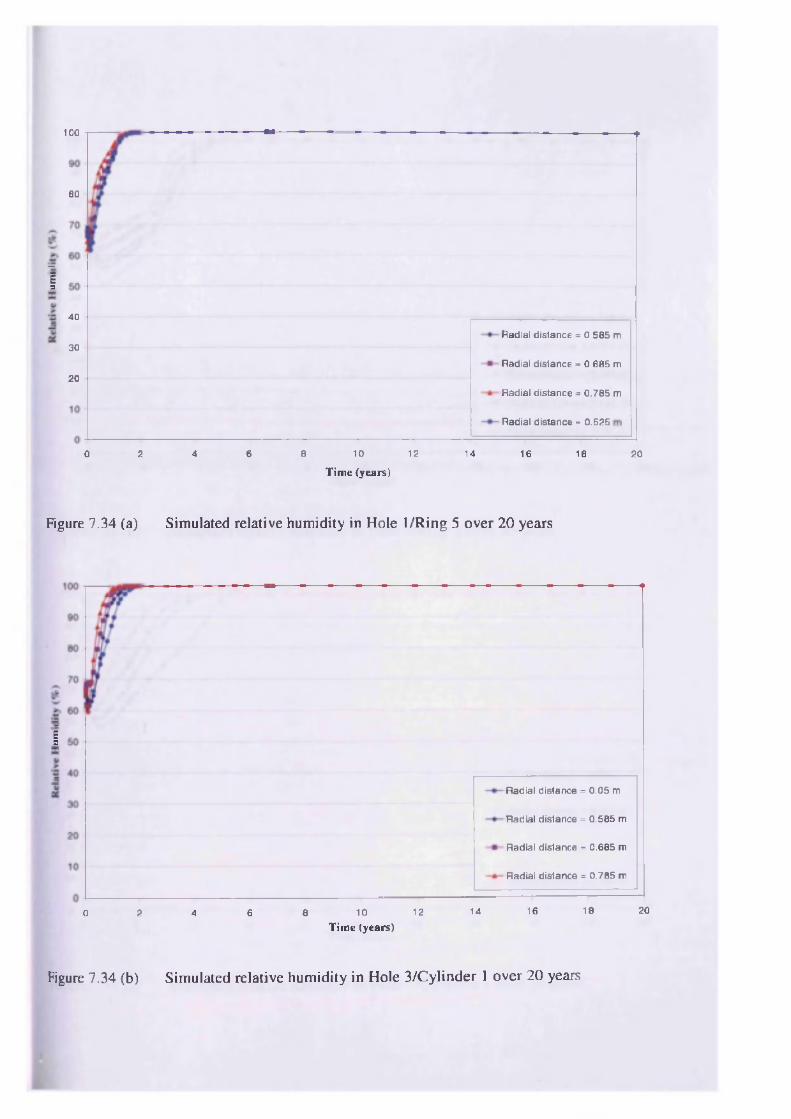
100
80
-1=
40
Radial distance = 0 .585 m30
Radial distance = 0 .685 m
20R adia l d is tance = 0 .785 m
R adia l d is tance = 0.525
100 2 4 6 8 12 14 16 18 20T im e (y e a rs )
Figure 7.34 (a) Simulated relative humidity in Hole 1/Ring 5 over 20 years
E=
R adia l d is tance = 0 .05 m
R adia l d is tance = 0 .585 m
R adia l distance = 0 .685 m
Radial d is tance = 0 .785 m
18 20161410 120 2 4 6 8T im e (y e a rs )
Figure 7.34 (b) Simulated relative hum id ity in Hole 3 /C ylinder 1 over 20 years
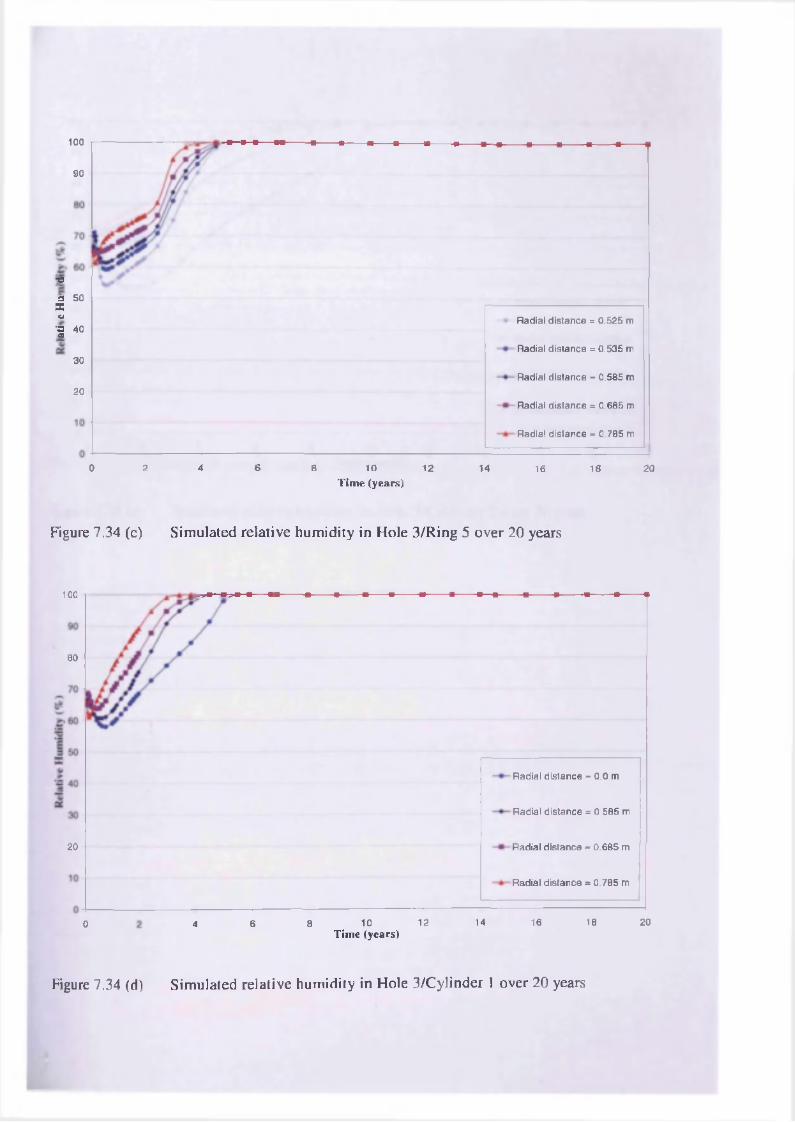
100
90
■ca 50
X41
•S 40<8
30
Radial d istance = 0.525 m
Radial d istance = 0.535 m
Radial d istance = 0.585 m
20Radial d istance = 0.685 m
Radial d istance = 0.785 m
0 4 62 8 10 12 14 16 18 20T im e (y e a rs )
Figure 7.34 (c) Simulated relative humidity in Hole 3/Ring 5 over 20 years
100
80
Radial d istance = 0 .0 m
Radial d istance = 0.585 m
20 Radial d istance = 0.685 m
Radial d istance = 0.785 m
2012 14 16 18106 80 4T im e (y e a rs )
Figure 7.34 (d) Simulated relative hum id ity in Hole 3/Cylinder l over 20 years
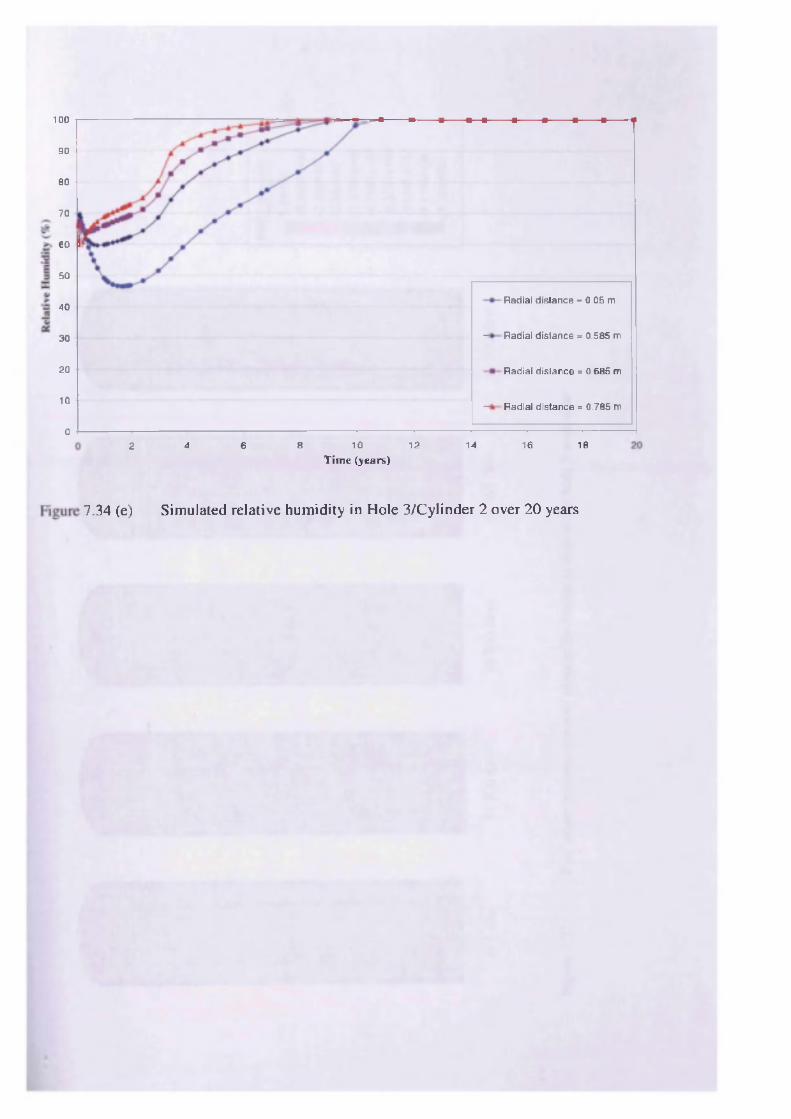
100
90
80
70
60
50
40
30
20
10
0
Radial d is lance = 0.05 m
— Radial distance = 0.585 m
Radial d is lance = 0.685 m
— Radial d is tance = 0.785 m
2 4 6 8 10 12 14 16 18
T im e (y e a rs )
7.34 (e) Simulated relative humidity in Hole 3/Cylinder 2 over 20 years
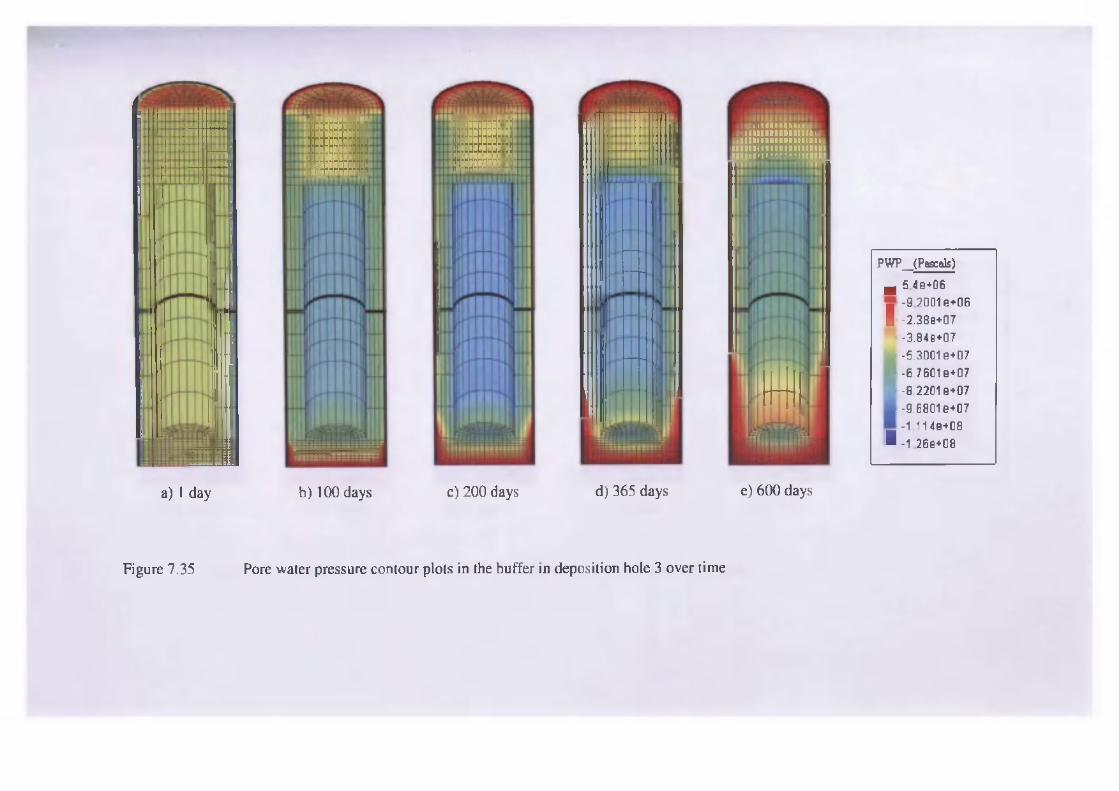
b) 100 days c) 200 days d) 365 days e) 600 days
niuim iiiiimn. l U I I I M H I I I I I I I M ii l l l i i i m m m i i i i
l l l l l l l l l l l l l l l l l l l l l ll l l l l l l l l l l l l l l l l l l l l l
PWP__(Pascals)
■ 5.4e+06
-9.2001 e+06
1 -2 .38e+07
-3.84e+07
-5.3001 e+07
-6.7601 e+07
-8.2201 e+07
-9.68Q1e+07
- 1 .1 1 4e+081 -1.26e+08
a) 1 day
Figure 7.35 Pore water pressure contour plots in the buffer in deposition hole 3 over time
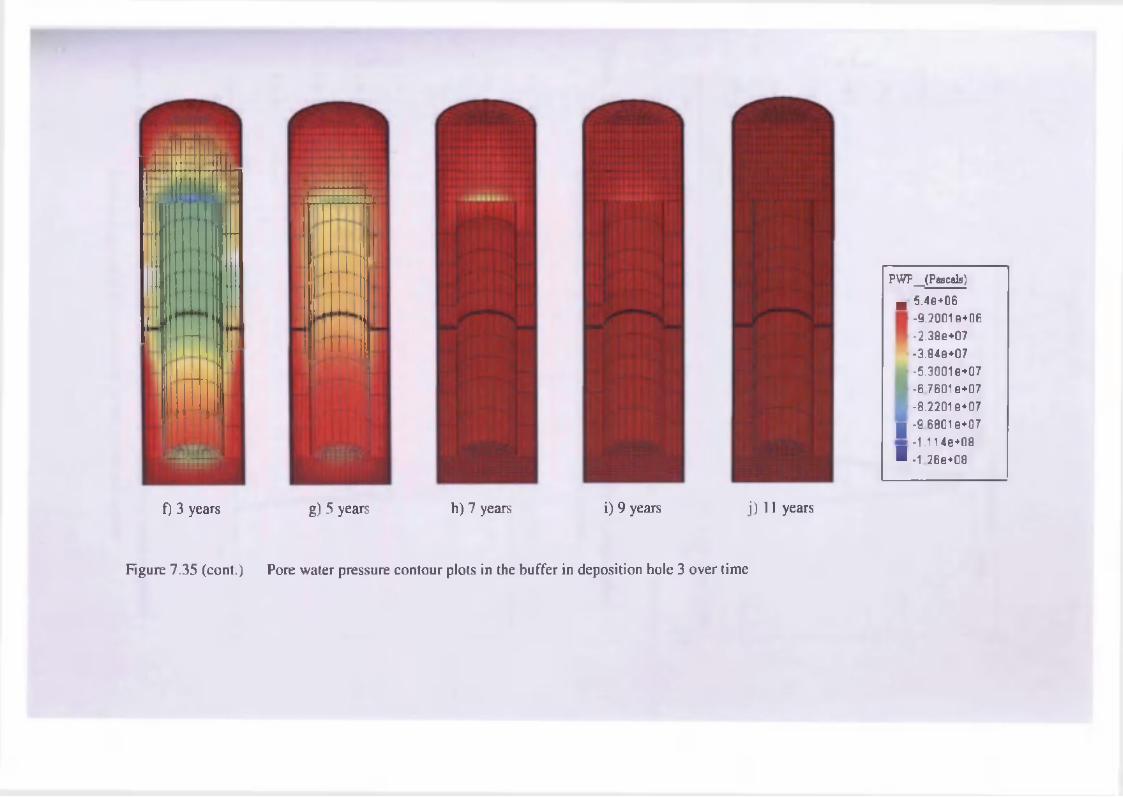
g) 5 years h) 7 years i) 9 years j) 11 years
Pore water pressure contour plots in the buffer in deposition hole 3 over time
PWP__(Pascals)
H 5.4e+06
-9.2001 e+06
-2.38e+07
-3.84e+07
-5.3001 e+07
-6.7601 e+07
-8.2201 e+07
i-9.6801 e+07
-1.114e+08■ -1 26e+08
f) 3 years
Figure 7.35 (cont.)
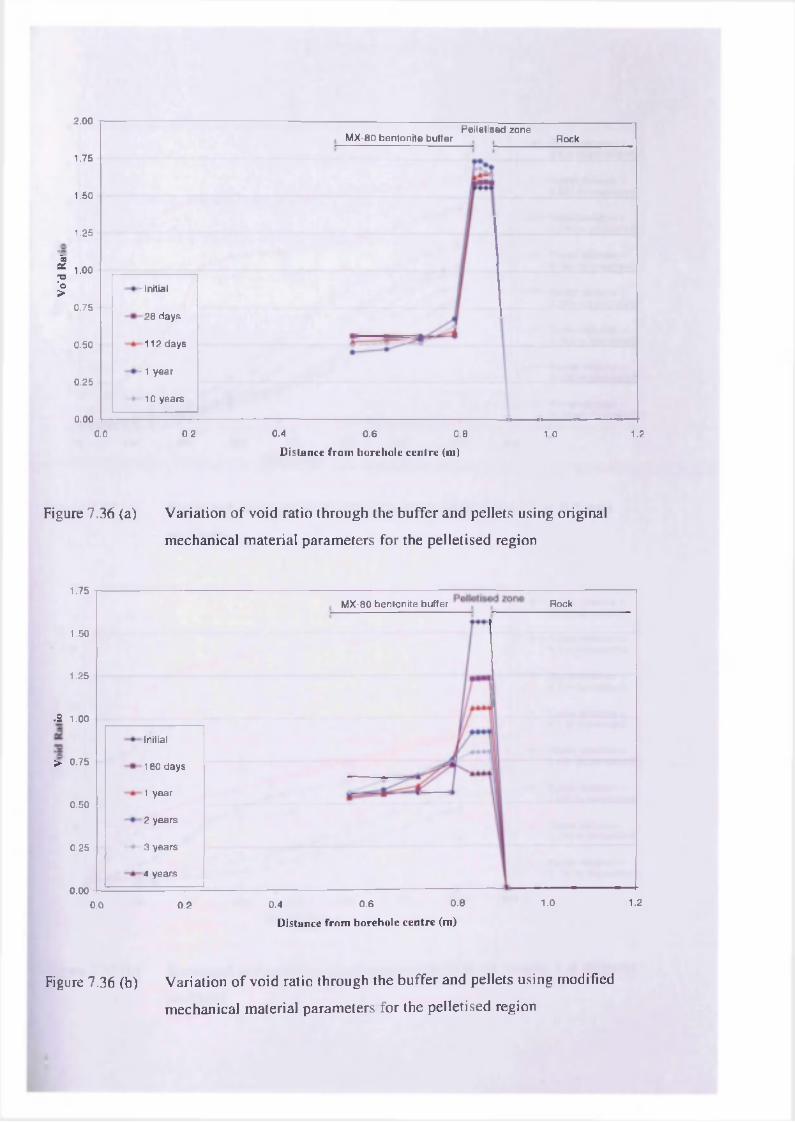
2.00
1.75
1.50
1.25
I , .■o"o>00
0.75
0.50
0.25
0.00
-In itia l
-2 8 days
-1 1 2 days
-1 year
10 years
M X -80 b en ton ite bu fferPalletised zone
Rock
0.0 0.2 0.4 0 .6 0.8
D is ta n c e f r o m b o re h o le c e n tre (m )
1.0 1.2
Figure 7.36 (a) Variation o f void ratio through the buffer and pellets using original
mechanical material parameters for the pelletised region
1.75M X -80 ben ton ite bu ffer Rock
1.50
1.25
.2 1.00
Initial
> 0.75 180 days
1 year0.50
2 years
3 years0.25
4 years
0.000.8 1.0 1.20.60.40.0 0.2
D is ta n c e f r o m b o re h o le c e n tre (m )
Figure 7.36 (b) Variation o f void ratio through the buffer and pellets using modified
mechanical material parameters fo r the pelletised region
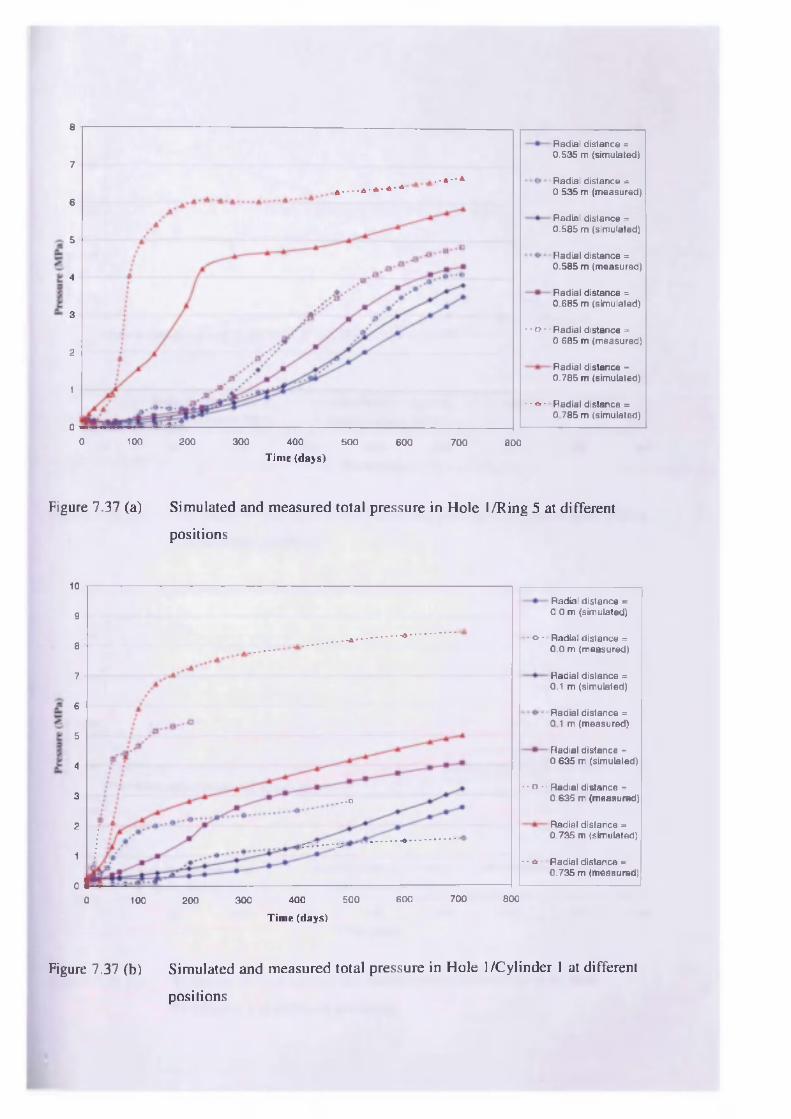
8Radial distance = 0.535 m (simulated)
7
* . . . . * • * - a - * ' ’■*"* Radial distance = 0.535 m (measured)
6
Radial distance = 0.585 m (simulated)
5
Radial distance = 0.585 m (measured)
4
Radial distance = 0.685 m (simulated)
3
-•£»•• Radial distance = 0.685 m (measured)
2
Radial distance = 0.785 m (simulated)
1
-■ex- Radial distance = 0.785 m (simulated)
00 100 200 300 400 500 600 700 800
T im e (d a y s )
Figure 7.37 (a) Simulated and measured total pressure in Hole 1/Ring 5 at different
positions
10
Radial distance = 0 .0 m (simulated)9
• - » - • Radial distance = 0 .0 m (measured)8
Radial distance = 0.1 m (simulated)
7
6Radial distance = 0.1 m (measured)
5Radial distance = 0.635 m (simulated)4
--£>•• Radial distance = 0.635 m (measured)3 . - - o
Radial distance = 0.735 m (simulated)
2
1 • - * - • Radial distance = 0.735 m (measured)
0700 800500 6000 100 300 400200
T im e (d a y s )
Figure 7.37 (b) Simulated and measured total pressure in Hole l/C y linder 1 at different
positions
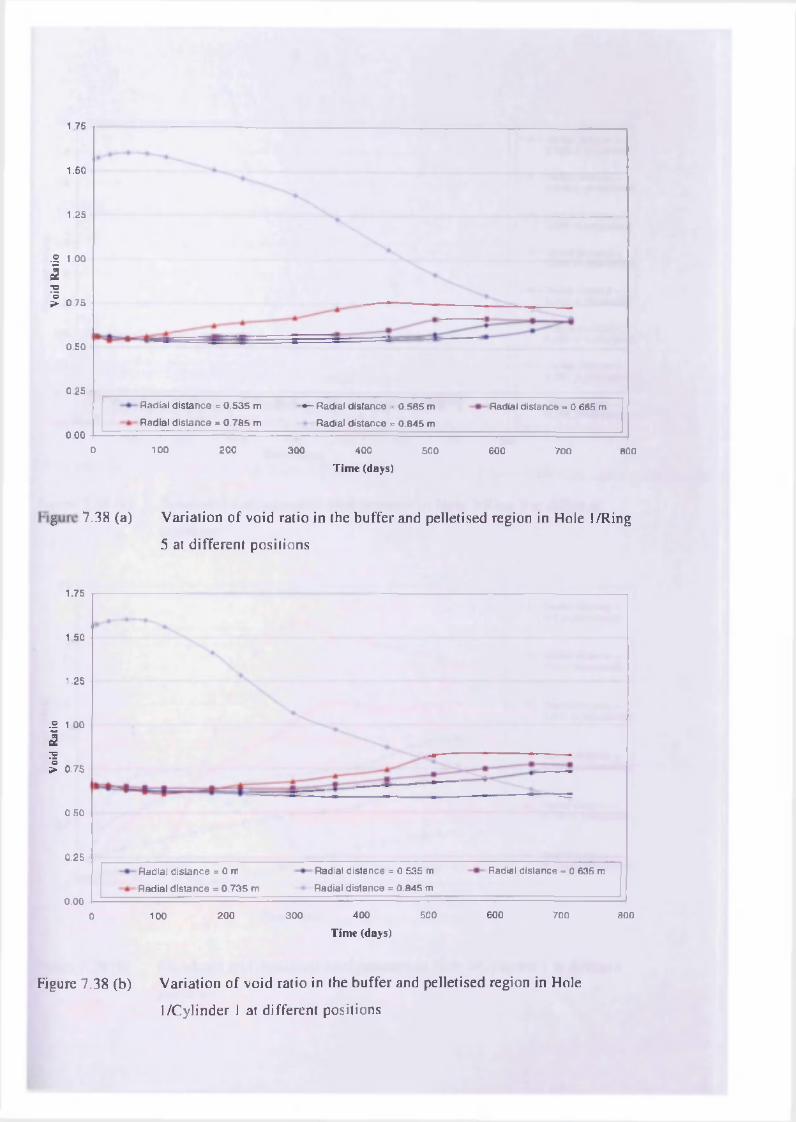
Void
Ra
tio
TO Vo
id
Rat
io
1.75
1.50
1.25
1.00
0.75
0.50
0.25
R adia l d is tance = 0 .5 35 m
R adia l d is tance = 0 .7 85 m
♦— Radial d is tance = 0 .585 m
Radial d is tance = 0 .845 m
R adial distance = 0.685 m
0.000 100 200 300 400 500 600 700 800
T im e (days)
7.38 (a) Variation o f void ratio in the buffer and pelletised region in Hole 1/Ring
5 at different positions
1.75
1.50
1.25
1.00
0.75
0.50
0.25R adial d is tance = 0.535 m
R adial d is tance = 0 .845 m
Radial distance = 0.635 mR adia l d is tance = 0 m
R adia l d is tance = 0 .7 35 m0.00
400 500 600 700200 300 8000 100
T im e (days)
Figure 7.38 (b) Variation o f void ratio in the buffer and pelletised region in Hole
1/Cylinder 1 at different positions
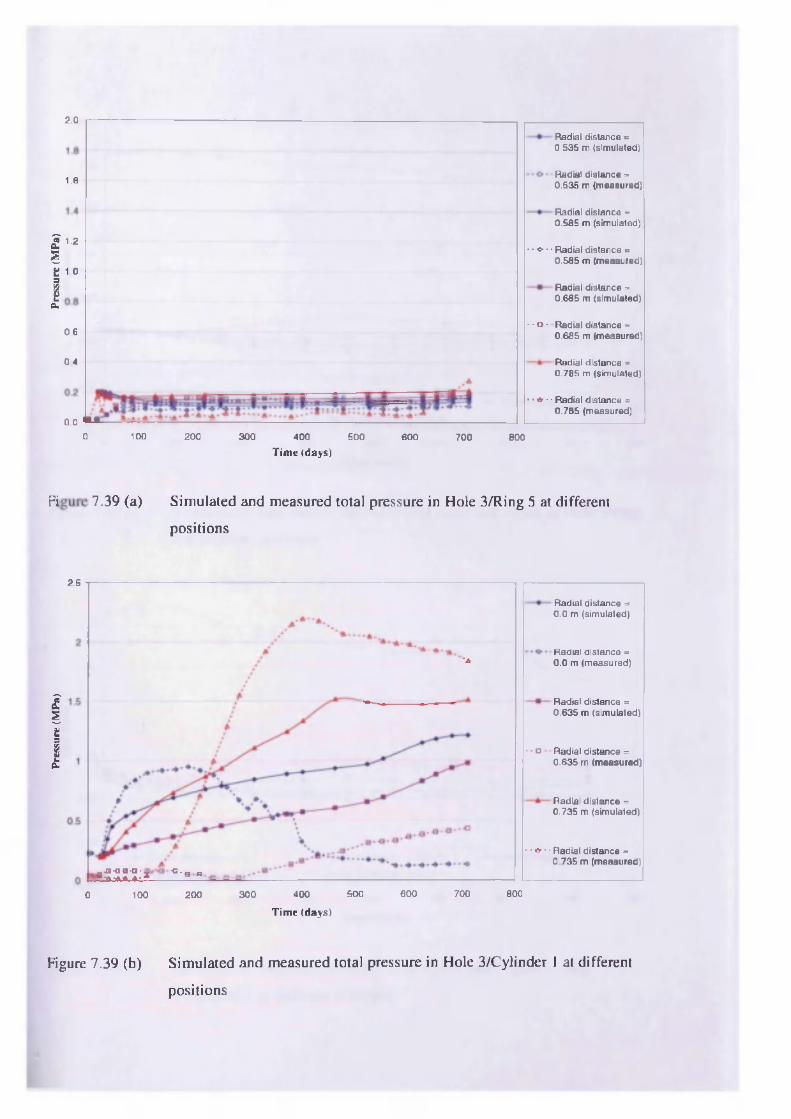
Pres
sure
(M
Pa)
2?
Pres
sure
(M
Pa)
2.0Radial dislance = 0.535 m (simulated)
Radial distance = 0.535 m (measured)1.6
Radial distance = 0.585 m (simulated)
1.2• •«• • • Radial distance =
0.585 m (measured)1.0
Radial distance = 0.685 m (simulated)
••«»•• Radial distance = 0.685 m (measured)0.6
0.4 Radial distance = 0.785 m (simulated)
• - * - ■ Radial distance = 0.785 (measured)
0.0 ® °
0 100 200 300 400 500 600 700 800
Tim e (days)
7.39 (a) Simulated and measured total pressure in Hole 3/Ring 5 at different
positions
2.5
Radial distance = 0.0 m (simulated)
Radial distance = 0.0 m (measured)*a
Radial distance = 0.635 m (simulated)
- - o Radial distance = 0.635 m (measured)
Radial distance = 0.735 m (simulated)
• ■ * • • Radial distance = 0.735 m (measured)•G-OG-I3- -Q - R
« - A - A A A - S °
500 600 700 800300 4000 100 200
Time (days)
Figure 7.39 (b) Simulated and measured total pressure in Hole 3/Cylinder l at different
positions
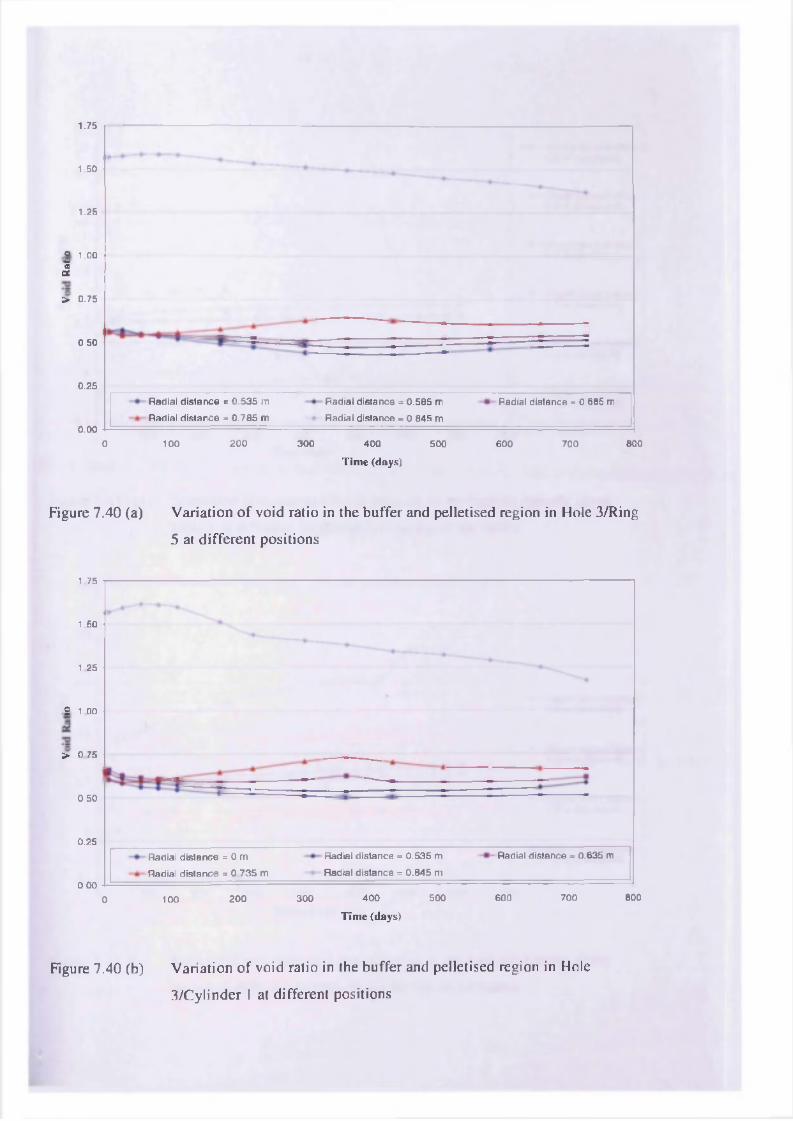
1.75
1.50
1.25
® 1.00
I
> 0.75
0.50
0.25
Radial d is tance = 0 .535 m
Radial d is tance = 0 .785 m
Radial d istance = 0.585 m
Radial d istance = 0.845 m
Radial d istance = 0.685 m
0.00200 300 8000 100 400 500 600 700
Tim e (days)
Figure 7.40 (a) Variation o f void ratio in the buffer and pelletised region in Hole 3/Ring
5 at different positions
1.75
1.50
1.25
.2 1.00
> 0.75
0.50
0.25Radial distance = 0.635 mRadial d istance = 0.535 m
Radial d istance = 0.845 m
Radial d is tance = 0 m
Radial d is tance = 0 .735 m0.00
800400 500 600 700200 3000 100
T im e (days)
Figure 7.40 (b) Variation o f void ratio in the buffer and pelletised region in Hole
3/Cylinder l at different positions
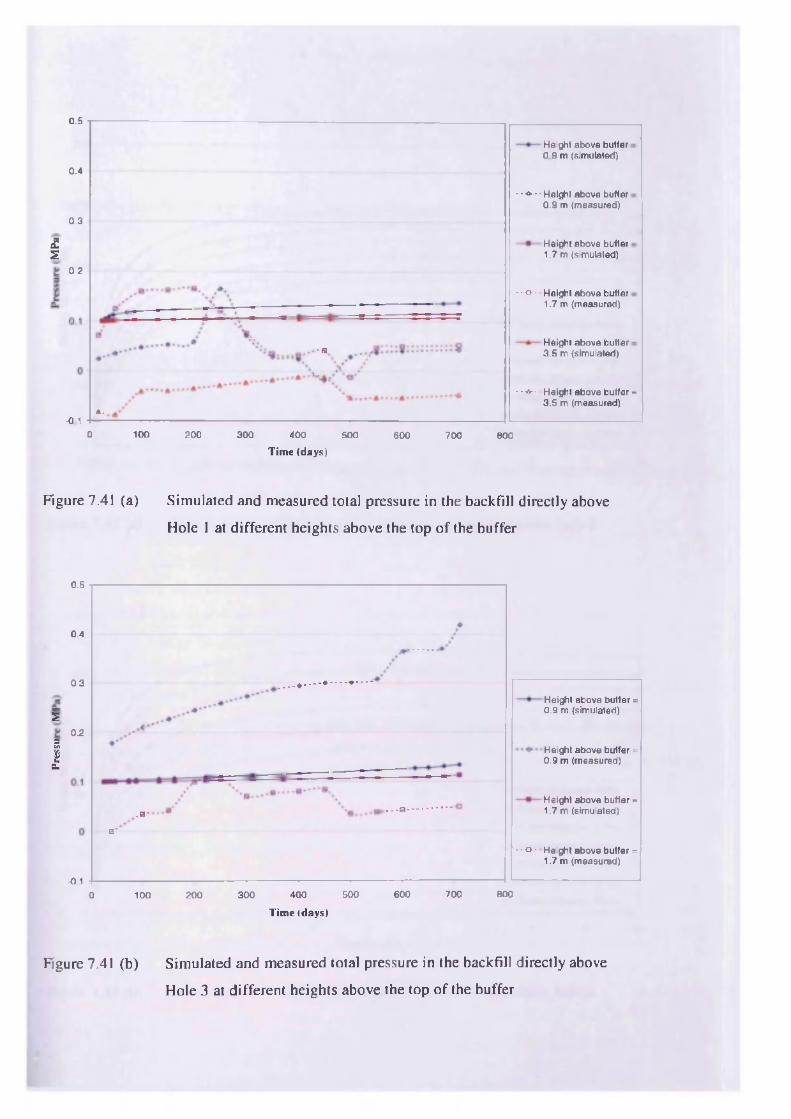
0.5
Heighl above buffer 0 .9 m (simulated)
0.4
• •<>•• Height above buffer 0.9 m (measured)
0.3
£s
Heighl above buffer 1.7 m (simulated)
0 2
• • o • Heighl above buffer 1.7 m (measured)
Heighl above buffer 3.5 m (simulated)- s
- - * ■ Height above buffer = 3.5 m (measured)
A .-0.1
0 100 200 300 400 500 600 700 800
Time (days)
Figure 7.41 (a) Simulated and measured total pressure in the backfill directly above
Hole 1 at different heights above the top o f the buffer
0.5
0.4
0.3
Height above buffer = 0.9 m (simulated)S
0.23MI£
Heighl above buffer = 0 .9 m (measured)
Height above buffer = 1.7 m (simulated). 0 -
a"
-•<>■• Height above buffer = 1.7 m (measured)
- 0.1400 500 600 700 8000 200 300100
Tim e (days)
Figure 7.41 (b) Simulated and measured total pressure in the backfill directly above
Hole 3 at d ifferent heights above the top o f the buffer

250
200
150
Radial distance = 0 .9 m‘■ 3 100
Radial distance = 1.2 m
Radial distance = 1.4 m
Radial distance = 1.9 m
Radial distance = 2 .5 m
Radial distance = 3 .0 m
Radial distance = 3 .5 m
9 102 3 4 5 6 7 81
T im e (ye a rs )
Figure 7.42 (a) Development o f radial stress in the rock near to deposition hole 1
250
200
5 150
Radial distance = 0 .9 m•■ = 100
Radial distance = 1.2 m
Radial distance = 1.4 m
Radial distance = 1.9 m
Radial distance = 2 .5 m
Radial distance = 3.0 m
Radial distance = 3 .5 m
7 9 106 854
T im e (ye a rs )
Figure 7.42 (b) Development o f radial stress in the rock near to deposition hole 3
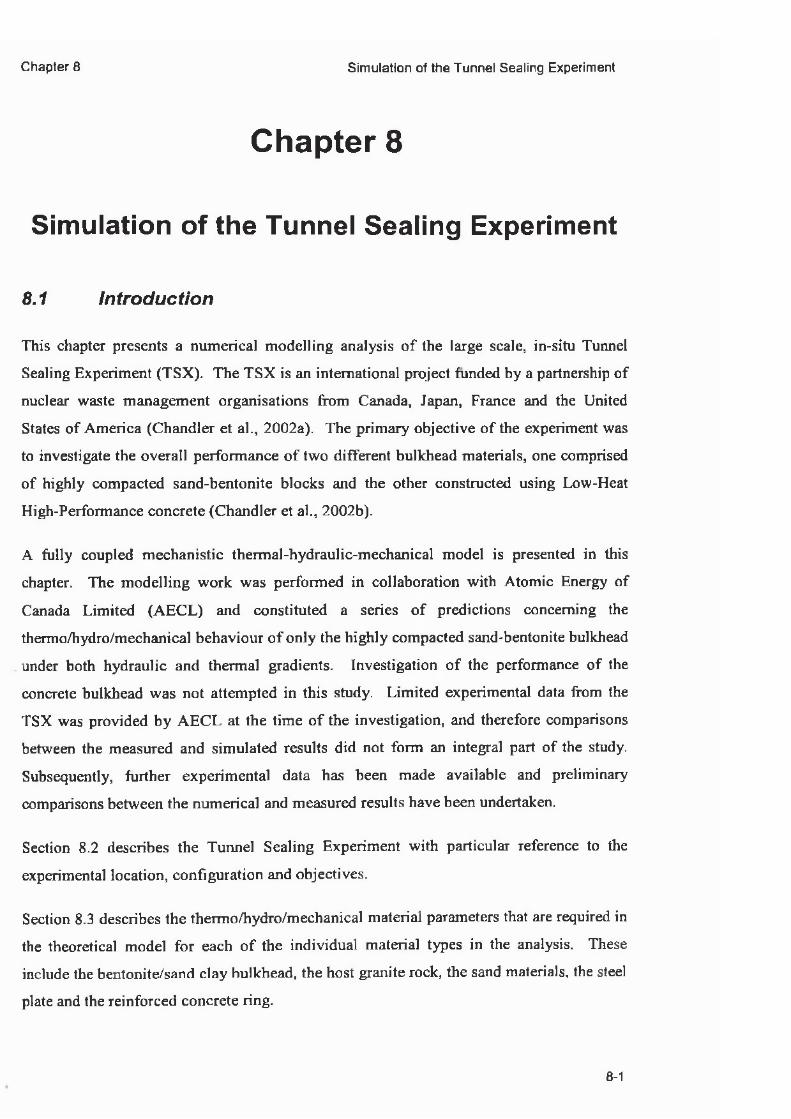
Chapter 8 Simulation of the Tunnel Sealing Experiment
Chapter 8
Simulation of the Tunnel Sealing Experiment
8.1 introduction
This chapter presents a numerical modelling analysis o f the large scale, in-situ Tunnel
Sealing Experiment (TSX). The TSX is an international project funded by a partnership o f
nuclear waste management organisations from Canada, Japan, France and the United
States o f America (Chandler et al., 2002a). The primary objective o f the experiment was
to investigate the overall performance o f two different bulkhead materials, one comprised
o f highly compacted sand-bentonite blocks and the other constructed using Low-Heat
High-Performance concrete (Chandler et al., 2002b).
A fu lly coupled mechanistic thermal-hydraulic-mechanical model is presented in this
chapter. The modelling w ork was performed in collaboration w ith Atomic Energy o f
Canada Lim ited (AEC L) and constituted a series o f predictions concerning the
thermo/hydro/mechanical behaviour o f only the highly compacted sand-bentonite bulkhead
under both hydraulic and thermal gradients. Investigation o f the performance o f the
concrete bulkhead was not attempted in this study. Lim ited experimental data from the
TSX was provided by A E C L at the time o f the investigation, and therefore comparisons
between the measured and simulated results did not form an integral part o f the study.
Subsequently, further experimental data has been made available and preliminary
comparisons between the numerical and measured results have been undertaken.
Section 8.2 describes the Tunnel Sealing Experiment w ith particular reference to the
experimental location, configuration and objectives.
Section 8.3 describes the thermo/hydro/mechanical material parameters that are required in
the theoretical model fo r each o f the individual material types in the analysis. These
include the bentonite/sand clay bulkhead, the host granite rock, the sand materials, the steel
plate and the reinforced concrete ring.
8-1

Chapter 8 Simulation of the Tunnel Sealing Experiment
Sections 8.4, 8.5 and 8.6 present the work undertaken for the simulation o f Pre-Phase I,
Phase 1 and Phase II respectively. These include a description o f the initial and boundary
conditions employed, details o f the simulation numerics and a presentation o f all the results
produced for the range o f coupled analyses performed.
In Section 8.7 prelim inary comparisons o f the simulated and experimental behaviour are
made. This focuses principally on the hydraulic and thermal behaviour o f the clay
bulkhead and the associated deformation behaviour.
Finally, in Section 8.8 the overall conclusions from the simulation work are presented.
8-2
Chapter 8 Simulation o f the Tunnel Sealing Experiment
8.2 The Tunnel Sealing Experiment
The Tunnel Sealing Experiment is being performed at Atomic Energy o f Canada Limited’ s
(AECL) Underground Research Laboratory (URL) by an international partnership
representing Japan, France, the United States and Canada. The TSX is located at the 420
m level o f the U R L in the granite rock o f the Precambrian Canadian Shield and can be seen
in Figure 8.1. The experiment involved the construction o f two fu ll scale tunnel seals at
either end o f a single excavated tunnel. One o f the bulkheads was an assembly o f pre
compacted sand-bentonite blocks and the second was fabricated using a single cast o f
Low-Heat High-Performance concrete. A permeable sand f i l l was installed in the chamber
between the two bulkheads. The experimental configuration is shown in Figure 8.2.
The experiment is divided into a number o f phases. In the first phase the bulkheads were
constructed and the sand-filled chamber was incrementally pressurised w ith water at
ambient temperature over a period o f time up to 4 MPa pore water pressure, fo llow ing the
pressure profile shown in Figure 8.3. This allowed the performance o f each o f the
bulkheads under hydraulic flows to be monitored and evaluated. In the second phase,
currently in progress, heated water is circulated through the sand-filled chamber. This
phase has been conducted in two Stages. In Stage 1 the water was heated to a target
temperature o f 50 °C and maintained fo r a year. In Stage 2, which is currently in progress,
the temperature has been increased to 85 °C and is expected to be maintained for a further
year. This w ill a llow the performance o f the bulkheads and host rock to be evaluated
based on the influence o f elevated temperatures in the sand chamber.
The Tunnel Sealing Experiment has been designed and constructed to characterise the
sealing potential o f well-constructed, fu ll scale bulkheads under representative hydraulic
and thermal conditions. The primary objective o f the experiment as defined by Chandler et
al. (2002b) is “ to assess the applicability o f technologies fo r construction o f practicable
concrete and bentonite bulkheads; to evaluate the performance o f each bulkhead; and to
identify and document the parameters that affect that performance” . In this context,
performance was defined as the ab ility o f the bulkheads to restrict the flow o f water in the
axial direction o f the tunnel. However, Chandler et al. (2002b) did recognise that the most
important characteristic o f a seal in the role o f waste isolation is its ability to lim it the
transport o f radionuclides.
8-3
Chapter 8 Simulation of the Tunnel Sealing Experiment
8.3 Material parameters
The theoretical model, as defined in Chapter 3, used for the simulation o f the Tunnel
Sealing Experiment requires a detailed set o f thermo/hydraulic/mechanical material
parameters to define the behaviour o f each o f the individual materials present in the
analysis. Five primary materials are used in this analysis. These are: 1) the bentonite/sand
blocks that make up the clay bulkhead, 2) sand materials, 3) the steel plate, 4) the
reinforced concrete ring, and 5) the host granite rock. As part o f the collaborative effort
AECL provided a comprehensive lis t o f experimentally derived material parameters to be
used in the simulation work. However, it has been necessary to assume certain parameters
and relationships from sim ilar materials when they were not available. Similar materials
have been investigated in earlier modelling work for the Isothermal Test and
Buffer/Container Experiment by M itchell (2002) and therefore material parameters
employed in that study have also been adopted here where no other information was
available.
8.3.1 B en ton ite/san d c lay bulkhead
The clay bulkhead is composed o f highly compacted bentonite/sand blocks. The bentonite,
known as Kunigel V I bentonite, was provided by the Japan Nuclear Cycle Development
Institute (JNC) as part o f the international collaboration. The use o f bentonite as a seal is
considered in most international radioactive waste disposal programs, however, the
methods o f placement and composition do d iffe r from concept to concept. Dixon and Gray
(1985) performed a series o f tests which showed that the addition o f an inert material, such
as sand, to the bentonite m ixture would not greatly affect the important sealing
characteristics such as saturated permeability and swelling pressure, whilst increasing the
thermal conductivity and decreasing cost. AEC L have adopted this principal in their past
experimental work whereby a 50:50 bentonite/sand buffer material was used in both the
Isothermal Test and the Buffer/Container Experiment. In Japan, a great deal o f work has
been conducted using clay-based sealing materials composed o f 70% Kunigel V I bentonite
and 30% sand. This material composition was used in the large scale experiment at the
Big-Bentonite (B IG -BEN) fac ility (Fujita et al., 1996) and in the in-situ experiment in the
Kamaishi mine (Chijimatsu et al., 1999). The same composition o f 70% Kunigel V I
bentonite and 30% graded silica sand was used in the TSX and was installed with a bulk
8-4
Chapter 8 Simulation of the Tunnel Sealing Experiment
density o f 1900 kg/m3. In the fo llow ing sections the material parameters adopted for the
clay bulkhead are detailed. Some o f the relationships have needed to be assumed from
parameters adopted fo r the 50:50 bentonite/sand buffer material used in AECL’ s
Buffer/Container Experiment (M itchell, 2002) and as such are only representative.
8.3.1.1 H ydraulic a n d therm al m aterial param eters
The bentonite/sand bulkhead was installed in the TSX w ith an in itia l moisture content o f
14 %. Guo and Chandler (2002) defined the effective porosity o f the material as 0.315.
Hence the void ratio, e can be calculated as 0.46. W ith reference to equation (7.4) the
initia l degree o f saturation o f the material can be determined;
Si (in itia l) = 0.822
The hydraulic conductivity curve was determined using the approach proposed by Green
and Corey (1971) using a measured saturated hydraulic conductivity o f 1 x 10'12 m/s, (Guo
and Chandler, 2002). The form o f the variation w ith degree o f saturation is shown in
Figure 8.4. This relationship is applied in the fin ite element code COMPASS as a series o f
data points w ith linear interpolation being used between the discrete values. As part o f the
modelling exercise it was considered necessary to investigate the interaction o f the
microstructure and the macrostructure on the saturation rates o f the clay bulkhead.
Following the work o f Thomas et al. (2003a) the approach described in Section 3.2.1.1 and
equation (3.22) was employed as a first approximation. This assumed that as the clay
bulkhead saturated 94% o f the water would be adsorbed in the micropore and become
unavailable fo r further flow (Pusch, 1998). The swelling o f the micropore thus tends to
“ choke” the flow o f water and reduce the effective hydraulic conductivity o f the clay
bulkhead. This relationship is also shown in Figure 8.4.
The water retention curve relationship fo r this material is based upon the approach
presented by M itchell (2002). This approach followed the work o f Wan et al. (1995a) who
measured the relationship between moisture content and total suction for an unsaturated
50:50 bentonite/sand buffer material, and fitted a curve to the data. Therefore, for the clay
bulkhead used in this work the in itia l porosity has been used to determine the relationship
between the total suction and degree o f saturation. Wan’s approach, has been
8-5
Chapter 8 Simulation of the Tunnel Sealing Experiment
supplemented to include suction values less than 2.59 MPa. The equations defining the
water retention curve are given below and the relationship is shown in Figure 8.5;
when, 5 < 2.59 x 10⁶ Pa
S,= 1 +2.26 x 10'5 (1 - exp (2.8 x 10'6s)) (8.1)
when, 2.59 x 10⁶ Pa < 5 < 17 x 106 Pa
lo g j jW - S ^' -1 .98
when, 5 > 17 x 106 Pa
iog,oW -8 .7 4 ' -2 .9 7
Hence, from Figure 8.5 and equation (8.2) fo r the clay bulkhead, w ith an in itia l S) = 0.822
%, the initia l suction, st = 4 MPa.
The thermal conductivity relationship is based on experimental measurements presented by
Wan et al. (1995b). In order to implement this relationship into the COMPASS model
linear interpolation has been performed between the values. This is expressed below;
when, Si < 0.2
A = 0.7 W /m /K (8.4)
when, 0.2 < S/ <0.8
A = 1.667 S/ + 0.366 W /m /K (8.5)
when, 0.8 < S)
A =1.7 W /m /K (8.6)
The thermal conductivity relationship plotted against degree o f saturation is shown in
Figure 8.6.
8-6
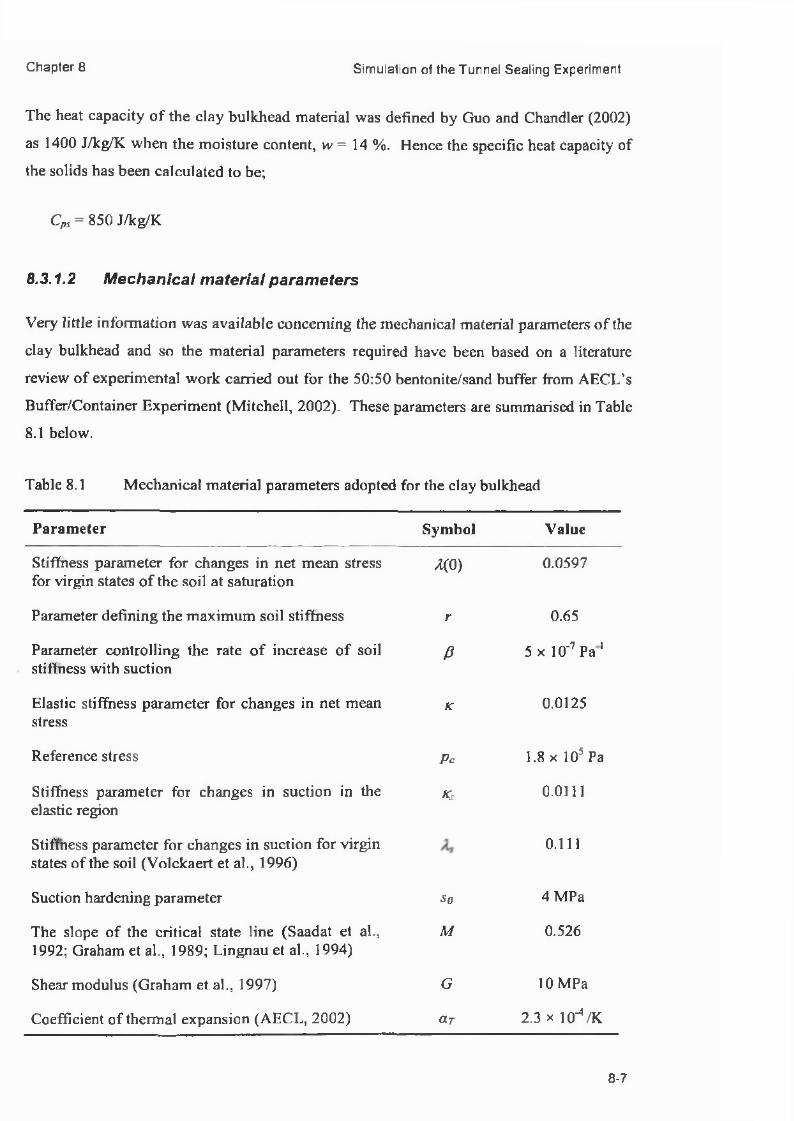
Chapter 8 Simulation of the Tunnel Sealing Experiment
The heat capacity o f the clay bulkhead material was defined by Guo and Chandler (2002)
as 1400 J/kg/K when the moisture content, w = 14 %. Hence the specific heat capacity o f
the solids has been calculated to be;
Cps = 850 J/kg/K
8.3.1.2 M echanical m aterial param eters
Very little information was available concerning the mechanical material parameters o f the
clay bulkhead and so the material parameters required have been based on a literature
review o f experimental work carried out fo r the 50:50 bentonite/sand buffer from AECL’ s
Buffer/Container Experiment (M itchell, 2002). These parameters are summarised in Table
8.1 below.
Table 8.1 Mechanical material parameters adopted fo r the clay bulkhead
Parameter Symbol Value
Stiffness parameter fo r changes in net mean stress for virgin states o f the soil at saturation
m 0.0597
Parameter defining the maximum soil stiffness r 0.65
Parameter controlling the rate o f increase o f soil stiffness w ith suction
P 5 x 10'7P a ‘
Elastic stiffness parameter fo r changes in net mean stress
K 0.0125
Reference stress Pc 1.8 x 10s Pa
Stiffness parameter fo r changes in suction in the elastic region
Ks 0.0111
Stiffness parameter fo r changes in suction fo r virgin states o f the soil (Volckaert et al., 1996)
0.111
Suction hardening parameter So 4 MPa
The slope o f the critical state line (Saadat et al., 1992; Graham et al., 1989; Lingnau et al., 1994)
M 0.526
Shear modulus (Graham et al., 1997) G 10 MPa
Coefficient o f thermal expansion (AECL, 2002) aT 2.3 x lO ^/K
8-7
Chapter 8 Simulation of the Tunnel Sealing Experiment
8.3.2 Granite rock
AECL’ s underground research laboratory is situated in the Lac du Bonnet granite
batholith, 120 km ENE o f Winnipeg, Canada. The Tunnel Sealing Experiment is located
on the 420 m level. A t this level the rock is generally homogenous grey granite which is
essentially unffactured. The rock has an effective porosity o f 0.003 and a bulk density o f
2650 kg/m3 (Guo and Chandler, 2002). A literature review o f the granite material
parameters revealed that there was little information available on several o f the key
properties and relationships needed fo r the water uptake modelling, hence some
assumptions were required.
8.3.2.1 H ydraulic a n d therm al m aterial param eters
The material data that was provided by AEC L (2002) for the granite did not cover the
principal hydraulic relationships and so the approach taken by Thomas et al. (2003a) has
been adopted here. This approach is sim ilar to the one used for the Aspo granite detailed
in Chapter 7, Section 7.2.5 w ith the relevant parameters from AEC L implemented.
Following the approach adopted by Gens et al., (1998), which was presented in Section
7.2.5.2 and shown in equation (7.5) the hydraulic conductivity fo r the granite rock was
taken as, when, S/ < 1;
K l = K sal.Stl2( l - ( \ - S ! ' fi,Y ‘ ? (8.7)
Guo and Chandler (2002) defined the saturated hydraulic conductivity for the granite, Ksa,
as 10'12 m/s. The material parameter, /?/ is again taken as 0.33, after Gens et al. (1998).
The hydraulic conductivity relationship for the granite can be seen in Figure 8.7.
From Section 7.2.5.2 and equation (7.6) the relationship between degree o f saturation and
suction for the granite was defined by Gens et al. (1998) as;
" p 11 (\-p ,) ^ '
1 +s
< K Po j V
where, S) is the degree o f saturation, s is the suction, Pn is the air entry value, and p i is a
material parameter, taken as 0.33 fo r granite after Gens et al. (1998). Using equation (7.7)
8-8
Chapter 8 Simulation of the Tunnel Sealing Experiment
the saturated hydraulic conductivity corresponds to an intrinsic permeability o f 10'19 m2.
Therefore, using the approach presented by Davies (1991), as discussed in Section 7.2.5.2
and Figure 7.8, a threshold pressure o f 1.75 MPa was selected and substituted into equation
(8.8). The corresponding water retention curve is shown in Figure 8.8.
The thermal conductivity fo r the granite was taken as a constant value o f 3.5 W /m/K after
Guo and Chandler (2002). The specific heat capacity for the rock, Cps, was given in Guo
and Chandler (2002) as;
Cps = 1015 J/kg/K
8.3.2.2 M echanical m aterial param eters
For the granite rock it was assumed that on ly elastic deformation would occur w ithin the
bounds o f the analysis. Therefore on ly the material parameters defining the elastic
behaviour o f the rock are given below, these were provided by AEC L (2002) as;
Uniaxial compressive strength = 167 MPa
Young’s Modulus, E = 57.59 GPa
Poisson’ s ratio, v = 0.207
Coefficient o f thermal expansion, cct= 7 x 10'6/K
Given that Young’ s modulus can be expressed in terms o f the bulk modulus, K, and shear
modulus, G, by the fo llow ing expression;
E = 9fC(i— (8.9)3K + G
And Poisson’s ratio may be expressed as;
3 K -2 Gv =
6K + 2G(8.10)
The follow ing values are found fo r the shear modulus and the bulk modulus respectively,
G = 23.86 GPa, and K = 32.74 GPa.
8-9
Chapter 8 Simulation of the Tunnel Sealing Experiment
It was assumed that there would be little deformation caused by changes in suction within
the rock, and so ks, the elastic stiffness parameter for changes in suction o f the soil was set
to a negligible value.
8.3.3 Sand m aterials
Two different sand materials were used in the Tunnel Sealing Experiment. The first was
placed in the chamber between the clay bulkhead and concrete bulkhead and the second
formed part o f the restraint system and was installed between the downstream face o f the
clay bulkhead and the steel plate. It was decided from an early stage in the simulation that
since the sand in the chamber on ly effectively acted as a source o f water and heat it could
be removed from the analyses and replaced by a series o f representative boundary
conditions. This also had the added advantage o f reducing the complexity o f the domain
and allowed savings to be made in terms o f computational run-times. The sand used to f i l l
the space between the clay bulkhead and steel plate has a dry density o f 2000 kg/m3 and an
initia l effective porosity o f 0.24 (AECL, 2002).
8.3.3.1 Hydraulic an d therm al m aterial param eters
In order to represent the hydraulic relationships o f the sand f i l l i t was necessary to adopt
the approach taken by M itchell (2002) fo r the sand in the Buffer/Container Experiment.
M itchell (2002) compared the particle size distribution for the sand used in AECL’ s
Buffer/Container Experiment w ith a Garside Grade medium sand and found that the
materials were o f a sim ilar consistency. Therefore, some o f the material parameters and
relationships fo r Garside Grade medium sand have been employed in this work, (Ewen and
Thomas, 1987; Ewen and Thomas, 1989).
The saturated hydraulic conductivity o f the sand f i l l was the same as the sand used in the
chamber and was defined by Guo and Chandler (2002) as 6.25 x 10 5 m/s. Hence, the
hydraulic conductivity relationship, expressed in terms o f degree o f saturation, has been
defined as;
K, = 8 .3 7 x l0 -12exp[^28.0l(5/ )-12.235(5 '/ )2J m/s (8.11)
This relationship is shown graph ica lly in Figure 8.9.
8-10
Chapter 8 Simulation of the Tunnel Sealing Experiment
The water retention curve has been modelled using the fo llow ing set o f equations;
when, 0 < nS/ < 0.2
This relationship is shown graphically in Figure 8.10.
The thermal conductivity o f the sand f i l l was provided by AEC L (2002) as 0.5 W /m/K and
the thermal capacity o f the material is assumed to be the same as the chamber sand, that is,
820 J/kg/K (Guo and Chandler, 2002).
8.3.3.2 M echanical m aterial param eters
The sand f i l l is modelled using a linear elastic constitutive model. Therefore, only the
material parameters defining the elastic behaviour o f the sand f i l l are given below (AECL,
2002);
Young’s Modulus, E = 600 MPa
Poisson’s ratio, v = 0.3
Coefficient o f thermal expansion, cct = 1.9 x 10'5 /K
Using equations (8.9) and (8.10) the shear modulus was calculated to be, G = 230.77 MPa.
It was expected that there would be very little deformation caused by changes in suction
w ithin the sand, and so k s, the elastic stiffness parameter for changes in suction o f the soil
was set to a negligible value.
- i
(8.12)
when, 0.2 <nS / < n
,0.0226249
1.101416x10(8.13)
8-11
Chapter 8 Simulation of the Tunnel Sealing Experiment
8.3.4 S tee l plate
On the downstream end o f the clay bulkhead the resistance to bentonite expansion is
provided by a rig id steel restraint system. The restraint system was designed to resist the
combined loading o f 4 MPa o f hydraulic pressure from w ithin the tunnel and IMPa o f
swelling pressure from the clay bulkhead. The restraint system is an elongated
hemispherical steel plate w ith a minimum plate thickness o f 25 mm and a maximum
thickness o f 50 mm. The steel plate was designed to transfer the load outward onto a high-
strength concrete ring beam (Chandler et al., 2002b). The steel plate supports and restrains
the sand f i l l and the clay bulkhead. The steel has a bulk density o f 7800 kg/m3 and an
effective porosity o f zero (AECL, 2002).
8.3.4.1 H ydraulic a n d therm al m aterial param eters
To reflect the effectively impermeable nature o f the steel plate the hydraulic conductivity
was set to an extremely low value.
The thermal conductivity o f the steel was provided by AEC L (2002) as 56 W /m/K and the
thermal capacity o f the steel plate was defined as 465 J/kg/K.
8.3.4.2 M echanical m aterial param eters
Due to a lack o f available mechanical material parameters for the steel plate it was
necessary to model it using a linear elastic constitutive model. Therefore, only the material
parameters defining the elastic behaviour o f the steel plate are given below (AECL, 2002);
Young’ s Modulus, E = 200 GPa
Poisson’ s ratio, v = 0.29
Coefficient o f thermal expansion, ccT= 14.8 x 10'6/K
Using equations (8.9) and (8.10) the shear modulus was calculated to be, G = 77.52 GPa.
8-12
Chapter 8 Simulation of the Tunnel Sealing Experiment
8.3.5 R ein forced co n crete ring
The steel plate is supported by a reinforced concrete ring, which is keyed into the
surrounding granite. The purpose o f the concrete bearing ring is to transfer load from the
steel plate onto the rock. A high strength concrete was specified for the ring beam with a
minimum concrete strength o f 60 MPa achieved w ithin 90 days o f placement (Chandler et
al., 2002b). The concrete has a bulk density o f 2430 kg/m3 and an effective porosity o f 0.1
(AECL, 2002).
8.3.5.1 H ydraulic a n d therm al m aterial param eters
As a first assumption the concrete is modelled using the same hydraulic conductivity
relationship as that described in equation (8.7) fo r the host granite. However, the saturated
hydraulic conductivity fo r the concrete has been defined as 3.0 x 10'14 m/s (Guo and
Chandler, 2002). As there was no information available regarding the water retention
curve o f the concrete it has been assumed to fo llow the same form as that employed for the
granite. It is acknowledged that this is an assumption only, but since the concrete ring is
only a small element to the simulation it can be considered to have a negligible effect on
the flow and mechanical behaviour o f the clay bulkhead.
The thermal conductivity o f the reinforced concrete ring has been defined as 1.8 W/m/K
and the thermal capacity o f the concrete has been defined as 900 J/kg/K (AECL, 2002).
8.3.5.2 M echanical ma terial param eters
The reinforced concrete ring is modelled using a linear elastic constitutive model.
Therefore, only the material parameters defining the elastic behaviour o f the reinforced
concrete ring are given below (AECL, 2002):
Young’ s Modulus, E = 36 GPa
Poisson’ s ratio, u = 0.3
Coefficient o f thermal expansion, a r = 1 x 10‘5 /K
Using equations (8.9) and (8.10) the shear modulus was calculated to be, G = 13.85 GPa.
8-13
Chapter 8 Simulation of the Tunnel Sealing Experiment
It was expected that there would be very little deformation caused by changes in suction
within the concrete ring, and so k s, the elastic stiffness parameter for changes in suction o f
the concrete was set to a negligible value.
8.3.6 C o n c lu sio n s
Material parameters necessary to model the Tunnel Sealing Experiment have been
described. Where possible the parameters have been attained from results o f laboratory or
in-situ testing o f the materials presented in the literature. However the set o f parameters
available from this experiment was not comprehensive, and where necessary
approximations have been made.
8-14
Chapter 8 Simulation of the Tunnel Sealing Experiment
8.4 Simulation Pre-Phase I
The numerical code COMPASS, was used to simulate the hydraulic response o f the granite
in the Tunnel Sealing Experiment prior to the construction o f the clay bulkhead and sand
chamber. Both a three-dimensional and a two-dimensional axisymmetric fin ite element
analysis have been performed. This procedure was undertaken to compare and contrast the
results from a more complex three-dimensional domain w ith those from a simpler two-
dimensional domain. Based on these results a suitable model could then be adopted for the
subsequent work. The mesh and time stepping schemes used in these numerical models
were checked for spatial and temporal convergence respectively.
8.4.1 Hydraulic sim u lation o f granite prior to P h a se I
8.4.1.1 Initial a n d bou n dary condition s
The boundary conditions along the edges o f the far-field rock were restrained and the pore
water pressure was set to a hydrostatic value. In the three-dimensional analysis this varied
with depth from 3.82 MPa at the top o f the domain to 4 .18 MPa along the bottom o f the
domain. The variation o f the pore water pressure at the boundaries o f the domain can be
seen in Figure 8.11. In the two-dimensional axisymmetrical analysis an average value o f 4
MPa was used. A zero flux boundary condition was prescribed on the central surface o f
the section, which represents the axis o f symmetry in the system. The internal rock surface
o f the tunnel was set at zero pore water pressure, effectively representing air at 100 %
humidity and atmospheric pressure. This approach has been adopted in earlier modelling
exercises (M itchell, 2002) and it is acknowledged that this boundary condition is only
representative and hence the assumption is only made as a first approximation. The initial
conditions o f the analysis were set at hydrostatic pressure values.
8.4.1.2 Sim ulation num erics
Both a three-dimensional tunnel mesh and two-dimensional axisymmetric mesh were
implemented in this analysis, whereby only the rock was modelled without the clay
bulkhead, sand chamber, sand fille r, steel plate or concrete ring installed. In the three-
dimensional analysis a vertical plane o f symmetry was identified and only ha lf o f the
8-15
Chapter 8 Simulation of the Tunnel Sealing Experiment
domain was modelled. Therefore the overall size o f the mesh could be reduced by a factor
o f 2 and thus composed o f 11,968 nodes and 9,952 elements. The three-dimensional
domain and mesh can be seen in the Figures 7.12. In the two-dimensional axisymmetrical
analysis a mesh composed o f 2,144 nodes and 2,034 elements was used (refer to Figure
8.13). Follow ing the investigation summarised in Chapter 4, Section 4.5 the hydraulic
analyses o f the rock mass were performed using a Preconditioned Conjugate Gradient
(PCG) solver combined w ith a Jacobi preconditioner. The analyses were run in parallel on
4 processors on the SUN HPC system. The time step fo r these analyses started at 100
seconds and was allowed to increase to a maximum o f 30 days in response to the rate o f
numerical convergence, via the algorithm described in Chapter 4, Section 4.3. These
analyses were run for 510 days, corresponding to the time that the tunnel had been left
open fo llow ing the tunnel and key excavation prior to the commencement o f Phase I (Guo
and Chandler, 2002). The hydraulic material parameters o f the rock are described in
Section 8.3.2.1
8.4.1.3 Sim ulation resu lts
Figure 8 .14 shows pore water pressures versus radial distance from the tunnel centre over
time. The results fo r both the three-dimensional tunnel mesh analysis (section A -A , see
Figure 8.12) and the two-dimensional axisymmetrical analysis (section A l - A l , see Figure
8.13) are shown. It can be seen that there is very little variation between the two sets o f
results. The influence o f the tunnel is clear w ith a draw down o f pore water pressure from
the far field hydrostatic values to zero head at the rock surface. It also shows that the
system reaches steady-state pore water pressure conditions relatively quickly, since the 24
day profile closely matches the final steady-state profile at 510 days. Figure 8.15 (a - d)
shows pore water pressure contour plots for differing times w ithin the analysis for the
three-dimensional analysis. These plots again illustrate how rapidly the system reaches
steady-state pore water pressure conditions. Since the comparison between the three-
dimensional tunnel analysis and the two-dimensional axisymmetrical analysis o f this phase
showed negligible difference in the results, the two-dimensional axisymmetrical approach
was adopted in this numerical investigation from this point onwards. Employing the two-
dimensional axisymmetrical analysis for later, more complex coupled analyses was also
advantageous because the computational run-times were significantly reduced and this
allowed a range o f different analyses to be performed in the required time frame.
8-16

Chapter 8 Simulation of the Tunnel Sealing Experiment
8.4.1.4 C on clusion s
In the hydraulic simulation o f the rock mass pre-Phase I the system reaches steady-state
pore water pressures conditions over a relatively quick duration o f 24 days. It is also
evident that the construction o f the open tunnel precipitates a draw down effect o f pore
water pressure w ith in the rock mass.
8-17
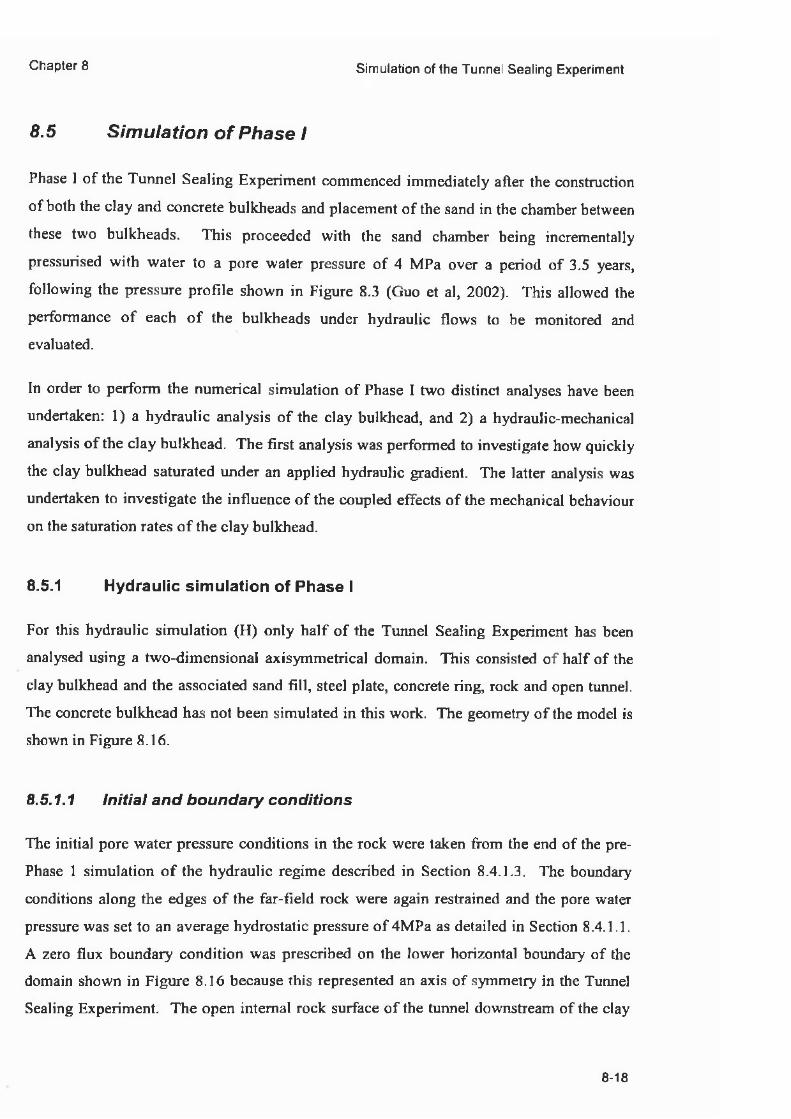
Chapter 8 Simulation of the Tunnel Sealing Experiment
8.5 Simulation o f Phase I
Phase I o f the Tunnel Sealing Experiment commenced immediately after the construction
o f both the clay and concrete bulkheads and placement o f the sand in the chamber between
these two bulkheads. This proceeded w ith the sand chamber being incrementally
pressurised w ith water to a pore water pressure o f 4 MPa over a period o f 3.5 years,
follow ing the pressure profile shown in Figure 8.3 (Guo et al, 2002). This allowed the
performance o f each o f the bulkheads under hydraulic flows to be monitored and
evaluated.
In order to perform the numerical simulation o f Phase I two distinct analyses have been
undertaken: 1) a hydraulic analysis o f the clay bulkhead, and 2) a hydraulic-mechanical
analysis o f the clay bulkhead. The first analysis was performed to investigate how quickly
the clay bulkhead saturated under an applied hydraulic gradient. The latter analysis was
undertaken to investigate the influence o f the coupled effects o f the mechanical behaviour
on the saturation rates o f the clay bulkhead.
8.5.1 Hydraulic sim ulation o f P h a se I
For this hydraulic simulation (H ) only h a lf o f the Tunnel Sealing Experiment has been
analysed using a two-dimensional axisymmetrical domain. This consisted o f ha lf o f the
clay bulkhead and the associated sand f i l l, steel plate, concrete ring, rock and open tunnel.
The concrete bulkhead has not been simulated in this work. The geometry o f the model is
shown in Figure 8.16.
8.5.1.1 Initial a n d bou n dary condition s
The initia l pore water pressure conditions in the rock were taken from the end o f the pre-
Phase 1 simulation o f the hydraulic regime described in Section 8.4.1.3. The boundary
conditions along the edges o f the far-field rock were again restrained and the pore water
pressure was set to an average hydrostatic pressure o f 4MPa as detailed in Section 8.4.1.1.
A zero flux boundary condition was prescribed on the lower horizontal boundary o f the
domain shown in Figure 8.16 because this represented an axis o f symmetry in the Tunnel
Sealing Experiment. The open internal rock surface o f the tunnel downstream o f the clay
8-18
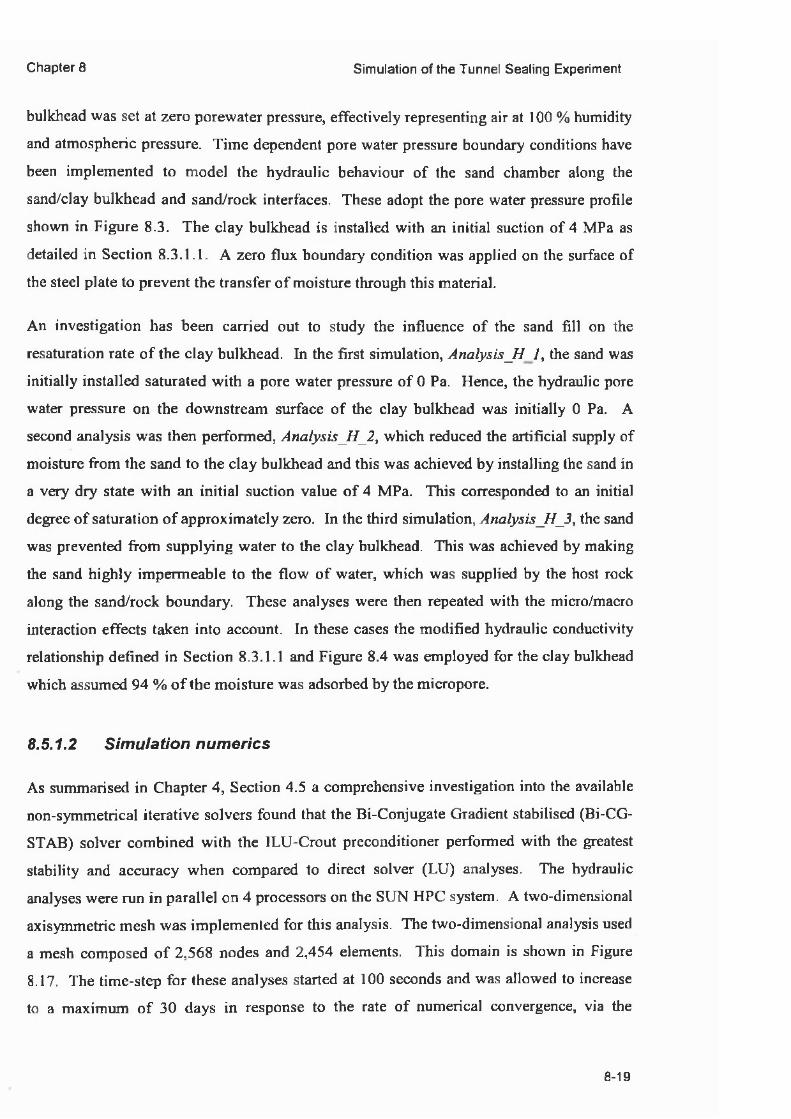
Chapter 8 Simulation of the Tunnel Sealing Experiment
bulkhead was set at zero porewater pressure, effectively representing air at 100 % humidity
and atmospheric pressure. Time dependent pore water pressure boundary conditions have
been implemented to model the hydraulic behaviour o f the sand chamber along the
sand/clay bulkhead and sand/rock interfaces. These adopt the pore water pressure profile
shown in Figure 8.3. The clay bulkhead is installed w ith an initia l suction o f 4 MPa as
detailed in Section 8.3.1.1. A zero flux boundary condition was applied on the surface o f
the steel plate to prevent the transfer o f moisture through this material.
An investigation has been carried out to study the influence o f the sand f i l l on the
resaturation rate o f the clay bulkhead. In the first simulation, A na lys is_H 1, the sand was
in itia lly installed saturated w ith a pore water pressure o f 0 Pa. Hence, the hydraulic pore
water pressure on the downstream surface o f the clay bulkhead was in itia lly 0 Pa. A
second analysis was then performed, Analysis_H_2, which reduced the artificial supply o f
moisture from the sand to the clay bulkhead and this was achieved by installing the sand in
a very dry state w ith an in itia l suction value o f 4 MPa. This corresponded to an initial
degree o f saturation o f approximately zero. In the third simulation, Analysis_H_3, the sand
was prevented from supplying water to the clay bulkhead. This was achieved by making
the sand h ighly impermeable to the flow o f water, which was supplied by the host rock
along the sand/rock boundary. These analyses were then repeated w ith the micro/macro
interaction effects taken into account. In these cases the modified hydraulic conductivity
relationship defined in Section 8.3.1.1 and Figure 8.4 was employed fo r the clay bulkhead
which assumed 94 % o f the moisture was adsorbed by the micropore.
8.5.1.2 Sim ulation nu m erics
As summarised in Chapter 4, Section 4.5 a comprehensive investigation into the available
non-symmetrical iterative solvers found that the Bi-Conjugate Gradient stabilised (Bi-CG-
STAB) solver combined w ith the ILU-Crout preconditioner performed w ith the greatest
stability and accuracy when compared to direct solver (LU ) analyses. The hydraulic
analyses were run in parallel on 4 processors on the SUN HPC system. A two-dimensional
axisymmetric mesh was implemented for this analysis. The two-dimensional analysis used
a mesh composed o f 2,568 nodes and 2,454 elements. This domain is shown in Figure
8.17. The time-step fo r these analyses started at 100 seconds and was allowed to increase
to a maximum o f 30 days in response to the rate o f numerical convergence, via the
8-19
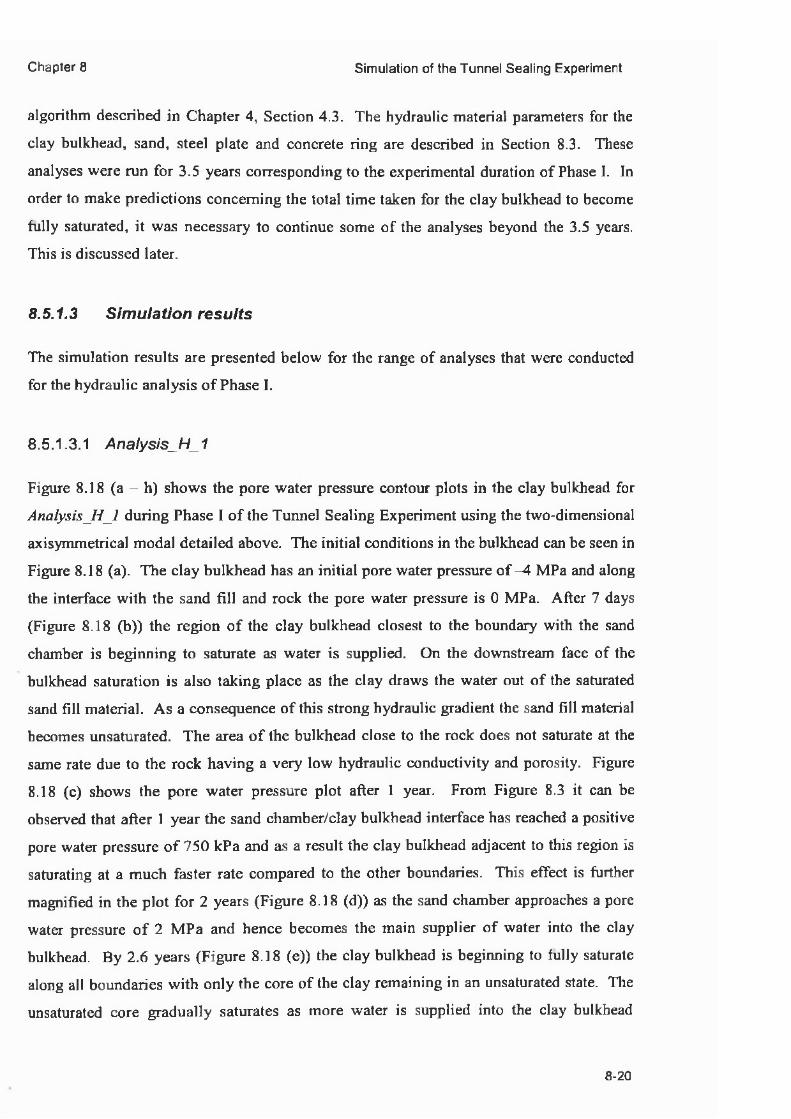
Chapter 8 Simulation of the Tunnel Sealing Experiment
algorithm described in Chapter 4, Section 4.3. The hydraulic material parameters for the
clay bulkhead, sand, steel plate and concrete ring are described in Section 8.3. These
analyses were run fo r 3.5 years corresponding to the experimental duration o f Phase I. In
order to make predictions concerning the total time taken for the clay bulkhead to become
fu lly saturated, it was necessary to continue some o f the analyses beyond the 3.5 years.
This is discussed later.
8.5.1.3 Sim ulation resu lts
The simulation results are presented below for the range o f analyses that were conducted
for the hydraulic analysis o f Phase I.
8.5.1.3.1 Analysis_H_ 1
Figure 8.18 (a - h) shows the pore water pressure contour plots in the clay bulkhead for
Analysis _H_1 during Phase I o f the Tunnel Sealing Experiment using the two-dimensional
axisymmetrical modal detailed above. The in itia l conditions in the bulkhead can be seen in
Figure 8.18 (a). The clay bulkhead has an in itia l pore water pressure o f -4 MPa and along
the interface w ith the sand f i l l and rock the pore water pressure is 0 MPa. After 7 days
(Figure 8.18 (b)) the region o f the clay bulkhead closest to the boundary w ith the sand
chamber is beginning to saturate as water is supplied. On the downstream face o f the
bulkhead saturation is also taking place as the clay draws the water out o f the saturated
sand f i l l material. As a consequence o f this strong hydraulic gradient the sand f i l l material
becomes unsaturated. The area o f the bulkhead close to the rock does not saturate at the
same rate due to the rock having a very low hydraulic conductivity and porosity. Figure
8.18 (c) shows the pore water pressure plot after 1 year. From Figure 8.3 it can be
observed that after 1 year the sand chamber/clay bulkhead interface has reached a positive
pore water pressure o f 750 kPa and as a result the clay bulkhead adjacent to this region is
saturating at a much faster rate compared to the other boundaries. This effect is further
magnified in the p lo t fo r 2 years (Figure 8.18 (d)) as the sand chamber approaches a pore
water pressure o f 2 MPa and hence becomes the main supplier o f water into the clay
bulkhead. By 2.6 years (Figure 8.18 (e)) the clay bulkhead is beginning to fu lly saturate
along all boundaries w ith on ly the core o f the clay remaining in an unsaturated state. The
unsaturated core gradually saturates as more water is supplied into the clay bulkhead
8-20
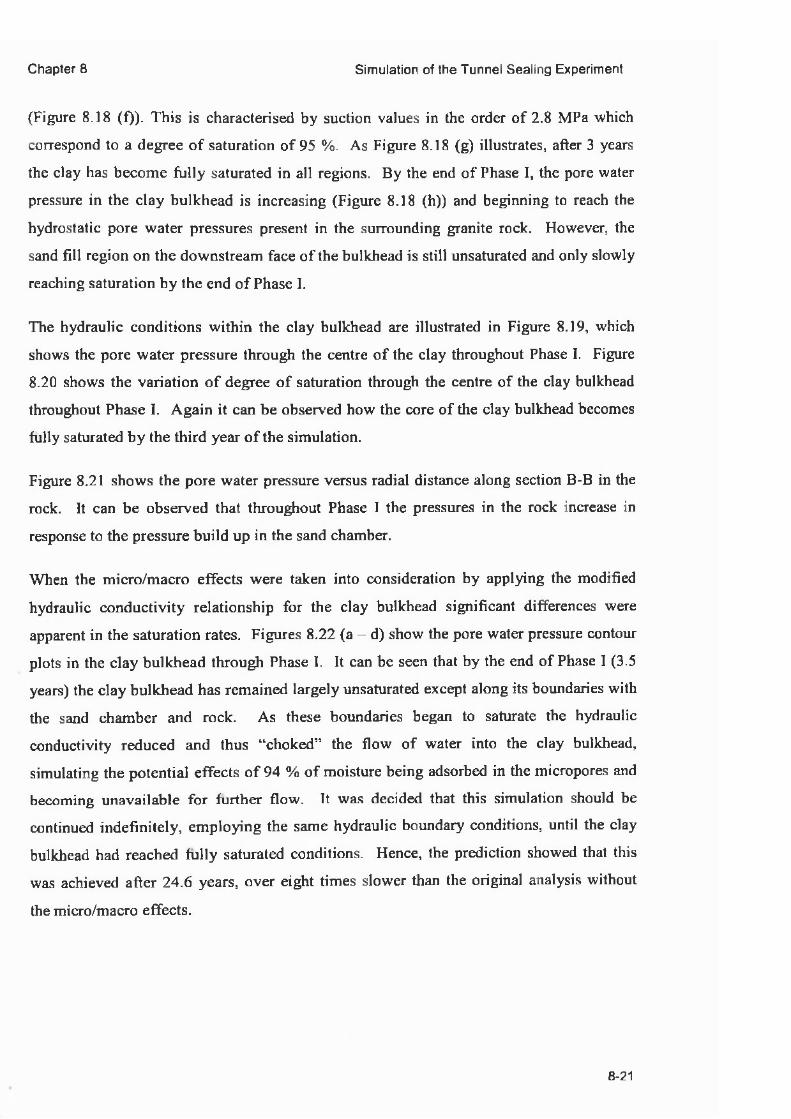
Chapter 8 Simulation of the Tunnel Sealing Experiment
(Figure 8.18 (f)). This is characterised by suction values in the order o f 2.8 MPa which
correspond to a degree o f saturation o f 95 %. As Figure 8.18 (g) illustrates, after 3 years
the clay has become fu lly saturated in all regions. By the end o f Phase I, the pore water
pressure in the clay bulkhead is increasing (Figure 8.18 (h)) and beginning to reach the
hydrostatic pore water pressures present in the surrounding granite rock. However, the
sand f i l l region on the downstream face o f the bulkhead is s till unsaturated and only slowly
reaching saturation by the end o f Phase I.
The hydraulic conditions w ith in the clay bulkhead are illustrated in Figure 8.19, which
shows the pore water pressure through the centre o f the clay throughout Phase I. Figure
8.20 shows the variation o f degree o f saturation through the centre o f the clay bulkhead
throughout Phase I. Again it can be observed how the core o f the clay bulkhead becomes
fu lly saturated by the th ird year o f the simulation.
Figure 8.21 shows the pore water pressure versus radial distance along section B-B in the
rock. It can be observed that throughout Phase I the pressures in the rock increase in
response to the pressure build up in the sand chamber.
When the micro/macro effects were taken into consideration by applying the modified
hydraulic conductivity relationship for the clay bulkhead significant differences were
apparent in the saturation rates. Figures 8.22 (a - d) show the pore water pressure contour
plots in the clay bulkhead through Phase I. It can be seen that by the end o f Phase I (3.5
years) the clay bulkhead has remained largely unsaturated except along its boundaries with
the sand chamber and rock. As these boundaries began to saturate the hydraulic
conductivity reduced and thus “ choked” the flow o f water into the clay bulkhead,
simulating the potential effects o f 94 % o f moisture being adsorbed in the micropores and
becoming unavailable fo r further flow. It was decided that this simulation should be
continued indefinitely, employing the same hydraulic boundary conditions, until the clay
bulkhead had reached fu lly saturated conditions. Hence, the prediction showed that this
was achieved after 24.6 years, over eight times slower than the original analysis without
the micro/macro effects.
8-21
Chapter 8 Simulation of the Tunnel Sealing Experiment
8.5.1.3.2 Analysis_H_2
In this analysis the in itia l conditions in the sand f i l l were virtually dry and this had a
significant effect on the saturation rate o f the clay bulkhead. W ith reference to Figures
8.23 and 8.24 it can be seen how the downstream face o f the clay bulkhead shows a
reduction in the level o f saturation that takes place when compared to the results in
A na lys is_H 1. It can be seen that by the end o f the 3.5 years the core o f the clay bulkhead
remained largely unsaturated w ith only a small increase in degree o f saturation o f 2 %
from the in itia l conditions. Continuation o f this analysis found that the clay bulkhead
reached fu lly saturated conditions after 4.3 years, taking approximately 475 days longer to
saturate than the bulkhead in Analysis_H_1. When the micro/macro interaction in the clay
was taken into consideration it was found that the clay bulkhead did not reach fu lly
saturated conditions un til after 28.5 years. This again illustrated how this phenomenon can
have a potentially significant effect on saturation rates for swelling buffer materials.
8.5.1.3.3 Analysis_H_3
The results from Analysis_H_3 can be seen in Figures 8.25 and 8.26. In this analysis the
sand was made h igh ly impermeable so that it did not provide any water to the downstream
face o f the clay bulkhead. From the results it can be seen that since the inflow o f water is
from one direction on ly the clay bulkhead saturates at a slower rate than the early analyses.
A t the end o f the analysis the saturated front has moved into the bulkhead by around 1.5 m.
Continuing this analysis yielded fu ll bulkhead saturation after 5.9 years. Again taking the
micro/macro interaction into account proved significant in delaying the total time taken for
fu ll saturation to 40 years.
8.5.1.4 C on clusion s
For the hydraulic simulation o f Phase I a series o f investigations have been carried out.
The effect o f the in itia l and boundary conditions on the downstream face o f the clay
bulkhead have been considered. In the first analysis the sand f i l l was installed in itia lly
saturated and provided a source o f water. It was observed that after 3 years the clay
bulkhead had resaturated in all regions and was beginning to reach the surrounding
hydrostatic pore water pressures inherent in the adjacent granite rock. In the second
analysis the sand was installed dry and this delayed the total time taken for the clay
8-22
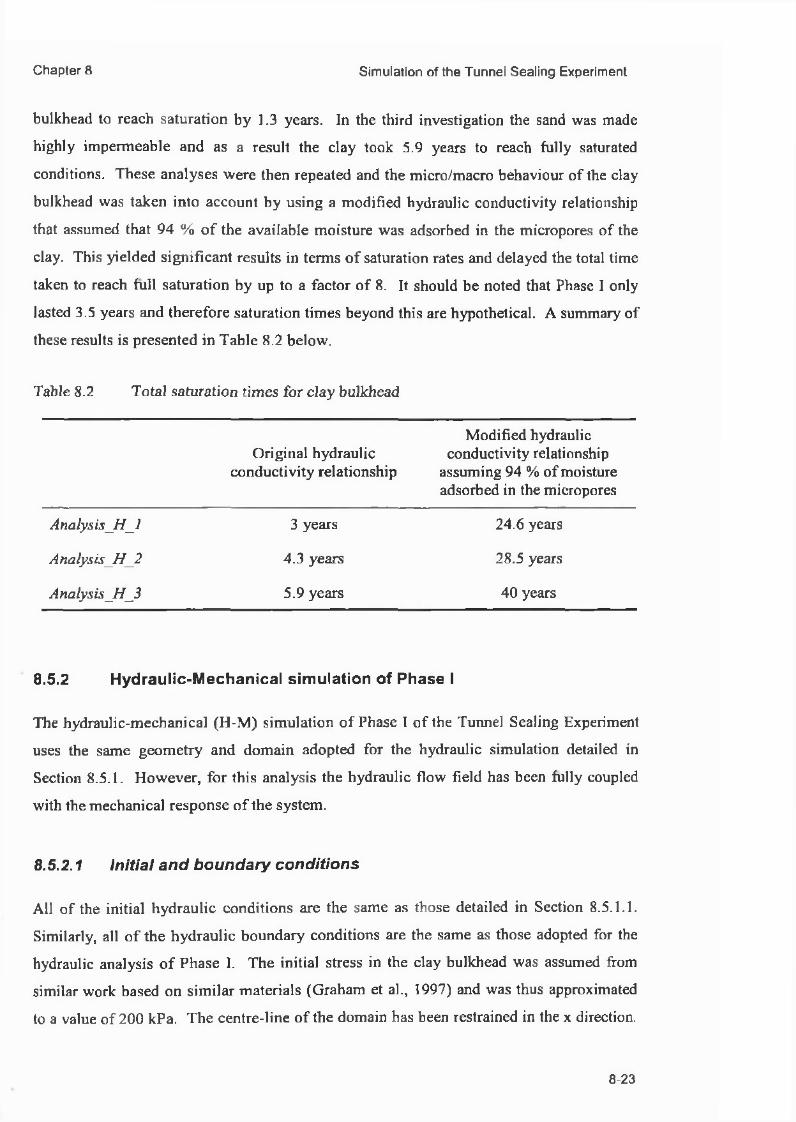
Chapter 8 Simulation of the Tunnel Sealing Experiment
bulkhead to reach saturation by 1.3 years. In the third investigation the sand was made
highly impermeable and as a result the clay took 5.9 years to reach fu lly saturated
conditions. These analyses were then repeated and the micro/macro behaviour o f the clay
bulkhead was taken into account by using a modified hydraulic conductivity relationship
that assumed that 94 % o f the available moisture was adsorbed in the micropores o f the
clay. This yielded significant results in terms o f saturation rates and delayed the total time
taken to reach fu ll saturation by up to a factor o f 8. It should be noted that Phase I only
lasted 3.5 years and therefore saturation times beyond this are hypothetical. A summary o f
these results is presented in Table 8.2 below.
Table 8.2 Total saturation times fo r clay bulkhead
Original hydraulic conductivity relationship
Modified hydraulic conductivity relationship
assuming 94 % o f moisture adsorbed in the micropores
Analysis_H_l 3 years 24.6 years
Analysis_H_2 4.3 years 28.5 years
Analysis_H_3 5.9 years 40 years
8.5.2 H ydraulic-M echanical sim ulation o f P h ase I
The hydraulic-mechanical (H -M ) simulation o f Phase I o f the Tunnel Sealing Experiment
uses the same geometry and domain adopted fo r the hydraulic simulation detailed in
Section 8.5.1. However, fo r this analysis the hydraulic flow field has been fu lly coupled
w ith the mechanical response o f the system.
8.5.2.1 Initial a n d bou n dary condition s
A ll o f the in itia l hydraulic conditions are the same as those detailed in Section 8.5.1.1.
Similarly, all o f the hydraulic boundary conditions are the same as those adopted for the
hydraulic analysis o f Phase I. The in itia l stress in the clay bulkhead was assumed from
similar work based on sim ilar materials (Graham et al., 1997) and was thus approximated
to a value o f 200 kPa. The centre-line o f the domain has been restrained in the x direction.
8-23
Chapter 8 Simulation of the Tunnel Sealing Experiment
Along the sand chamber/clay bulkhead interface a un iform ly distributed load has been
applied. This corresponds to the time dependent variation o f the pore water pressure being
developed in the sand chamber. Hence, the sand chamber/clay bulkhead boundary is free
to move and to consolidate under the applied load. The steel plate and the sand in front o f
it are free to deform while the concrete ring is modelled as a rig id undeformable material.
Again, an investigation o f the in itia l hydraulic conditions in the sand f i l l was conducted
w ith three analyses performed fo llow ing the same format as those analyses detailed in
Section 8.5.1. In Analysis_H-M_1 the sand was installed saturated, in Analysis_H-M_2 the
sand was installed dry, and in Analysis_H-M_3 the sand was made highly impermeable to
prevent moisture flow into the clay bulkhead.
B.5.2.2 Sim ulation nu m erics
As summarised in Chapter 4, Section 4.5 a direct LU solver method was implemented to
perform the two-dimensional axisymmetrical coupled hydraulic-mechanical (H-M)
analyses accurately because the iterative solvers were found to be unstable for this type o f
analysis. The analysis was run in serial on the SUN HPC system. The coupled hydraulic-
mechanical analysis was conducted using the two-dimensional axisymmetrical mesh
detailed in Section 8.5.1.2 and Figure 8.17. The time-step for this analysis started at 100
seconds and was allowed to increase to a maximum o f 7 days in response to the rate o f
numerical convergence, via the algorithm described in Chapter 4, Section 4.3. The
mechanical material parameters fo r the clay bulkhead, sand, steel plate, concrete ring and
granite rock are described in Section 8.3. This analysis was run fo r 3.5 years
corresponding to the experimental duration o f Phase I.
8.5.2.3 Sim ulation resu lts
The simulation results are presented below for the range o f analyses that were conducted
for the hydraulic-mechanical analysis o f Phase I.
8.5.2.3.1 Analysis_H-M_1
W ith reference to Figure 8.27 the hydraulic performance o f the clay bulkhead for the H-M
analysis o f Phase I can be observed. W hilst similar to the behaviour observed in Section
8-24
Chapter 8 Simulation of the Tunnel Sealing Experiment
8.5.1.3.1 and Figure 8.20 fo r the H-only analysis, the clay bulkhead is predicted to reach
saturation at a slightly faster rate. The H -M analysis predicts that the core o f the clay
bulkhead has reached a degree o f saturation o f 99.9 % at 2.8 years. When compared to
Figure 8.20 fo r the same time in the H-only analysis the core o f the clay bulkhead has
reached a degree o f saturation o f 95.8 %. However, in both analyses the clay bulkhead is
predicted to be fu lly saturated throughout by the end o f Phase I (i.e. 3.5 years).
This faster rate o f saturation is due to the coupling effect o f the mechanical behaviour o f
the clay. Figure 8.28 shows the void ratio profile along the centre line o f the clay
bulkhead. As the bulkhead begins to saturate, i t swells and the void ratio increases. This
pattern o f behaviour can be seen after 1 year where the clay in contact w ith the sand
chamber has swelled to a void ratio o f 0.475. It can also be observed that swelling takes
place on the downstream face o f the bulkhead as water is drawn out o f the sand f i l l
material. This swelling process at the outer edges o f the clay results in the centre o f the
bulkhead consolidating, and this is characterised by a void ratio o f 0.453. This behaviour
can also be seen after 2 years and results in a further reduction in the void ratio o f the
material, hence the volume o f voids reduces and less water in flux is required to saturate the
core o f the bulkhead. As a consequence the core begins to saturate at a faster rate than that
found in the H-only analysis. It should also be observed that after 2 years the clay in
contact w ith the sand chamber begins to consolidate. This is a result o f the increase in
applied load overcoming the swelling characteristics o f the bulkhead. A fter 3 years the
centre o f the clay bulkhead is approaching complete saturation and as a result the centre
starts to swell and the void ratio increases to 0.456. B y the end o f Phase I the clay
bulkhead has fu lly saturated and very little swelling or compression is observed. This is
characterised by the void ratio reaching near steady-state conditions. It is acknowledged
that another consequence o f the void ratio decreasing would be to reduce the hydraulic
conductivity o f the material. In other words the flow o f water into the material would be
restricted and this would effect the rate o f resaturation. This process is not taken into
account in the presented model and is recognised as a lim itation in the simulation.
Figure 8.29 shows the displacement o f nodal surface positions on the steel plate at the
downstream face o f the clay bulkhead during the H -M analysis o f Phase I. The figure
shows the variation o f displacement from the centre o f the steel plate to the edge o f the
plate that intersects w ith the concrete ring. It can be seen that the steel plate moves in
8-25
Chapter 8 Simulation of the Tunnel Sealing Experiment
response to the applied load imposed by the build up o f pore water pressure in the sand
chamber. By the end o f Phase I the centre o f the steel plate is predicted to have moved by
5.8 mm. The displacement in the steel plate incrementally reduces across its surface to
zero at the concrete ring intersection.
8.5.2.3.2 Analysis_H-M_2
The hydraulic response o f the clay bulkhead in this analysis is given in Figure 8.30 and
shows a sim ilar pattern to that observed in Analysis_H_2 detailed in Section 8.5.1.3.2.
However, again it can be seen that due to the coupling o f the mechanical behaviour the
clay saturates at a slightly faster rate. By the end o f the analysis the core region o f the
bulkhead is s till unsaturated and the degree o f saturation had increased by 6 % from the
initia l conditions. Continuing this analysis showed that the bulkhead took 4.1 years to
reach fu lly saturated conditions.
The void ratio profile along the centre-line o f the clay bulkhead can be seen in Figure 8.31.
It can be seen that in the first 2 years o f the analysis the void ratio profile shows similar
trends to those discussed in Section 8.5.2.3.1 fo r Analysis_H-M_1 above. There is initial
swelling in the clay on the upstream face as it begins to saturate and compression in the
core o f the bulkhead. B y 3 years it can be seen that the core o f the bulkhead, which is still
largely unsaturated, has consolidated to a m inimum void ratio o f 0.446. B y the end o f the
simulation the swelling front has moved further into the core o f the bulkhead and as a
consequence the void ratio at 1.9 m has reduced to 0.445. It should also be noted that the
clay on the downstream end next to the sand f i l l is now beginning to swell after initial
compression.
The displacement o f the steel plate fo r this analysis can be seen in Figure 8.32. When
compared to the displacements simulated in Analysis H-M_1 (Figure 8.28) it can be seen
that the trends are similar. The displacements fo llow the pressure profile shown in Figure
8.3, that is, as the pore water pressure in the sand chamber increased in steps the
displacement in the steel plate responded. However, by the end o f Phase I the clay
bulkhead has still not fu lly saturated and as a result the clay does not swell to the same
degree as that observed in the previous analysis. The consequence o f this is that the
maximum displacement o f the steel plate centre has reduced to 4.2 mm.
8-26
Chapter 8 Simulation of the Tunnel Sealing Experiment
8.5.2.3.3 Analysis_H-M_3
In this analysis the sand f i l l on the downstream face o f the clay bulkhead was prevented
from supplying water to the clay and as a result by the end o f Phase I the clay is still
unsaturated from 1.5 to 2.6 m along the centre-line. This can be seen in Figure 8.33 and
shows a similar pattern to that observed in Analysis_H_3 and Figure 8.26. Continuing this
analysis found that the clay bulkhead became fu lly saturated after 5.7 years.
The void ratio profile shown in Figure 8.34 shows very similar trends to that observed in
Figure 8.31 for A n a l y s i s The patterns o f swelling and compression are the same
and by the end o f the simulation the region o f the clay from 1.5 to 2.6 m has been
compressed to a m inimum void ratio o f 0.445. However, as this region is s till highly
unsaturated the void ratio is not increasing at the same rate as that observed in Figure 8.31.
Since the downstream region o f the clay bulkhead remains unsaturated by the end o f the
simulation this has a significant effect on the displacement o f the steel plate. From Figure
8.35 it can be seen that the maximum displacement at the steel plate centre has reduced to
3.8 mm, a 34% reduction from the simulated behaviour in Analysis_H-M_1.
8.5.2.4 C onclusions
In the hydraulic-mechanical simulation o f Phase I a series o f investigations were
performed which investigated the in itia l and boundary conditions o f the downstream face
o f the clay bulkhead by adopting the same approach as that detailed in the hydraulic
analysis. In the first analysis it was found that the rate o f resaturation o f the clay bulkhead
was slightly accelerated compared to the hydraulic only analysis since the clay became
fu lly saturated just after 2.8 years. This was due to the localised swelling o f the clay along
the sand chamber/clay bulkhead interface and subsequent shrinkage o f the core. Hence
less water was needed to fu lly saturate the core. It was found that the steel plate deformed
incrementally throughout Phase I in response to the applied pore water pressure load
generated by the sand chamber, w ith a maximum displacement o f 5.8 mm being predicted
at the centre o f the steel plate. In the second simulation, it was found that the clay
bulkhead took 4.1 years to reach fu ll saturation, which again was slightly faster than the
simulated behaviour from the corresponding hydraulic analysis. B y the end o f Phase I the
clay bulkhead was still unsaturated in some regions as a result o f less swelling taking place
8-27

Chapter 8 Simulation of the Tunnel Sealing Experiment
compared to the previous analysis, therefore the maximum displacement o f the steel plate
was reduced to 4.2 mm. In the final analysis, where water was effectively supplied from
only the upstream face o f the clay bulkhead, the time taken to reach fu lly saturated
conditions was delayed to 5.7 years. As a result the total displacement o f the steel plate
was further reduced at the end o f Phase I to 3.8 mm.
A preliminary investigation o f the experimental results from Phase I is presented in Section
8.7. This shows that at the start o f the hydration phase water flowed around the edge o f the
clay bulkhead and quickly saturated the sand f i l l on the downstream face. As a result o f
this process the sand f i l l was then able to supply water to the downstream face o f the clay
bulkhead and by the end o f Phase I the bulkhead had resaturated. When compared to the
hydraulic and hydraulic-mechanical analyses that were performed in this study for the
simulation o f Phase I i t can be seen that Analysis_H_1 and A n a l y s i s best represent
the experimental behaviour in the TSX. Therefore, the final results from these analyses
have been employed as in itia l conditions fo r the simulations o f Phase II presented in the
next section.
8-28
Chapter 8 Simulation o f the Tunnel Sealing Experiment
8.6 Simulation o f Phase II
Phase II o f the Tunnel Sealing Experiment began immediately after Phase I had been
completed. The objective o f Phase II is to evaluate the performance o f both the clay and
concrete bulkheads and the host rock in response to elevated temperatures (Guo and
Chandler, 2002). The heating is achieved by circulating heated water through headers
installed in the sand-filled chamber. For the first year o f Phase II the water in the inlet
header w ill be fixed at 50 °C. This w ill be increased to 85 °C fo r the second year o f Phase
II.
In order to perform the numerical simulation o f Phase II four distinct analyses have been
undertaken: 1) a thermal analysis o f the system 2) a hydraulic analysis o f the system 3) a
thermal-hydraulic analysis o f the system, and 4) a thermal-hydraulic-mechanical analysis
o f the system.
8.6.1 Thermal sim ulation o f P h a se II
The thermal simulation (T) o f Phase II o f the Tunnel Sealing Experiment uses the same
two-dimensional axisymmetrical geometry and domain adopted fo r the hydraulic
simulation o f Phase I detailed in Section 8.5.1. The primary objective o f this analysis is to
monitor the thermal response o f the clay bulkhead under the applied thermal conditions. It
also offers a comparison to the temperature results obtained in the thermal-hydraulic (T-H)
analysis detailed later in Section 8.6.3.
8.6.1.1 Initial a n d bou n dary con d ition s
The initia l temperature throughout the domain and fo r all materials was set at 14.5 °C
(AECL, 2002). The far-fie ld rock boundaries have adiabatic conditions prescribed to them
by fix ing the thermal flux to zero. Follow ing in itia l thermal analyses it was found that this
assumption was reasonable since the temperature rise did not approach the rock boundary
by the end o f the Phase II. A zero thermal flux boundary condition was also prescribed on
the central surface o f the section, which represents the axes o f symmetry in the system. As
a simplifying assumption the thermal advection processes in the, relatively permeable,
sand chamber have been assumed to lead to a uniform temperature distribution in this
8-29
Chapter 8 Simulation of the Tunnel Sealing Experiment
region. Therefore the temperature along the sand/clay bulkhead and sand/rock interfaces
was in itia lly set at 14.5 °C and then linearly increased to 50 °C over a 2 day period. The 2
day period is an approximation only and represented the assumed time it would take for the
sand chamber to reach the target temperature o f 50 °C since the temperature increase
would not be instantaneous. This temperature was then kept constant during the first year
o f the analysis. The temperature was then increased over a period o f 2 days to a constant
85 °C for the second year o f the analysis. The surface o f the rock along the open tunnel
was fixed at 14.5 °C to allow the heat to flow into the tunnel.
8.6.1.2 Sim ulation num erics
As summarised in Chapter 4, Section 4.5 the thermal analysis o f the Tunnel Sealing
Experiment was performed using a Preconditioned Conjugate Gradient (PCG) solver
combined w ith a Jacobi preconditioner. The analysis was run in parallel on 4 processors
on the SUN HPC system. The thermal analysis was conducted using the two-dimensional
axisymmetrical mesh detailed in Section 8.5.1.2 and Figure 8.17. The time-step for this
analysis started at 100 seconds and was allowed to increase to a maximum o f 30 days in
response to the rate o f numerical convergence, via the algorithm described in Chapter 4,
Section 4.3. The thermal material parameters for the clay bulkhead, sand, steel plate,
concrete ring and granite rock are described in Section 8.3. This analysis was run for 2
years corresponding to the experimental duration o f Phase II.
8.6.1.3 Sim ulation re su lts
Figure 8.36 (a) shows the temperature contour plot in the Tunnel Sealing Experiment after
the first year o f Phase II. The maximum temperature along the sand chamber boundary is
50 °C and the heat is slow ly being conducted through the clay bulkhead and host granite
rock. Figure 8.36 (b) shows a contour plot o f the final temperature distribution in the
Tunnel Sealing Experiment at the end o f Phase II. In Figure 8.37 a plot o f temperature
through the centre o f the clay bulkhead is shown over time. It can be seen that after 365
days the temperature on the downstream face o f the clay bulkhead has reached 28.9 °C. By
the end o f Phase II this value has risen to 44.8 °C but has not reached steady-state
conditions as there is s till an increase in temperature in the bulkhead.
8-30
Chapter 8 Simulation o f the Tunnel Sealing Experiment
8.6.1.4 C on clusion s
In the thermal simulation o f Phase II the thermal response o f the clay bulkhead to the
elevated temperatures imposed by the heated water in the sand chamber was demonstrated.
The temperature profile in the clay bulkhead had not reached stead-state conditions and
was still rising on the dowstream face. This analysis helps to illustrate how the flow o f
heat through an engineered clay bulkhead is a relatively slow process and is an important
characteristic o f buffer materials in relation to disposal o f heat-producing, high-level
radioactive waste.
8.6.2 Hydraulic sim ulation o f P h a se II
The hydraulic simulation (H ) o f Phase II o f the Tunnel Sealing Experiment uses the same
two-dimensional axisymmetrical geometry and domain adopted fo r the hydraulic
simulation o f Phase I detailed in Section 8.5.1.2 and Figure 8.17. Following the
preliminary investigation o f the experimental results from Phase I, discussed in Section
8.5.2.4, this analysis continues from the end o f Analysis_H_1, w ith the clay bulkhead being
fu lly saturated at the start o f Phase II. Therefore, any further pore water pressure re
distribution w ith in the clay bulkhead as the system approaches steady-state conditions is
investigated. It also allows a comparison to the non-isothermal hydraulic results presented
in the thermal-hydraulic (T-H ) analysis detailed in Section 8.6.3. I t should also be noted
that the sand f i l l region on the downstream face o f the clay bulkhead was still slightly
unsaturated at the end o f Phase I and was starting to resaturate as further water was
provided by the adjacent rock.
8.6.2.1 Initial an d boun dary condition s
The initial hydraulic pore water pressures in the system are taken from the final results for
3.5 years from the simulation, Analysis_H 1, detailed in Section 8.5.1.3.1. The same fixed
hydrostatic pressures are applied along the far-fie ld rock boundaries as detailed in Section
8.4.1.1 and Figure 8.11. A long the sand chamber/clay bulkhead interface and the sand
chamber/rock interface the pore water pressures are fixed at a constant 4 MPa. The
hydraulic boundary conditions applied at the downstream face o f the experiment are the
same as those adopted fo r Analysis_H_1.
8-31
Chapter 8 Simulation of the Tunnel Sealing Experiment
8.6.2.2 Sim ulation num erics
As in the hydraulic analysis o f Phase I a combination o f solver (Bi-CG-STAB) and
preconditioner (ILU -C rout) has been adopted fo r the hydraulic analysis o f Phase II. The
analysis was run in parallel on 4 processors on the SUN HPC system. The hydraulic
analysis was conducted using the two-dimensional axisymmetrical mesh detailed in
Section 8.5.1.2 and Figure 8.17. The time-step fo r this analysis started at 100 seconds and
was allowed to increase to a maximum o f 30 days in response to the rate o f numerical
convergence, via the algorithm described in Chapter 4, Section 4.3. The hydraulic material
parameters fo r the clay bulkhead, sand, steel plate, concrete ring and granite rock are
described in Section 8.3. This analysis was run for 2 years corresponding to the
experimental duration o f Phase II.
8.6.2.3 Sim ulation resu lts
The hydraulic (H ) analysis o f Phase II shows that by the end o f the analysis the pore water
pressure is build ing up in the clay bulkhead. The clay bulkhead is fu lly saturated by the
end o f Phase I and by the end o f Phase II the pore water pressure on the downstream face
is slowly approaching 4 MPa. As can be observed in Figure 8.38, the pore water pressure
on the downstream face o f the clay bulkhead has risen to 2.9 MPa by the end o f the
analysis.
8.6.2.4 C on clusion s
In the hydraulic simulation o f Phase II it was found that by the end o f the analysis the pore
water pressures in the clay bulkhead had not reached steady-state conditions. This was
apparent since the pore water pressure in the clay bulkhead were not in equilibrium with
the hydrostatic pressure in the surrounding rock. This is a slow process since there is little
build up o f pore water pressure in the sand f i l l region on the downstream face o f the clay
bulkhead. However, after 2 years the sand f i l l material has become fu lly saturated and as a
result the pore water pressure in the clay bulkhead along this boundary has risen to 2.9
MPa.
8-32
Chapter 8 Simulation of the Tunnel Sealing Experiment
8.6.3 Therm al-Hydraulic sim ulation of P h a se II
The thermal-hydraulic (T -H ) simulation o f Phase II o f the Tunnel Sealing Experiment uses
the same two-dimensional axisymmetrical geometry and domain adopted for the hydraulic
simulation o f Phase I detailed in Section 8.5.1.2 and Figure 8.17. However, for these sets
o f analyses the hydraulic flow field has been fu lly coupled w ith the thermal response o f the
system. In addition to this the variation o f the hydraulic conductivity w ith temperature has
been incorporated into the simulation for the clay bulkhead. This is due to the reduction in
viscosity o f water at elevated temperatures which results in an increase in the hydraulic
conductivity fo r the material. For the T-H analysis o f Phase II it was also necessary to
investigate the thermal expansion o f water since the clay bulkhead was fu lly saturated by
the end o f Phase I. Hence fo r this simulation, 2 analyses were performed; one with the
thermal expansion o f water taken into account and one without.
8.6.3.1 Initial a n d bou n dary condition s
The in itia l hydraulic pore water pressures in the system are taken from the final results for
3.5 years from the hydraulic simulation o f Phase I detailed in Section 8.5.1.3.1,
Analysis_H_1, and hence assumes that the clay bulkhead was saturated at the start o f Phase
II. The same fixed hydrostatic pressures are applied along the far-field rock boundaries as
detailed in Section 8.5.1.1 and Figure 8.11. A long the sand chamber/clay bulkhead
interface and the sand chamber/rock interface the pore water pressures are fixed at a
constant 4 MPa. A zero flux boundary condition was applied on the surface o f the steel
plate to prevent the transfer o f moisture through this material. The initia l temperature
throughout the domain and fo r all materials was set to 14.5 °C. The far-field rock
boundaries had adiabatic conditions prescribed to them by fix ing the flux to zero. A zero
temperature flux boundary condition was also prescribed on the central surface o f the
section, which represents the axes o f symmetry in the system. The temperature along the
sand chamber/clay bulkhead and sand chamber/rock interfaces was fixed at 50 °C fo r the
first year o f the analysis and then increased up to 85 °C fo r the second year o f the analysis.
8.6.3.2 Sim ulation num erics
It was found that the same combination o f solver (B i-CG-STAB) and preconditioner (ILU-
Crout) adopted fo r the hydraulic analysis o f Phase I performed with the greatest stability
8-33
Chapter 8 Simulation of the Tunnel Sealing Experiment
for the thermal-hydraulic analyses. The analyses were run in parallel on 4 processors on
the SUN HPC system. The coupled thermal-hydraulic analyses were conducted using the
two-dimensional axisymmetrical mesh detailed in Section 8.5.1.2 and Figure 8.17. The
time-step fo r these analyses started at 100 seconds and was allowed to increase to a
maximum o f 30 days in response to the rate o f numerical convergence, via the algorithm
described in Chapter 4, Section 4.3. The thermal-hydraulic material parameters for the
clay bulkhead, sand, steel plate, concrete ring and granite rock are described in Section 8.3.
These analyses were run fo r 2 years corresponding to the experimental duration o f Phase
II.
8.6.3.3 Sim ulation resu lts
8.6.3.3.1 Thermal expansion o f water not considered
Figure 8.39 shows the temperature profile through the centre line o f the clay bulkhead for
the T-H analysis o f Phase II. The temperature distribution compares closely w ith the
results simulated in the Thermal on ly analysis described in Section 8.6.1.3. It can be seen
that after 365 days the temperature on the downstream face o f the clay bulkhead has
reached 29.3 °C. B y the end o f Phase II this value has risen to 45.1 °C.
Figure 8.40 shows the pore water pressure profile through the centre line o f the clay
bulkhead during Phase I I o f the Tunnel Sealing Experiment. For the first 560 days the
pressure pro file through the clay is only gradually increasing as the sand f i l l at the
downstream face o f the clay slow ly resaturates. Eventually, by 650 days the fille r sand has
fu lly resaturated. This resaturation is the result o f the boundary conditions applied to the
downstream face o f the system, as discussed in Section 8.5.1.1. The pore water pressure in
the clay increases towards steady-state values o f 4 MPa, this is clearly evident by the end
o f Phase II where the pore water pressure on the downstream face o f the clay has reached a
value o f 3.1 MPa.
8.6.3.3.2 Thermal expansion of water considered
When the thermal expansion o f water is taken into consideration for the saturated clay
bulkhead the temperature distribution compares closely w ith the results simulated in the
8-34
Chapter 8 Simulation of the Tunnel Sealing Experiment
thermal only analysis described in Section 8.6.1.3. However, there are some distinct
differences observed in the pore water pressures in the clay bulkhead compared to those
detailed in Figure 8.39.
Figure 8.41 shows the pore water pressure profile through the centre line o f the clay
bulkhead during Phase II w ith the thermal expansion o f water taken into account. It can be
seen that in itia lly there is a substantial increase in pore water pressure near the sand
chamber/clay bulkhead interface. The pore water pressure reaches a maximum value o f
6.85 MPa after 3 days into Phase II. This behaviour is due to the pore water in this fu lly
saturated material being heated and trying to expand, and since the system is fu lly
restrained, and in the short-term effectively undrained, this results in an increase o f pore
water pressure. This increase in pressure gradually reduces through the clay and after 1
year the peak has completely dissipated. This redistribution o f pore water pressure in the
clay bulkhead occurs as the system approaches steady-state conditions and equilibrium
w ith the hydrostatic conditions in the surrounding rock. As discussed in Section 8.6.3.3.1
due to the applied boundary conditions the sand f i l l on the downstream face o f the clay
becomes saturated. The pore water pressure throughout the clay bulkhead then begins to
approach steady-state values and by the end o f Phase II the pore water pressure on the
downstream face o f the clay has reached a value o f 3.3 MPa.
8.6.3.4 C on clusion s
In the thermal-hydraulic simulation o f Phase II it was found that the thermal expansion o f
water for the saturated clay made a significant difference to the pore water pressure
profiles through the clay bulkhead. W ithout the thermal expansion o f water considered the
pore water pressure pro file gradually approached the steady-state conditions o f 4 MPa.
W ith the thermal expansion o f water considered there was in itia lly a significant build up o f
pore water pressure in the clay bulkhead w ith a peak o f 6.85 MPa in the region near the
sand chamber/clay bulkhead interface. This was due to the thermal expansion o f pore
water in the saturated voids due to the thermal gradients. By the end o f Phase II the pore
pressures had redistributed and were approaching steady-state conditions throughout the
bulkhead. These analyses help to illustrate the importance o f coupled thermal-hydraulic
processes on fu lly saturated clay materials. The thermal expansion o f the pore water in an
engineered buffer material generates large pressures, which in an operational disposal
8-35
Chapter 8 Simulation of the Tunnel Sealing Experiment
facility would need to be taken into consideration in the design o f the multiple barrier
system.
8.6.4 Therm al-Hydraulic-M echanical sim ulation o f P h ase II
The thermal-hydraulic-mechanical (T -H -M ) simulation o f Phase II o f the Tunnel Sealing
Experiment uses the same geometry and domains adopted for the hydraulic simulation o f
Phase I detailed in Section 8.5.1.2 and Figure 8.17. However, for these sets o f analyses
both the thermal and hydraulic flow fields have been fu lly coupled w ith the mechanical
response o f the system.
8.6.4.1 Initial a n d bou n dary conditions
The in itia l hydraulic pore water pressures in the system are taken from the final results for
3.5 years from the hydraulic-mechanical (H -M ) simulation o f Phase I detailed in Section
8.5.2.3.1, A n a l y s i s and hence assumes that the clay bulkhead was saturated at the
start o f Phase II. The in itia l stresses throughout the system are also taken from the final
results fo r 3.5 years ffom the H -M simulation o f Phase I detailed in Section 8.5.2.3.I. A ll
in itia l conditions and boundary conditions fo r the temperature regime in the analysis are
identical to those detailed in Section 8.6.1.1. The concrete ring is again restrained both in
the vertical and horizontal direction thus preventing any deformation. A ll other materials
are allowed to deform.
8.6.4.2 Sim ulation num erics
As summarised in Chapter 4, Section 4.5, in order to perform the fu lly coupled thermal-
hydraulic-mechanical analysis accurately a direct LU solver was implemented because the
iterative solvers were found to be unstable fo r this type o f analysis. The analyses were run
in serial on the SUN HPC system. The coupled thermal-hydraulic-mechanical analyses
were conducted using the two-dimensional axisymmetrical mesh detailed in Section
8.5.1.2 and Figure 8.17. The time-step fo r these analyses started at 100 seconds and was
allowed to increase to a maximum o f 7 days in response to the rate o f numerical
convergence, via the algorithm described in Chapter 4, Section 4.3. The mechanical
material parameters fo r the clay bulkhead, sand, steel plate, concrete ring and granite rock
8-36
Chapter 8 Simulation of the Tunnel Sealing Experiment
are described in Section 8.3. The analysis was also performed w ith the thermal expansion
o f water taken into consideration. This analysis was run for 2 years corresponding to the
experimental duration o f Phase II.
8.6.4.3 S im ulation resu lts
Figure 8.42 shows the temperature profile through the centre line o f the clay bulkhead for
the T-H -M analysis o f Phase II. The temperature distribution compares closely to the
results simulated in the T-on ly analysis and the T-H analyses described in Sections 8.6.1.3
and 8.6.3.3 respectively. It can be seen that after 365 days the temperature on the
downstream face o f the clay bulkhead has reached 29 °C. By the end o f Phase II this value
has risen to 45 °C. This illustrates how the thermal distribution in Phase II is unaffected by
the introduction o f a coupled mechanical analysis.
Figure 8.43 shows the pore water pressure profile through the centre line o f the clay
bulkhead fo r the T -H -M analysis o f Phase II w ith the thermal expansion o f water taken
into consideration. When compared to the results obtained for the T-H analysis with the
thermal expansion o f water considered, as detailed in Section 8.6.3.3.2, there are some
obvious differences. Primarily, there is no immediate increase in pore water pressure at the
sand chamber/clay bulkhead interface but rather a decrease in pressure, as observed at 30
days. By the end o f the first year the pore water pressures in the clay have recovered and
are starting to approach steady-state. This behaviour can be attributed to the coupling o f
the thermal fie ld and thermal expansion o f the clay. A t the start o f the first year o f Phase II
the temperature in the sand chamber is raised from 14.5 °C to 50 °C. This steep
temperature gradient has an immediate and significant effect on the expansion o f the clay
bulkhead. This can be seen in Figure 8.44, which shows the void ratio along the centre line
o f the clay bulkhead throughout Phase II. A t 30 days the void ratio along this interface has
risen from 0.463 to 0.478. This increase in pore volume leads to a reduction in the pore
water pressure, as shown in Figure 8.43.
A t the start o f the second year the temperature in the sand chamber is raised a further 35 °C
and again the clay bulkhead is seen to expand in response to this thermal gradient. A t 390
days the void ratio has risen to 0.497 and the pore water pressure consequently decreases.
By the end o f Phase I I the clay bulkhead has expanded to a void ratio o f 0.5. The pore
water pressure profile through the clay has fu lly recovered and the sand f i l l has resaturated
8-37
Chapter 8 Simulation of the Tunnel Sealing Experiment
completely. The pore water pressure on the downstream face o f the clay has reached a
value o f 3.11 MPa.
Figure 8.45 shows the displacement o f nodal surface positions on the steel plate at the
downstream face o f the clay bulkhead during the H -M analysis o f Phase I and the T-H-M
analysis o f Phase II. The figure shows the variation o f displacement from the centre o f the
steel plate to the edge o f the plate that intersects w ith the concrete ring. The results up to
the end o f Phase I (3.5 years) were discussed in Section 8.5.2.3.I. It can be seen that
throughout Phase II there is additional movement o f the steel plate in response to the
thermal gradients and the subsequent thermal expansion o f the clay bulkhead. This can be
seen in two d istinct patterns corresponding to the increase in temperature to 50 °C in the
first year and 85 °C in the second year. A t the end o f the first year the steel plate has
moved a maximum o f 6.7 mm and by the end o f Phase II the centre o f the steel plate is
predicted to have moved by 8 mm. The displacement in the steel plate incrementally
reduces across its surface to zero at the concrete ring intersection.
8.6.4.4 C on clu sion s
In the thermal-hydraulic-mechanical simulation o f Phase II it was found that the thermal
expansion o f the clay bulkhead had a notable effect on the pore water pressure distribution.
As the temperature was increased the void ratio o f the clay increased and the pore water
pressure consequently reduced. This was apparent both at the start o f the first year and
second year o f Phase II. This expansion was also evident on the surface o f the steel plate
whereby the centre had deformed 8 mm by the end o f Phase II.
8-38
Chapter 8 Simulation of the Tunnel Sealing Experiment
8.7 Prelim inary comparison o f the experimental behaviour
with the simulated behaviour
The main objective o f the modelling exercise fo r the Tunnel Sealing Experiment was to
investigate the behaviour o f the clay bulkhead during Phase I and II via a series o f
predictions. A t the time o f the investigation limited experimental data from the TSX was
available for comparison. Subsequently, AECL have provided further information
regarding the experimental performance o f the clay bulkhead and therefore the following
section presents a prelim inary comparison o f the behaviour.
8.7.1 Hydraulic behaviour during P h ase I
Towards the end o f Phase I o f the TSX moisture sensors indicated that the clay bulkhead
had largely achieved saturation and piezometers had begun to register positive pressures
w ithin the entire clay bulkhead (AECL, 2001). Only a small region near the core o f the
bulkhead appeared to be unsaturated. It was noted however that at, or near saturation, most
o f the moisture sensors went out-of-range, failed and/or flooded, resulting in loss o f
readings and in some cases water leakage through the cabling (AECL, 2001). Figure 8.46
shows the suction profiles w ith in the clay bulkhead after approximately 3 years. It can be
seen that both the upstream and downstream faces o f the bulkhead have fu lly resaturated
and that there is on ly a small unsaturated zone localised in the core o f the bulkhead.
The transient behaviour o f the hydraulic regime in the clay bulkhead is illustrated in Figure
8.47 (adopted from suction profiles in Chandler et al., 2002b). This shows the degree o f
saturation profile along the centre o f the clay bulkhead (section C-C) over time. This
experimental behaviour can be compared to the simulated hydraulic behaviour discussed in
Section 8.5. Experimentally, it can be seen that the initial hydraulic conditions w ithin the
bulkhead were not homogenous compared to the conditions adopted for the analyses. This
was potentially due to the installation procedure and the d ifficu lty in achieving a
completely homogenous material. As water was pumped into the sand chamber it can be
seen that the bulkhead began to resaturate from the upstream face. However, part o f the
core o f the bulkhead was seen to resaturate faster than the upstream face. This proved
problematic during the experiment as seepage took place through preferential pathways in
and around the bulkhead as the sand chamber was pressurised incrementally. As a result,
8-39
Chapter 8 Simulation of the Tunnel Sealing Experiment
after approximately 1 year water had entered the system from the downstream end. This
resulted in dual-directional saturation o f the bulkhead. This type o f hydraulic recharge was
analysed in Analysis _H_1 and Analysis_H-M_1. Reference to Figures 8.20 and 8.27
shows that the simulated hydraulic response o f the system during Phase 1 represented the
experimental behaviour reasonably well as a result o f adopting this approach. Whilst the
model did not represent the complex seepage effects it should be noted that the overall
hydraulic patterns were captured w ith the bulkhead approaching complete saturation by 3
years.
8.7.2 M echanical behaviour during P h ase I
During the experiment, displacements in the clay bulkhead and in the steel plate were
monitored using a combination o f instruments. These included linear potentiometers
installed in the upstream face o f the clay bulkhead, a sonic probe array to measure internal
movement w ith in the bulkhead and L D T ’s and L V D T ’s mounted on instrumentation
conduits to measure the movement o f the steel plate (AECL, 2001). It was found that by
the end o f Phase I the linear potentiometers were all out o f range, having exceeded their
travel capacity or mechanically failed.
Figure 8.48 shows the displacement o f the steel plate during Phase I as measured by the
LD T ’s mounted across its surface. It can be seen that during the first 160 days when the
pressure in the sand chamber was increased to 750 kPa there is a large movement recorded
in all sensors, w ith a maximum displacement o f 10 mm in CLDT1 at the top o f the tunnel.
A t mid-height o f the steel plate a displacement o f 6.3 mm is measured. A t 550 days the
pressure is further increased to 2 MPa in the sand chamber and an immediate response is
seen in the movement o f the plate. A t mid-height the displacement is seen to increase by
an increment o f approximately 2.3 mm. Towards the end o f Phase I the pressure is further
increased to 4 MPa and again additional movement can be observed in the steel plate, with
an incremental increase o f approximately 2.5 mm in the centre o f the plate. By the end o f
Phase I a total displacement o f 12.5 mm has been measured at mid-height o f the plate.
This measured behaviour can be compared to the simulated behaviour from
Analysis_H-M_1 as illustrated in Figure 8.29. Preliminary comparisons show that the
initial large displacements measured in the experiment are not captured by the model. A
maximum displacement o f 0.7 mm is simulated in the centre o f the plate after 160 days as
8-40
Chapter 8 Simulation of the Tunnel Sealing Experiment
the hydraulic pressure is increased to 750 kPa throughout the system. It is unclear why
such large displacements were in itia lly measured in the experiment, especially for such a
relatively small increase in pressure. It is unlikely to be a result o f just the hydraulic
response since much smaller movements are recorded later when the pressure is increased
to 2 MPa and then 4 MPa. Potentially, it could be a result o f highly sensitive sensors
identifying displacements following installation o f the bulkhead as the system equilibrates
with the host rock. This could also explain why greater displacements were measured at
the top o f the tunnel since noticeable warping was observed in the vertical plane o f the
tunnel follow ing tunnel excavation.
Further comparisons o f the results do show however that the incremental displacement o f
the plate after the pressure increased to 2 MPa and 4 MPa was reasonably well captured by
the model. This can be seen at the centre o f the plate where incremental displacements o f
1.1 mm and 2.8 mm were simulated. When compared to the corresponding measured
values there is a difference o f 1.2 mm and 0.3 mm respectively. This gives confidence in
the ability o f the model to represent the complex mechanical behaviour o f the TSX to a
reasonable level o f accuracy.
8.7.3 Thermal behaviour during P h ase II
Limited experimental information was available concerning the thermal behaviour o f the
clay bulkhead during Phase II o f the TSX. However, some transient experimental data was
presented by Guo et al. (2003) for the first 180 days o f the heating o f the bulkhead and
therefore some preliminary comparisons are made here.
Figure 8.49 shows the simulated and measured temperatures in the clay bulkhead at
different axial distances from the upstream face. The simulated results are taken from the
coupled thermal-hydraulic analysis discussed in Section 8.6.3.3.1, where the thermal
expansion o f the pore water is not considered. It can be seen from Figure 8.49 that there is
a relatively weak correlation between the simulated and measured results. In the
simulation results the temperature throughout the bulkhead increases at a faster rate
resulting in higher overall temperatures. A t an axial distance o f 0.2 m the maximum
increase in temperature is simulated to be 4.6 °C/day compared to a measured increase o f
approximately 0.5 °C/day. A t approximately 180 days the simulated temperature is 46.4 °C
and the corresponding experimental value is 40.1 °C; giving a percentage difference o f
8-41
Chapter 8 Simulation of the Tunnel Sealing Experiment
13.5 %. A t greater axial distances from the upstream face o f the clay bulkhead similar
patterns are observed. A t an axial distance o f 1.4 m a maximum difference o f 20.5 % can
be observed between the simulated and measured values after 180 days.
The principal reason for these differences is due to the adoption o f the thermal boundary
condition prescribed on the upstream face o f the clay bulkhead in the analysis. This
boundary condition assumes that there is an almost immediate thermal response in the
bulkhead when the heating phase begins. In reality however, heated water is circulated
through the sand chamber first and the upstream face o f the clay bulkhead is seen to heat
up at a much more gradual rate. This delay in the thermal response o f the bulkhead also
means that temperatures are lower when compared to the simulated behaviour. A t the time
o f the numerical investigation this simplified approach was adopted based on the limited
data available and therefore this preliminary comparison highlights the importance o f using
accurate boundary conditions when modelling complex large scale in-situ experiments.
8.7.4 C onclusions
The outcome from these preliminary comparisons shows that the model is able to capture
reasonable trends in the thermal, hydraulic and mechanical behaviour o f the TSX. The
rates o f resaturation o f the clay bulkhead in Phase I were w ell captured in some o f the
analyses where wetting occurred both on the upstream and downstream faces o f the
bulkhead. W hilst the initial deformation behaviour o f the steel plate was not captured
quantitatively by the model, subsequent incremental displacements were simulated more
accurately. Finally, the simulated thermal response in the clay bulkhead showed that the
simplified thermal boundary condition did not fu lly represent the actual in-situ conditions.
However, there was still a reasonable agreement in the results by 180 days o f heating. To
conclude, this exercise has highlighted the importance o f comparing predicted and
observed behaviour at each stage in the modelling process. The comparisons are
encouraging and illustrate that the model is able to simulate the thermo/hydro/mechanical
behaviour o f the Tunnel Sealing Experiment.
8-42
Chapter 8 Simulation of the Tunnel Sealing Experiment
8.8 Conclusions
In conclusion a fu lly coupled mechanistic thermal-hydraulic-mechanical model has been
applied to the simulation o f the behaviour o f AEC L’s Tunnel Sealing Experiment.
Primarily two-dimensional axisymmetrical analyses have been performed with a small
range o f three-dimensional hydraulic analyses performed fo r the granite prior to the
commencement o f Phase I. A comprehensive range o f analyses have been undertaken to
investigate the performance o f the Tunnel Sealing Experiment during Phase I and Phase II.
A number o f conclusions can be drawn from these analyses and are discussed below.
For this particular simulation exercise it was found that it was more beneficial both in
terms o f complexity and simulation runtimes to employ a smaller two-dimensional
axisymmetrical model as opposed to a more complex three-dimensional model. The
symmetrical nature o f the Tunnel Sealing Experiment was advantageous to this type o f
analysis and as a result a larger range o f investigations could be performed in the allotted
time frame. A comparison between the hydraulic results for both two-dimensional
axisymmetrical and three-dimensional analyses showed them to be very similar and gave
confidence in using the two-dimensional approach fo r all subsequent simulations.
However, it is acknowledged that this approach does have inherent simplifications and that
certain assumptions were made in the simulations.
A range o f hydraulic and hydraulic-mechanical simulations were performed for Phase I o f
the TSX. It was apparent from the results that the initia l conditions on the downstream
face o f the clay bulkhead had a large influence over the rates o f resaturation in the
bulkhead. When the sand f i l l was installed saturated this provided an additional source o f
water to the bulkhead and resaturation occurred at a faster rate than in the analyses where
the sand f i l l was installed unsaturated. This was significant because it was found from the
actual experiment that wetting occurred on the downstream face o f the bulkhead. This was
due to problems w ith the clay bulkhead construction where pathways through and around
the bulkhead were not sealed properly and allowed water to seep through and collect at the
downstream face. Hence, this illustrated the importance o f applying the correct initial and
boundary conditions when performing the numerical analyses.
Research into the dual porosity o f clay materials has been gathering steady momentum in
recent years and the investigation o f the micro/macro behaviour o f the clay bulkhead
8-43
Chapter 8 Simulation of the Tunnel Sealing Experiment
yielded significant results. This process was implemented via a first approximation
whereby a modified hydraulic conductivity relationship was used which assumed that 94 %
o f available moisture was adsorbed in the micropores o f the clay. It was seen that when
the micro/macro effects were taken into account the rate o f resaturation in the bulkhead
was significantly delayed, by up to a factor o f 8. This is an important result as it illustrates
how a conventional flow model could potentially under-predict saturation times for buffer
materials i f the complex structure o f the material is not taken into consideration. Therefore
greater research into these processes is required.
It was found from the hydraulic-mechanical simulations o f Phase I that the coupled effect
o f the mechanical behaviour had a small influence over the hydraulic behaviour in the clay
bulkhead. The variation in the void ratio as a result o f swelling and consolidation was
small but illustrated the process by which water flowed through the bulkhead, saturating
and swelling each subsequent region. This swelling process was reflected on the
downstream end o f the experiment where the movement in the steel plate was simulated.
Again, the in itia l conditions in the sand f i l l were significant, as the displacements were
greater in the saturated case. The level and degree o f swelling is an important
consideration in the design o f multip le barrier systems where excessive displacements are
undesirable. Therefore, this series o f analyses show the need to accurately establish initial
conditions in the proxim ity o f highly-swelling materials.
In Phase II o f the TSX the thermal response o f the system was investigated. Both coupled
and non-coupled analyses were performed. When the thermal analysis results were
compared to the thermal-hydraulic results there was very little difference in the thermal
regime in the clay bulkhead by the end o f Phase II. Since the clay bulkhead was saturated
at the start o f this Phase it was necessary to investigate the effect o f the thermal expansion
o f the pore water. It was found that this made a significant difference to the pore water
pressure profiles through the clay bulkhead w ith a large increase in pore water pressure
clearly evident at the start o f the simulation. Therefore, this phenomenon is o f importance
and should be taken into consideration in the design o f multiple barrier systems to
accommodate large pore pressures.
The thermal expansion o f the clay bulkhead was investigated in the coupled thermal-
hydraulic-mechanical simulation and it was found that this did effect both the pore water
pressure and void ratio. As the temperature was increased the void ratio o f the clay
8-44
Chapter 8 Simulation of the Tunnel Sealing Experiment
increased and the pore water pressure consequently reduced. The thermal expansion in the
clay also gave rise to additional movement in the steel plate. This combined with swelling
could have a significant effect on restraint systems and could lead to large pressures
developing.
A short investigation was conducted after the numerical modelling programme to make
preliminary comparisons between the simulated and measured results. Limited data was
available and therefore only the hydraulic and mechanical behaviour o f Phase I and the
thermal behaviour o f Phase II were considered. It was shown that the model did capture
the hydraulic behaviour o f the bulkhead reasonably well and simulated the movement o f
the steel plate in a qualitative sense. The model was less successful in simulating the
thermal behaviour o f the bulkhead due to the adoption o f a simplified thermal boundary
condition. However, the results were encouraging and illustrated that the model was able
to simulate the behaviour o f the Tunnel Sealing Experiment reasonably well.
The Tunnel Sealing Experiment represents a valuable investigation into the parameters or
design elements that potentially affect seal performance. The most important outcome
from the experiment is that functional fu ll scale repository seals can be constructed using
currently available technology. There is a need to monitor the performance o f these
repository seals over time and numerical modelling plays an integral role in providing
short and long-term predictions o f their potential behaviour in response to thermal and
hydraulic gradients. This information can then be accommodated into future designs to
improve construction and performance and give confidence in the ability o f repository
seals to fu lfil their role in a deep geological repository for the safe disposal o f high-level
nuclear waste.
8-45
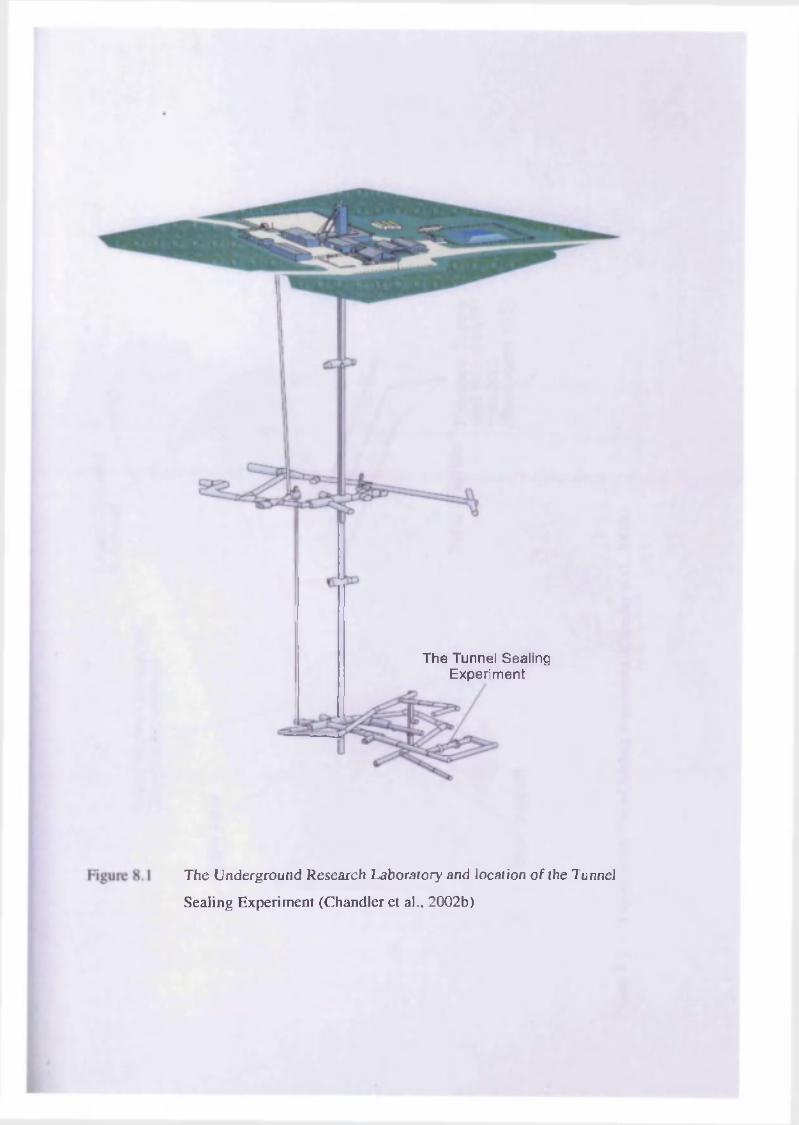
The Tunnel Sealing Experim ent
The Underground Research Laboratory and location o f the Tunnel
Sealing Experiment (Chandler et al., 2002b)
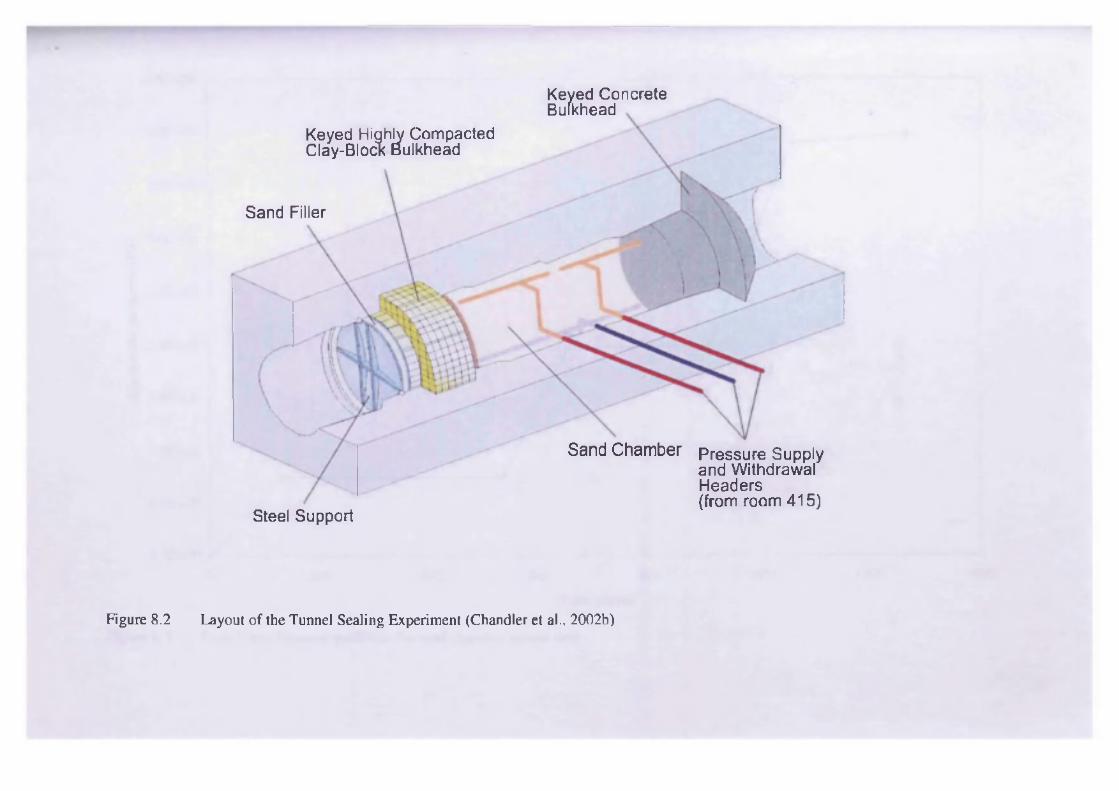
Sand Filler
Steel Support
Keyed Highly Compacted Clay-Block Bulkhead
Sand Chamber Pressure Supply and Withdrawal Headers {from room 415)
Keyed Concrete Bulkhead
Figure 8.2 Layout o f the Tunnel Sealing Experiment (Chandler et al., 2002b)
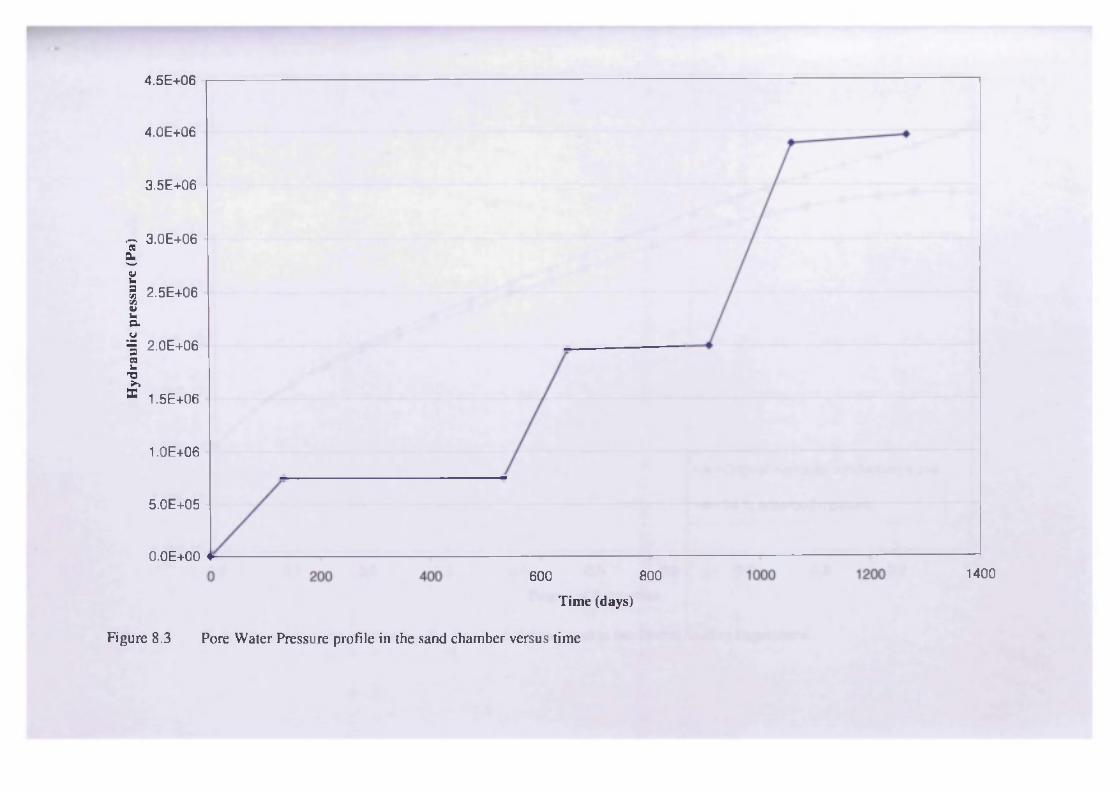
Hyd
raul
ic
pres
sure
(P
a)
4.5E+06
4.0E+06
3.5E+06
3.0E+06
2.5E+06
2.0E+06
1.5E+06
1.0E+06
5.0E+05
O.OE+OO600 800
T im e (days)
1400
Figure 8.3 Pore Water Pressure profile in the sand chamber versus time
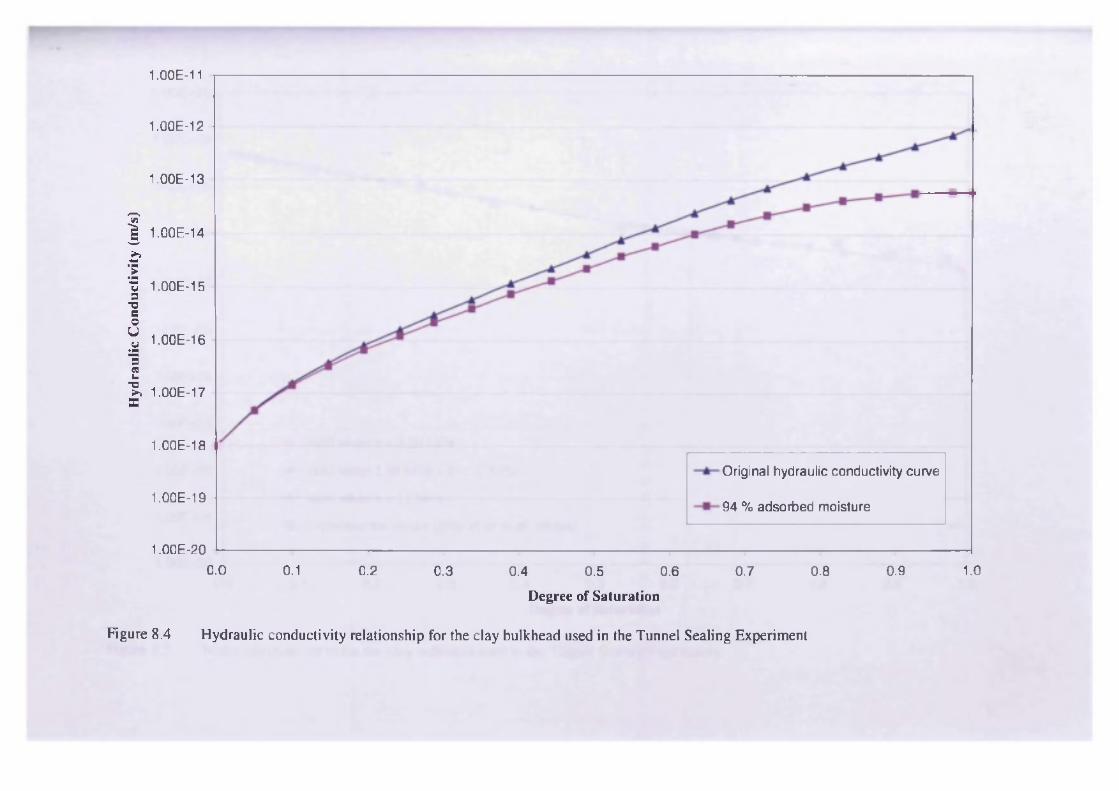
Hyd
raul
ic
Con
duct
ivit
y (m
/s)
1.00E-11
1.00E-12
1.00E-13
1.00E-14
1.00E-15
1.00E-16
1.00E-17
1.00E-18
Original hydraulic conductivity curve
1.00E-1994 % adsorbed moisture
1.00E-200.0 0.1 1.00.2 0.3 0.4 0.6 0.7 0.8 0.90.5
D egree o f S a tu ra tio n
Figure 8.4 Hydraulic conductivity relationship for the clay bulkhead used in the Tunnel Sealing Experiment
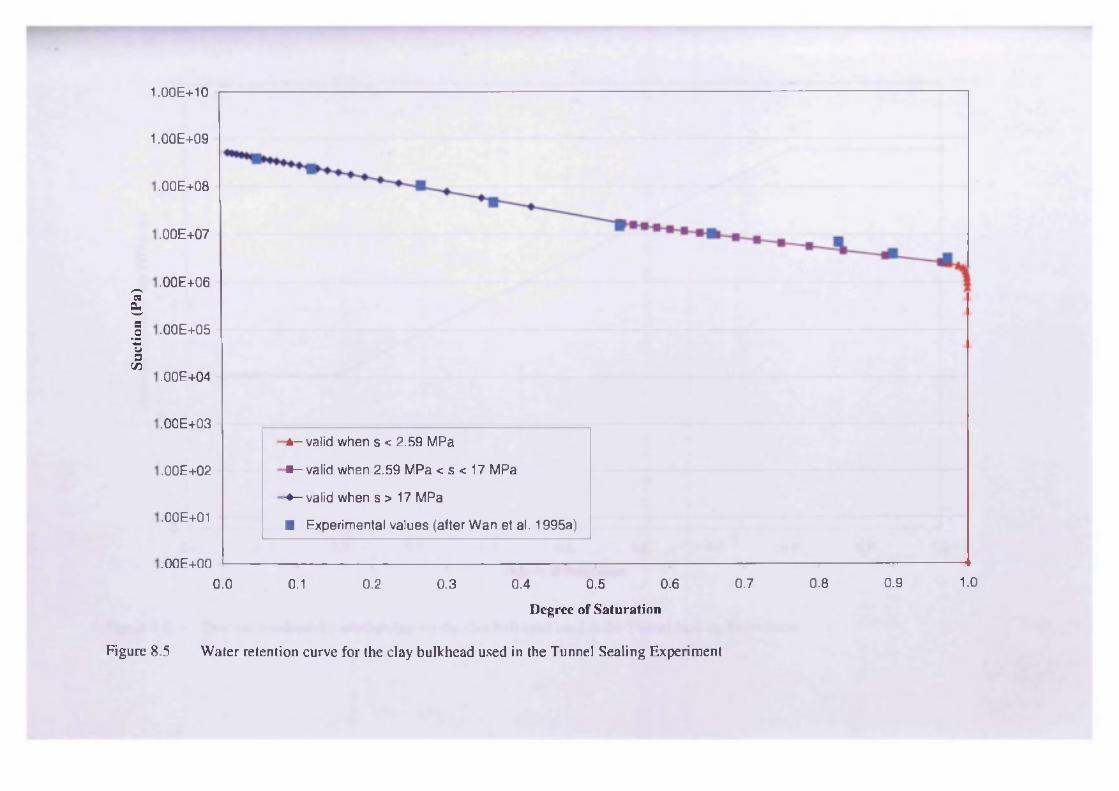
Suct
ion
(Pa)
1.00E+10
1.00E+09
.00E+08
.00E+07
.00E+06
.00E+05
.00E+04
.00E+03■ — valid when s < 2.59 MPa
-■-valid when 2.59 MPa < s < 17 MPa
-♦—valid when s > 17 MPa
■ Experimental values (after Wan et al. 1995a)
.00E+02
.00E+01
.OOE+OO1.00.8 0.90.0 0.5 0.6 0.70.1 0.2 0.3 0.4
D egree o f S a tu ra tio n
Figure 8.5 Water retention curve for the clay bulkhead used in the Tunnel Sealing Experiment
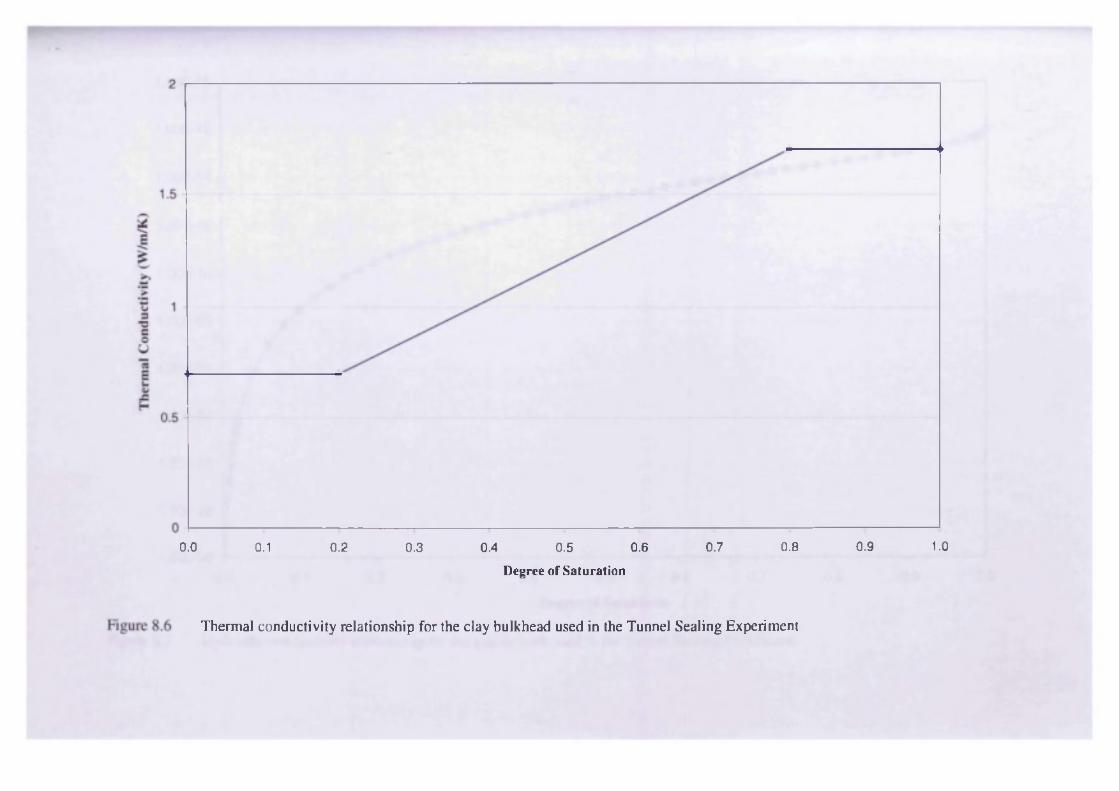
0.0 0.1 0.2 0.3 0.4 0.5 0.6 0.7 0.8 0.9 1.0
Degree of Saturation
Thermal conductivity relationship for the clay bulkhead used in the Tunnel Sealing Experiment
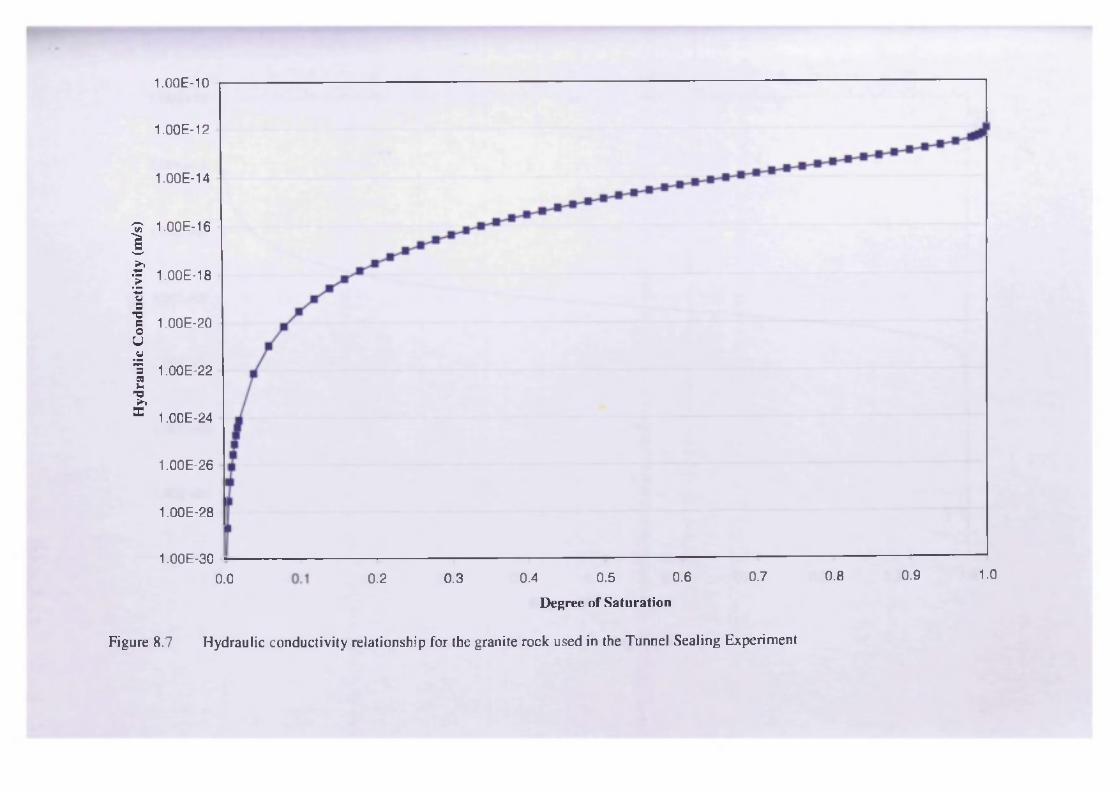
Hyd
raul
ic
Con
duct
ivit
y (m
/s)
1.00E-10
1.00E-12
1.00E-14
1.00E-16
1.00E-18
1.00E-20
1.00E-22
1.00E-24
1.00E-26
1.00E-28
1.00E-301.00.90.80.6 0.70.50.3 0.40.0 0.2
D egree o f S a tu ra tio n
Figure 8.7 Hydraulic conductivity relationship for the granite rock used in the Tunnel Sealing Experiment
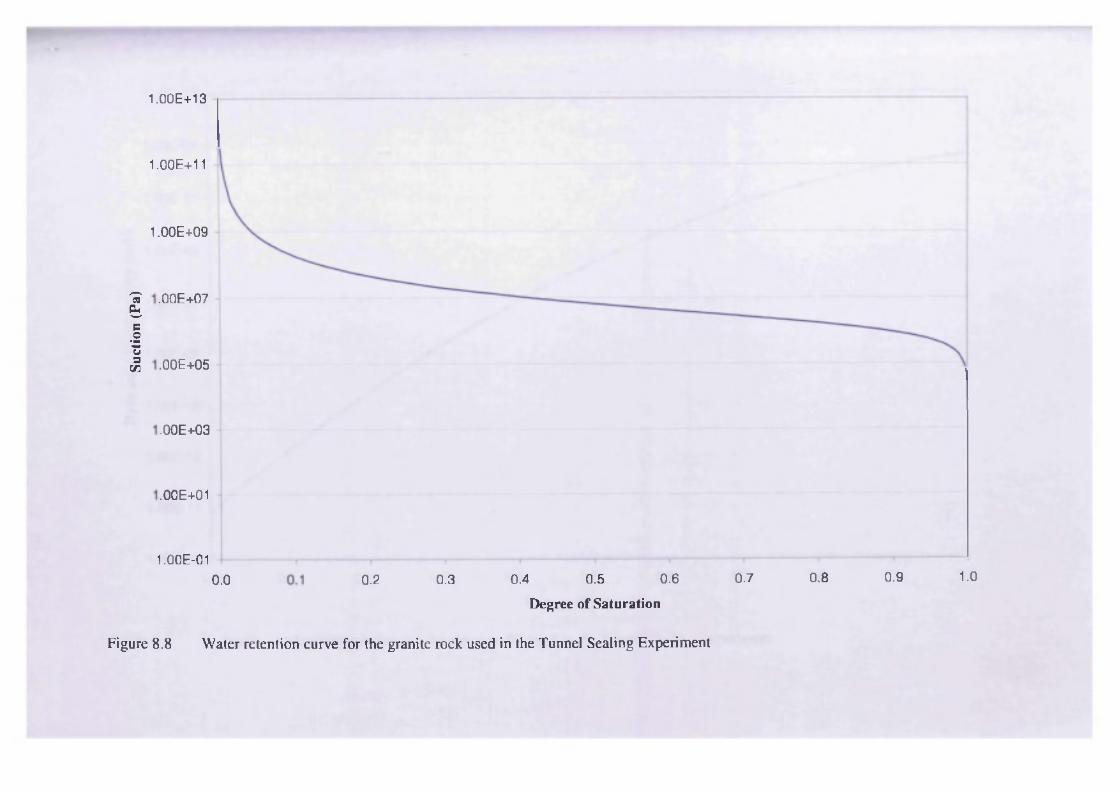
Suct
ion
(Pa)
1.00E+13
1.00E+11
1.00E+09
.00E+07
.00E+05
.00E+03
.00E+01
1.00E-011.00.8 0.90.70.60.3 0.4 0.50.0 0.2
D egree o f S a tu ra tio n
Figure 8.8 Water retention curve for the granite rock used in the Tunnel Sealing Experiment
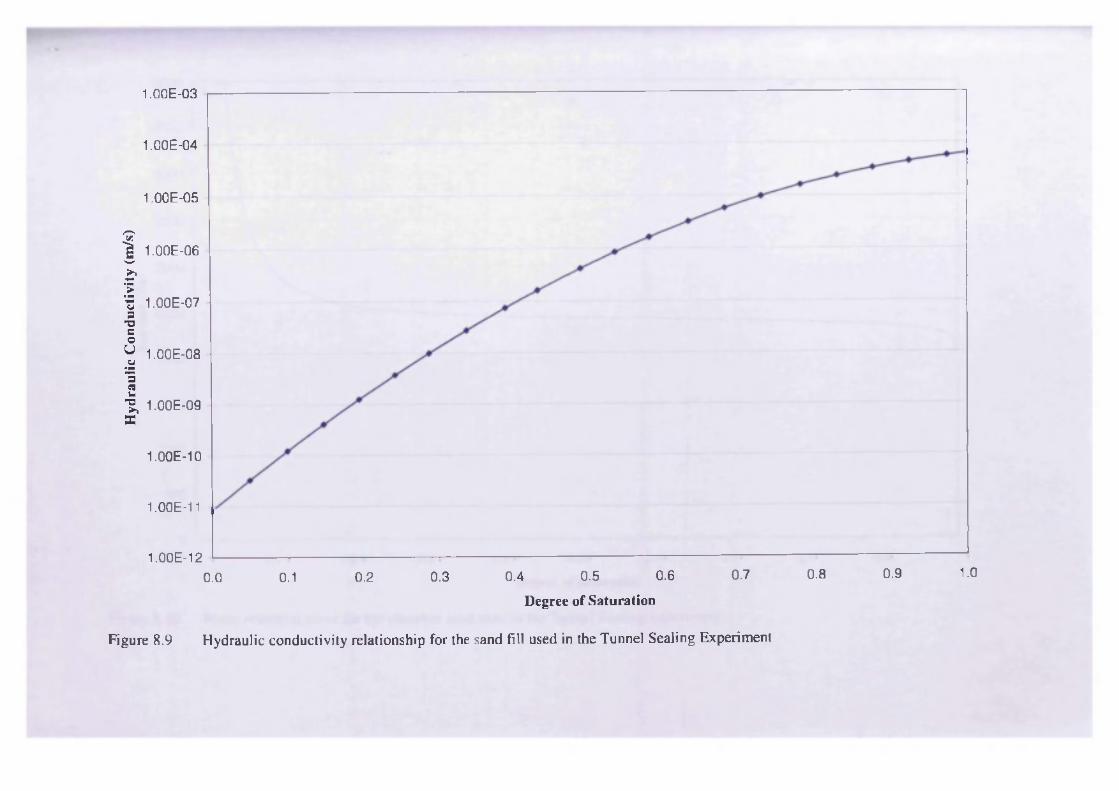
Hyd
raul
ic
Con
duct
ivit
y (m
/s)
1.00E-03
1.00E-04
1.00E-05
1.00E-06
1.00E-07
1.00E-08
1.00E-09
1.00E-10
1.00E-11
1.00E-121.00.90.80.70.60.50.3 0.40.1 0.20.0
D egree o f S a tu ra tio n
Figure 8.9 Hydraulic conductivity relationship for the sand F ill used in the Tunnel Sealing Experiment
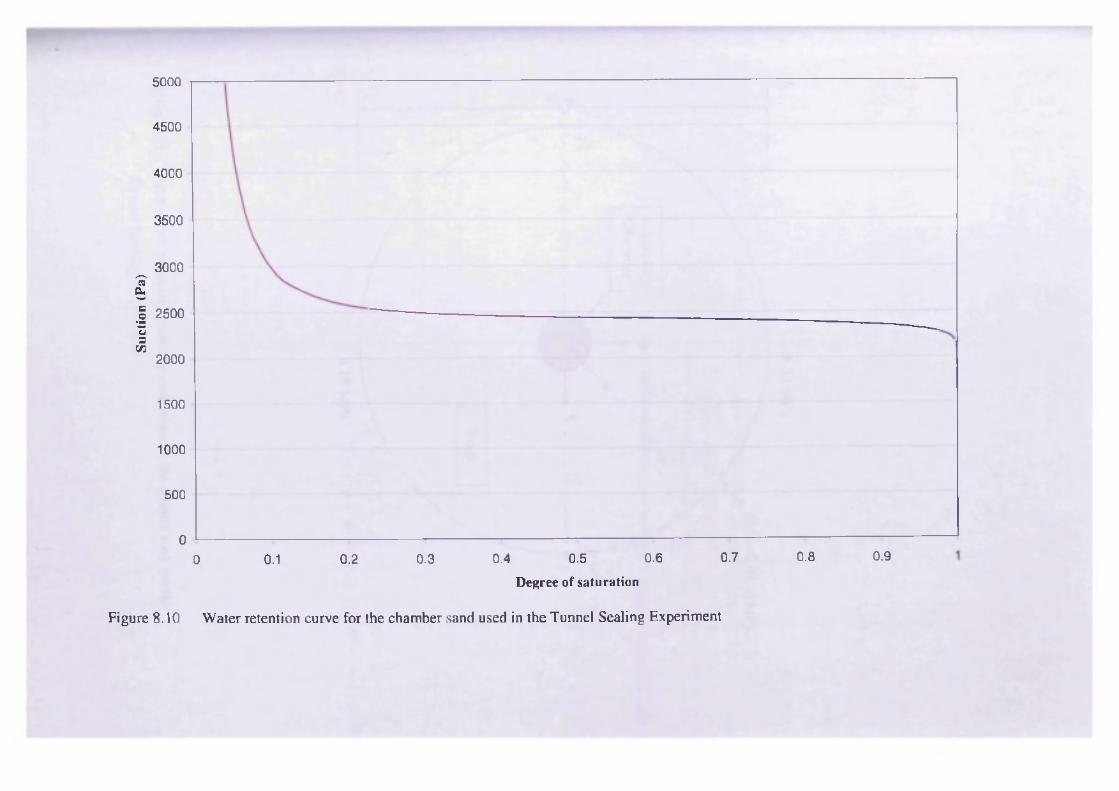
Suct
ion
(Pa)
5000 r -
4500
4000
3500
3000
2500
2000
1500
1000
500
0 -
0 0.1 0.2 0.3 0.4 0.5 0.6 0.7 0.8 0.9
Degree of satu ra tion
Figure 8.10 Water retention curve for the chamber sand used in the Tunnel Sealing Experiment
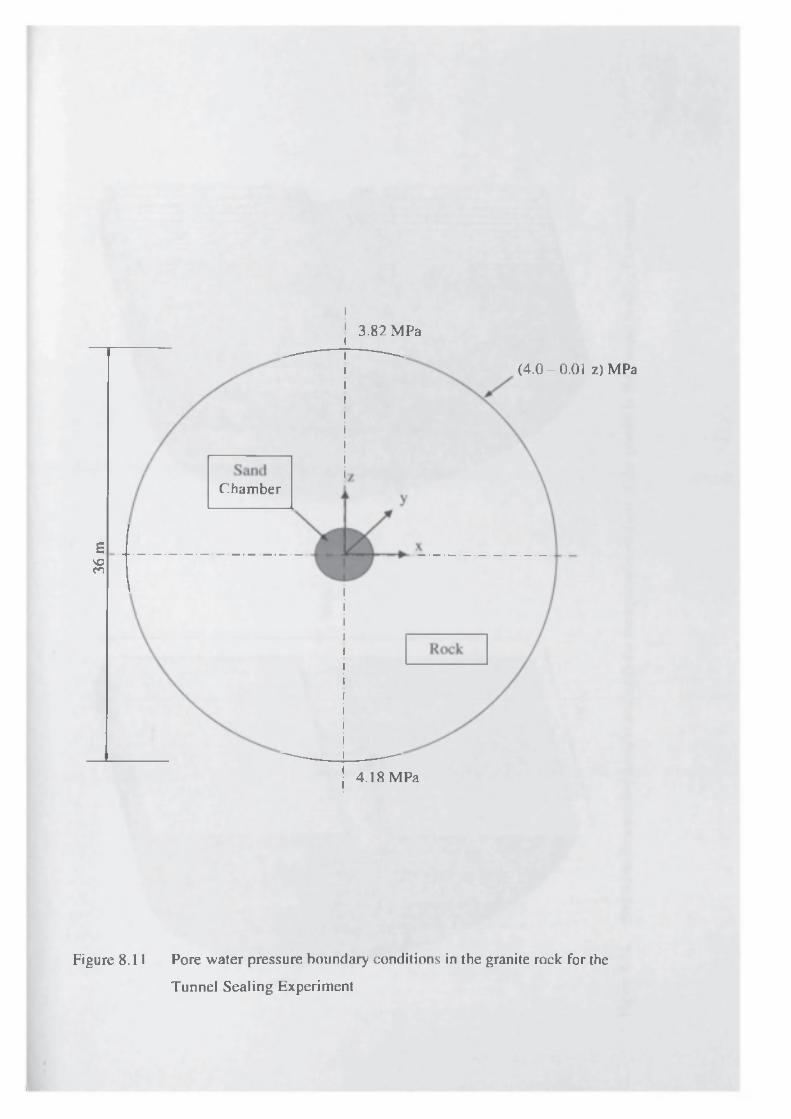
36 m
3.82 MPa
Chamber
(4.0-0.01 z) MPa
4.18 MPa
Figure 8.11 Pore water pressure boundary conditions in the granite rock for the
Tunnel Sealing Experiment
■
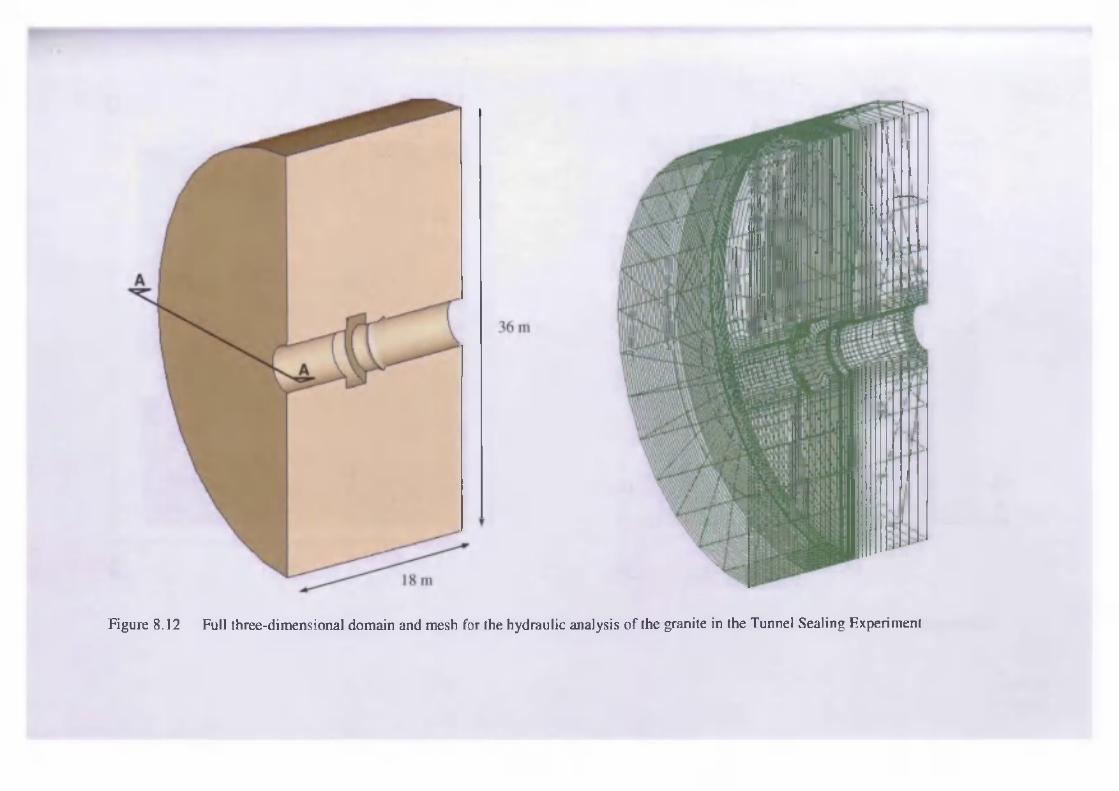
Figure 8.12 Full three-dimensional domain and mesh for the hydraulic analysis o f the granite in the Tunnel Sealing Experiment
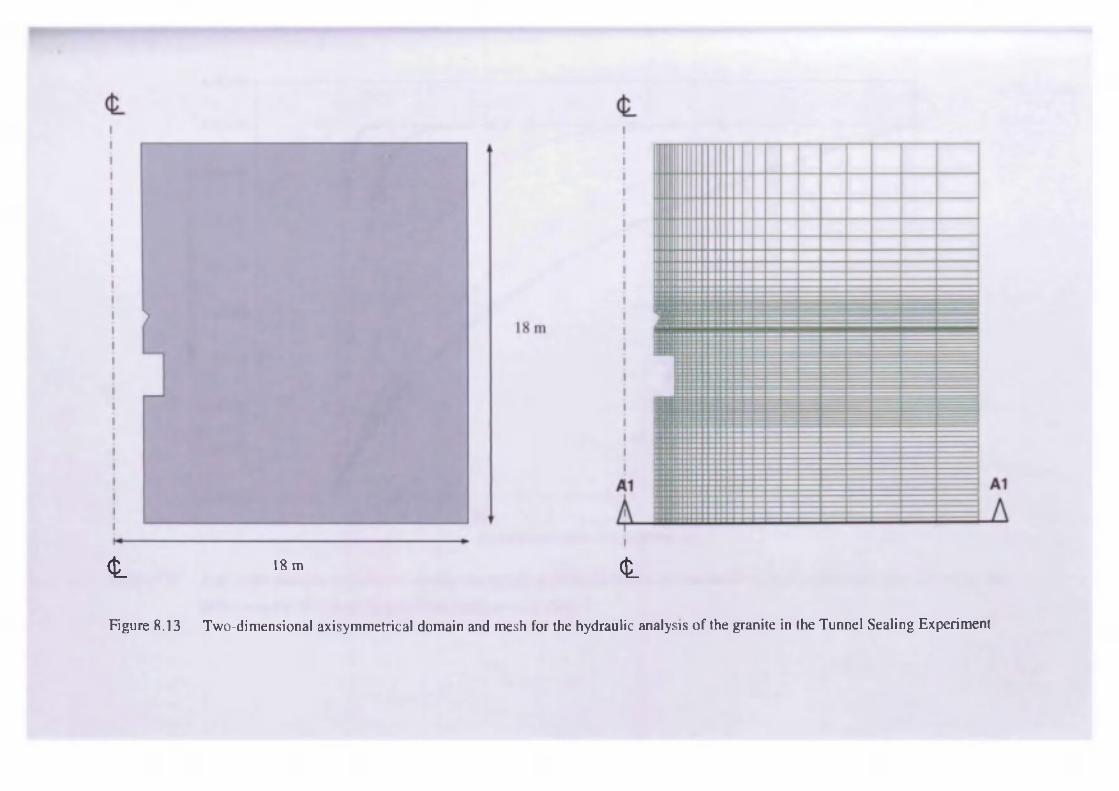
<tL
Figure 8.13
18m (£_
Two-dimensional axisymmetrical domain and mesh for the hydraulic analysis o f the granite in the Tunnel Sealing Experiment
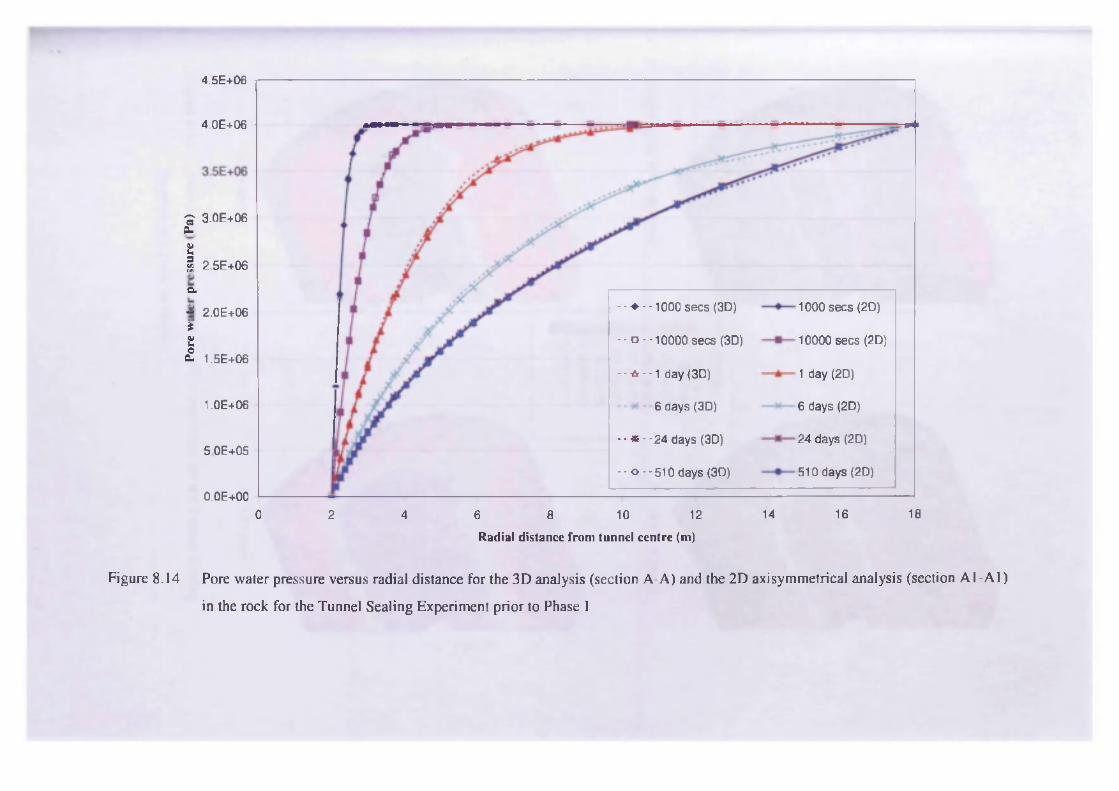
4.5E+06
4.0E+06
9 3.0E+06 £8| 2 .5E+06
a
- 2 .0E+06 *I
£ 1.5E+06
- • ♦ • ■ 1 0 0 0 secs (3D) 1000 secs (2D)
- • o • - 10000 secs (3D) 10000 secs (2D)
1 d a y (2D)• • a - • 1 day (3D)
1.0E+06 6 days (3D) 6 days (2D)
- • * - - 2 4 days (3D) 24 days (2D)5.0E+05
510 days (2D)- • o - -5 1 0 days (3D)
0.0E+00
0 2 4 6 8 10 12 14 16 18
Radial distance from tunnel centre (m)
Figure 8.14 Pore water pressure versus radial distance for the 3D analysis (section A-A) and the 2D axisymmetrical analysis (section A 1 - A 1)
in the rock for the Tunnel Sealing Experiment prior to Phase I
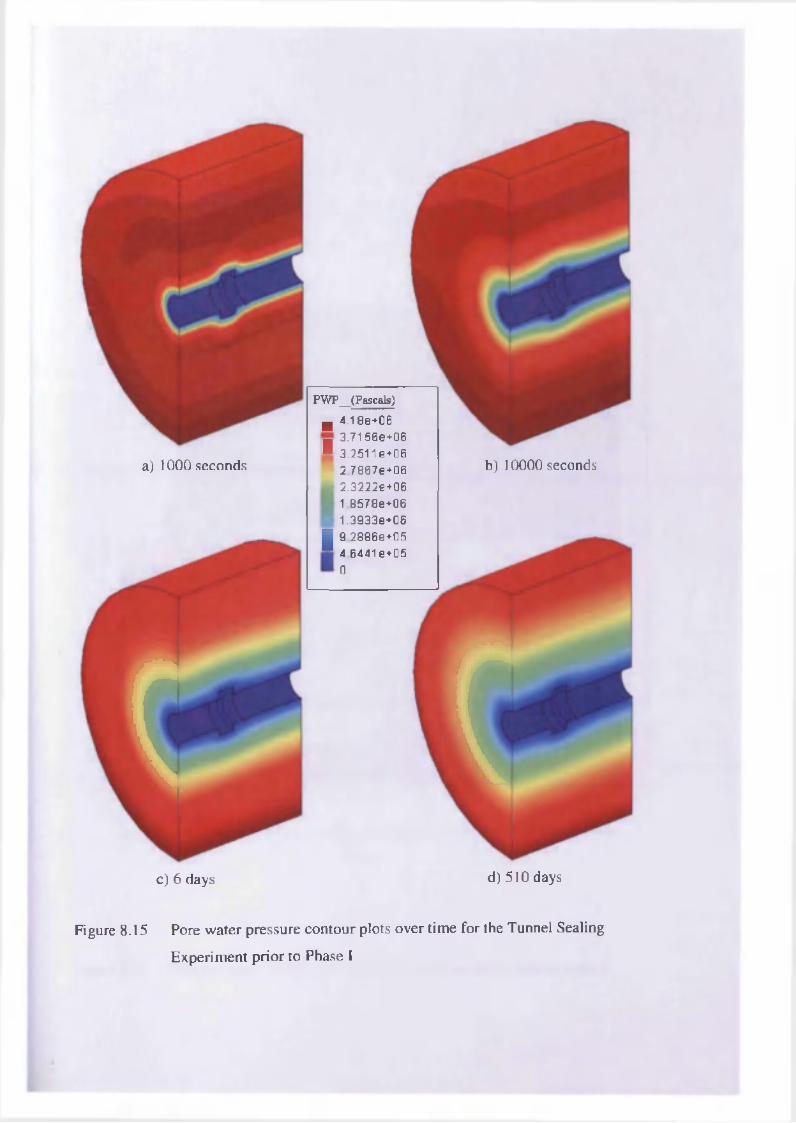
a) 1000 seconds
t
PWP__(Pascals)
n 4 .1 8e+063 .7 1 56e+ 06
■ 3 .2 5 1 1 G+062 .7 867 e+ 06
2 .3 222 e+ 06
1 85 78 e+ 06
1 .3 933 e+ 06
19 .2 886 e+ 05
4 .6 4 4 1 e+05
0
b) 10000 seconds
I
c ) 6 days d) 510 days
Figure 8.15 Pore water pressure contour plots over time for the Tunnel Sealing
Experiment p rio r to Phase 1
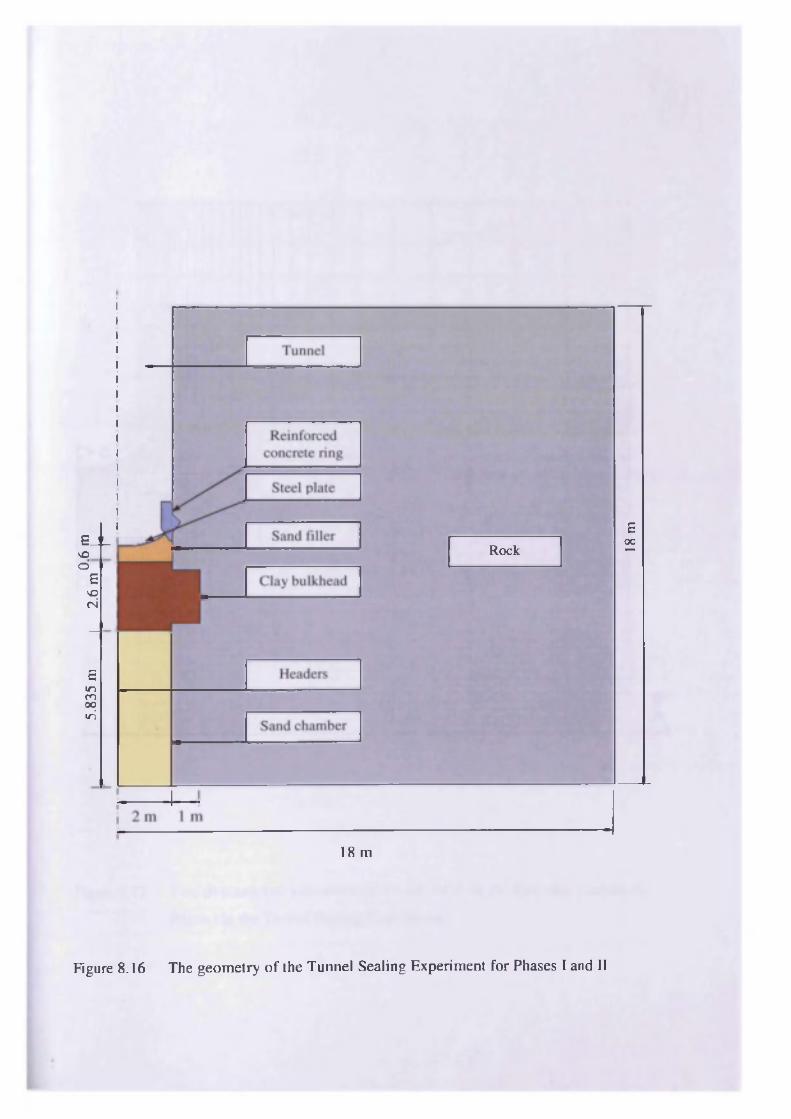
5.835
m
| 2.6
m
E_t_VOd
18 m
Rock
Figure 8.16 The geometry o f the Tunnel Sealing Experiment for Phases I and II
18 m
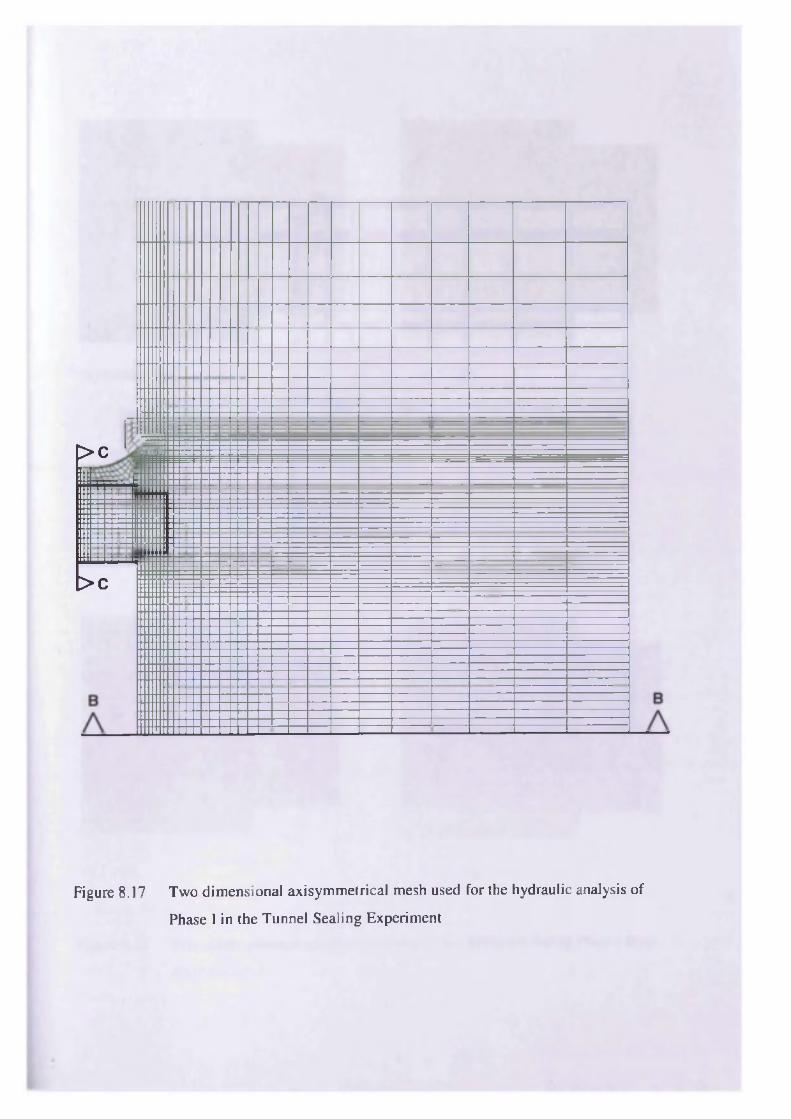
> c
> c
Figure 8.17 Two dimensional axisymmetrical mesh used for the hydraulic analysis of
Phase I in the Tunnel Sealing Experiment
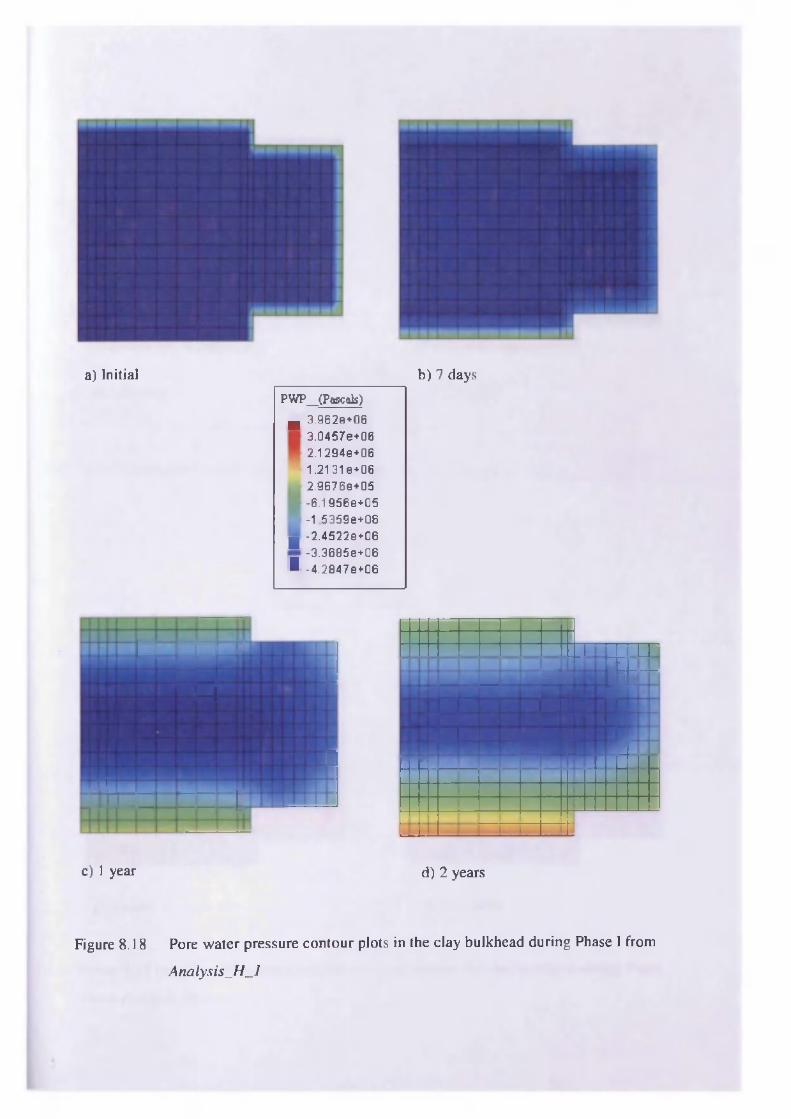
a) Initial b ) 7 days
PWP__(Pascals)
■ 3 .9 62e + 0 6
3 .0 457 e+ 06
2 .1 294e+06
1 .2 1 31 e+06
2 .9 676 e+ 05-6 .1 95 6e + 0 5
-1 53 59 e + 0 6
y -2 .4 5 2 2 e + 0 6
-3 .3 6 8 5 e + 0 6I -4 .2 8 4 7 e + 0 6
z zz rm. z __—i
ttN _□"! __tvrz_- - _ f ___
c) 1 year
_J_[ 1 N_ Z L i t -_
Z L _ I I Z . j.L z . . I I ± ]
_ . z ZT _ Iz ZD_
t T I 1UN — — [ I N I U
d ) 2 years
Figure 8.18 Pore water pressure contour plots in the clay bulkhead during Phase I from
A na lys is_ H _ l
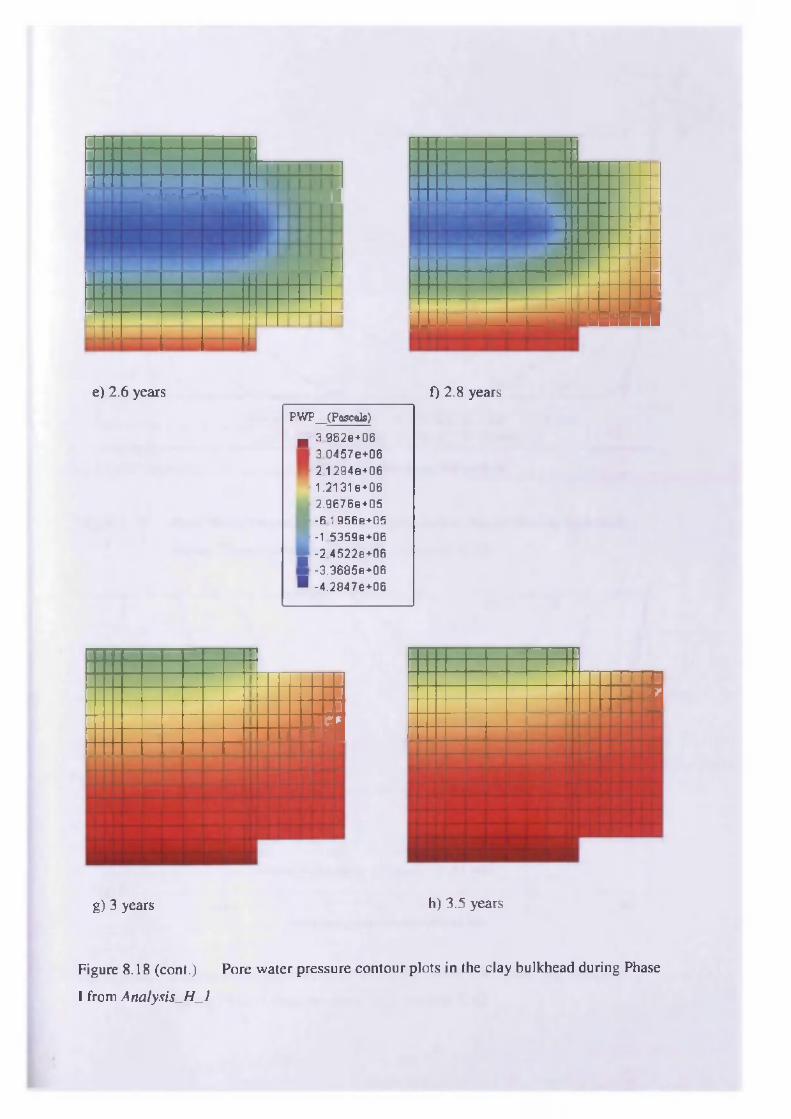
' I R a i ' l i i S B
^ M i i ia a u i
e) 2.6 years
'1-.'J_
“__ — _
J _U _
I 1———u ___i - L- LLLu JJJ
f) 2.8 years
PWP__(Pascals)
n 3 .962e+06
3 .0457e+ 06
2 .1294e+06
1 .2 1 3 1 e+062 .9676e+ 05
-6 .1 956G+05
-1 53 59 e+ 06
-2 .45 22 e+ 06u
-3 .3 6 8 5 e + 0 6y -4 .28 47 e+ 06
; I
g) 3 years
I
h) 3.5 years
Figure 8.18 (cont.) Pore water pressure contour plots in the clay bulkhead during Phase
I from Anu lys is_H _ l
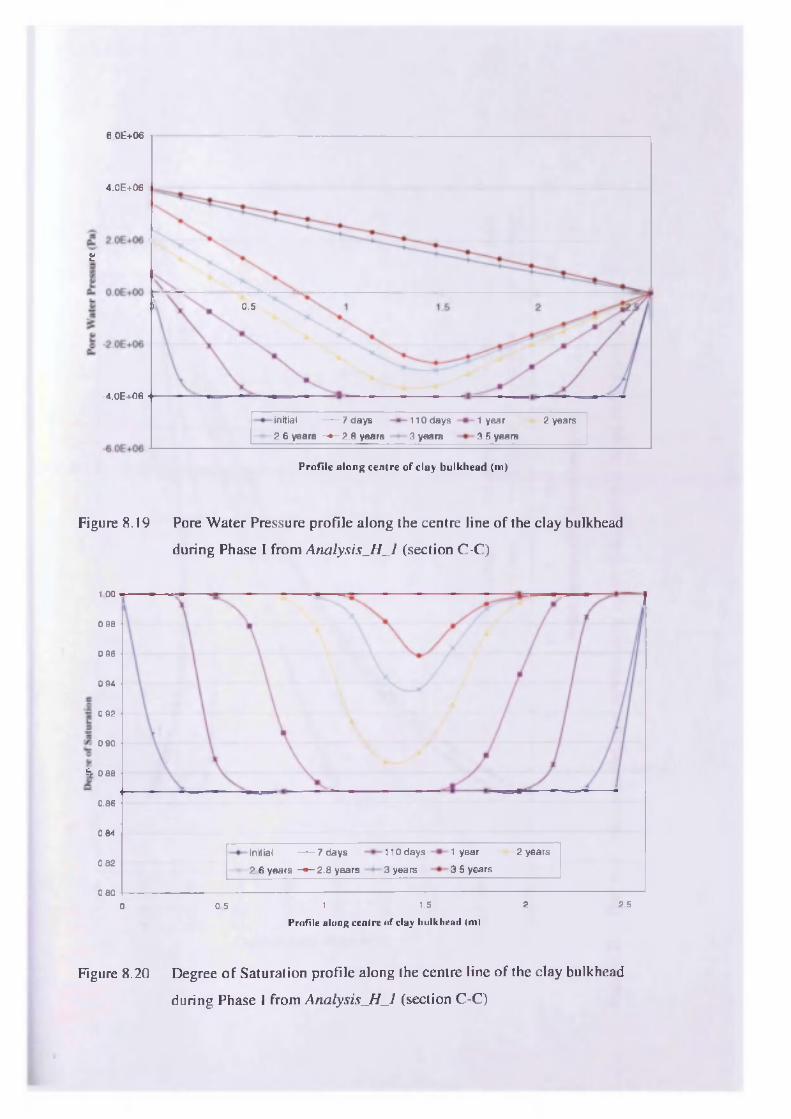
6.0E+06
4.0E+06
0/t.
0.5
-4.0E+06
initial ------ 7 days
2 .6 years - * - 2 .8 years
110 days
3 years
1 year
3 5 years
2 years
P rofile along centre o f c la y bulkhead (m)
Figure 8.19 Pore Water Pressure profile along the centre line o f the clay bulkhead
during Phase I from Analysis_H_1 (section C-C)
1.00
0.98
0 96
0 94
0.92
0.90
i i 0.88
0.86
0.84
110 days
3 years
1 year
3.5 years
2 yearsin itia l ------ 7 days
2 .6 years - « - 2 . 8 years082
0801.5 2 2.50 5 10
Profile along centre o f clay bulkhead (m)
Figure 8.20 Degree o f Saturation profile along the centre line o f the clay bulkhead
during Phase I from A na lys is_ H _ l (section C-C)
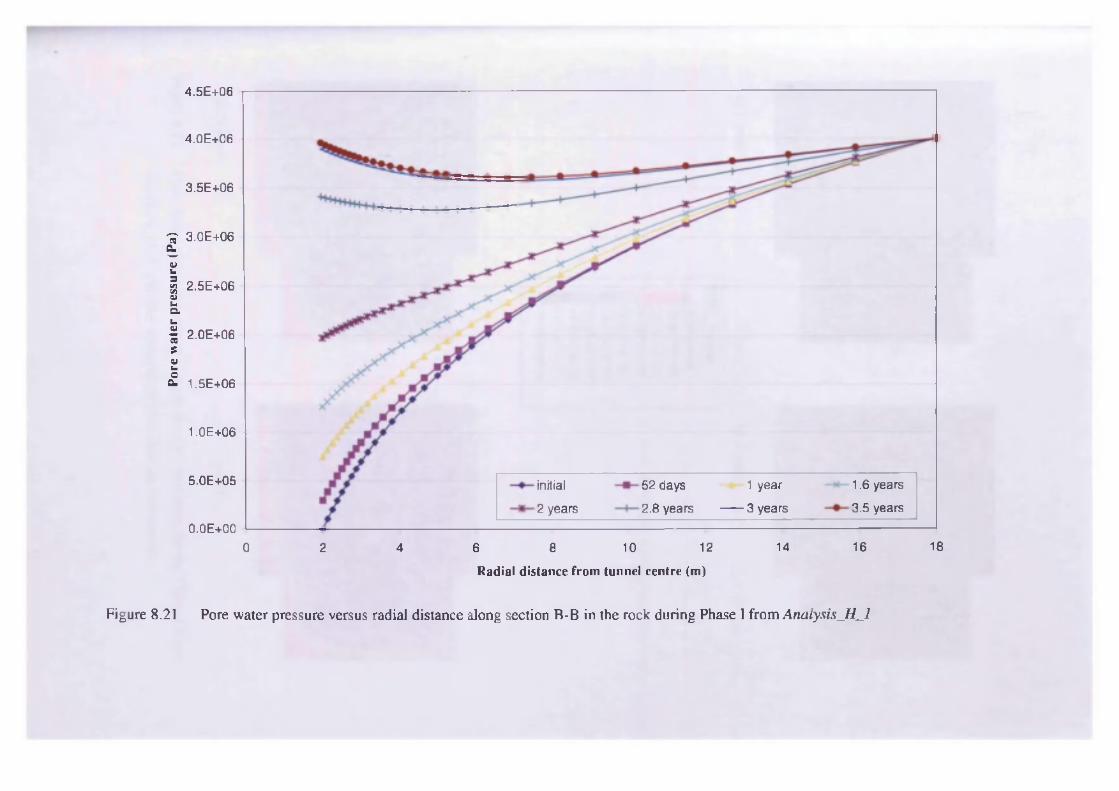
Pore
w
ater
pr
essu
re
(Pa)
4.5E+06
4 .0 E + 0 6
3 .5 E + 0 6
3 .0 E + 0 6
2 .5 E + 0 6
2 .0 E + 0 6
1 .5 E +0 6
1 .0E + 06
5 .0 E + 0 5 1 .6 yea rs
3 .5 yea rs
in itia l
2 yea rs
5 2 days
2 .8 yea rs
1 yea r
— 3 yea rs
0 .0 E + 0 0
0 2 4 6 8 10 12 14 16 18
Radial distance from tunnel centre (m)
Figure 8.21 Pore water pressure versus radial distance along section B-B in the rock during Phase 1 from Analysis_H _l
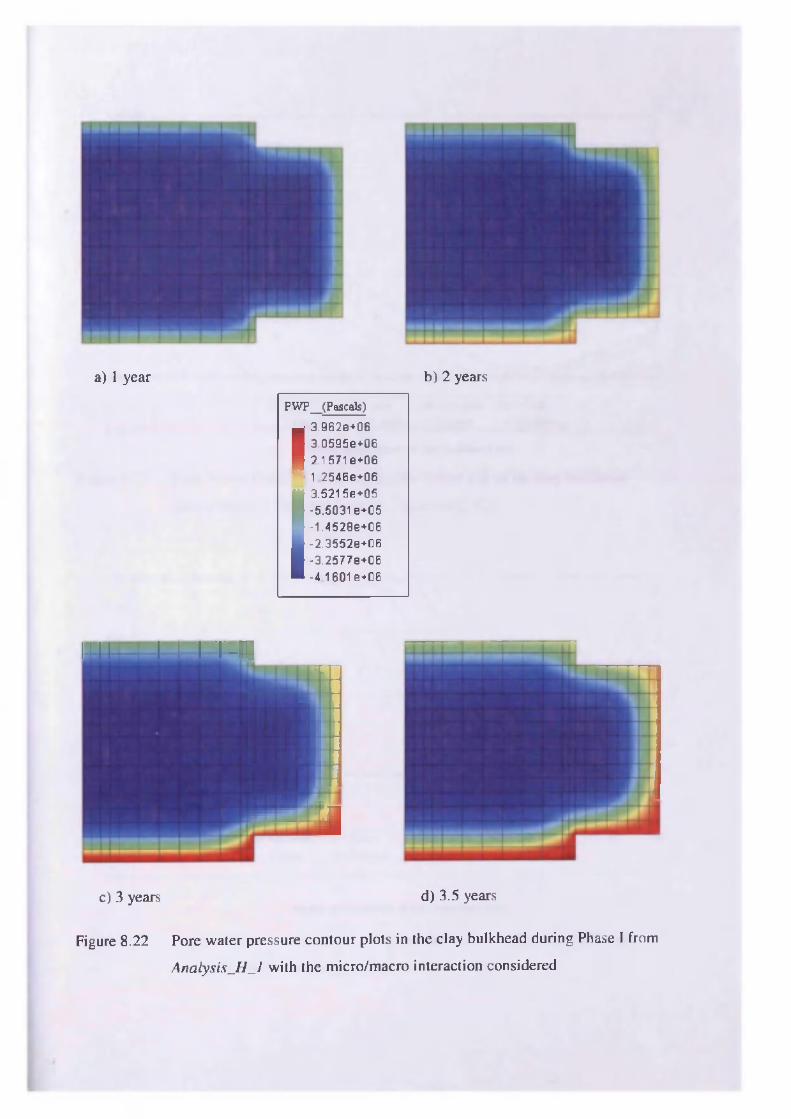
a) 1 year b ) 2 years
PW P (Pascals)
I 3 .962e+06
3 .0595e+ 06
2.1571 e+06
• 1 .25 46e + 0 6
13 .5 2 1 5e+05
-5.5031 e+05
-1 ,4528e+06 -2 .3 5 5 2 e + 0 6
-3 .2 5 7 7 e + 0 6
-4 1601 e+06
| ; | [ ■ . | [ [ ~ | ' _ pa mi
1im'■t am
c) 3 years d) 3.5 years
Figure 8.22 Pore water pressure contour plots in the clay bulkhead during Phase 1 from
A na lys is_H _ I w ith the micro/macro interaction considered
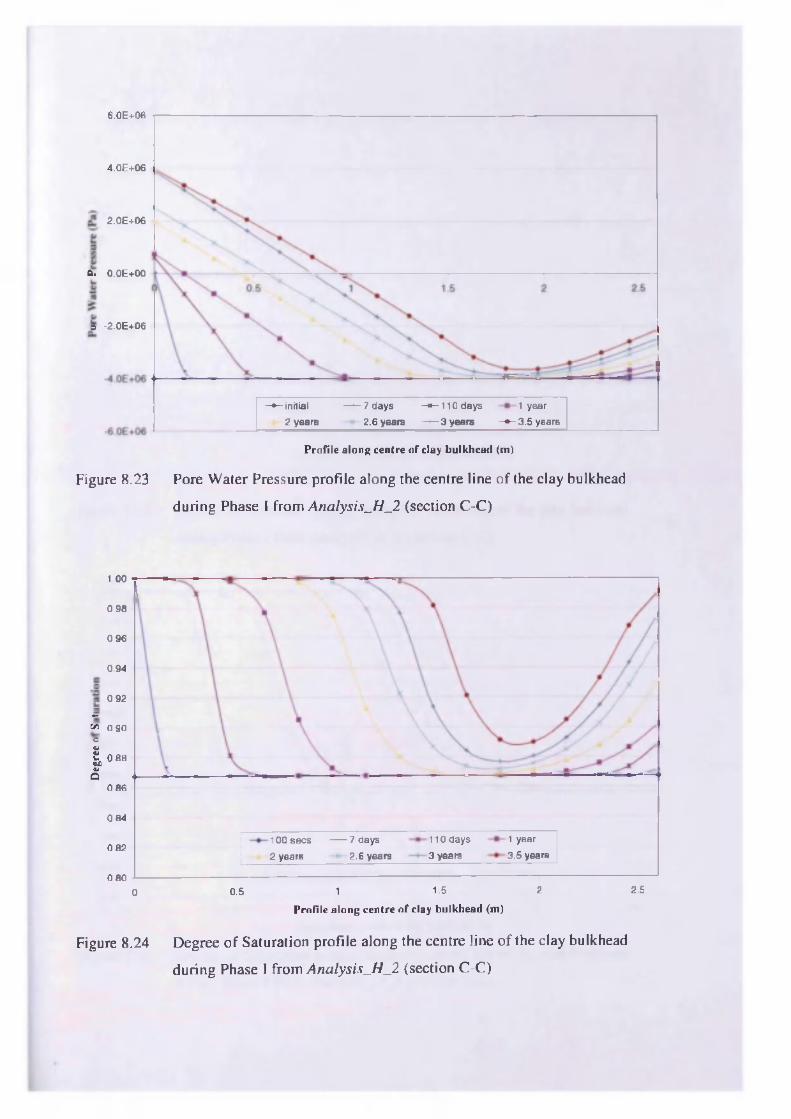
6.0E+06
4.0E+06
2.0E+06
ft. O.OE+OO
o -2.0E+06
- * - initial ------7 days - * - 1 1 0 days 1 year
2 years 2 .6 years - * - 3 years - * - 3 . 5 years
P rofile along centre o f clay bulkhead (m)
Figure 8.23 Pore Water Pressure profile along the centre line o f the clay bulkhead
during Phase 1 from Analysis_H_2 (section C-C)
1.00
0.98
0.96
0.94
0.92
«-C /5
O0.90
1 0 8 8 Ofo0.86
0.84
110 days
3 years
1 year
3 .5 years
100 secs -------7 days
2 years0.82
2 .6 years
0.802.51.5 210.50
P rofile along centre o f clay bulkhead (m)
Figure 8.24 Degree o f Saturation profile along the centre line o f the clay bulkhead
during Phase 1 from Analysis_H _2 (section C-C)
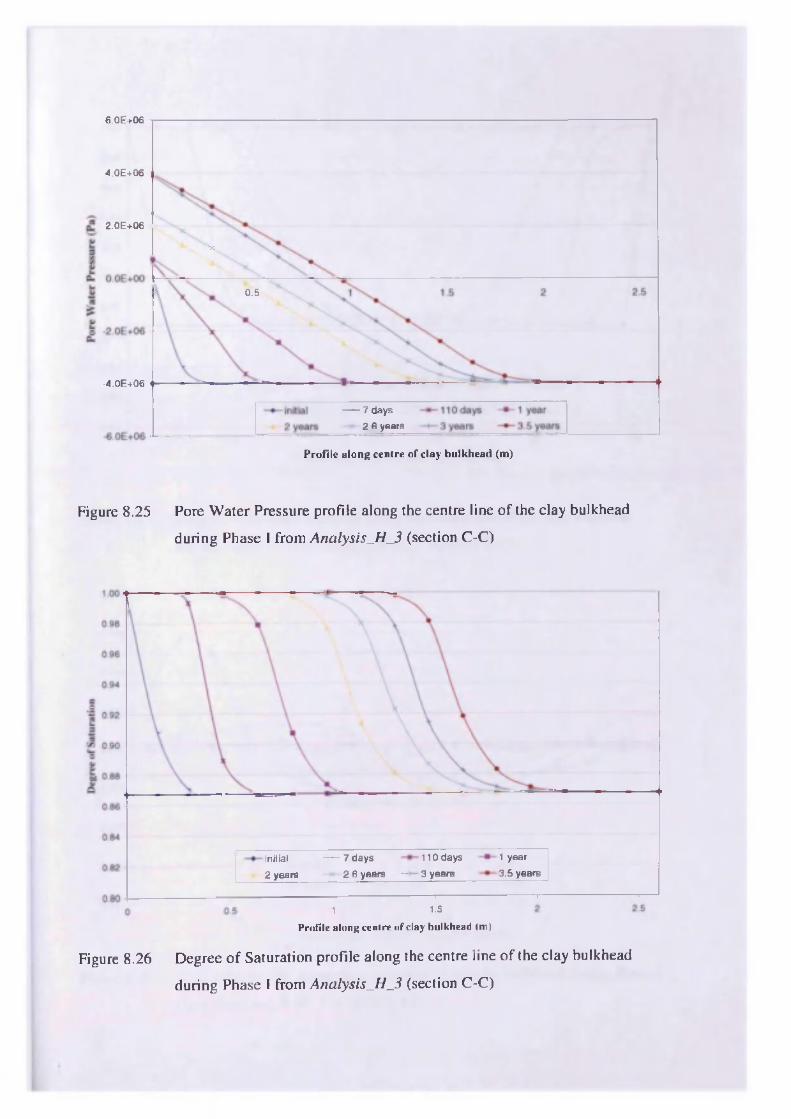
6.0E+06
4.0E+06
2.0E+06
X .
0.5
-4.0E+06
7 days
2.6 years
P rofile along centre o f clay bulkhead (m)
Figure 8.25 Pore Water Pressure profile along the centre line o f the clay bulkhead
during Phase I from Analysis_H_3 (section C-C)
initial ------7 days 110 days 1 year
2 years 2.6 years — 3 years 3 .5 years
1 1.5
P ro file a lo n g cen tre o f c lay bu lkhead (m )
Figure 8.26 Degree o f Saturation profile along the centre line o f the clay bulkhead
during Phase I from Analys is_H _3 (section C-C)
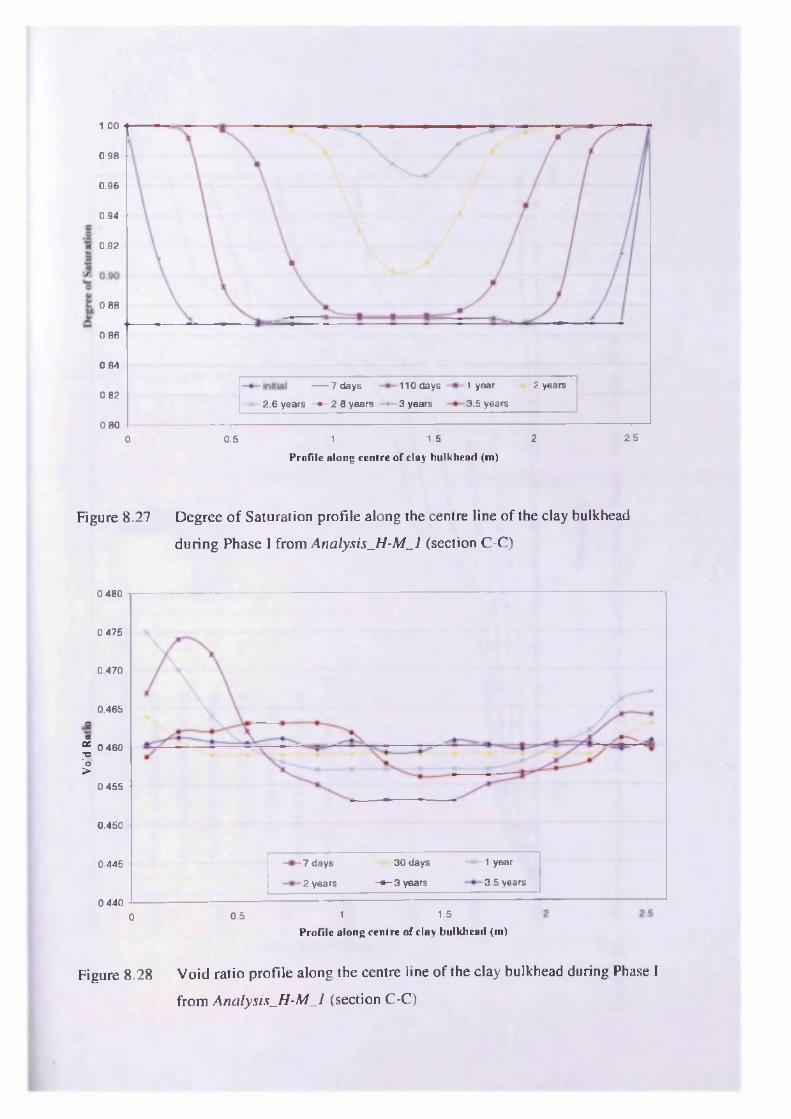
1.00
0.98
0.96
0.94
a 0.92
0.88
0.86
0.84
2 years 7 days
2.6 years - « - 2 .8 years
110 days
3 years
1 year
3 .5 years0.82
0 8 02.520.5 1.50 1
P ro f i le a lo n g c e n tre o f c la y b u lk h e a d (m )
Figure 8.27 Degree o f Saturation profile along the centre line o f the clay bulkhead
during Phase I from Analysis_H-M_l (section C-C)
7 days 30 days 1 year
2 years - * - 3 years 3 .5 years
0.480
0.475
0.470
0.465#oa
“ 0 460 ■a 'o >0.455
0.450
0.445
0.440
0 0.5 1 1-5
P ro f i le a lo n g c e n tre o f c la y b u lk h e a d (m )
Figure 8.28 V o id ratio pro file along the centre line o f the clay bulkhead during Phase I
from A n a ly s is _ H -M _ l (section C-C)
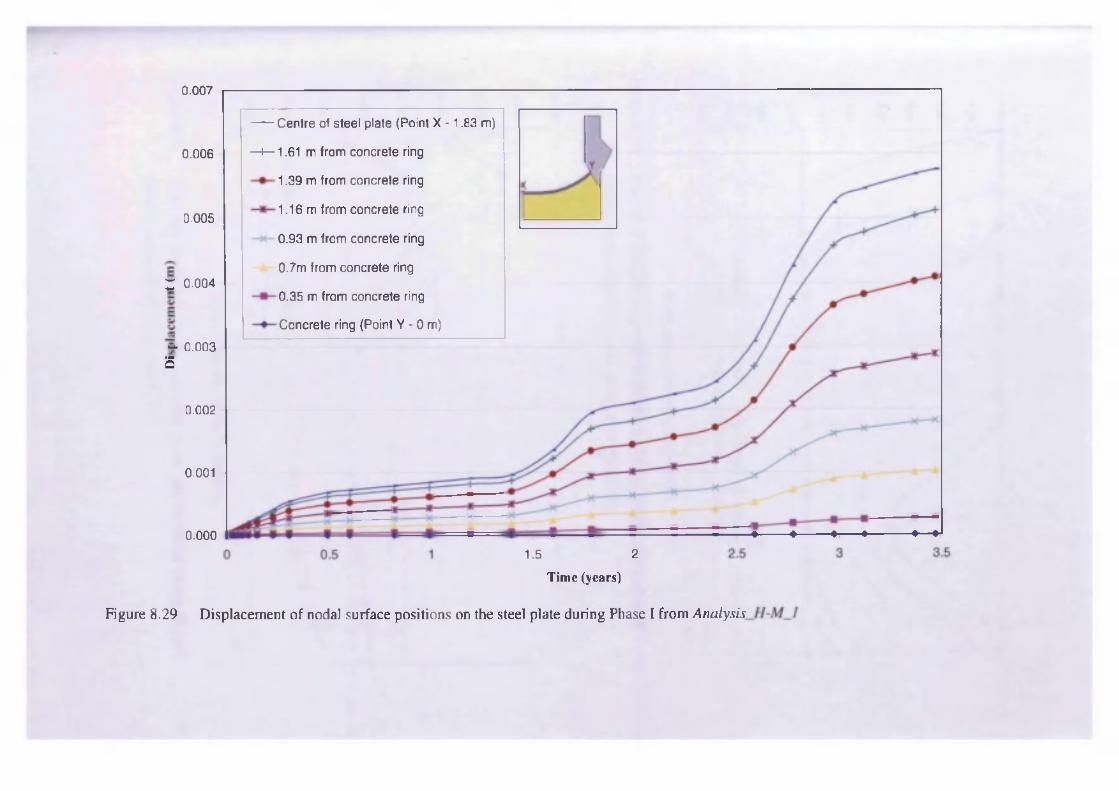
0.007
0.006
Centre of steel plate (Point X -1.83 m)
i— 1.61 m from concrete ring
1.39 m from concrete ring
1.16 m from concrete ring
0.93 m from concrete ring
0.7m from concrete ring
0.35 m from concrete ring
Concrete ring (Point Y - 0 m)
0.005
z 0.004
~ 0.0035
0.002
0.001
0.0001.5 2
Time (years)
Figure 8.29 Displacement o f nodal surface positions on the steel plate during Phase I from Analysis
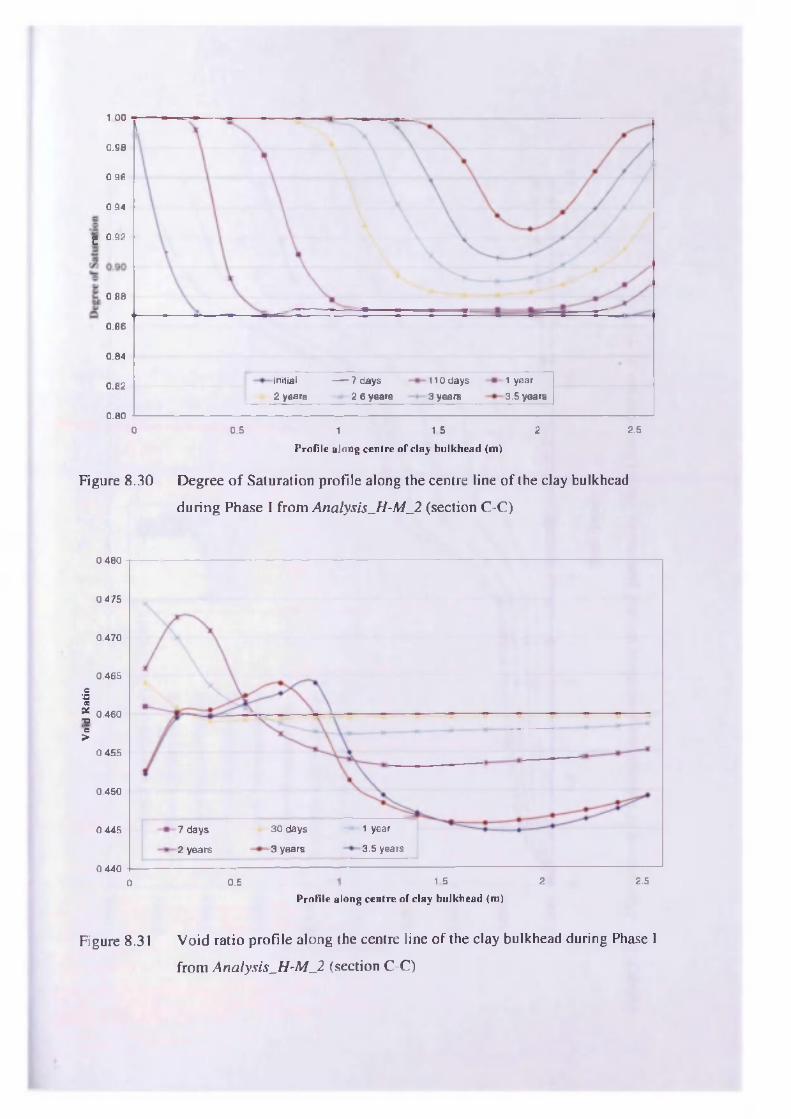
1.00
0.98
0.96
0.94
£ 0.92
0.88
0.86
0.84
— 7 days
2 years 2.6 years
initial 110 days
3 years
1 year
3 .5 years0.82
0.80
0 0.5 1.5 2 2.51
P ro f i le a lo n g c e n tre o f c la y b u lk h e a d (m )
Figure 8.30 Degree o f Saturation profile along the centre line o f the clay bulkhead
during Phase I from Analysis_H-M_2 (section C-C)
0.480
0.475
0.470
0.465o
'S*“ 0.460 ■o 'o >
0.455
0.450
3 0 days
3 years
1 year
3 .5 years
7 d ays
2 years
0.445
0.4401.5 2 2.50.50
P ro f i le a lo n g c e n tre o f c la y b u lk h e a d (m )
Figure 8 .31 V o id ratio profile along the centre line o f the clay bulkhead during Phase I
from A na lys is_H -M _2 (section C-C)
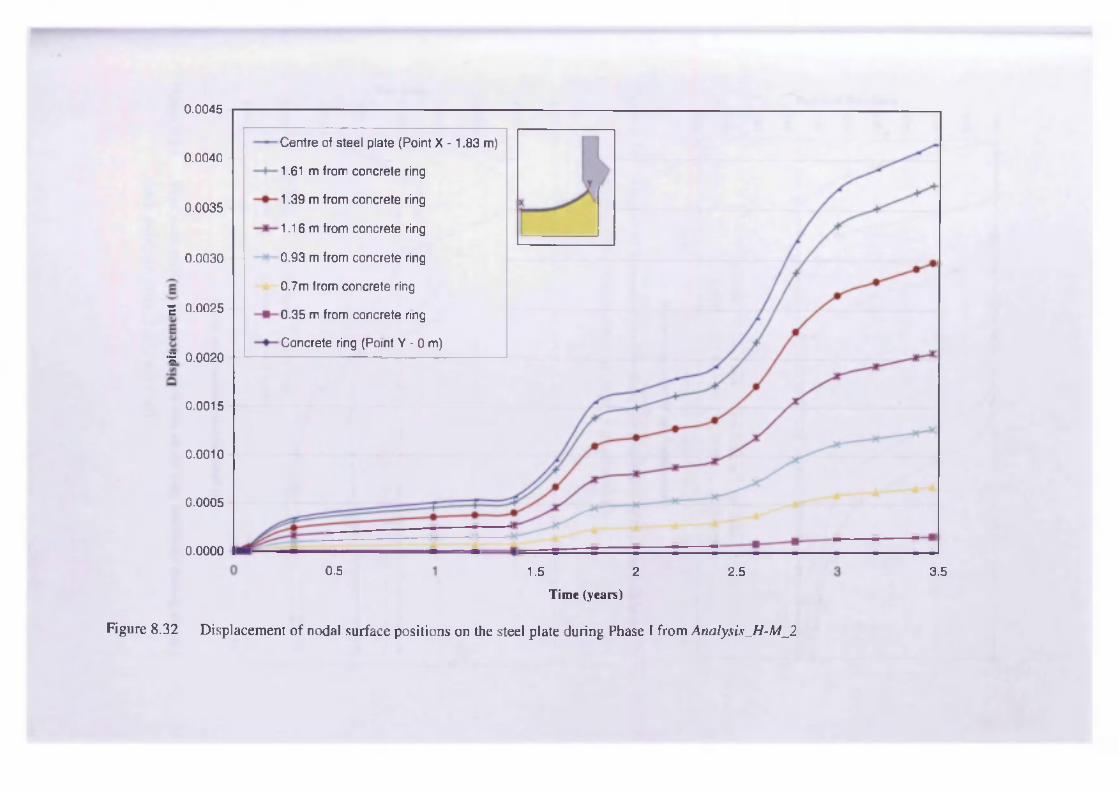
0.0045
0.0040Centre of steel plate (Point X -1.83 m)
1.61 m from concrete ring
1.39 m from concrete ring
1.16m from concrete ring
0.93 m from concrete ring
0.7m from concrete ring
0.35 m from concrete ring
Concrete ring (Point Y - 0 m)
0.0035
0.0030
£ 0.0025
■5 0.0020
0.0015
0.0010
0.0005
0.00000.5 1.5 2
Time (years)
2.5 3.5
Figure 8.32 Displacement o f nodal surface positions on the steel plate during Phase I from Analysis_H-M_2
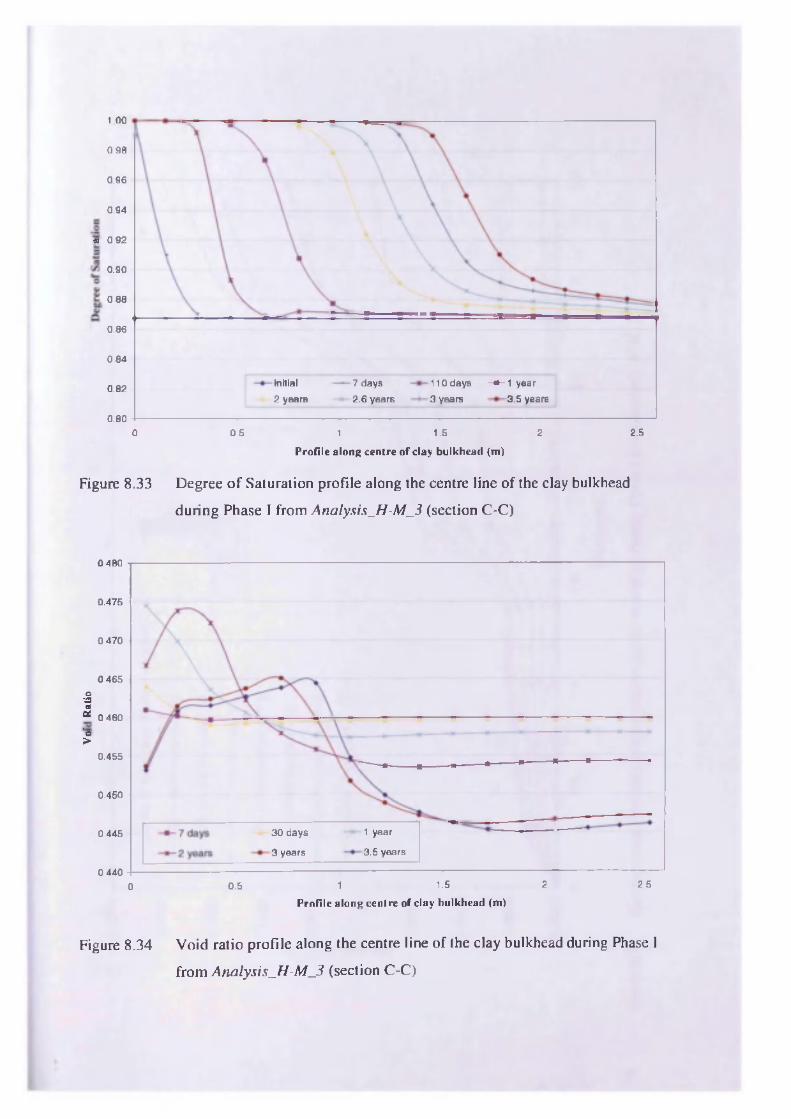
1.00
0.98
0.96
0.94
a 0.92
0.90
0 8 8
0.86
0.84
in itia l
2 years
7 days
2 .6 years
110 days - » - 1 year
3 .5 years0.82
3 years
0.802 2.50 0.5 1 1.5
P r o f i le a lo n g c e n tre o f c la y b u lk h e a d (m )
Figure 8.33 Degree o f Saturation profile along the centre line o f the clay bulkhead
during Phase I from Analysis_H-M_3 (section C-C)
0 4 8 0
0.475
0.470
0.465oaCO“ 0.460
'o>0.455
0.450
3 0 days
3 years
1 year
3 .5 years
0.445
0 4 4 01.5 2 2.510.50
P ro f i le a lo n g c e n tre o f c la y b u lk h e a d (m )
Figure 8.34 Void ratio pro file along the centre line o f the clay bulkhead during Phase I
from A na lys is_H -M _3 (section C-C)
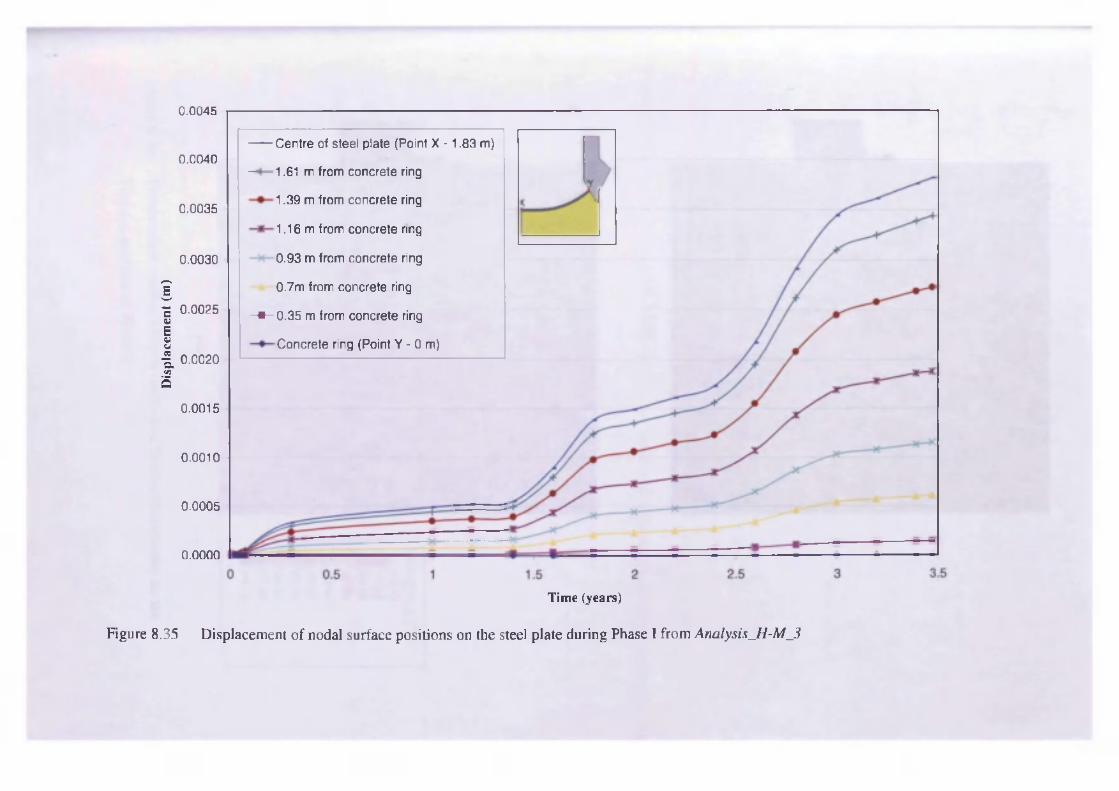
Dis
plac
emen
t (m
)
0.0045
Centre of steel plate (Point X -1.83 m)
— 1.61 m from concrete ring
1.39 m from concrete ring
1.16m from concrete ring
0.93 m from concrete ring
0.7m from concrete ring
- • -0 .3 5 m from concrete ring
Concrete ring (Point Y - 0 m)
0.0040
0.0035
0.0030
0.0025
0.0020
0.0015
0.0010
0.0005
Time (years)
0.0000
Figure 8.35 Displacement o f nodal surface positions on the steel plate during Phase I from Analysis_H-M_3
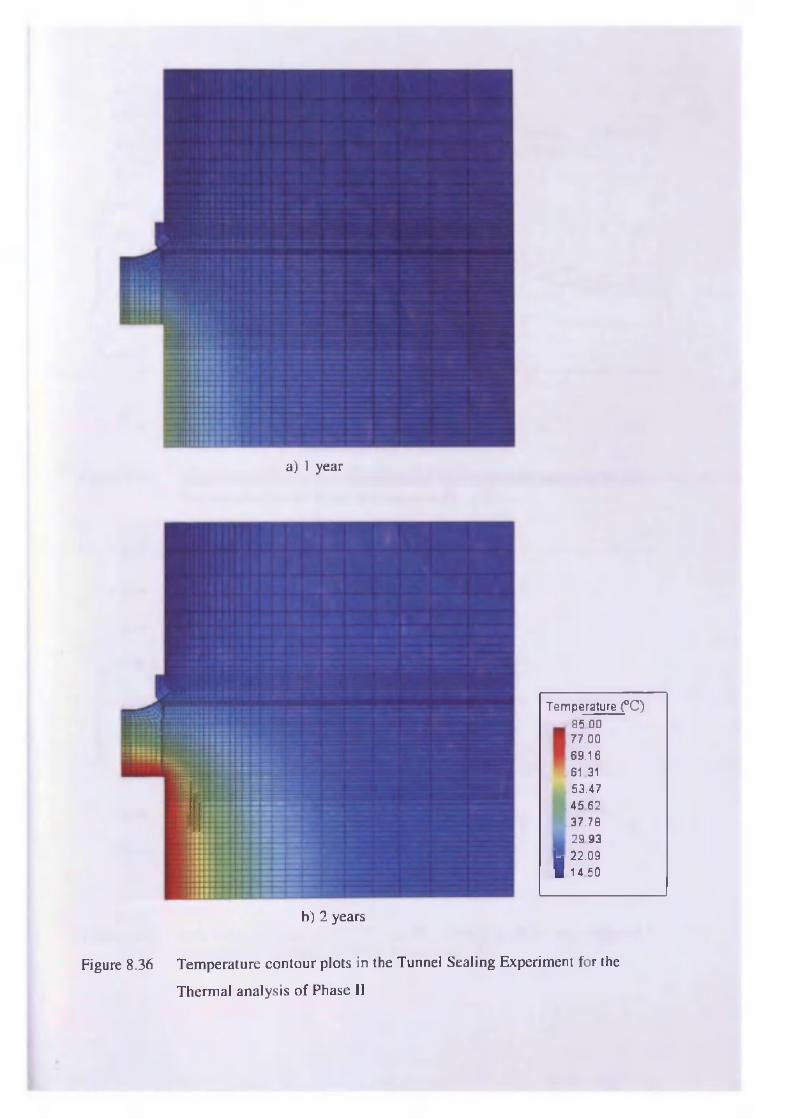
a) 1 year
b ) 2 years
T e m p e ra tu re (°C)85 .007 7 .00
6 9 .16
61.31
53.47
4 5 .62
3 7 .78
2 9 .93
[ j 2 2 .09
1 1 4 .50
Figure 8.36 Temperature contour plots in the Tunnel Sealing Experiment for the
Thermal analysis o f Phase II
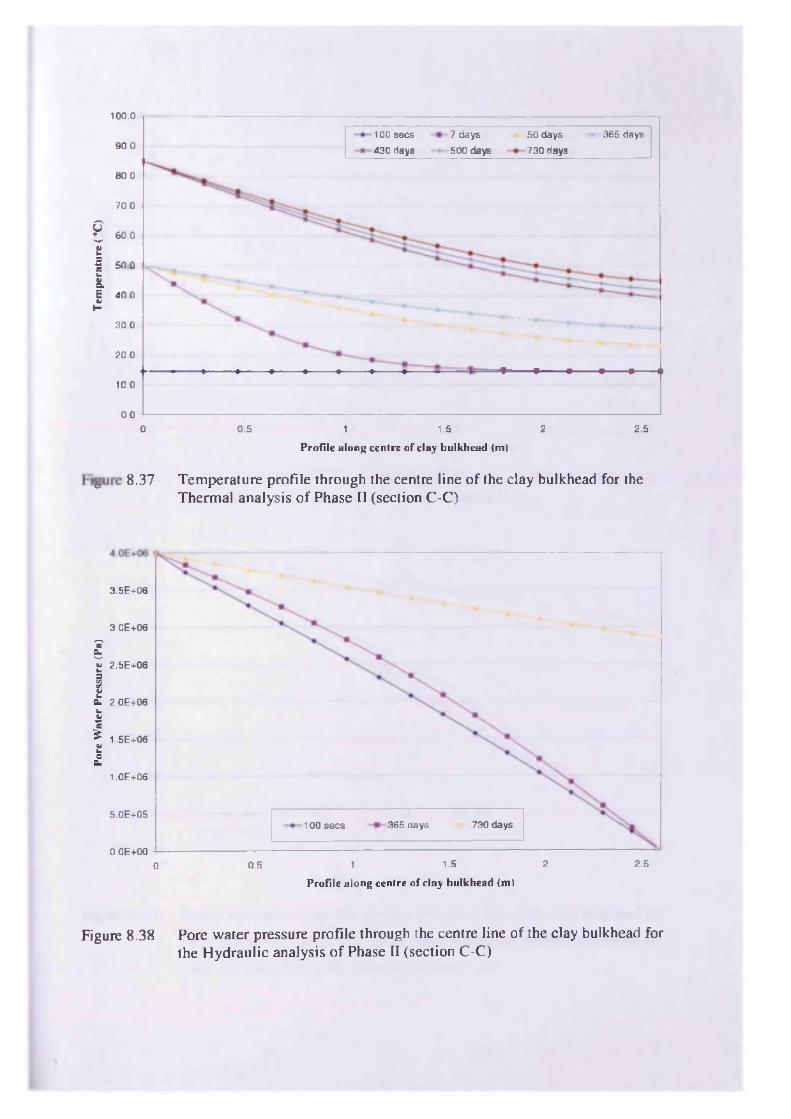
Pore
W
ater
Pr
essu
re
(Pa)
09
Tem
pera
ture
(°
C)
100.0
100 secs
430 days
7 days
500 days
50 days
730 days
365 days90.0
80.0
70.0
60.0
50.0
40.0
30.0
20.0
10.0
0.00.5 1.5 2 2.50 1
P rofile along centre o f clay bulkhead (ni)
8.37 Temperature profile through the centre line o f the clay bulkhead for the Thermal analysis o f Phase II (section C-C)
3.5E+06
3.0E+06
2.5E+06
2.0E+06
1.5E+06
1.0E+06
5.0E+05730 days365 days100 secs
O.OE+OO1.5 2 2.50.5 10
Profile along centre o f clay bulkhead (m)
Figure 8.38 Pore water pressure profile through the centre line o f the clay bulkhead for the Hydraulic analysis o f Phase II (section C-C)
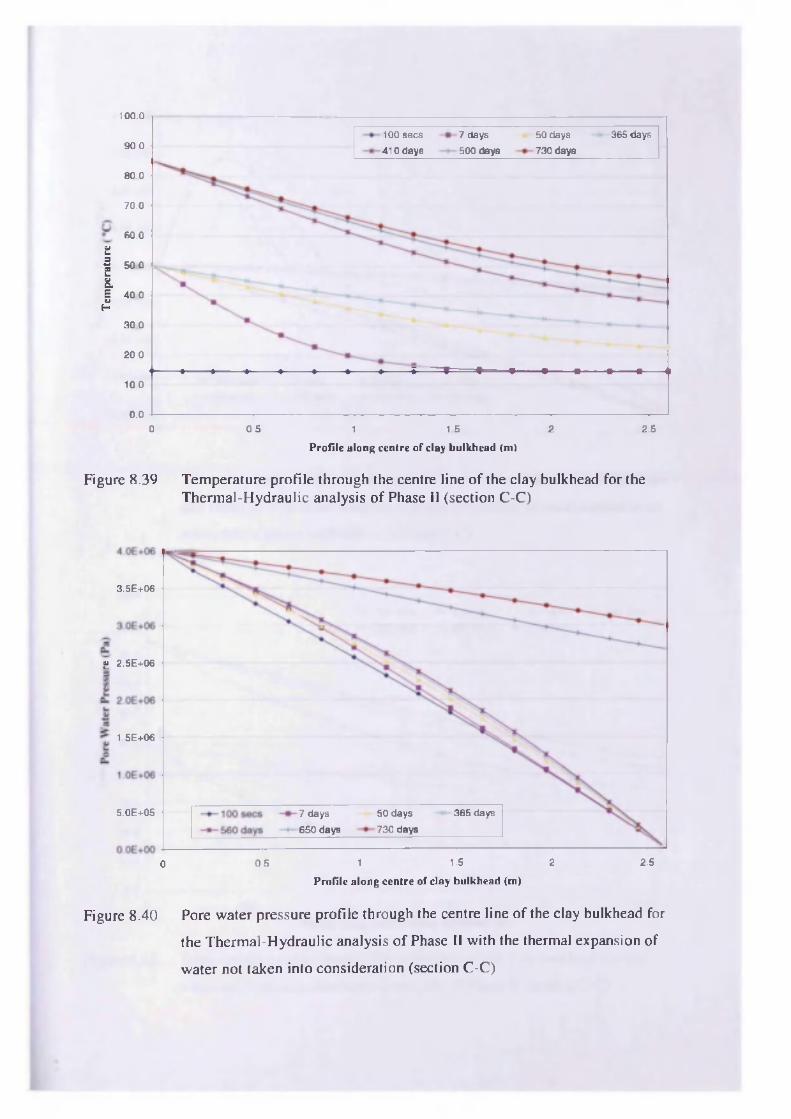
100.050 days 365 days
730 days
100 secs
410 days
7 days
500 days90.0
80.0
70.0
60.0
£| 50°I| 40.0H
30.0
20.0
10 0
0.0
0.5 1.5 2.50 1 2P rofile along eenlrc o f clay bulkhead (ni)
Figure 8.39 Temperature profile through the centre line o f the clay bulkhead for the Thermal-Hydraulic analysis o f Phase II (section C-C)
3.5E+06
H 2.5E+06
1.5E+06
5.0E+05 50 days
730 days
365 days7 days
6 50 days
1.5 2 2.510.50P rofile along centre o f clay bulkhead (m)
Figure 8.40 Pore water pressure profile through the centre line o f the clay bulkhead for
the Therm al-Hydraulic analysis o f Phase II w ith the thermal expansion o f
water not taken into consideration (section C-C)
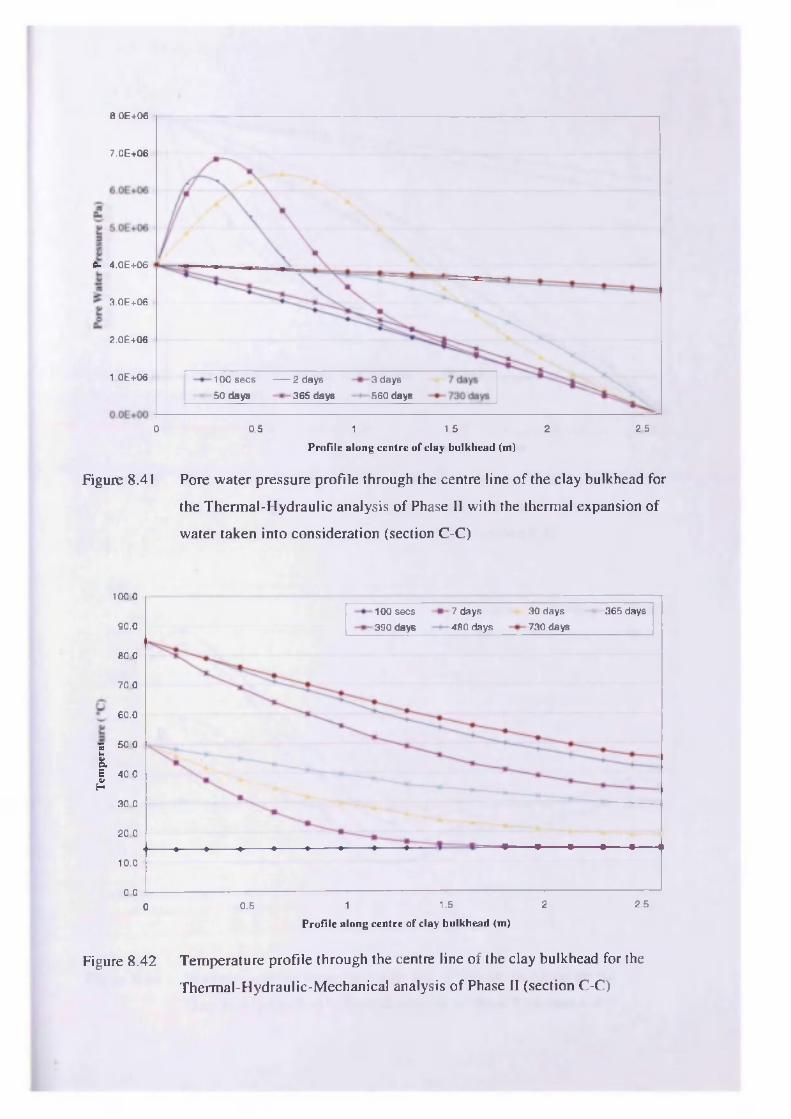
8.0E+06
7.0E+06
0. 4.0E+06
3.0E+06
2.0E+06
1 0E+06 100 secs ------ 2 days
50 d ays
3 days
560 days365 days
0 0.5 1.5 2 2.51
P r o f i le a lo n g c e n tre o f c la y b u lk h e a d (m )
Figure 8.41 Pore water pressure profile through the centre line o f the clay bulkhead for
the Thermal-Hydraulic analysis o f Phase II with the thermal expansion of
water taken into consideration (section C-C)
100.0100 secs
390 days
7 days
480 days
30 days
730 days
365 days
90.0
80 0
70.0
60.0
3 50.0
|S 40.0S
30.0
20.0
10.0
0.02 2.51.50.5 10
P r o f i le a lo n g c e n tre o f c la y b u lk h e a d (m )
Figure 8.42 Temperature profile through the centre line o f the clay bulkhead for the
Thermal-Hydraulic-Mechanical analysis o f Phase II (section C-C)
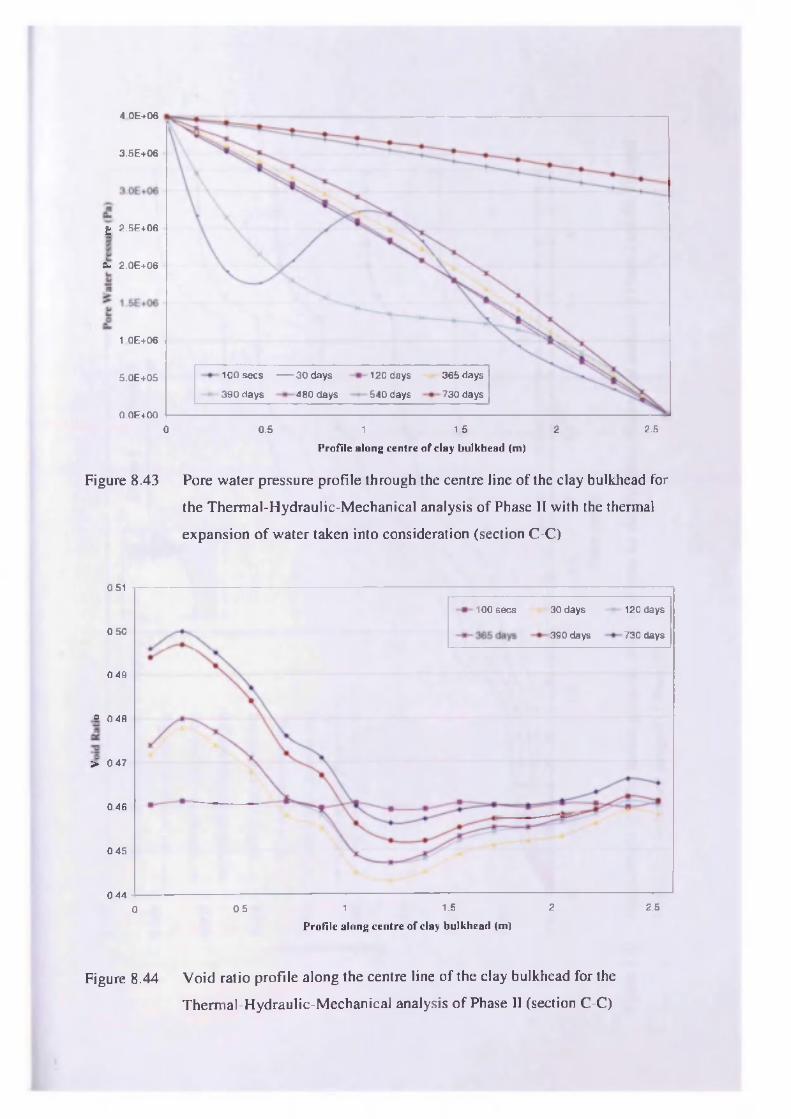
4.0E+06
3.5E+06
£ 2.5E+06
0 - 2.0E+06
1 .0E+06
100 secs ------ 3 0 days
390 days
120 days
540 days
365 days
730 days
5.0E+05
480 days
0.0E+00
0 0.5 1.5 2 2.51
P ro f i le a lo n g c e n tre o f c la y b u lk h e a d (m )
Figure 8.43 Pore water pressure profile through the centre line o f the clay bulkhead for
the Thermal-Hydraulic-Mechanical analysis o f Phase II with the thermal
expansion o f water taken into consideration (section C-C)
0.51
30 days 120 days100 secs
0.50 390 days 730 days
0.49
* 0.48
> 0.47
0.46
0.45
0.442 2.51.510.50
P ro f i le a lo n g c e n tre o f c la y b u lk h e a d (m )
Figure 8.44 Void ratio profile along the centre line o f the clay bulkhead for the
Thermal-Hydraulic-MechanicaJ analysis o f Phase II (section C-C)
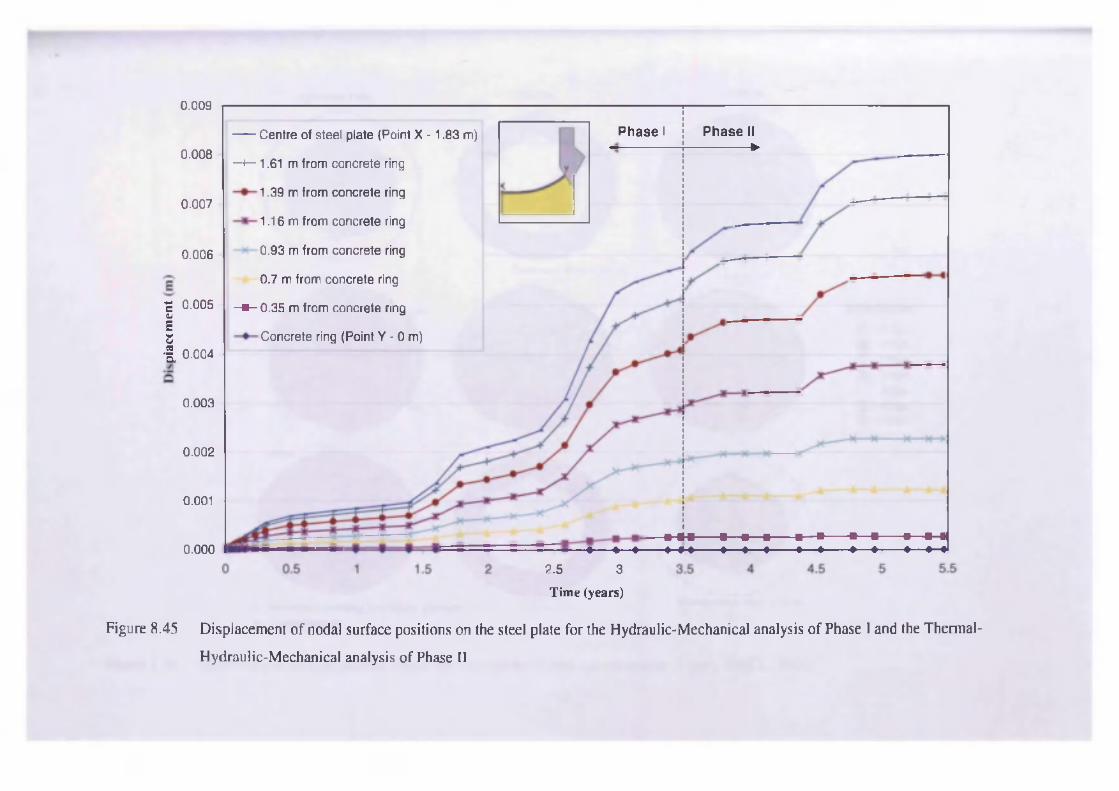
0.009
0.008
0.007
0.006
■£ 0.005 vE5■§, 0.004
0.003
0.002
0.001
0.000
Phase I Phase II ►
Centre of steel plate (Point X -1.83 m)
—t— 1.61 m from concrete ring
1.39 m from concrete ring
1.16 m from concrete ring
0.93 m from concrete ring
0.7 m from concrete ring
-■ -0 .35 m from concrete ring
Concrete ring (Point Y - 0 m)
2.5 3
Time (years)
Figure 8.45 Displacement o f nodal surface positions on the steel plate for the Hydraulic-Mechanical analysis o f Phase I and the Thermal-
Hydraulic-Mechanical analysis o f Phase II
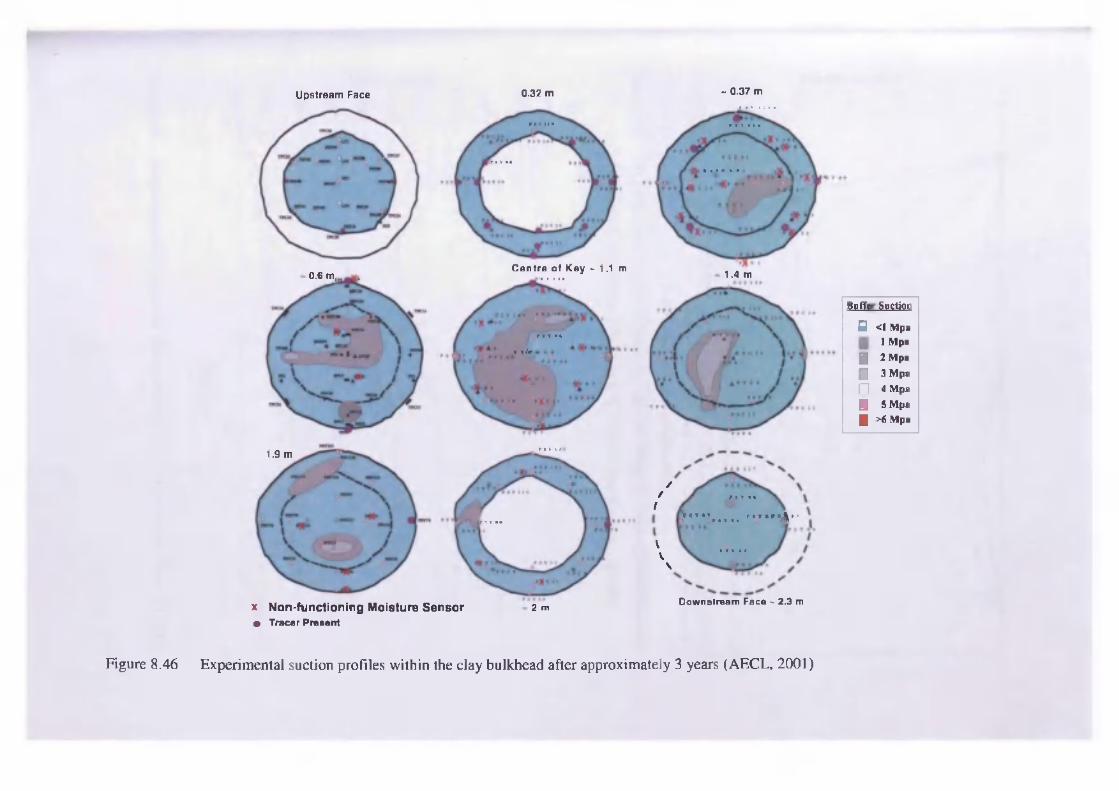
Upstream Face 0.32 m - 0.37 m
C e n tre o f K ey - 1.1 m0.6 m, >•
»• t / jl
1.9 m
x N o n -fu n ction ing M o is tu re S en s o r 2 m• T race r P resent
1 .4 m
Buffe Suction
0 <1 Mpa1 Mpa
□ 2 Mpa
□ 3 Mpa
□ 4 Mpa
□ 5 Mpa
■ >6 Mpa
//
I
VV
\
Downstream Face - 2.3 m
Figure 8.46 Experimental suction profiles w ith in the clay bulkhead after approximately 3 years (AECL, 2001)
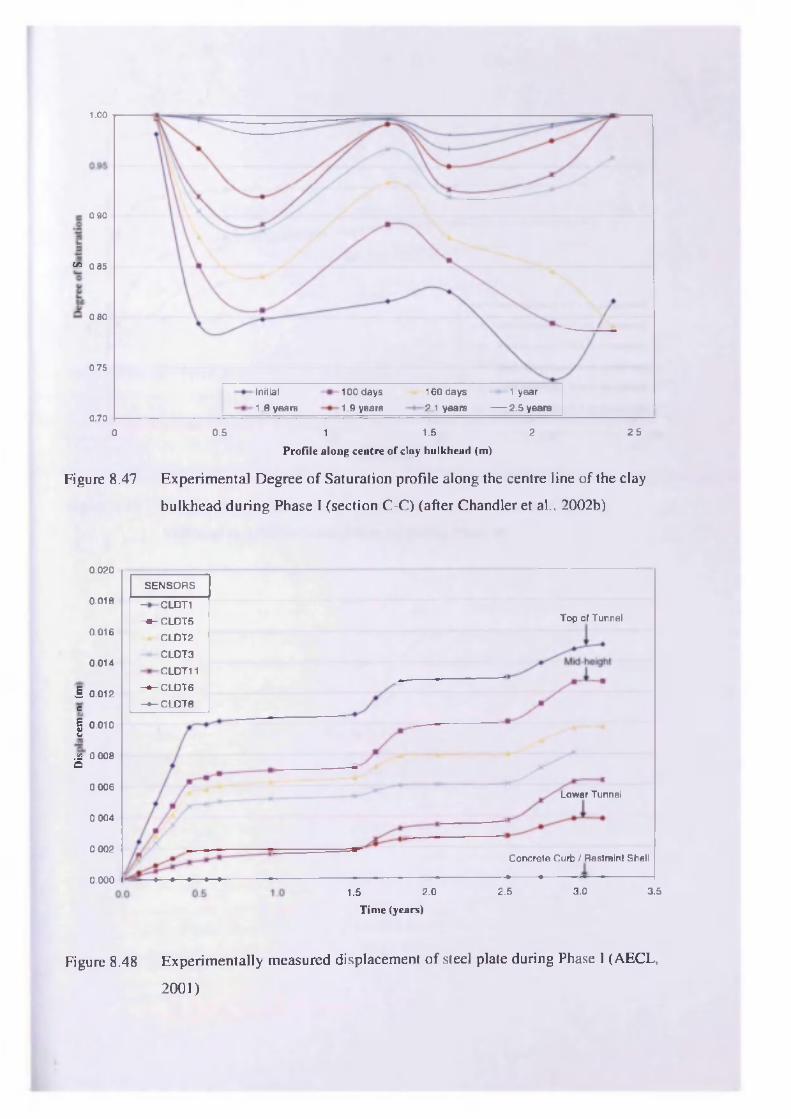
1.00
0.90
^ 0.85
0.80
0.75
Initia l
1 .8 years
100 days
1.9 years
160 days
2.1 years
1 year
— 2 .5 years0.70
2 50.5 1.5 20 1
P ro f i le a lo n g c e n tre o f c la y b u lk h e a d (m )
Figure 8.47 Experimental Degree o f Saturation profile along the centre line o f the clay
bulkhead during Phase I (section C-C) (after Chandler et al., 2002b)
Lower Tunnel
SENSO R S
— C L D T 1
-m - C LDT5
CLDT2
C LD T3
C LD T 11
- • - C L D T 6
- • - C L D T 8
Concrete Curb / Restraint Shell
* __________
2 .5 3.0 3.5
0.020
0.018
0.016
0.014
§ 0.012 cI 0.010o
.12 0.008 Q
0.006
0.004
0.002
0.0001.5 2.0
T im e (y e a rs )
Top o f Tunnel
Figure 8.48 Experimentally measured displacement o f steel plate during Phase I (AECL,
2001)
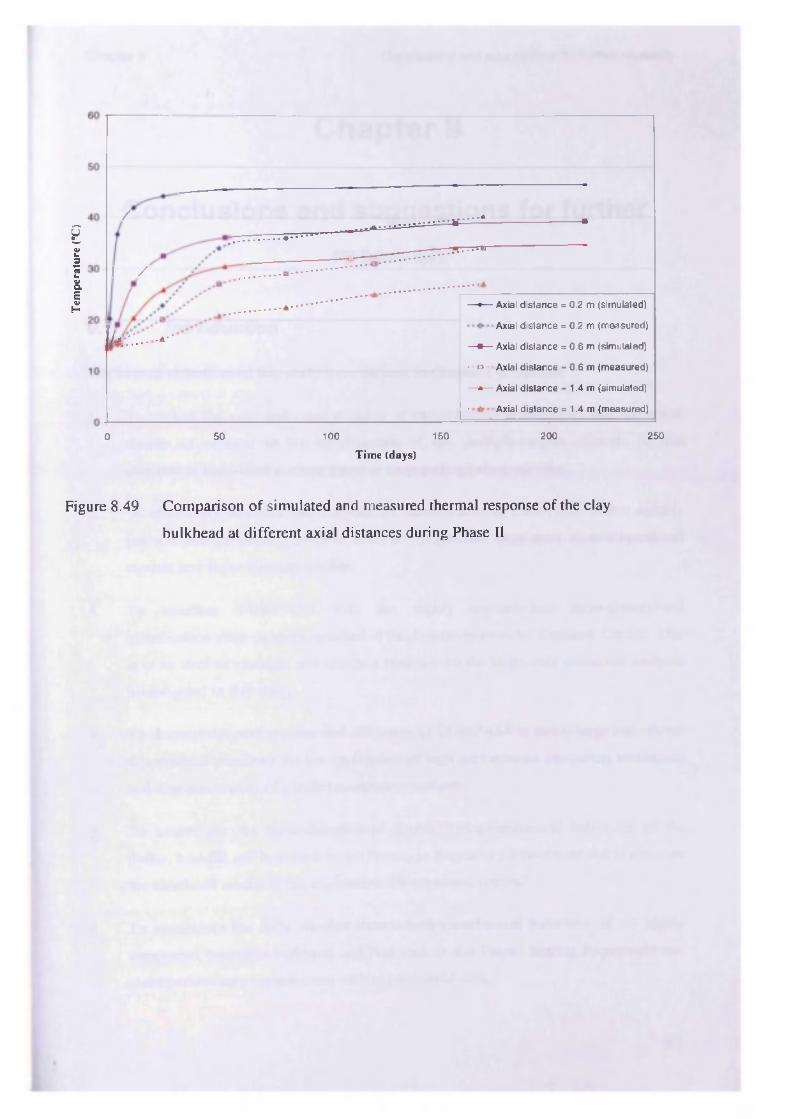
Tem
pera
ture
(°
C)
/ .............O m
I / ................. ...............
— r r o -
— •— Axial distance = 0.2 m (simulated)
Axial distance = 0.2 m (measured)I f - ' ' -A* '
— ■— Axial distance = 0 .6 m (simulated)
, - - o - Axial d istance = 0.6 m (measured)
— * — Axial d istance = 1.4 m (simulated)
• Axial d istance = 1.4 m (measured)
0 5 0 100 150 200 250
Tim e (days)
Figure 8.49 Comparison o f simulated and measured thermal response o f the clay
bulkhead at different axial distances during Phase II

Chapter 9 Conclusions and suggestions for further research
Chapter 9
Conclusions and suggestions for further
research
9.1 Introduction
The overall objectives o f this study were defined in Chapter 1 as follows:
1. To review the past and current status o f experimental programmes and numerical
studies in relation to the investigation o f the multiple-barrier concepts for the
disposal o f high-level nuclear waste in deep geological repositories.
2. To effectively combine and integrate the numerical code COMPASS with a suitable
pre and post-processing piece o f software to generate large scale three-dimensional
models and fin ite element meshes.
3. To interface COMPASS with the highly sophisticated three-dimensional
visualisation suite recently installed at the Geoenvironmental Research Centre. This
is to be used to visualise and interpret results from the large scale numerical analyses
investigated in this study.
4. To increase the performance and efficiency o f COMPASS to tackle large scale three-
dimensional problems via the application o f high performance computing techniques
and implementation o f parallel computing methods.
5. To investigate the three-dimensional thermo/hydro/mechanical behaviour o f the
buffer, backfill and host rock in the Prototype Repository Experiment and to compare
the simulated results to the experimentally measured results.
6. To investigate the fu lly coupled thermo/hydro/mechanical behaviour o f the highly
compacted bentonite bulkhead and host rock in the Tunnel Sealing Experiment and
make prelim inary comparisons w ith experimental data.
9-1

Chapter 9 Conclusions and suggestions for further research
It is claimed that each one o f these objectives has been completed successfully during the
course o f this study.
The fo llow ing sections review the work presented in this study and summarise the
principal conclusions. Finally, suggestions for further work in this area o f research are
made.
9.2 Status o f research into the disposal o f high-level nuclear
waste
Chapter 2 presented a review o f both the past and current research work into the disposal
o f high-level nuclear waste. This research has primarily been focussed within the fields o f
numerical and experimental investigations. The former research area has developed over
many years and has been derived from the need to understand the complex coupled flow
and deformation behaviour o f partially saturated soils. In the latter case the research has
been driven by the need to understand how various engineered barrier materials respond to
thermal and hydraulic gradients and stress/strain behaviour.
In recent years there has been a greater emphasis on investigating the performance o f
engineered clay barriers and natural host rock materials in relation to the multiple-barrier
concept proposed fo r the disposal o f high-level nuclear waste. This has become
increasingly important as many developed countries have looked at decommissioning
nuclear power stations in favour o f more renewable, environmentally friendlier options
with a view o f tackling the ever increasing energy crisis. O f particular interest to this study
has been the experimental programmes currently being undertaking by SKB in Sweden and
AECL in Canada. These programmes are extremely comprehensive and have investigated
not on ly barrier material performance and behaviour but have also explored new
emplacement technologies, tested and validated new instrumentation and analysed the
logistical d ifficu lties associated w ith deep geological disposal.
It is concluded that large scale in-situ experiments such as the Prototype Repository Project
and the Tunnel Sealing Experiment have encompassed all o f these objectives and provide
important information into the feasibility o f the multiple barrier concepts for disposal.
Furthermore, they also facilitate numerical investigations by providing key information for
validation purposes as part o f the ongoing research process.
9-2
Chapter 9 Conclusions and suggestions for further research
9.3 Combining COMPASS with a pre and post-processor for
three-dimensional analyses
As large scale experiments become increasingly more complex there is a requirement for
more sophisticated numerical models to represent them more precisely. This enables the
complex behaviour to be simulated to a higher degree o f accuracy. From the initial outset
o f this investigation it was obvious that a complex experiment like the Prototype
Repository would need to be modelled in three-dimensional space to provide the most
representative simulation results. COMPASS, whilst having the capacity to model
thermo/hydro/mechanical processes in three-dimensions, had only previously been used for
coupled T H M analyses in two-dimensions and coupled flow analyses in three-dimensions.
Added to this, the existing pre and post-processor, COMPASS GUI, was limited to two-
dimensional space. Therefore, the preliminary research involved selecting a suitable pre
and post-processor software package w ith appropriate three-dimensional capabilities and
interfacing it successfully w ith COMPASS.
The software, G iD , developed by the International Centre for Numerical Methods in
Engineering (C IM N E ) in Spain, was selected for this. GiD was then successfully
integrated w ith COMPASS via a number o f interfaces written in FORTRAN 90. This
work was extensively tested and verified via a series o f small scale tests to ensure that the
correct information in the correct format was passed between COMPASS and GiD. This
gave confidence in the software and the interface system and allowed increasingly more
complex three-dimensional models to be constructed, meshed and analysed. GiD also had
the added advantage o f a sophisticated post-processor which allowed data interrogation o f
three-dimensional analyses, albeit on a two-dimensional desktop platform. By providing
COMPASS w ith the additional ability to tackle highly complex three-dimensional
numerical simulations the foundation was laid for the successful modelling o f the large
scale in-situ experiments investigated in this study.
9.4 Interfacing COMPASS with a three-dimensional
Visualisation Suite
One o f the key areas in three-dimensional modelling is the ability to analyse and
interrogate results. In the past this was achieved using post-processing software located on
9-3
IChapter 9 Conclusions and suggestions for further research
desktop computers. This has obvious limitations and can potentially lead to
misinterpretation o f data and numerical errors. In an attempt to overcome these difficulties
the Geoenvironmental Research Centre established a three-dimensional virtual reality
visualisation platform at C ard iff University in 2002. This system would provide major
benefit to the research w ork presented in this study and hence it was necessary to interface
COMPASS w ith the stereoscopic software, AVS. W ith input from the AVS technicians,
this process was successfully achieved and thus allowed true three-dimensional
visualisation o f the large scale models presented in this investigation. However it should
be noted that due to the time consuming nature o f visualising the large finite element
meshes on the stereoscopic system and the inherent costs o f running it, the system was not
used extensively during this study and was used in combination with the visualisation
facilities o f GiD.
9.5 Increasing the performance and efficiency o f COMPASS
For the complex numerical modelling conducted in this study it was necessary to increase
the performance and efficiency o f COMPASS. For small scale coupled one-dimensional
and two-dimensional analyses COMPASS performed adequately but as the requirements
and complexity o f the analyses increased there was a need to improve the proficiency and
thus reduce prohibitive computational analyses times. This was achieved via a number o f
different software measures. In itia lly , the COMPASS code itse lf was profiled to determine
areas o f improvement. As a result i t was successfully enhanced and streamlined to
improve efficiency and robustness in tackling large analyses. Furthermore, based upon
previous research work, suitable iterative solution methods and high-performance
computing techniques were effectively implemented into this study. It should be noted that
amplifying computational power and performance is an ongoing process and measures
have been taken at C a rd iff University by the C ard iff Centre fo r Computational Science and
Engineering (CCCSE) to ensure that the most up-to-date hardware is available for
increasingly complicated numerical simulations. More recent developments indicate that
Grid computing technologies are like ly to play a key role in the future o f numerical
modelling studies.
9-4
Chapter 9 Conclusions and suggestions for further research
9.6 Investigation o f the THM behaviour o f the Prototype
Repository Experiment
The primary objective o f the Prototype Repository Experiment is to investigate at a fu ll
scale the integrated performance o f engineered barriers and near-field rock for the long
term disposal o f high-level nuclear waste. The experiment is currently still ongoing. As
part o f this international project a series o f numerical analyses were performed using the
code COMPASS and the simulation results were compared against the experimental
results. Many important results were discovered as a consequence o f this work and are
summarised below.
The key aspect in modelling the complex behaviour o f the Prototype Repository
Experiment was to represent the complicated geometrical features via a finite element
model. Due to the size and configuration o f the tunnel and deposition holes this could only
be feasibly achieved via the application o f a sophisticated three-dimensional model. A less
sophisticated two-dimensional model, whilst having many advantages, would not be able
to capture the fu ll system-wide behaviour o f the experiment. Hence a fu ll three-
dimensional fin ite element model was constructed and when combined with suitable
iterative solution methods and high-performance computing techniques it was possible to
simulate the coupled flo w behaviour o f the Prototype Repository Experiment. This proved
to be h ighly advantageous to the research work as it allowed three-dimensional behaviour
to be investigated and simulated in a high level o f detail.
The first stage o f the modelling programme was to simulate the pre-emplacement stage by
investigating the hydraulic regime o f the host granite rock in response to the excavation o f
the tunnel and deposition holes. The hydraulic properties o f the rock were key to this
study as they would control the level and extent o f saturation that would take place once
the buffer, pellets and backfill were emplaced. It was found that at Aspo the rock mass
consisted o f a complex array o f discrete fractures supplying water at various flowrates.
However, due to the lim itations o f the model it was not possible to represent this complex
fracture network in three-dimensions. The alternative method was to include a
representative fracture in the fin ite element model to emulate the fracture that intersected
deposition hole 1 in the experiment. The simulated inflow rates were then compared
against measured values which allowed a more accurate interpretation o f the material
parameters o f the rock mass. These values were later adopted in the coupled analyses.
9-5
Chapter 9 Conclusions and suggestions for further research
Although this was a relatively coarse approximation it did prove successful in these
analyses as the simulated results compared favourably w ith the measured behaviour.
The second stage o f the modelling exercise was to simulate the Prototype Repository
Experiment fo llow ing the activation o f the heaters in each o f the deposition holes in
Section I and II. This programme o f work entailed the uncoupled thermal analysis o f the
system, fo llowed by more complex coupled thermal-hydraulic analyses and finally coupled
thermal-hydraulic-mechanical analyses. A variety o f fin ite element domains were
employed to investigate material parameters, boundary conditions and different
phenomena. This study proved to be highly successful and good comparisons were made
between the simulated and experimental results.
It was found that the model was able to represent the thermal regime in the buffer, backfill
and rock to a high degree o f accuracy as a result o f using the sophisticated three-
dimensional model. This proved to be significant as it showed the importance o f using
accurate models to capture the behaviour o f geometrically complicated experiments over
long timescales. The hydraulic response o f the system was also captured well, particularly
in the drying and wetting rates in the driest deposition hole. This was achieved as a direct
result o f the calibration o f the vapour flow. Key experimental trends were also identified
in the simulations, in particular, the regions o f highest drying in the buffer above the
canisters. This led to greater confidence in the models ab ility to simulate the Prototype
Repository Experiment. The pelletised slot fillin g material also came under close scrutiny
and it was identified that the model over predicted the influence that this zone would have
on the resaturation rates in the buffer when compared to experimental observations.
Further laboratory testing o f this material was recommended in an attempt to ascertain its
behaviour under thermal and hydraulic loading.
The mechanical behaviour o f the experiment in response to the thermal and hydraulic
regimes was investigated via the application o f more simplified fin ite element models. It
was found that a fu lly coupled three-dimensional thermo/hydro/mechanical analysis could
not be performed in this study due to the excessive computational requirements required.
However, it was identified that the mechanical response o f the system could be
investigated on a localised scale providing the thermal and hydraulic behaviour was
modelled accurately. This allowed a number o f analyses to be performed investigating the
mechanical material parameters, particularly the deformation characteristics, o f the MX-80
9-6
Chapter 9 Conclusions and suggestions for further research
pellet material. Follow ing the success o f these sensitivity analyses reasonable comparisons
were made between the simulated mechanical behaviour and the experimentally measured
behaviour.
Overall it can be stated that the results presented in this numerical study were encouraging
since they generally provided a good correlation w ith the experimental data. This gives
greater confidence in the ab ility o f the model and theoretical formulation to represent the
fu lly coupled behaviour o f unsaturated soils, particularly in the use o f engineered barriers
for the deep geological disposal o f high-level nuclear waste. However, it is acknowledged
that this w ork is continually ongoing and that further numerical investigations are required
to coincide w ith the experimental programme as it advances towards its conclusion.
9.7 Investigation o f the THM behaviour o f the Tunnel Sealing
Experim ent
AECL conducted the Tunnel Sealing Experiment w ith the primary objective to investigate
the overall performance o f two different bulkhead materials, one comprised o f highly
compacted sand-bentonite blocks and the other constructed using Low-Heat High-
Performance concrete. A comprehensive numerical investigation was conducted which
constituted a series o f predictions on the thermo/hydro/mechanical behaviour o f the clay
bulkhead during Phase I and II o f the experiment. Both two-dimensional and three-
dimensional analyses were performed, w ith the former employed fo r the more complex
coupled simulations.
The results from the hydraulic and hydraulic-mechanical simulations o f Phase I showed
that the in itia l conditions on the downstream face o f the clay bulkhead had a large
influence over the rates o f resaturation. Faster resaturation was simulated when recharge
occurred from the downstream face. Following the prelim inary comparisons with the
experimental behaviour this proved significant since recharge had also occurred on the
downstream face due to seepage through preferential pathways in and around the clay
bulkhead. Therefore a reasonably good correlation was achieved between the numerically
modelled results and the experimentally measured data. An additional investigation was
performed into the micro/macro behaviour o f the clay bulkhead during Phase I and this
provided important results. Using a simplified approach it was shown that resaturation
9-7
Chapter 9 Conclusions and suggestions for further research
rates could be sign ificantly greater than those simulated using a conventional approach. In
light o f these findings it is recommended that further experimental and numerical research
is conducted into the dual-porosity behaviour o f highly swelling clays, particularly for the
application o f tunnel seals in deep geological repositories.
The deformation behaviour o f the bulkhead was also investigated during the saturation
phase. This showed that the clay material swelled at the upstream face as the wetting front
moved through the bulkhead and consolidated near the downstream face in response. As
the hydraulic pressure was further increased during Phase I greater swelling was observed
in the bulkhead and incremental displacements were simulated on the steel plate at the
downstream end. When this behaviour was compared to the experimentally measured
displacements the results were encouraging. Although the model did not capture the initial
large displacements, the incremental increases were modelled more quantitatively. This
gave confidence in the ab ility o f the coupled stress/strain model to predict overall swelling
and deformation in the Tunnel Sealing Experiment.
Phase II o f the TSX was modelled via a series o f coupled and uncoupled analyses. Since
the bulkhead was fu lly saturated by this stage it was found that the thermal response o f the
system was largely independent o f the hydraulic and mechanical fields. Initial
comparisons w ith the experimentally measured thermal response in the bulkhead showed
that the model over predicted the rate o f temperature increase and also the magnitude o f
the temperatures w ith in the bulkhead. This was a result o f a simplified thermal boundary
condition which assumed an almost immediate thermal response. However, in the
experiment this response was delayed due to the presence o f the sand chamber. This
highlighted the importance o f applying representative boundary conditions to model
complex experimental patterns.
The thermal expansion o f the pore water was investigated and it was found that
substantially higher positive pore pressures developed in the bulkhead compared to the
hydrostatic pressure. Additional deformation was also identified in the coupled
mechanical analysis as a result o f thermal expansion o f the bulkhead, giving rise to further
incremental displacement o f the steel plate. Experimental data was unavailable at the time
o f writing and therefore additional comparisons o f the deformation behaviour in Phase II
were not made.
9-8
Chapter 9 Conclusions and suggestions for further research
Overall it can be stated that the simulation o f the Tunnel Sealing Experiment was largely
successful and that pre lim inary comparisons w ith experimental results were encouraging.
A range o f phenomena were investigated and different concepts adopted to represent the
complex thermo/hydro/mechanical behaviour o f the clay bulkhead. The work also
highlighted that using sim plified models to represent complex three-dimensional behaviour
does have many advantages over more sophisticated models. However, this is primarily
based on experimental geometry and the adoption o f representative boundary conditions.
9.8 General conclusions
The two large scale in-situ experiments investigated in this study are part o f an ongoing
worldwide research programme and are amongst the most comprehensive ever performed,
w ith the Prototype Repository Experiment planned to run until at least 2021. In particular,
the extensive array o f instrumentation employed in the Prototype Repository Experiment
has meant that valuable experimental data has been available at each stage o f the
investigation. This has provided a valuable opportunity to test the ability o f the numerical
model to capture complex coupled behaviour. Therefore, the follow ing general
conclusions from this numerical investigation are made.
The three-dimensional modelling o f geometrically complex experiments is important for
capturing system-wide behaviour. However, there is a computational cost associated with
this method and in some cases this can become prohibitive. Less sophisticated finite
element models have greater versatility and are less demanding on resources and
consequently also have an important role to play in numerical modelling. In conclusion, a
comprehensive investigation using both two-dimensional and three-dimensional analyses
should be conducted simultaneously to ensure that the model represents the in-situ
conditions as closely as possible.
The application o f high performance computing and three-dimensional visualisation
techniques in this study has meant that complex problems have been analysed in a high
level o f detail. W ithout these facilities sophisticated three-dimensional finite element
modelling would not have been possible. However, it should be noted that methods o f
numerical analysis do require further investigation to ensure greater robustness and
accuracy fo r more complex problems. Looking towards the future, as greater processing
power becomes available i.e. Grid computing, it is envisaged that more multifaceted
9-9
Chapter 9 Conclusions and suggestions for further research
numerical studies w ill be performed. This is an important criterion since the state o f the art
needs to development concurrently w ith experimental programmes to ensure that
numerical studies form an integral part on any research activity into the disposal o f high-
level nuclear waste.
It is imperative that fo r any modelling programme accurate thermo/hydro/mechanical
material parameters are employed. In both numerical studies a range o f material and
experimental data was made available to ensure accuracy. However, certain parameters
required by the model were unavailable and therefore it was necessary to adopt reasonable
parameters assumed from sim ilar materials. Therefore, it is important that experimental
programmes and numerical studies overlap to ensure that material data is accurate and
valid fo r the computer models.
It was found that the numerical model mostly provided a close correlation with the
experimentally measured thermal and hydraulic behaviour. This was observed particularly
in the three-dimensional simulation o f the Prototype Repository Experiment. The
simulation o f the coupled stress/strain behaviour proved reasonably successful during the
investigations and moderately good correlations were achieved by the model.
9.9 Suggestions for further research
I t has been shown in this study that the numerical model is capable o f representing the
coupled thermo/hydro/mechanical behaviour o f large scale in-situ experiments for the
disposal o f high-level nuclear waste. I t should be noted however that research into this
area is a continually ongoing process and additional development o f the model is required.
Therefore, the fo llow ing suggestions are made fo r further research.
One o f the current lim itations o f the model is that it does not include hysteresis in the
relationship between the degree o f saturation and suction. This phenomenon may play an
important role in the moisture flow behaviour o f partially saturated soils and it would be o f
great benefit to include it in the current formulation. This could potentially be achieved by
the application o f separate wetting and drying water retention curves.
Further research into the swelling characteristics and micro/macro interaction o f bentonitic
clays is recommended. This could lead to the development o f a dual porosity model
9-10
Chapter 9 Conclusions and suggestions for further research
combined w ith the current theoretical formulation. The current simplified concept could
be expanded in greater detail, w ith small scale laboratory experiments conducted for
validation purposes.
Likewise, the vapour flow characteristics o f M X-80 buffer and/or similar materials need
further research to determine a more precise vapour flow law, particularly for the
simulation o f the Prototype Repository Experiment. This should be performed
concurrently w ith a series o f small scale thermal-hydraulic laboratory experiments. It
should be noted that this area o f research is currently being performed at the
Geoenvironmental Research Centre at C ard iff University.
In both numerical investigations more accurately defined material parameters and
relationships would have been o f major benefit to the study. Therefore, further
experimental study o f the M X-80 buffer, M X-80 pellets and backfill under thermal and
hydraulic gradients is recommended. In particular, a better understanding o f the
deformation behaviour o f the pelletised region after saturation would be highly valuable.
The heterogeneity o f host granitic rock in disposal schemes as illustrated at the Aspo Hard
Rock Laboratory needs greater attention in future numerical modelling exercises. This
inherent fractured nature could possibly be incorporated into the formulation via a discrete
fracture network approach as opposed to a simplified approach. However, further
investigation would be required.
There were a number o f key developments made during this study into the three-
dimensional capabilities o f the model i.e. via the application o f high-performance
computing, parallel processing and visualisation techniques. However, further
development is needed to ensure that the model keeps pace with improvements in
processing power and new technologies. It is therefore recommended that future
computationally demanding analyses benefit from the additional processing power o f Grid
computing. This could potentially a llow complex large scale fu lly coupled three-
dimensional thermo/hydro/mechanical analyses to be performed.
The work presented in this study has not considered the chemical behaviour coupled with
the thermo/hydro/mechanical model. It is acknowledged that this in an important area o f
research in the disposal o f high-level nuclear waste in deep geological repositories due to
the chemical composition o f the granitic water. However, it should be noted that a fu lly
9-11

Chapter 9 Conclusions and suggestions for further research
coupled m ulti-chem ical transport model has recently been developed and validated within
the Geoenvironmental Research Centre at C ard iff University.
9-12
References
AECL, (2001) “ Clay Bulkhead Performance and Status” , TSX Progress Meeting #11, Atomic
Energy o f Canada Limited, Presentation by D.A. Dixon.
AECL, (2002) “ T-H-M modelling for the TSX” , personal communication.
Aggeskog, L. and Jansson, P. (1998) “ Finite element analyses o f heat transfer and temperature
distribution in buffer and rock: general part and case no 1” , SKB, HRL-98-20.
Aitchison, G.D., (1965) Discussion in Proceedings o f the 6th International Conference on Soil
Mechanics and Foundation Engineering, 3, 318-321.
Alonso, E.E., and Alocoverro, J., (1999) “ Calculation and testing o f behaviour o f unsaturated clay
as a barrier in radioactive waste repositories (CATSIUS CLAY Project)” , Final Report on
Contract, No. F14W-CT95-0003.
Alonso, E.E., and Alocoverro, J., (2003) “The FEBEX test as a benchmark case for THM
modelling” , Proceedings from the Sitges Conference, Large Scale Field Tests in Granite,
Barcelona.
Alonso, E.E., Battle, F., Gens, A., and Lloret, A. (1988) “ Consolidation analysis o f partially
saturated soils — Application to earthdam construction” , Proceedings o f the 6,h International
Conference on Numerical Methods in Geomechanics, Rotterdam, 2, 1303-1308.
Alonso, E.E., Gens, A., and Hight, D.W., (1987) “ Special problem soils. General report” ,
Proceedings o f the 9'' European Conference on Soil Mechanics and Foundation Engineering,
Dublin, 3, 1087-1146.
Alonso, E.E., Gens, A., and Josa, A., (1990) “ A constitutive model for partially saturated soils” ,
Geotechnique, 40, No. 3, 405-430.
Alonso, E.E., Lloret, A., Gens, A., Delahaye, C.H., Vanaut, J. and Volckaert, G., (1995) “Coupled
analysis o f a backfill hydration test” , Proc. o f International Workshop on ‘Hydro-Thermo-
Mechanics o f Engineered Clay Barriers and Geological Barriers ’, Montreal, Quebec, Canada, July
1995 -McGill University.
Alonso, E.E., Vaunat, J. and Gens, A., (1999) “ Modelling the mechanical behaviour o f expansive
clays” , Engineering Geology, 54, 173-183.
Axelsson. O., (1972) “ A generalised SSOR method” , BIT, 12, 443-467.
Axelsson, O., (1985) “ A survey o f preconditioned iterative methods for linear systems o f algebraic equations” , BIT, 25, 166-187.
Barden, L., (1965) “ Consolidation o f compacted and unsaturated clays” , Geotechnique, 15, No. 3., 267-286.
Barden, L., Madedor, A.O., and Sides, G.R., (1969) “Volume change characteristics o f unsaturated
clay” , Journal o f Soil Mechanics and Foundation Engineering, American Society o f Civil
Engineers, 95, S M I, 33-51.
Barrett, R., Berry, M., Chan, T., Demmel, J., Donato, J., Dongraa, L, Eijkhout, V., Pozo, R.,
Romine, C., and Van der Vorst, H., (1995) “Templates, for the solution o f linear systems: building
blocks for iterative methods” , John Wiley Press, New York.
Baugh, J.W., and Chadha H.S., (1993) “Network distributed finite element analysis” , Information
fo r technology fo r c iv il and structural engineers, Civ-Comp Press, ISBN 0-948749-16-4, 205-218.
Bernier, F., and Neerdael, B., (1996) “ Overview o f in-situ thermomechanical experiments in clay:
Concept, results and interpretation” , Engineering Geology, 41, 51-64.
Biot, M.A., (1941) “ General theory o f three-dimensional consolidation” , Journal o f Applied
Physics, 12(2), 115-164.
Bishop, A.W., (1959) “The principle o f effective stress” , lecture delivered in Oslo, Norway, in
1955, published in Teknisk Ukeblad, 106, No. 39., 859-863.
Bishop, A.W., (1960) “ The measurement o f pore pressure in the triaxial test” , Pore Pressure and
Suction in Soils, Publ., Butterworths, London.
Bishop, A.W., and Blight, G.E., (1963) “ Some aspects o f effective stresses in saturated and partly
saturated soils” , Geotechnique, 13, No. 3., 177-197.
Bjorstad, P.E., Braekhus, J., and Hvidsten, A., (1990) “ Parallel sub-structuring algorithms in
structural analysis, direct and iterative methods” , Fourth international symposium on domain
decomposition methods fo r partia l differential equations, 321-340.
Blatz, J.A. and Graham, J., (2000) “ A system for controlled suction in triaxial tests” , Geotechnique,
50, No. 4, 465-478.
Blatz, J.A. and Graham, J., (2003) “ Elastic-plastic modelling o f unsaturated soil using results from
a new triaxial test with controlled suction” , Geotechnique, 53, No. 1, 113-122.
BNFL, (2004) “ Nuclear Waste” [WWW] URL:http://www.bnfl.com/index.aspx, [accessed on 13th
October 2004]
Bolzon, G., Schrefler, B.A, and Zienkiewicz, O.C., (1996) “ Elasto-plastic soil constitutive laws
generalise to partially saturated states” , Geotechnique, 46, No. 2, 279-289
Bonelli, S., and Poulain, D., (1995) “ Unsaturated elasto-plastic model applied to homogeneous
earth dam behaviour” . Proceedings o f the I s' International Conference on Unsaturated Soils,
Alonso, E.E., and Delage, P., (eds.), Paris, Published by A.A., Balkema, 1, 265-271.
Borgesson, L., Gunnarsson, D „ Johannesson, L.E. and Sanden, T. (2002) “ Aspo HRL - Prototype
Repository. Installation o f buffer, canisters, backfill and instruments in Section 1” , SKB, IPR-02- 23.
Borgesson, L. and Hemelind, J. (1998) “ Preparatory modelling for the backfill and plug test —
Scoping calculations o f H-M processes” , SKB, IPR-99-11.
Borgesson, L. and Hemelind, J. (1999) “ Preliminary modelling o f the water saturation phase o f the
buffer and backfill materials” , SKB, IPR-00-11.
Borgesson, L., Johannesson, L.E. and Sanden, T. (2001) “Aspo HRL - Prototype Repository.
Compilation o f Laboratory Data for Buffer and Backfill Materials in the Prototype Repository” ,
SKB, IPR-01-34.
Borgesson, L., Johannesson, L.E. Sanden, T. and Hemelind, J. (1995) “Modelling o f the physical
behaviour o f water saturated clay barriers. Laboratory tests, material models and finite element
application” , SKB, TR 95-20.
Borgesson, L., Kamland, O., and Johannesson, L.-E., (1996) “Modelling o f the physical behaviour
o f clay barriers close to water saturation” , Engineering Geology, 41, 127-144.
Borgesson, L. and Sanden, T., (2001) “ Aspo HRL - Prototype Repository. Report on instrument
positions in buffer/backfill and preparation o f bentonite blocks for instruments and cables in
Section I” , SKB, IPR-01-20.
Borgesson, L. and Sanden, T., (2003) “ Aspo HRL - Prototype Repository. Instrumentation of
buffer and backfill in Section II” , SKB, IPR-03-21.
Britto, A.M., and Gunn, M.G., (1987) “ Critical state soil mechanics via finite elements” , Ellis
Horwood Ltd.
Burland, J.B., (1965) “ Some aspects o f mechanical behaviour o f partly saturated soils” , Moisture
Equilibrium and Moisture Changes in Soils Beneath Covered Areas, Sydney,: Butterworths, 270-
278.

Carman, P.C., (1956) “ Flow o f gases through porous media” , Butterworths Scientific Publications, London.
Carter, W.T., Sham, T-L., and Law, K.H., (1989) “ A parallel finite element method and its
prototype implementation a Hypercube” , Computers & structures, 31, No. 6, 921-934.
CATSIUS CLAY Project (1998), Topical Report, Stage 3, Contract No. F14W-CT95-003, Doc XII-158-99-EN.
Chandler, N., (2000) “ Water inflow calculations for the isothermal buffer-rock-concrete plug
interaction test” , Used Fuel Disposal Technology Program Report 06819-xxxxx-Txx, Ontario Power Generation.
Chandler, N., Martino, J. and Dixon, D., (2002a) “The Tunnel Sealing Experiment” , In Proc. o f 6h
International Workshop on Design and Construction o f Final Repositories, Session 4, Number 11,
Brussels, ONDRAF-NIRAS.
Chandler, N., Coumut, A., Dixon, D., Fairhurst, C., Hansen, F., Gray, M., Hara, K., Ishijima, Y.,
Kozak, E., Martino, J., Masumoto, K., McCrank, G., Sugita, Y., Thompson, J. Tillerson, P. and
Vignal, B., (2002b) “ The five year report on the Tunnel Sealing Experiment: an international
project o f AECL, JNC, ANDRA AND WIPP” , Atomic Energy o f Canada Limited Report, AECL-
12727.
Chang, C.S., and Duncan, J.M., (1983) “ Consolidation analysis for partially saturated clay by using
an elasto-plastic effective stress-strain model” , International Journal fo r Numerical and Analytical
Methods in Geomechanics ” , 7, 30-56.
Chapman, N.A., and McKinley, I.G., (1987) “The geological disposal o f nuclear waste” , John
Wiley and Sons, Chicester.
Chijimatsu, M., Sugita, Y., Fujita, T. and Amemiya, K., (1999) “ Coupled Thermo-Hydro-
Mechanical Experiment at Kamaishi Mine - experiment results” Japan Nuclear Cycle Development
Institute, Technical Note 15-99-02 JNC TN8400 99-034.
Chronopoulos A.T., and Gear C.W., (1989) “ On the efficient implementation o f preconditioned s-
step eg methods on multiprocessors with memory hierarchy” , Parallel Computing, 11, 37-53.
CIMNE, (2004) “ GiD - the personal pre and post processor” , [WWW]
URL:http://gid.cimne.upc.es/. [accessed on May 28,h, 2004].
Cleall, P.J., (1998) “ An investigation o f the thermo/hydraulic/mechanical behaviour of unsaturated
soils, including expansive clays” , Ph.D thesis, University o f Wales, Cardiff, U.K.
Cleall, P. J., Thomas, H.R. and Melhuish, T.A. (2002a) “Vapour transfer in clay based engineered
barriers, in high level nuclear waste disposal” , Proceedings o f Workshop on Clay microstructure
and its importance to soil behaviour, Lund, Sweden, pp 58 - 65.
Cleall, P. J., Thomas, H.R., Melhuish, T.A. and Owen, D.H. (2002b) “ Simulation o f the behaviour
o f deep geological repositories - some computational challenges” , Proceedings o f the 8th
International Conference on Numerical Methods in Geomechanics, Balkema. Numerical Models in
Geomechanics - NUMOG V III, 235 - 240, ISBN no: 90-5809-359-X.
Coleman, J.D., (1962) “ Stress strain relations for partly saturated soil” , Correspondence to
Geotechnique, 12, No. 4., 348-350.
Collin, F., L i, X.L., Radu, J.P. and Charlier, R., (2002) “Thermo-hydro-mechanical coupling in
clay barriers” , Engineering Geology, 64, 179-193.
Connell, L.D., and Bell, P.R.F., (1993) “ Modelling moisture movement in revegetating waste
heaps; Development o f a finite element model for liquid and vapour transport” , Water Resources
Research, 29, No. 5., 1435-1443.
Cook, R.D., (1981) “ Concepts and applications o f finite element analysis” , Wiley, New York.
Couvillion, R.J., and Hartley, J.G., (1986), “Drying front movement near low intensity
impermeable underground heat sources” , Journal o f Heat Transfer, American Society of
Mechanical Engineers, 108, 182-189.
Cui, Y.J., and Delage, P., (1996) “ Yielding and plastic behaviour o f an unsaturated compacted silt” ,
Geotechnique, 46, No. 2, 291-311.
Cui, Y.J., Yahia-Aissa, M, Delage, P. (2002) “ A model for the volume change o f heavily
compacted swelling clays” , Engineering Geology, 64, 233-250.
Dahlstrom, L-O., (1998) “Aspo HRL - Test plan for the Prototype Repository” , SKB, HRL-98-24.
Dakshanamurthy, V., and Fredlund, D.G., (1981) “A mathematical model for predicting moisture
flow in an unsaturated soil under hydraulic and temperature gradients” , Water Resources Research,
17, No. 3., 714-722.
Datta, R., Barr, D. and Boyle, W., (2003) “Measuring thermal, hydrologic, mechanical, and
chemical responses in the Yucca Mountain Drift Scale Test” , Proceedings from the International
Conference on Coupled T-H-M-C Processes in Geo-systems, GeoProc 2003, Stockholm, Sweden.
Davies, P.B., (1991) “ Evaluation o f the role o f threshold pressure in controlling flow o f waste
generated gas into bedded salt at the waste isolation pilot plant” , Technical Report, SAND-90-
3246, Sandia National Laboratories, Albuquerque, New Mexico.
Delage, P., and Graham, J., (1996) “ Mechanical behaviour o f unsaturated soils: Understanding the
behaviour o f unsaturated soils requires reliable conceptual models” , Proceedings o f the I s'
International Conference on Unsaturated Soils, Alonso E.E., and Delage, P., (eds.), Paris,
Published by A.A. Balkema, 3, 1223-1258.
Delin, P., Sturk, R „ and Stille, H., (1995) “ Laboratory testing o f rock” , SKB, Technical note 25-95-
08v.
de Vries, D.A., (1958) “ Simultaneous transfer o f heat and moisture in porous media” , Trans.
American Geophys. Union, 39, No. 5, 909-916.
de Vries, D.A., (1966) “ Physics o f plant environment” , 2nd Edition, North Holland Publishing
Company, 215-235.
Dickinson, J.K., and Forsyth, P.A., (1994) “ Preconditioned conjugate gradient methods for three-
dimensional linear elasticity” , International journal fo r numerical methods in engineering, 37,
2211-2234.
Dixon, D. A. and Gray, M. N., (1985) “ The engineering properties o f buffer material - research at
Whiteshell Nuclear Research Establishment” , In Proceedings o f the 19th Information Meeting o f the
Nuclear Fuel Waste Management Program, Atomic Energy o f Canada Limited, Technical Record,
TR-350, Volume III, 513-530.
Edelfsen, N.E., and Andersen, A.B.C., (1943) “Thermodynamics o f soil moisture” , Hiigardia, 15,
No. 2., 31-298.
Edgar, T.V., Nelson, J.D., and McWhorter, D.B., (1989) “Non-isothermal consolidation in
unsaturated soils” , Journal o f Geotechnical Engineering, ASCE, 115, No. 10., 1351-1372.
Ericsson, L.O., (1999) “ Geoscientific R&D for high level radioactive waste disposal in Sweden -
current status and future plans” , Engineering Geology, 52, 305-317.
Ewen, J., (1987) “ Combined heat and mass transfer in unsaturated sand surrounding a heated
cylinder” , Ph.D. Thesis, School o f Engineering, University College, Cardiff, UK.
Ewen, J., and Thomas, H.R., (1987) “ The thermal probe - a new method and its use on an
unsaturated sand” , Geotechnique, 37, 91-105.
Ewen, J., and Thomas, H.R., (1989) “ Heating unsaturated medium sand” , Geotechnique, 39, No. 3,
455-470.
Farhat C., and Wilson E., (1987) “ A new finite element concurrent computer program
architecture” , International journa l fo r numerical methods in engineering, 24,1771-1792.
Farhat, C., (1989) “ Which parallel finite element algorithm for which architecture and which
problem” in R. V. Gradhi et a l (eds), Computational structural mechanics and multidisciplinary
optimisation, AD, 16, ASME, New York, 35-43.
Farhat, C., and Lesoinne, M., (1993) “ Automatic partitioning o f unstructured meshes for the
parallel solution o f problems in computational mechanics” , International journal fo r numerical
methods in engineering, 36, 745-764.
Felix, B., Lebon, P., Miguez, R., and Plas, F., (1996) “ A review o f the ANDRA’s research
programmes on the thermo-hydro-mechanical behaviour o f clay in connection with the radioactive
waste disposal project in deep geological formations.” , Engineering Geology, 41, 35-50.
Forsmark, T. and Rhen, I., (1999a) “ Aspo HRL - Prototype Repository. Hydrogeology -
Interference test campaign 1 after drill campaign 3” , SKB, IPR-00-07.
Forsmark, T. and Rhen, I., (1999b) “ Aspo HRL - Prototype Repository. Hydrogeology - Drill
campaign 3A and 3B” , SKB, IPR-00-08.
Forsmark, T. and Rhen, I., (2000a) “ Aspo HRL - Prototype Repository. Hydrogeology - Injection
test campaign 1” , SKB, IPR-00-20.
Forsmark, T. and Rhen, I., (2000b) “ Aspo HRL - Prototype Repository. Hydrogeology -
Interference test campaign 2 after drill campaign 3” , SKB, IPR-00-21.
Forsmark, T „ Rhen, I. and Andersson, C „ (2001a) “ Aspo HRL - Prototype Repository.
Hydrogeology - Deposition and lead-through boreholes: Inflow measurements, hydraulic responses
and hydraulic tests” , SKB, IPR-00-33.
Forsmark, T., Rhen, I. and Andersson, C „ (2001b) “ Aspo HRL - Prototype Repository.
Hydrogeology - Injection test campaign 2, flow measurement o f DA3575G01, groundwater
salinity, groundwater leakage into G, I and J-tunnels” , SKB, IPR-01-31.
Fredlund, D.G., (1979) “ Appropriate concepts and technology for unsaturated soils” , Canadian
Geo technical Journal, 16, 121-139.
Fredlund, D.G., (1991) “ Seepage in saturated soils. Panel Discussion : Ground water and seepage
problems” Proceedings o f the 10th International Conference on Soil Mechanics and Foundation
Engineering, Stockholm, 4, 629-641.
Fredlund, D.G., and Hasan, J.U., (1979) “ One-dimensional consolidation theory: unsaturated
soils” , Canadian Geotechnical Journal, 16, 521-531.
Fredlund, D.G., and Rahardjo, H., (1993) “ Soil Mechanics for Unsaturated Soils” , John Wiley &
Sons Inc, New York.
Fredlund, D.G., and Morgenstem, N.R., (1977) “ Stress state variables for unsaturated soils” ,
Journal o f Geotechnical Engineering Division o f the American Society fo r Civil Engineers, 103,
GT5, 447-446.
Frieg, B., and Vomvoris, S., (1994) “ Investigation o f hydraulic parameters in the saturated and
unsaturated zone o f the ventilation drift” , Technical Report 93-10, Nagra, Baden, Switzerland.
Fuentes-Cantillana, J-L., (2003) “ The FEBEX in-situ test: Lessons learned on the engineering
aspects o f horizontal buffer construction and canister emplacement” , Proceedings from the Sitges
Conference, Large Scale Field Tests in Granite, Barcelona.
Fujita, T., Kobayashi, A. and Borgesson, L., (1996) “ Experimental investigation and mathematical
simulation o f coupled T-H-M processes o f the engineered buffer materials, the TC3 problem” ,
Developments in Geotechnical Engineering, 19, 369-392.
Gallipoli, D., Wheeler, S.J. and Karstunen, M., (2003a) “ Modelling the variation o f degree o f
saturation in a deformable unsaturated soil” , Geotechnique, 53, No. 1, 105-112.
Gallipoli, D., Gens, A., Sharma, R. and Vaunat, J., (2003b) “An elasto-plastic model for
unsaturated soil incorporating the effects o f suction and degree o f saturation on mechanical
behaviour” , Geotechnique, 53, No. 1, 123-135.
Gens, A., (1995) “ Constitutive modelling: application to compacted soils” , Proceedings o f the I 5'
International Conference on Unsaturated Soils, Alonso, E.E., and Delage, P., (eds.), Paris,
Published by A.A., Balkema, 1, 1179-1200.
Gens, A., and Alonso, E.E., (1992) “A framework for the behaviour o f unsaturated expansive
clays” , Canadian Geotechnical Journal, 29, 1013-1032.
Gens, A., Garcia-Molina, A.J., Olivella S., Alonso, E.E., and Huertas, F., (1998) “Analysis o f a full
scale in situ test simulating repository conditions” , International Journal fo r Numerical and
Analytical Methods in Geomechanics., 22, 515-548.
Gens, A., and Potts, D.M., (1982) “Application o f critical state models to the prediction o f the
behaviour o f a normally consolidated low plasticity clay” , Proceedings o f the 1st International
Symposium on Numerical Modelling and Geomechanics, Zurich, 312-323.
Gentzschein, B., (1997) “ Aspo HRL - Prototype Repository. Hydraulic tests in exploratory holes.
D rill campaign 1” , SKB, IPR-99-27.
Gentzschein, B., (1998) “ Aspo HRL - Prototype Repository. Hydraulic tests in exploratory holes.
D rill campaign 2” , SKB, EPR-99-28.
Gentzschein, B., (1999a) “ Aspo HRL - Prototype Repository. Hydraulic tests in exploratory holes.
D rill campaign 3a” , SKB, IPR-99-29.
Gentzschein, B., (1999b) “ Aspo HRL - Prototype Repository. Hydraulic tests in exploratory holes.
D rill campaign 3b” , SKB, IPR-99-30.
Gentzschein, B., (1999c) “Aspo HRL - Prototype Repository. Hydraulic tests in exploratory holes.
Injection tests” , SKB, IPR-99-31.
Gentzschein, B., (1999d) “ Aspo HRL - Prototype Repository. Hydraulic tests in exploratory holes.
Interference tests A after drill campaign 3” , SKB, IPR-99-32.
Gentzschein, B., (1999e) “Aspo HRL - Prototype Repository. Hydraulic tests in exploratory holes.
Interference tests B after drill campaign 3” , SKB, IPR-99-33.
Gentzschein, B., (2001) “ Aspo HRL - Prototype Repository. Hydraulic tests in exploratory holes.
Injection tests_II” , SKB, IPR-01-21.
Geraminegrad, M., and Saxena, S., (1986a) “A coupled thermoelastic model for saturated-
unsaturated porous media” , Geotechnique, 36, No. 4., 539-550.
Geraminegrad, M., and Saxena, S., (1986b) “ Finite elements in plasticity: Theory and practice” ,
Pineridge Press Ltd., Swansea.
Goudarzi, R. and Johannesson, L-E., (2003) “ Aspo HRL - Prototype Repository. Sensors data
report (Period 010917-030901). Report No:7” , SKB, IPR-03-46.
Graham, J., Chandler, N.A., Dixon, D.A., Roach, P.J., To, T., and Wan, A.W.L., (1997) “The
Buffer/Container experiment: Results, synthesis, issues” Technical Report, AECL-11746, COG-97-
46-1.
Graham, J., Saadat, F., Gray, M.N., Dixon, D.A., and Zhang, Q.-Y., (1989) “ Strength and volume
change behaviour o f a sand-bentonite mixture” , Canadian Geotechnical Journal, 26, 292-305.
Green, R.E., and Corey, J.C., (1971) “ Calculation o f hydraulic conductivity: A further evaluation
o f some predictive methods” , Proceedings o f the Soil Society o f America 35, 3-8.
Green, R.T. and Painter, S.L., (2003) “Numerical simulation o f thermohydrological processes
observed at the drift-scale heater test at Yucca Mountain, Nevada” , Proceedings from the
International Conference on Coupled T-H-M-C Processes in Geo-systems, GeoProc 2003,
Stockholm, Sweden.
Gunnarsson, D., Borgesson, L. Hokmark, H., Johannesson, L.E. and Sanden, T., (2001a) “ Aspo
HRL - Report on the installation o f the Backfill and Plug Test” , SKB, IPR-01-17.
Gunnarsson, D., Johannesson, L-E. and Borgesson, L. (2001b) “ Aspo HRL - Prototype Repository.
Backfilling o f the tunnel in the Prototype Repository. Results o f pre-tests. Design o f material,
production technique and compaction technique” , SKB, IPR-01-11.
Guo, R., and Chandler, N.A., (2002) “Thermal-Hydraulic Numerical Modelling o f the flow of
heated water through a sand-filled tunnel in granite” , Proceedings o f the 55th Canadian
Geotechnical Conference, Niagara Falls, Ontario, 497-504, Canadian Geotechnical Society.
Guo, R., Chandler, N.A., and Dixon, D., (2002) “Modelling the thermally induced hydraulic and
mechanical response for the heated phase o f the Tunnel Sealing Experiment” , Ontario Power
Generation, Nuclear Waste Management Division, Report No. 06819-REP-01200-10095-R00.
Guo, R., Chandler, N.A., Martino, J. and Dixon, D., (2003) “Thermo-Hydro-Mechanical Numerical
Modelling o f the TSX with Comparisons to Measurements During Stage 1 Heating” , Atomic
Energy o f Canada Limited, Report No: 06819-REP-01300-10070-R00.
Guvanasen, V. and Chan, T., (2000) “A three-dimensional numerical model for
thermohydromechanical deformation with hysteresis in a fractured rock mass” , International
Journal o f Rock Mechanics and Mining Sciences, 37, 89-106.
Hashm, A. A., (1999) “A study o f the transport o f a selection o f heavy metals in unsaturated soils” ,
Ph.D. Thesis, Cardiff University, Wales, UK.
Hokmark, H., (2003) “ Temperature Buffer Test - Comparison o f modelling results/experimental
findings: causes o f difference” , Proceedings from the Sitges Conference, Large Scale Field Tests in
Granite, Barcelona.
Hsiung, S.M., Chowdhury, A.H. and Nataraja, M.S., (2003) “Thermal-mechanical modelling o f a
large-scale heater test” , Proceedings from the International Conference on Coupled T-H-M-C
Processes in Geo-systems, GeoProc 2003, Stockholm, Sweden.
Hueckel, T., and Baldi, G., (1990) “Thermoplasticity o f saturated clays. Experimental constitutive
study” , Journal o f Geotechnical Engineering, 116, No. 12, 1778-1796
Huertas, F., Fuentes-Cantillana, J.L., Jullien, F., Rivas, P., Linares, J., Farina, P., Ghorechi, M.,
Jockwer, N., Kickmaier, W., Martinez, M.A., Samper, J., Alonso, E., and Elorza, F.J. (2000) “ Full-
scale engineered barriers experiment for a deep geological repository for high level radioactive
waste in crystalline host rock (FEBEX project)” Euratom.
Jakob, M., (1949) “ Heat transfer: Vol 1” , Wiley.
Jaky, J., (1948) “ Pressure in soils” , Proceedings o f the 2nd International Conference on Soil
Mechanics and Foundation Engineering, 1, 103-107.
Jennings, J.E., and Burland, J.B., (1962) “ Limitations to the use o f effective stresses in partly
saturated soils” , Geotechnique, 12, No. 2., 125-144.
Jing, L., Tsang, C.F., Stephansson, O., and Kautsky, F., (1996) “Validation o f mathematical models
against experiments for radioactive waste repositories - DECOVALEX experience” , Coupled
Thermo-Hydro-Mechanical Processes o f Fractured Media, Developments in Geotechnical
Engineering, 79, 25-56.
Johannesson, L-E. (1999) “ Compaction o f full size blocks o f bentonite for the KBS-3 concept” ,
SKB, R-99-66.
Johannesson, L-E., Borgesson, L. and Gunnarsson, D. (2003) “ Hydro-Mechanical Properties of
Backfill Material” , Proceedings from the Sitges Conference, Large Scale Field Tests in Granite,
Barcelona.
Johannesson, L-E., Borgesson, L. and Sanden, T. (1999) “Aspo HRL - Backfill materials based on
crushed rock (part 2). Geotechnical properties determined in laboratory” , SKB, IPR-99-23.
Jommi, C., and di Prisco, C., (1994) “ Un semplice approcio teorico per la modellazione del
comportamento meccanico di terreni granulari parcialmente saturi” , Conf I I ruolo dei flu id i nei
problemi di ingegneria geotecnica, Mondovi, 167-188, (in Italian).
Josa, A., Alonso, E.E., Lloret, A., and Gens, A., (1987), “ Stress-strain behaviour o f partially
saturated soils” , Proceedings o f the 9°' European Conference on Soil Mechanics and Foundation
Engineering, Dublin, 2, 561-564.
Josa, A., (1988) “Un modelo elastoplastico para suelos no saturados” , Ph.D. Thesis, Universitat
Politechnica de Catalunya, Barcelona.
Josa, A., Balmaceda, A., Gens, A., and Alonso, E.E., (1992) “ An elastoplastic model for partially
saturate soils exhibiting a maximum of collapse” , Proceedings o f the 3rd International Conference
on Computational Plasticity, Barcelona, 1, 815-826.
Kanno, T., Fujita, T., Takeuchi, S., Ishikawa, H., Hara, K., and Nakano, M., (1999) “Coupled
thermo-hydro-mechanical modelling o f bentonite buffer material” , International Journal fo r
Numerical and Analytical Methods in Geomechanics, 23, 1281-1307.
Kanno, T., Kato, K., and Yamagata, J., (1996) “ Moisture movement under a temperature gradient
in highly compacted bentonite” , Engineering Geology, 41, 287-300.
Kato, S., Matsuoka, H., and Sun, D.A., (1995) “A constitutive model for unsaturated soil based on
extended SMP” , Proceedings o f the I s' International Conference on Unsaturated Soils, Alonso
E.E., and Delage, P., (eds.), Paris, Published by A.A., Balkema, 2, 739-744.
Kaye, G.W.C., and Laby, T.M., (1973) “Tables o f physical and chemical constants” , 14th Edition,
Harlow, Longman.
Khan, A.I. and Topping, B.H.V., (1993) “ Parallel finite element analysis using the jacobi-
conditioned conjugate gradient algorithm” , Proceedings o f the 5th International Conference on
Civil Engineering Computing, Information technology for civil and structural engineering, CIVIL-
COMP press, 245-255.
King R.B., and Sonnad. V., (1987) “ Implementation o f an element-by-element solution algorithm
for the finite element methods on a course-grained parallel computer” , Computer methods in
applied mechanics and engineering, 65, 47-59.
King, S.D., (1991) “ A potential based model o f coupled heat and moisture transfer in unsaturated
soil” , Ph.D. Thesis, School o f Engineering, University o f Wales, Cardiff, UK.
Kohgo, Y., Nakano, M., and Miyazaki, T., (1993a) “Theoretical aspects o f constitutive modelling
for unsaturated soils” , Soils and Foundations, 33, No. 4, 49-63.
Kohgo, Y., Nakano, M., and Miyazaki, T., (1993b) “Verification o f the generalised elasto-plastic
model for unsaturated soil” , Soils and Foundations, 33, No. 4, 64-73.
Komfalt, K-A. and Wikman, H., (1988) “The rocks o f Aspo Island. Description to the detailed
maps o f solid rocks including maps o f 3 uncovered trenches” , SKB, Progress report 25-88-12.
Krischer, D., and Rohnalter, H., (1940) “ Warmeleitung und Dampfdiffusion in feutchen Gutem” ,
Verein Duet, Ing-Forschungsheft, 402.
Lesoinne, M., Farhat, C., and Geradin, M., (1991) “ Parallel/vector improvements o f the frontal
method” , International journal fo r numerical methods in engineering, 32, 1267-1281.
Lingnau, B.E., Graham, J., and Tanaka, N., (1994) “ Isothermal modelling o f sand-bentonite
mixtures at elevated temperatures” , Canadian Geotechnical Journal. 32, 78-88.
Ljunggren, C. and Bergsten, K-A., (1998) “Aspo HRL - Prototype Repository. Rock stress
measurements in KA3579G” , SKB, HRL-98-09.
Lloret, A., and Alonso, E.E., (1980) “Consolidation o f unsaturated soils including swelling and
collapse behaviour” , Geotechnique, 30, No. 4., 449-477.
Lloret, A., and Alonso, E.E., (1985) “ State surfaces for partially saturated soils” , Proceedings o f
the I I th International Conference o f Soil Mechanics and Foundation Engineering, San Francisco,
2, 557-562.
Lloret, A., Gens, A., Battle, F., and Alonso, E.E., (1987) “ Flow and deformation analysis of
partially saturated soils” , Proceedings o f the 9th European Conference on Soil Mechanics and
Foundation Engineering, Dublin, 2, 565-568.
Lloret, A., Villar, M.V., Sanchez, M., Gens, A., Pintado, X. and Alonso, E.E., (2003) “Mechanical
behaviour o f heavily compacted bentonite under high suction changes” , Geotechnique, 53, No. 1,
27-40.
Luikov, A.V., (1966), “ Heat and mass transfer in capillary porous bodies” , Pergamon Press,
Oxford.
Mackerle, J., (1996) “ Implementing finite element methods on supercomputers, workstations and
PCs” , Engineering Computations, 13, Nol, 33-85.
Matayas, E.L., and Radhakrishna, H.S., (1968) “ Volume change characteristics o f partially
saturated soils” , Geotechnique, 18, No. 4., 432-448.
Millard, A. and Rutqvist, J., (2003) “ Comparative analyses o f predicted and measured
displacements during the heating phase o f the Yucca Mountain Drift Scale Test” , Proceedings from
the International Conference on Coupled T-H-M-C Processes in Geo-systems, GeoProc 2003,
Stockholm, Sweden.
Mitchell, J.K., (1993) “ Fundamentals o f soil behaviour” John Wiley, New York.
Mitchell, H.P., (2002) “An investigation into the thermo/hydro/mechanical interactions involved in
high level nuclear waste disposal” Ph.D thesis, University o f Wales, Cardiff, U.K.
Navarro, V. and Alonso, E.E., (2000) “Modelling swelling soils for disposal barriers” , Computers
and Geotechnics, 27, No. 1, 19-43.
NIEeS, (2004) “National Institute for Environmental eScience” , [WWW]
URL:http://www.niees.ac.uk/index.html. [accessed on June 15,h, 2004].
NIREX, (2004) “Background information on radioactive waste” , [WWW]
URL:http://www.nirex.co.ukA [accessed on 13,h October, 2004],
Notay, I. (1995) “ An efficient parallel discrete PDE solver” , Parallel Computing, 21, 1725-1748.
Olivella, S., Gens, A. and Gonzalez, C., (2003) “THM analysis o f a heating test in a fractured tu ff’,
Proceedings from the International Conference on Coupled T-H-M-C Processes in Geo-systems,
GeoProc 2003, Stockholm, Sweden.
Ortega, J.M., (1988) “ Introduction to parallel and vector solution o f linear systems” Plenum Press,
New York and London, 197-231.
Owen, D.H., (2000) “ Preconditioned parallel iterative solution methods for coupled finite element
analyses” Ph.D thesis, University o f Wales, Cardiff, U.K.
Owen, D.R.J., and Hinton, E., (1980) “ Finite elements in plasticity: Theory and practice” Pineridge
Press Ltd., Swansea.
Partington, J.R., and de Vries, D.A., (1957) “Moisture movement in porous materials under
temperature gradients” , Trans. Amer. Geophys. Union, 38, No. 2., 222-232.
Patel, S., Dahlstrom, L-O. and Stenberg, L., (1997) “ Aspo HRL - Characterisation o f the rock mass
in the Prototype Repository at Aspo HRL, Stage 1” , SKB, HRL-97-24.
Philip, J.R., and de Vries, D.A., (1957) “Moisture movements in porous materials under
temperature gradients” , Transactions, American Geophysical Union, 38, No. 2, 222-232.
Plischke, B., and Bulgakov, V., (1999) “ Application o f iterative solvers in geomechanics with
special emphasis on petroleum engineering” , Submitted for publication.
Pollock, D.W., (1986) “ Simulation o f fluid and energy processes associated with high level
radioactive waste disposal in unsaturated alluvium” , Water Resources Research, 22, No. 5., 765-
775.
Pool, E.L., Knight, N.R, and Davis, D.D., (1992) “High-performance equation solvers and their
impact on finite element analysis” , International journal fo r numerical methods in engineering, 33,
855-868.
Preece, R.J., (1975) “The measurement and calculation o f physical properties o f cable bedding
sands. Part 2; specific thermal capacity, thermal conductivity and temperature ratio across ‘air’
filled pores” , C.E.G.B. Laboratory Note No., RD/L/N 231/74.
Pusch, R., (1998) “ Microstructural evolution o f buffer clay” , In Proceedings o f workshop on
microstructural modelling o f natural and artificially prepared clay soils with special emphasis on
the use o f clays for waste isolation, Lund, 31-38.
Pusch, R., Kamland, O., and Hokmark, H., (1990) “GMM: a general microstructural model for
qualitative and quantitative studies o f smectite clays” , Technical Report, SKB-90-43, Stockholm.
Ramesh, A.A., (1996) “ Modelling the thermo/hydraulic/mechanical behaviour o f unsaturated soil
using an elasto-plastic constitutive relationship” , Ph.D thesis, University o f Wales, Cardiff, U.K.
Rees, S.W., (1990) “ Seasonal ground movement effects on buried moisture transfer in unsaturated
soil” , Ph.D. Thesis, School o f Engineering, University o f Wales, Cardiff, UK.
Rhdn, I. and Forsmark, T., (1998a) “Aspo HRL - Prototype Repository. Hydrogeology - Drill
campaign 1” , SKB, HRL-98-12.
Rhen, I. and Forsmark, T., (1998b) “ Aspo HRL - Prototype Repository. Hydrogeology - Drill
campaign 2” , SKB, HRL-98-22.
Rhen, I. and Forsmark, T., (2001) “Aspo HRL - Prototype Repository. Hydrogeology - Summary
report o f investigations before the operation phase” , SKB, IPR-01-65.
Richards, L.A., (1931) “Capillary conduction o f liquids through porous medium” , Journal o f
Physics, 1, 318-333.
Romero, E., Gens, A. and Lloret, A., (2001a) “ Laboratory testing o f unsaturated soils under
simultaneous suction and temperature control”, Proc. 15th Int. Conf. Soil Mech. Geotech. Engng,
Istambul, 1, 619-622.
Romero, E., Gens, A. and Lloret, A., (2001b) “Temperature effects on the hydraulic behaviour of
an unsaturated clay” , Geotechnical and Geological Engineering, 19, 311-332.
Romero, E., Gens, A. and Lloret, A., (2003) “ Suction effects on a compacted clay under non-
isothermal conditions” , Geotechnique, 53, No. 1, 65-81.
Rutqvist, J., Tsang, C.-F. And Tsang, Y., (2003) “ Analysis o f stress and moisture induced changes
in fractured rock permeability” , Proceedings from the International Conference on Coupled T-H-
M-C Processes in Geo-systems, GeoProc 2003, Stockholm, Sweden.
Saad, Y., (1988), “ Preconditioning techniques for nonsymmetric and indefinite linear system” ,
Journal o f computational and applied mathematics, 24, 89-105.
Saadat, F., Graham, J., and Kjartanson, B.H., (1992) “ Finite element deformation analysis o f a
sand-bentonite liner for radioactive waste containment” , Innovation, Conservation and Renovation,
Proceedings o f the 45lh Canadian Geotechnical Society Conference, Innovation Q94/00234.
Sansom, M.R., (1995) “ A fully coupled numerical analysis o f mass, air and heat transfer in
unsaturated soil” , Ph.D. Thesis, School o f Engineering, University o f Wales, Cardiff, UK.
Seetharam, S.C., (2003) “ An investigation o f the thermo/hydro/chemical/mechanical behaviour of
unsaturated soils” Ph.D. Thesis, Cardiff University, Wales, UK.
Selvadurai, A.P.S., (1996) “Heat-induced moisture movement in a clay barrier I. Experimental
modelling o f borehole emplacement” , Engineering Geology, 41, 239-256.
Shih, T.M., Hays, L.J., Minkowyez, W.J., Yang, K.T., and Aung, W. (1986) “Parallel computations
in heat transfer” , Numerical heat transfer, 9, 639-662.
Sivakumar, V., (1993) “A critical state framework for unsaturated soil” , PhD thesis, University of
Sheffield, UK.
SKB, (2002) “ MX-80 material parameters” , personal communication.
SKB, (2004a) “ High-level waste - Quantity and hazard level” , [WWW]
URL:http://www.skb.se/templates/SKBPage 3331 .aspx. [accessed on March 2nd, 2004].
SKB, (2004b) “Clab - Central interim storage facility for spent nuclear fuel” , [WWW]
URL:http://www.skb.se/templates/SKBPage 3333.aspx. [accessed on March 2nd, 2004].
SKB, (2004c) “Aspo Hard Rock Laboratory - Projects” , [WWW]
URL:http://www.skb.se/templates/SKBPage.aspx?id=3352. [accessed on March 4th, 2004].
Sloper, N.J. (1997) “The development o f a new three dimensional numerical model for fully
coupled heat, moisture and air flow in unsaturated soil incorporating scientific visualisation and
parallel computing techniques” , PhD Thesis, University o f Wales, Cardiff, UK.
Sonneveld, P., (1989) “CGS, a fast laczos-type solver for non-symmetric linear systems” , SIAM J.
Sci. Stat. Comput., 10, Nol, 36-52.
Stenberg, L., (1994) “Manual for field work in the TBM tunnel. Documentation o f the geological,
geohydrological and groundwater chemistry conditions in the TBM tunnel” , SKB, Progress report
25-95-13.
Stephansson, O., Tsang, C.F., and Kautsky, F., (2001) “ Foreword” , International Journal o f Rock
Mechanics and Mining Sciences, 38, 1 -4.
Stigsson., M., Outters, N. and Hermansson., J., (2001) “Aspo HRL - Prototype Repository.
Hydraulic DFN Model No. 2” , SKB, IPR-01-39.
Stille, H., and Olsson, P., (1996) “ Summary o f rock mechanical results from the construction of
Aspo Hard Rock Laboratory” , SKB, HRL-96-07.
Sultan, N., Delage, P., and Cui, Y.J., (2002) “Temperature effects on the volume change behaviour
o f Boom Clay” , Engineering Geology, 64, 135-145.
Svemar, C. and Pusch, R., (2000) “ Aspo HRL - Prototype Repository. Project description” ,
FIKW-CT-2000-00055, SKB, IPR-00-30.
Terzaghi, K., (1936) “The shearing resistance o f saturated soils and the angle o f plates between the
planes o f shear” , Proceedings o f the I s' ICSMFE, Harvard, Mass., 1, 54-56.
Terzaghi, K., (1943) “Theoretical soil mechanics” , Wiley, New York.
Thomas, H.R., (1980) “ Finite element analysis o f shrinkage stresses in building materials” , Ph.D.
Thesis, University College, Swansea, U.K.
Thomas, H.R., (1985) “ Modelling two-dimensional heat and moisture transfer in unsaturated soils,
including gravity effects” , International Journal o f Analytical Methods in Geomechanics, 9, 573-
588.
Thomas, H.R., (1987) “Non-linear analysis o f heat and moisture transfer in partly saturated soil” ,
Journal o f Engineering Mechanics, American Society o f Civil Engineering, 113, 1163-1180.
Thomas, H.R., (1988a) “A non-linear analysis o f two-dimensional heat and moisture transfer in
partly saturated soil” , International Journal o f Analytical Methods in Geomechanics, 12, 31-44.
Thomas H.R., (1988b) “The influence o f non-linear thermal parameters on moisture content
distributions in unsaturated soil” , International Journal o f Analytical Methods in Engineering, 26,
263-279.
Thomas, H.R., and Cleall, P.J., (1997) “ Chemico-osmotic effects on the behaviour o f unsaturated
expansive clays” , Geoenvironmental engineering, Contaminated ground; fate o f pollutants and
remediation, Yong, R.N. and Thomas, H.R., eds., Thomas Telford, London, 272-277.
Thomas, H.R., and Cleall, P.J., (1999) “ Inclusion o f expansive clay behaviour in coupled thermo
hydraulic mechanical models” , International Journal o f Engineering Geology, 54, 93-108.
Thomas, H.R. and Cleall, P.J., (2000) “ A validation exercise for THM modelling in unsaturated
soil” , Proc. o f European Congress on Computational Methods in Applied Sciences and
Engineering, ECCOMAS 2000, Barcelona.
Thomas, H.R., Cleall, P.J., Chandler, N., Dixon, D. and Mitchell, H.P., (2003a) “Water infiltration
into a large-scale in-situ experiment in an underground research laboratory” , Geotechnique, 53, No.
2, 207-224.
Thomas, H.R., and Ferguson, W.J., (1999) “Fully coupled heat and mass transfer model
incorporating contaminant gas transfer in an unsaturated porous medium” , Computers and
Geotechnics, 24, No. 1., 65-87.
Thomas, H.R., and He, Y., (1994) “An elasto-plastic analysis o f the thermo/hydraulic/mechanical
behaviour o f unsaturated soil” , Proceedings o f the 8th International Conference on Computer
Methods and Advances in Geomechanics, Morgantown, Siriwardane, H.J. and Zaman, M.M. eds.,
Balkema, Rotterdam, 1171-1176.
Thomas, H.R., and He, Y., (1995) “Analysis o f coupled heat, moisture and air transfer in a
deformable unsaturated soil” , Geotechnique, 45, No. 4., 677-689.
Thomas, H.R and He, Y., (1998) “Modelling the behaviour o f unsaturated soil using an elasto
plastic constitutive relationship” , Geotechnique, 48, No. 5., 589-603.
Thomas, H.R., He, Y., and Onofrei, C., (1998a) “ An examination o f the validation o f a model of
the hydro/thermo/mechanical behaviour o f engineered clay barriers” , International Journal o f
Numerical and Analytical Methods in Geomechanics, 22,49-71.
Thomas, H.R., He, Y., Ramesh, A., Zhou, Z., Villar, M.V., and Cuevas, J., (1994a) “ Heating
unsaturated clay - An experimental and numerical investigation” , Proceedings o f the 3rd
International Conference on Numerical Methods in Geotechnical Engineering, Manchester,
Numerical Methods in Geotechnical Engineering, Smith, I.M., (eds.), A.A. Balkema, Rotterdam,
181-186.
Thomas, H.R., and King, S.D., (1991) “ Coupled temperature/capillary potential variations in
unsaturated soil” , Journal o f Engineering Mechanics, American Society o f Civil Engineers, 117,
No. 11,2475-2491.
Thomas, H.R., and Li, C.L.W., (1991) “ A parallel computing solution o f coupled flow processes in
soil” , Journal o f Computing in Civil Engineering, American Society o f Civil Engineers, 5, No. 4,
428-443.

Thomas, H.R., and Rees, S.W., (1988) “The use o f Lee’s algorithm in the analysis o f some ground
heat and mass transfer problems” , Proceedings o f the (fh International Conference on Numerical
Methods in Geomechanics, Innsbruck, Austria.
Thomas, H.R., and Rees, S.W., (1990) “An examination o f the performance o f a 3-level time
stepping algorithm - Coupled heat and mass transfer computing” , Proceedings o f the Is'
International Conference, Advances in Computer Methods in Heat Transfer, Southampton, U.K.
Thomas, H.R., and Rees, S.W., (1993) “The numerical simulation o f seasonal soil drying in an
unsaturated clay soil” , International Journal o f Numerical and Analytical Methods in
Geomechanics, 17, No. 1, 119-132.
Thomas, H.R., Rees, S.W., and Sloper, N.J., (1998b) “Three-dimensional heat, moisture and air
transfer in unsaturated soils” , International Journal o f Numerical and Analytical Methods in
Geomechanics, 22, No. 2, 75-95.
Thomas, H.R., and Sansom, M.R., (1995) “A fully coupled analysis o f heat, moisture and air
transfer in unsaturated soil” , Journal o f Engineering Mechanics, American Society o f Civil
Engineering, 12, No. 3., 392-405.
Thomas, H.R., Sansom, M.R., Volckaert, G., Jacobs, P., and Kumnam, M., (1994b) “An
experimental and numerical investigation o f the hydration o f compacted powdered Boom clay” ,
Proceedings o f the 3rd International Conference on Numerical Methods in Geotechnical
Engineering, Manchester, Numerical Methods in Geotechnical Engineering, Smith, I.M., (eds.),
A.A. Balkema, Rotterdam, 135-142.
Thomas, H.R., Yang, H.T., and He, Y., (1997) “A sub-structuring based parallel solution of
coupled thermo-hydro-mechanical modelling o f unsaturated soil” . Engineering computations, 16,
No.4, 428-442.
Thomas, H.R., Yang, H.T., He, Y. and Cleall, P.J., (2003b) “A multi-level parallelised
substructuring frontal solution for coupled thermo/hydro/mechanical problems in unsaturated soil” .
International Journal fo r Numerical and Analytical Methods in Geomechanics, 27, 951-965.
Thomas, H.R., and Zhou, Z., (1995) “ A comparison o f field measured and numerically simulated
seasonal ground movement in unsaturated clay” , International Journal fo r Numerical and
Analytical Methods in Geomechanics, 19, 249-265.
Thomas, H.R., Zhou, Z., and He, Y., (1992) “ Analysis o f consolidation o f unsaturated soils” ,
Proceedings o f the 2nd Czechoslovak Conference on Numerical Methods in Geomechanics, Prague,
Dolezalova, M., eds., 1, 242-247.
Thorstenson, D., and Pollock, D.W., (1989) “ Gas transport in unsaturated zones: Multicomponent
systems and the adequacy o f Fick’s laws” , Water Resources Research, 25, No. 3., 477-507.
Truesdell, C., and Toupin, R., (1960) “Classical field theories” , Encyclopaedia o f Physics, Flugge,
S., (eds.), I I I / l , Springer-Verlag, West Berlin.
Tsang, C-F., Stephansson, O., Kautsky, F. And Jing, L., (2003) “An overview o f the
DECOVALEX Project on coupled THM processes in fractured rock-bentonite systems” ,
Proceedings from the International Conference on Coupled T-H-M-C Processes in Geo-systems,
GeoProc 2003, Stockholm, Sweden.
Tullborg, E-L., (1995) “Mineralogical and chemical data on rocks and fracture minerals from
Aspo” , SKB, Technical note 25-95-07g.
United Nations, (1992) “ United Nations Framework Convention on Climate Change”
Van der Vorst, H.A., (1989) “High performance preconditioning” , SIAM, J. Sci. Stat. Comput. 10,
No. 6, 1174-1185.
Van der Vorst, H.A., (1992) “Bi-CGSTAB: A fast and smoothly converging variant o f Bi-CG for
the solution o f non-symmetrical linear systems” , SIAM J. Sci. Stat. Comput., 13, No. 2, 631-644.
Van der Vorst, H.A., (1994) “Recent developments in Hybrid CG methods” , Lecture notes in
computer science 797, High performance computing and networking, international conference and
exhibition, Munich, Germany, April, Proceedings, Volume II: Networking and Tools. ISBN 3-540-
57981-8.
Villar, M.V., (1999) “ Investigation o f the behaviour o f bentonite by means o f suction-controlled
oedometer tests” , Engineering Geology, 54, 67-73.
Villar, M.V., Cuevas, J., and Martin, P.L., (1996) “ Effects o f heat/water flow interaction on
compacted bentonite: Preliminary results” , Engineering Geology, 41, 257-267.
Volckaert, G., Imbert, C., Thomas, H.R., and Alonso, E.E., (1996) “ Modelling and testing o f the
hydration o f clay backfilling and sealing materials” , End o f Contract Report on CEC, Contract No.
F12W-CT90-0033.
Wan, A.W.L., Gray, M.N., and Graham, J., (1995a) “On the relations o f suction, moisture content,
and soil structure in compacted clays” , Proceedings o f the I s' International Conference on
Unsaturated Soils, Paris, France, June 6-8, 1995, 215-222.
Wan, A.W.L., Gray, M.N., and Chandler, N., (1995b) “Tracking in situ moisture transients in
heated clay” , Proceedings o f the I s' International Conference on Unsaturated Soils, Paris, France,
June 6-8, 1995,925-932.
Wang, C., (1953) “ Applied Elasticity” , McGraw-Hill Book Co.
Wang, J., (2000) “ Transient and dynamic thermo/hydraulic/mechanical behaviour o f partially
saturated soil” , Ph.D thesis, University o f Wales, Cardiff, U.K.
Welsh e-Science Centre (WeSC), (2004) “The Internet Bytes Back. Grid research at the Welsh e-
Science Centre” , Annual Research Review, Cardiff University, UK.
Wheeler, S.J., and Karube, D., (1996) “Constitutive modelling” , Proceedings o f the I s'
International Conference on Unsaturated Soils, Alonso E.E., and Delage, P., (eds.), Paris,
Published by A.A. Balkema, 3, 1323-1356.
Wheeler, S.J., Sharma, R.S. and Buisson, M.S.R., (2003) “ Coupling o f hydraulic hysteresis and
stress-strain behaviour in unsaturated soil” , Geotechnique, 53, No. 1, 41-54.
Wheeler, S.J., and Sivakumar, V., (1995) “ An elasto-plastic critical state framework for
unsaturated soil” , Geotechnique, 45, No. 1., 35-53.
Whitaker, S., (1977) “ Simultaneous heat, mass and momentum transfer in porous media: A theory
o f drying” , Advances in Heat Transfer, 14, 119-203.
Wikman, H., Komfalt, K-A., Riad, L., Munier, R. and Tullborg, E-L., (1988) “Detailed
investigations o f the drillcores KAS 02, KAS 03 and KAS 04 on Aspo Island and KLX 01 at
Laxemar” , SKB, Progress report 25-88-11.
Winberg, A., Andersson, P., Poteri, A., Cvetkovic, V., Dershowitz, W., Hermanson, J., Gomez-
Hemandez, J.J., Hautojarvi, A., Billaux, D., Tullborg, E.V., Holton, D., Meier, P. and Medina, A.,
(2003) “ Final report o f the TRUE Block Scale project. 4. Synthesis o f flow, transport and retention
in the block scale” , SKB, TR-02-16.
Wood, D.M., (1990) “ Soil behaviour and critical state soil mechanics” , Cambridge University
Press, Cambridge.
Yang, D.Q., Rahardjo, H., Leong, E.C., Choa, V., (1998) “ Coupled model for heat, moisture, air
flow and deformation problems in unsaturated soils", Journal Engineering Mechanics, 124, No. 12,
1331-1338
Yong, R.N., Japp, R.D., and How, G., (1971) “ Shear strength o f partially saturated clays” ,
Proceedings o f the 4th Asian Reg. Conference on Soil Mechanics and Foundation Engineering,
Bangkok, 2, No. 12, 183-187.
Yong, R.N., and Mohamed, A.-M.O., (1996) “Evaluation o f coupled heat and moisture flow
parameters in a bentonite-sand buffer material” , Engineering Geology, 41, 269-286.
Yuen, C.K., (1997) “ Parallel programming - A critique” , Parallel communication, 23, 369-380.
Zakaria, I., (1995) “ Yielding o f unsaturated soil” , PhD thesis, University o f Sheffield, UK.
Zhou, Y., (1998) “Non-linear Thermo-Hydro-Mechanical behaviour o f saturated and unsaturated
porous media” , PhD. Thesis, University o f Manitoba, Canada.
Zhou, Y., Rajapakse, R.K.N.D., Graham, J. (1998) “Coupled heat-moisture-air transfer in
deformable unsatuxated media” , Journal o f Engineering Mechanics, 124, no. 10, 1090-1099.
Zienkiewicz, O.C., and Morgan, K., (1982) “Finite elements and approximations” , John Wiley and
Sons Ltd, USA
Zienkiewicz, O.C., and Taylor, R.L., (1989) “The finite element method” , McGraw Hill, 4th
edition.
Related Documents


![A Modified Hydro-Thermo-Diffusive Theory of Laminar ...wseas.us/e-library/conferences/2006elounda2/papers/538...modified hydro-thermo-diffusive theory of laminar flame [6]. In the](https://static.cupdf.com/doc/110x72/60c9b180d0f87f5f3a6e6359/a-modified-hydro-thermo-diffusive-theory-of-laminar-wseasuse-libraryconferences2006elounda2papers538.jpg)