AN INVESTIGATION OF THE RELATIONSHIP BETWEEN FACILITY LOCATION DECISIONS, SERVICE LEVEL AND DISTRIBUTION COSTS: A PROPOSED MODEL FOR INDONESIAN LPG SUPPLY CHAIN Ilyas Masudin ♣ University of Muhammadiyah Malang ABSTRACT This paper proposes models of Indonesian multi-echelon LPG distribution system by opening new facilities (new echelon) taking into account the current facilities and investigates the implications of the proposed models to distribution components such as transportation, inventory and shortage decisions. The objectives are to determine the optimum location and allocation of LPG facilities and investigate the relation between distribution costs such as transportation, inventory cost and location decisions in Indonesian multi-echelon LPG supply chain. Capacitated fixed-charged facility location-allocation problem is used to determine the optimal solution of the proposed model. The output of the optimal solutions reported that the costs associated to the proposed distribution are lower than the associated costs in the existing distribution system. It is noted that there is US$ 106.57 million saving per year of total cost by applying the proposed distribution system. In the sensitivity analysis, it is indicated that the trade-offs between facility locations and distribution costs are exist. Results report that as the number of facility increases, total transportation and inventory cost also increase. Keywords: Facility Location; Allocation; Inventory; Transportation. 1. INTRODUCTION In 2007, the Indonesian government initiates a program called “Zero-Kero” that aims to remove all the subsidised energy used which was kerosene and convert it into Liquefied Petroleum Gas (LPG). It means that all energy use by households, commercials, and industries needs to be converted to LPG. This conversion program was caused by the increasing trend of oil worldwide that forced the government to spend more money to subsidise the domestics use of kerosene. For example, in 2006, the government spent more than US$2.51 billion on the annual subsidy for kerosene use (Pertamina 2007). This program was estimated to reduce the amount of subsidy to US$1.7 billion annually or US$0.81 million lower than subsidising the kerosene program (Budiarto 2009). LPG supply chain in Indonesia is divided into four ♣ Corresponding Author: Industrial Engineering Department, University of Muhammadiyah Malang, Indonesia. Email: masudin@ umm.ac.id International Journal of Business and Society, Vol. 16 No. 1, 2015, 117 - 132

Welcome message from author
This document is posted to help you gain knowledge. Please leave a comment to let me know what you think about it! Share it to your friends and learn new things together.
Transcript
AN INVESTIGATION OF THE RELATIONSHIP BETWEEN FACILITY LOCATION DECISIONS, SERVICE LEVEL AND
DISTRIBUTION COSTS: A PROPOSED MODEL FOR INDONESIAN LPG SUPPLY CHAIN
Ilyas Masudin♣
University of Muhammadiyah Malang
ABSTRACT
This paper proposes models of Indonesian multi-echelon LPG distribution system by opening new facilities (new echelon) taking into account the current facilities and investigates the implications of the proposed models to distribution components such as transportation, inventory and shortage decisions. The objectives are to determine the optimum location and allocation of LPG facilities and investigate the relation between distribution costs such as transportation, inventory cost and location decisions in Indonesian multi-echelon LPG supply chain. Capacitated fixed-charged facility location-allocation problem is used to determine the optimal solution of the proposed model. The output of the optimal solutions reported that the costs associated to the proposed distribution are lower than the associated costs in the existing distribution system. It is noted that there is US$ 106.57 million saving per year of total cost by applying the proposed distribution system. In the sensitivity analysis, it is indicated that the trade-offs between facility locations and distribution costs are exist. Results report that as the number of facility increases, total transportation and inventory cost also increase.
Keywords: Facility Location; Allocation; Inventory; Transportation.
1. INTRODUCTION
In 2007, the Indonesian government initiates a program called “Zero-Kero” that aims to remove all the subsidised energy used which was kerosene and convert it into Liquefied Petroleum Gas (LPG). It means that all energy use by households, commercials, and industries needs to be converted to LPG. This conversion program was caused by the increasing trend of oil worldwide that forced the government to spend more money to subsidise the domestics use of kerosene. For example, in 2006, the government spent more than US$2.51 billion on the annual subsidy for kerosene use (Pertamina 2007). This program was estimated to reduce the amount of subsidy to US$1.7 billion annually or US$0.81 million lower than subsidising the kerosene program (Budiarto 2009). LPG supply chain in Indonesia is divided into four
♣ Corresponding Author: Industrial Engineering Department, University of Muhammadiyah Malang, Indonesia. Email: [email protected]
International Journal of Business and Society, Vol. 16 No. 1, 2015, 117 - 132
118
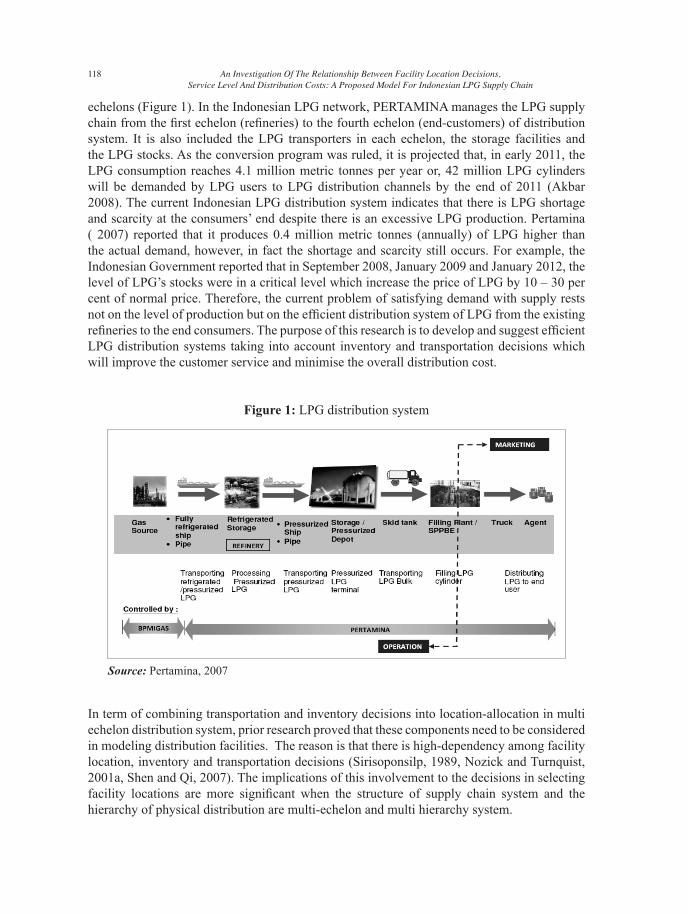
echelons (Figure 1). In the Indonesian LPG network, PERTAMINA manages the LPG supply chain from the first echelon (refineries) to the fourth echelon (end-customers) of distribution system. It is also included the LPG transporters in each echelon, the storage facilities and the LPG stocks. As the conversion program was ruled, it is projected that, in early 2011, the LPG consumption reaches 4.1 million metric tonnes per year or, 42 million LPG cylinders will be demanded by LPG users to LPG distribution channels by the end of 2011 (Akbar 2008). The current Indonesian LPG distribution system indicates that there is LPG shortage and scarcity at the consumers’ end despite there is an excessive LPG production. Pertamina ( 2007) reported that it produces 0.4 million metric tonnes (annually) of LPG higher than the actual demand, however, in fact the shortage and scarcity still occurs. For example, the Indonesian Government reported that in September 2008, January 2009 and January 2012, the level of LPG’s stocks were in a critical level which increase the price of LPG by 10 – 30 per cent of normal price. Therefore, the current problem of satisfying demand with supply rests not on the level of production but on the efficient distribution system of LPG from the existing refineries to the end consumers. The purpose of this research is to develop and suggest efficient LPG distribution systems taking into account inventory and transportation decisions which will improve the customer service and minimise the overall distribution cost.
Source: Pertamina, 2007
In term of combining transportation and inventory decisions into location-allocation in multi echelon distribution system, prior research proved that these components need to be considered in modeling distribution facilities. The reason is that there is high-dependency among facility location, inventory and transportation decisions (Sirisoponsilp, 1989, Nozick and Turnquist, 2001a, Shen and Qi, 2007). The implications of this involvement to the decisions in selecting facility locations are more significant when the structure of supply chain system and the hierarchy of physical distribution are multi-echelon and multi hierarchy system.
Figure 1: LPG distribution system
87 An Investigation Of The Relationship Between Facility Location Decisions, Service Level And Distribution Costs: A Proposed Model For Indonesian LPG Supply Chain
into account inventory and transportation decisions which will improve the customer service and minimise the overall distribution cost.
Source: Pertamina, 2007
In term of combining transportation and inventory decisions into location-allocation in multi echelon distribution system, prior research proved that these components need to be considered in modeling distribution facilities. The reason is that there is high-dependency among facility location, inventory and transportation decisions (Sirisoponsilp, 1989, Nozick and Turnquist, 2001a, Shen and Qi, 2007). The implications of this involvement to the decisions in selecting facility locations are more significant when the structure of supply chain system and the hierarchy of physical distribution are multi-echelon and multi hierarchy system. Previous researchers considered facility location problems with transportation decisions or facility location prob-lem with inventory decisions costs, however integration among them in a simultaneous multi-echelon and mul-ti-hierarchy location-allocation models have not given much attention. Melo, et al. (2009) noted that most of loca-tion-allocation problem discussed (alone or integrated) productions and inventory. Moreover, in term of the struc-tures of the echelon, it is noted that more than 80% per cent of location-allocation research dealt with single eche-lon structure (Şahin and Süral, 2007). Prior research was also generally assumed that the assignments of custom-ers clearly follow the flow of hierarchical assignment flow. In term of the application of multi-echelon facility location-allocation, it is noted that location-allocation was ap-plied in various areas such as health care system (Rahman and Smith, 2000, Okabe et al., 1997, Shen et al., 2003) and manufacturing-distribution center (Peng and Zhong, 2007, Peng, 2011). However, there is a limited research in applications of multi echelon’s location-allocation problem on LPG combining transportation and inventory decisions has been done previously. Prior LPG research has focused on efficient facility location based on trans-portation costs (Folsz et al., 1995, Van Roy, 1989). Examining the problems of current distribution system and the literature in optimization location-allocation deci-sions in logistics system leads to design an optimal distribution system considering transportation and inventory decisions. This study the objectives to model LPG’s distribution system optimally to improve the customer ser-vice by locating optimally the location of new facilities (regional warehouses and feeder filling. Then it is fol-lowed by an investigation of the impacts of inventory and transportation decision to location decision in Indonesia LPG’s distribution network.
An Investigation Of The Relationship Between Facility Location Decisions, Service Level And Distribution Costs: A Proposed Model For Indonesian LPG Supply Chain
119
Previous researchers considered facility location problems with transportation decisions or facility location problem with inventory decisions costs, however integration among them in a simultaneous multi-echelon and multi-hierarchy location-allocation models have not given much attention. Melo, et al. (2009) noted that most of location-allocation problem discussed (alone or integrated) productions and inventory. Moreover, in term of the structures of the echelon, it is noted that more than 80% per cent of location-allocation research dealt with single echelon structure (Şahin and Süral, 2007). Prior research was also generally assumed that the assignments of customers clearly follow the flow of hierarchical assignment flow.
In term of the application of multi-echelon facility location-allocation, it is noted that location-allocation was applied in various areas such as health care system (Rahman and Smith, 2000, Okabe et al., 1997, Shen et al., 2003) and manufacturing-distribution center (Peng and Zhong, 2007, Peng, 2011). However, there is a limited research in applications of multi echelon’s location-allocation problem on LPG combining transportation and inventory decisions has been done previously. Prior LPG research has focused on efficient facility location based on transportation costs (Folsz et al., 1995, Van Roy, 1989).
Examining the problems of current distribution system and the literature in optimization location-allocation decisions in logistics system leads to design an optimal distribution system considering transportation and inventory decisions. This study the objectives to model LPG’s distribution system optimally to improve the customer service by locating optimally the location of new facilities (regional warehouses and feeder filling. Then it is followed by an investigation of the impacts of inventory and transportation decision to location decision in Indonesia LPG’s distribution network.
2. LITERATURE REVIEW
2.1. Facility Location Problem: LPG Study
As described in previous sections, location-allocation problems have been previously applied in different areas, such as health care systems, manufacturing-production and public service locations. However, the literature on the application of location-allocation problems in a multi-echelon and multi-flow (multi hierarcycal distribution system) LPG distribution system, giving consideration to inventory and transportation decisions is rare. Van Roy (1989) developed the location problem for an LPG production-distribution system that considered transportation optimisation. His model was formulated as a MIP with minimisation of total transportation and fixed costs as an objective. In the study, sensitivity analysis was done by developing some alternatives in marketing strategy, fleet size and shift system. Another LPG location-allocation problem study, by Fölsz, Mészáros and Rapcsák (1995), investigated the distribution of gas cylinders for an international company. The location-allocation model developed in this study was for a single-echelon location-allocation problem and consists of two phases with different objective functions. The first phase is locating FSs and allocating LPG to sales points in order to minimise distribution costs. MIP was used to develop a fixed cost location-allocation model that considered transportation costs in the first phase. The second phase had the objective of planning the daily routes of the trucks from FSs to sales points. In this phase, a new objective was developed to maximise a utility function based on customer priority.
Ilyas Masudin
120
Sankaran and Raghaven (1997) investigated location-allocation of LPG in a study that focused on the distribution of bottling propane in South India. The objective was to locate bottling plants optimally. Two-echelon facility locations were involved in the model, which was developed in MIP. In the study, a capacitated facility location was modelled in the fixed charge problem with B&B algorithm used to solve problem. The present locational decision of an LPG facility was studied by Le Blanc, Fleuren and Krikke (2002) in terms of redesigning a reverse LPG recycling system in the Netherlands. A vehicle routing modelled in MIP was used to optimise the number of LPG depots that minimised total cost, and a sensitivity analysis was done to tackle the system uncertainty in such factors as projected costs and the periods of collection.
2.2. Facility Location Problem
Facility location model has been progressing significantly since the publication of the seminal work by Webber (1909) which analyzed the single-facility location problem to minimize total distance of travel from facilities to customers. The later crucial research from Toregas, et. al (1971) analyzed facility location numbers for the emergency facilities based on specified distance as linear programming model. Location model can be categorized into two categories, continuous and discrete model. Based on the discrete category, the location assumes to be located in certain location points within the area to minimize locational costs. The classification of discrete location model can be differentiated into covering base model, median base model and dispersion model (Daskin, 2008). In location set covering problem (LSCP), the optimal number of facilities is formulated in the objective function so that all demand can be covered by at least one facility (Toregas, et. al 1971). This model has been widely used in health systems and distribution systems (Shen, et.al, 2003, Min and Zhou, 2002, Shen, 2006). In fact that the available resources may not sufficient to site the optimum number of facilities, therefore a modification of location problem by locating known facilities in such a way the maximal demand service is achieved. This location-allocation problem is referred to as the maximal covering location problem (MCLP) (Church and ReVelle, 1974). Various applications in areas of public facilities such as emergency facility locations, fire and police station locations have been done using this model (Church and ReVelle, 1974, Mahmud and Indriasari, 2009). Some heuristics approaches used in this problem were introduced in (Berman et al., 2009) and exploiting with GIS to the coverage constraints was developed in Alexandris and Giannikos (2010). The other location-allocation model is P-Median Problem. The objective of this problem is to locate p facilities so that distance between facility and customer demand is minimized (Klose and Drexl, 2005). Prior research in public facilities mostly applied this model to allocate users to the nearest facilities (Rahman and Smith, 2000). The next location-allocation problem is Fixed Charge model which has the objective to determine the optimum facility locations so that total fixed cost of selecting facilities and variable costs are minimized (Groves et. al, 1970). A heuristics approaches used cost saving matrix in fixed charge problem was applied in Sule (1981) and the optimization fixed charge problem with transportation decisions was developed in Nozick and Turnquist (1998, 2001b). Researches in facility location problem are numerous in term of discrete models. Table 1 shows prior facility location-allocation studies which are classified into set covering, maximal covering, P-Median and fixed charge problem.
An Investigation Of The Relationship Between Facility Location Decisions, Service Level And Distribution Costs: A Proposed Model For Indonesian LPG Supply Chain
121
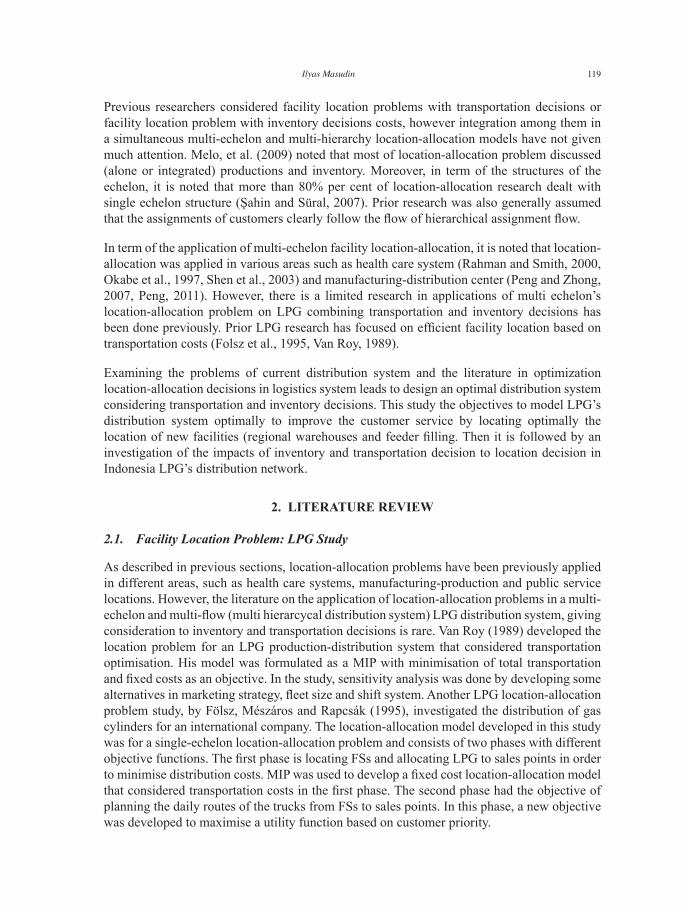
Table 1: Literature in facility location-allocation problem
Sule (1981) √ √ Hanjoul & Peeters (1987) √ √ Nozick & Turnquist (1998) √ √ Suzuki & Drezner (1996) √ √ Marianov & Serra (2001) √ √Nozick & Turnquist (2001) √ √Shen et. al (2003) √ √Murray & Gerrard (1997) √ √ Daskin (2008) √ √ Bautista & Pereira (2005) √ √ Rahman & Smith (2000) √ √ Jia, et.al. (2007) √ √ Daskin (2008) √ Mahmud & Indriasari (2009) √ √ Alexandris & Giannikos (2010) √ √ Avithatur et al (2005) √ √Shen (2006) √ √ Sourirajan et al (2007) √ √ Barahona & Jensen (1998) √ √ Barros et al (1998) √ √Romeijn et al (2007) √ √
Multi echelon
Single echelon
Pcentre
FixedChargeP-MedianMaximal
CoveringSet
CoveringAuthor(s)
2.3. Location-Allocation in Multi Echelon Distribution Network
Location-allocation model by coordinating multi echelon distribution system has the aim to coordinate the inventory and transportation decision along the distribution channels from the supply origin (plant) to the end of distribution (retailers or customers). Traditionally, solving the location-allocation problem is used to solve the simple network structure of distribution system. Most of prior researches in location- allocation problem in regards to the level of distribution system are for single level system (Şahin and Süral, 2007). A review about location-allocation in term the level of distribution found that almost 80% of location-allocation problem articles refer to single facility type (Melo et al., 2009). A model for determining distribution centers considering the Central Sales Tax (CST) has been developed (Avittathur et al., 2005). In his single level location-allocation model, the distribution centers are determined in some states to satisfy retailer demand. Considering transportation and inventory costs, the model is developed as a mixed integer programming with the objective of minimizing the total cost. Other researches model location allocation problem in term of the single layer of distribution network such as (Shen, 2006, Sourirajan et al., 2007, Marin and Pelegrin, 1998).
Currently, research considers location-allocation problem which were applied in multi echelon distribution system which has complexity in multiple distribution levels. Location allocation at distribution network of three levels which have different service level in each level has been developed (Barahona and Jensen, 1998). In these models, the mathematical model involved
Ilyas Masudin

122
both inventory and transportation costs and added the constraint of service requirement in linear programming. A research (Barros et al., 1998) designed a facility location model for recycling sand in two level problems. In his model, both regional depot and treatment facility are considered in term of fixed and transportation costs to be modeled into a mixed integer linear programming problem. Moreover, a research (Romeijn et al., 2007) studied about a two-echelon supply chain distribution network in which a supply of product is shipped from supplier to distribution centers, then distributed to retailers. His two-echelon location-allocation model represents as a set covering model by integrating transportation and inventory decisions. The policy of single source distribution centre in serving retailers is used to minimize the location and transportation costs as well as inventory costs.
In a multi echelon distribution system, providing product/service to end-customers generally consist of more than two facility types which is called k-hierarchical system. In practice, the situation where the facilities types to provide products/service and the flow of products/service are varies and need to be stated explicitly. However, the researches that study this field are not very intensive. For example, in health system, the hierarchy system in term of the types of facility in providing the health services and the flow of services in each health entities are discussed by (Fendall, 1963, Schultz, 1970, Rahman and Smith, 2000, Okabe et al., 1997) in developing countries. The system consists of health centres, hospitals and medical centres in which each of them provide a different service availability. The patient who requires a specialized health service in addition to the service available in hospital could be served by medical centre. Hospitals provide more health service than are available at health centers. Medical centers which have more health equipments for all cases may be referred for patients from hospitals or health centers. Similarly, in distribution system which consists of three type facilities such as the factories where the products are manufactured, depots where the products are stored and retailers where the products are sold to customers. In that system, due to depots have more service in term availability and capacity, customers may be referred to be served by depots directly in term of stock out in retailers. Both systems are similar in term of the number of the different type of facilities although it may be different flow of products/services in providing products/service. Narulla (1984) specified the k-hierarchical location-allocation problem based on hierarchy. On k-facility hierarchy system in term of the relationship among the type of facilities can be categorized into two types: successively inclusive and successively exclusive facility hierarchy. The facility hierarchy will be successively inclusive if type m facilities offer services of orders m (Schultz, 1970). It means, in this type, facility type 3 offers services of order 3, 2 and 1; facility type 2 offers services of order 2 and 1; facility type 1 offers service of order 1 only. The example systems in such hierarchy are health care systems discussed by Rahman and Smith (2000) and higher education system discussed by Moore and ReVelle (1982). In a successively exclusive hierarchy, facility type in m levels offers the same services of orders to all location. The production-distribution systems discussed by (Jayaraman, 1996, Van Roy, 1989, Hinojosa et al., 2000) are the example system of this hierarchy. The other example of such a hierarchy is waste-disposal systems which are discussed by Barros et. al (1998).
In hierarchical facility location-allocation problem, Mixed Integer Programming (MIP) models can be derived base on flow-based and assignment-based (path) formulation. In flow-based formulation, demand flows from one lower/higher level to the next lower/higher level
An Investigation Of The Relationship Between Facility Location Decisions, Service Level And Distribution Costs: A Proposed Model For Indonesian LPG Supply Chain
123
based on the flows of network. In assignment-based (path), the demand allocation to each level of facility based on the assignment problems (Şahin and Süral, 2007). Moreover, in term of minisum hierarchical system in which p-median and fixed charge problem are the two location-allocation models included in this system, the allocation is represented by a variable which is in network flow models and flows from one level of the hierarchy to another. However, in assignment-based (path), the allocation is represented as assigning demand to a set of facilities is from each level.
2.4. Integrated Inventory and Transportation Decisions into Location-Allocation Problem
Location-allocation modeling has the objective to determine the number of facility location and also the location geographically located as well as assigning the allocation of product/service to demand point through the network of distribution between the activated facilities to downstream facilities (Randhawa & West 1995). Recently, the issues in location problem in multi-level distribution systems which involve other aspects are increasing significantly. Site location is not the only consideration to locate facility but also involving other logistics aspects such as inventory and transportation decisions. The integration is made to approach the realistic systems and get an integrative solution rather than solving it separately. Prior research discussed the interdependence between location and inventory and transportation decisions as recommended by Sirisoponsilp (1989) that location analysis should explicitly represent both inventory and transportation decisions.
Facility location decision impact inventory decisions in the following ways. The increase number of facilities will decrease the number of safety stocks at each facility, however the number of safety stocks in the systems will also increase. Prior research about the effects of location facility on inventory decisions as discussed by Nozick and Turnquist (1998), Nozick and Turnquist (2001b). They proved that when the number of distribution centres increased, the number of safety stocks increase in a linear function. Moreover, Shen et al. (2003); Shen and Qi (2007) discussed about the high related between location problem and inventory decisions in a nonlinear integer program and found that the relationship between location problem and inventory decisions is nonlinear in which when the inventory costs goes up, the number of facility opened goes down.
Inventory decisions affect transportation decision regarding the safety stocks on transportation mode and the size of shipment that related to the lot sizing model as discussed in the previous sections. The safety stocks and the size of shipment in which to provide a given service level will effect transportation decisions in choosing carriage and the transport routing with shorter lead times. The research by Shen and Qi (2007) and Javid and Azad (2009) investigated the impacts of transportation decisions in term of routing problems and found that the increase of the weight factor of inventory cost will increase the weight factor of transportation cost.
Transportation decisions in distance travelled (transportation cost), size and frequency of shipment will affect the location decision in term of the facility establishment cost (Sirisoponsilp, 1989). Melkote and Daskin (2001) made an interesting investigation about the trade-off between transportation cost and investment budget. The transportation cost decreased as the investment budget increases, meanwhile the facility expenditure increase linearly to
Ilyas Masudin
124
the budget. The other research by Shen and Qi (2007) found the linear relationship between transportation cost and location decisions. They revealed that the increase of number of facility will increase transportation costs.
3. METHODOLOGY AND MODEL DESIGN
The research methodology of this paper is divided into stages. The first stage is developing partial model of inventory, transportation and the integration of those models into a fixed charged location-allocation model are developed and integrated into the location-allocation model. This is followed by solving the proposed distribution model, which is formulated into MIP in a cost-minimisation objective with B&B as a solving method. LINGO® optimisation software is applied to optimise the problem and find the global solution. Sensitivity analysis is conducted in the third stage to investigate how the involved components in the proposed location-allocation model contribute to the global solution, especially with different levels of customer service. The exploration of its relationship for the changes of service levels to the optimal solution is investigated in terms of demand forecasting and the adjustment of potential facilities.
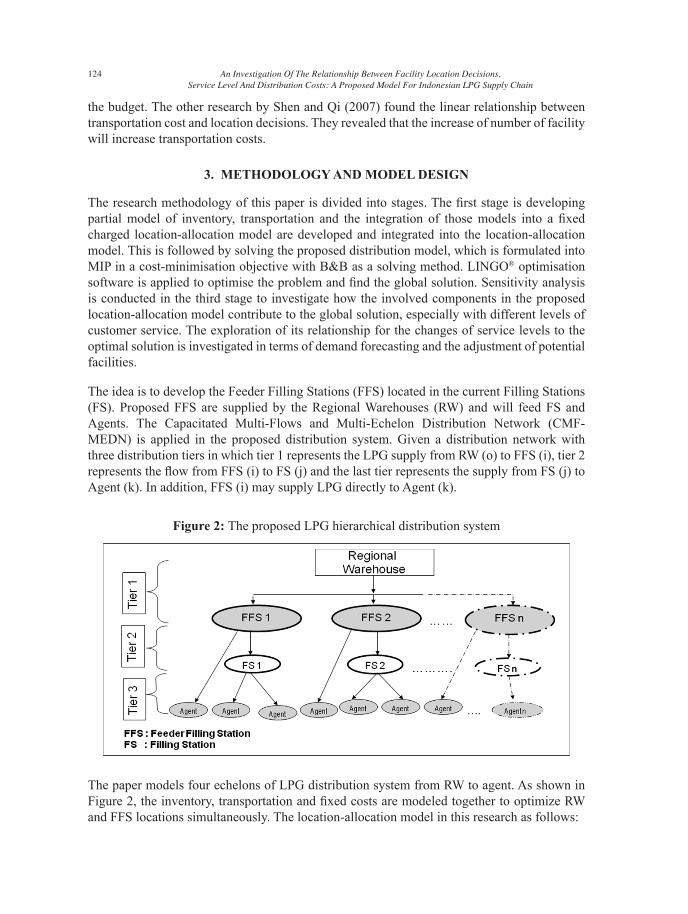
The idea is to develop the Feeder Filling Stations (FFS) located in the current Filling Stations (FS). Proposed FFS are supplied by the Regional Warehouses (RW) and will feed FS and Agents. The Capacitated Multi-Flows and Multi-Echelon Distribution Network (CMF-MEDN) is applied in the proposed distribution system. Given a distribution network with three distribution tiers in which tier 1 represents the LPG supply from RW (o) to FFS (i), tier 2 represents the flow from FFS (i) to FS (j) and the last tier represents the supply from FS (j) to Agent (k). In addition, FFS (i) may supply LPG directly to Agent (k).
Figure 2: The proposed LPG hierarchical distribution system
Ilyas Masudin 92
The paper models four echelons of LPG distribution system from RW to agent. As shown in Figure 2, the inven-tory, transportation and fixed costs are modeled together to optimize RW and FFS locations simultaneously. The location-allocation model in this research as follows:
∑∑∑ ∑∑ ∑ ∑== = = = = =
+⎟⎠
⎞⎜⎝
⎛−+++++=
i
km
i j
k
i o
m
i o
mmlmmkk XLRQHwFVFYdCXdCMinZ
11 1 1 1 1 1.
2......
∑=
⎟⎠
⎞⎜⎝
⎛−+
o
mmmm
m YLRQH1
.2
(1)
Subject to:
∑∑= =
≥J
k
I
kl DX1 1
ij∀ (2)
∑∑==
≥O
mmm
I
DY11
io∀ (3)
∑∑= =
≥B
p
I
pp DZ1 1
ip∀ (4)
∑∑= =
≤O I
mmmm WSY
1 1*
m∀ (5)
∑∑∑= = =
≤+I J
k
B
ppk VSZX
1 1 1.
pk∀ (6)
{ }1,0∈mW m∀ (7)
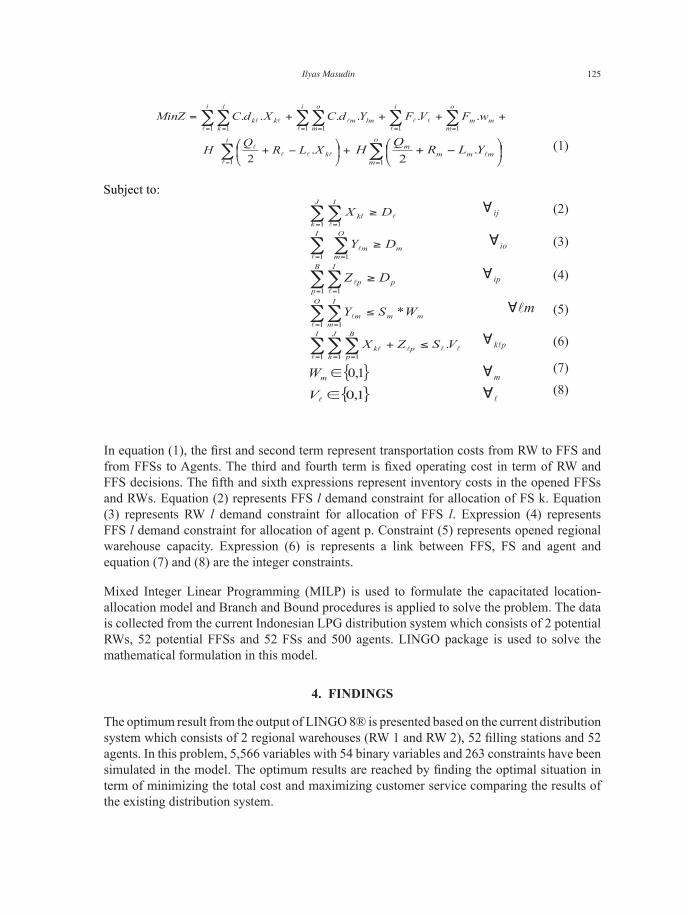
{ }1,0∈V ∀ (8) In equation (1), the first and second term represent transportation costs from RW to FFS and from FFSs to Agents. The third and fourth term is fixed operating cost in term of RW and FFS decisions. The fifth and sixth expressions represent inventory costs in the opened FFSs and RWs. Equation (2) represents FFS l demand constraint for allo-cation of FS k. Equation (3) represents RW l demand constraint for allocation of FFS l. Expression (4) represents FFS l demand constraint for allocation of agent p. Constraint (5) represents opened regional warehouse capacity. Expression (6) is represents a link between FFS, FS and agent and equation (7) and (8) are the integer constraints. Mixed Integer Linear Programming (MILP) is used to formulate the capacitated location-allocation model and Branch and Bound procedures is applied to solve the problem. The data is collected from the current Indonesian
The paper models four echelons of LPG distribution system from RW to agent. As shown in Figure 2, the inventory, transportation and fixed costs are modeled together to optimize RW and FFS locations simultaneously. The location-allocation model in this research as follows:
An Investigation Of The Relationship Between Facility Location Decisions, Service Level And Distribution Costs: A Proposed Model For Indonesian LPG Supply Chain
125
(1)
(2)
(3)
(4)
(5)
(6)
(7)
(8)
Ilyas Masudin 92
The paper models four echelons of LPG distribution system from RW to agent. As shown in Figure 2, the inven-tory, transportation and fixed costs are modeled together to optimize RW and FFS locations simultaneously. The location-allocation model in this research as follows:
∑∑∑ ∑∑ ∑ ∑== = = = = =
+⎟⎠
⎞⎜⎝
⎛−+++++=
i
km
i j
k
i o
m
i o
mmlmmkk XLRQHwFVFYdCXdCMinZ
11 1 1 1 1 1.
2......
∑=
⎟⎠
⎞⎜⎝
⎛−+
o
mmmm
m YLRQH1
.2
(1)
Subject to:
∑∑= =
≥J
k
I
kl DX1 1
ij∀ (2)
∑∑==
≥O
mmm
I
DY11
io∀ (3)
∑∑= =
≥B
p
I
pp DZ1 1
ip∀ (4)
∑∑= =
≤O I
mmmm WSY
1 1*
m∀ (5)
∑∑∑= = =
≤+I J
k
B
ppk VSZX
1 1 1.
pk∀ (6)
{ }1,0∈mW m∀ (7)
{ }1,0∈V ∀ (8) In equation (1), the first and second term represent transportation costs from RW to FFS and from FFSs to Agents. The third and fourth term is fixed operating cost in term of RW and FFS decisions. The fifth and sixth expressions represent inventory costs in the opened FFSs and RWs. Equation (2) represents FFS l demand constraint for allo-cation of FS k. Equation (3) represents RW l demand constraint for allocation of FFS l. Expression (4) represents FFS l demand constraint for allocation of agent p. Constraint (5) represents opened regional warehouse capacity. Expression (6) is represents a link between FFS, FS and agent and equation (7) and (8) are the integer constraints. Mixed Integer Linear Programming (MILP) is used to formulate the capacitated location-allocation model and Branch and Bound procedures is applied to solve the problem. The data is collected from the current Indonesian
In equation (1), the first and second term represent transportation costs from RW to FFS and from FFSs to Agents. The third and fourth term is fixed operating cost in term of RW and FFS decisions. The fifth and sixth expressions represent inventory costs in the opened FFSs and RWs. Equation (2) represents FFS l demand constraint for allocation of FS k. Equation (3) represents RW l demand constraint for allocation of FFS l. Expression (4) represents FFS l demand constraint for allocation of agent p. Constraint (5) represents opened regional warehouse capacity. Expression (6) is represents a link between FFS, FS and agent and equation (7) and (8) are the integer constraints.
Mixed Integer Linear Programming (MILP) is used to formulate the capacitated location-allocation model and Branch and Bound procedures is applied to solve the problem. The data is collected from the current Indonesian LPG distribution system which consists of 2 potential RWs, 52 potential FFSs and 52 FSs and 500 agents. LINGO package is used to solve the mathematical formulation in this model.
4. FINDINGS
The optimum result from the output of LINGO 8® is presented based on the current distribution system which consists of 2 regional warehouses (RW 1 and RW 2), 52 filling stations and 52 agents. In this problem, 5,566 variables with 54 binary variables and 263 constraints have been simulated in the model. The optimum results are reached by finding the optimal situation in term of minimizing the total cost and maximizing customer service comparing the results of the existing distribution system.
Ilyas Masudin
126
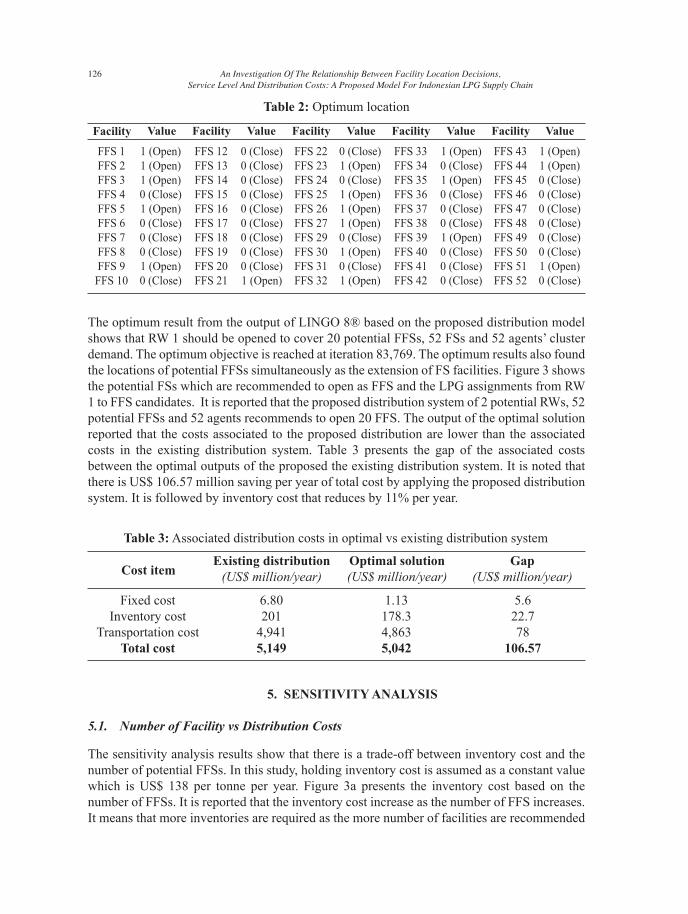
The optimum result from the output of LINGO 8® based on the proposed distribution model shows that RW 1 should be opened to cover 20 potential FFSs, 52 FSs and 52 agents’ cluster demand. The optimum objective is reached at iteration 83,769. The optimum results also found the locations of potential FFSs simultaneously as the extension of FS facilities. Figure 3 shows the potential FSs which are recommended to open as FFS and the LPG assignments from RW 1 to FFS candidates. It is reported that the proposed distribution system of 2 potential RWs, 52 potential FFSs and 52 agents recommends to open 20 FFS. The output of the optimal solution reported that the costs associated to the proposed distribution are lower than the associated costs in the existing distribution system. Table 3 presents the gap of the associated costs between the optimal outputs of the proposed the existing distribution system. It is noted that there is US$ 106.57 million saving per year of total cost by applying the proposed distribution system. It is followed by inventory cost that reduces by 11% per year.
Table 2: Optimum location
Table 3: Associated distribution costs in optimal vs existing distribution system
Gap(US$ million/year)
Optimal solution(US$ million/year)
Existing distribution(US$ million/year)Cost item
Fixed cost 6.80 1.13 5.6 Inventory cost 201 178.3 22.7 Transportation cost 4,941 4,863 78 Total cost 5,149 5,042 106.57
5. SENSITIVITY ANALYSIS
5.1. Number of Facility vs Distribution Costs
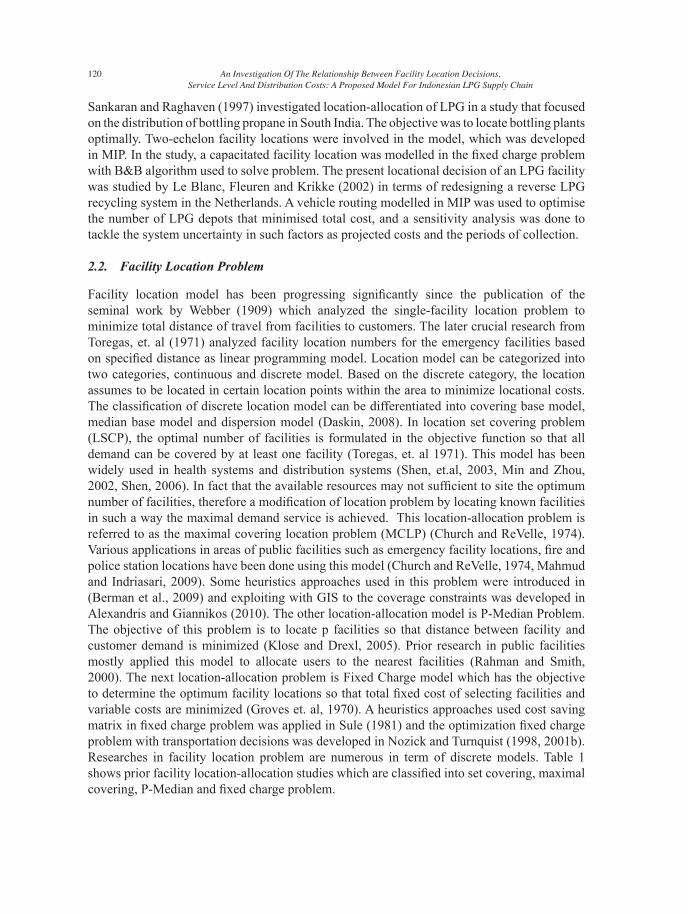
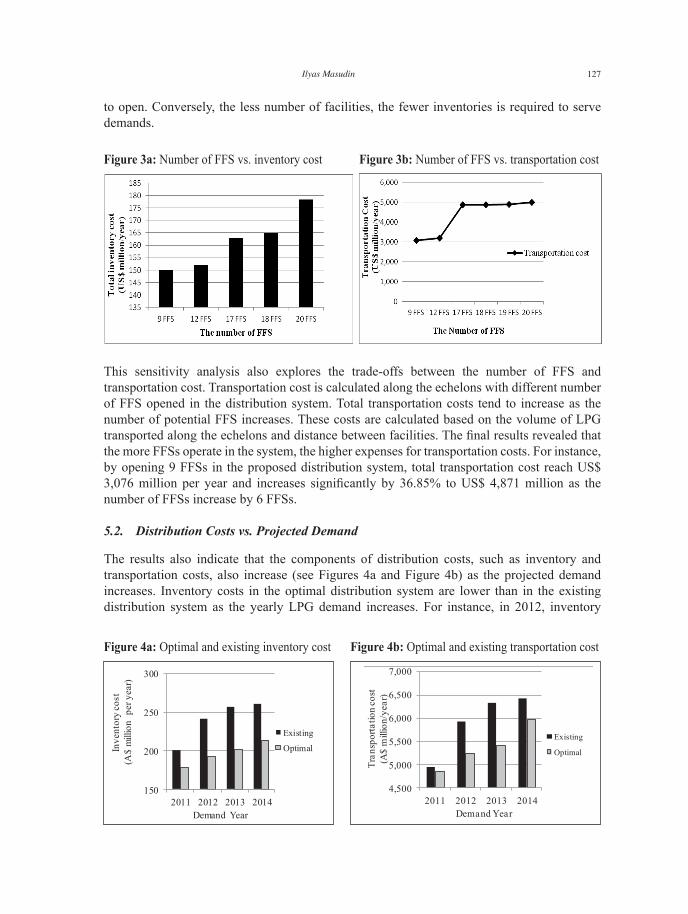
The sensitivity analysis results show that there is a trade-off between inventory cost and the number of potential FFSs. In this study, holding inventory cost is assumed as a constant value which is US$ 138 per tonne per year. Figure 3a presents the inventory cost based on the number of FFSs. It is reported that the inventory cost increase as the number of FFS increases. It means that more inventories are required as the more number of facilities are recommended
FFS 1 1 (Open) FFS 12 0 (Close) FFS 22 0 (Close) FFS 33 1 (Open) FFS 43 1 (Open) FFS 2 1 (Open) FFS 13 0 (Close) FFS 23 1 (Open) FFS 34 0 (Close) FFS 44 1 (Open) FFS 3 1 (Open) FFS 14 0 (Close) FFS 24 0 (Close) FFS 35 1 (Open) FFS 45 0 (Close) FFS 4 0 (Close) FFS 15 0 (Close) FFS 25 1 (Open) FFS 36 0 (Close) FFS 46 0 (Close) FFS 5 1 (Open) FFS 16 0 (Close) FFS 26 1 (Open) FFS 37 0 (Close) FFS 47 0 (Close) FFS 6 0 (Close) FFS 17 0 (Close) FFS 27 1 (Open) FFS 38 0 (Close) FFS 48 0 (Close) FFS 7 0 (Close) FFS 18 0 (Close) FFS 29 0 (Close) FFS 39 1 (Open) FFS 49 0 (Close) FFS 8 0 (Close) FFS 19 0 (Close) FFS 30 1 (Open) FFS 40 0 (Close) FFS 50 0 (Close) FFS 9 1 (Open) FFS 20 0 (Close) FFS 31 0 (Close) FFS 41 0 (Close) FFS 51 1 (Open) FFS 10 0 (Close) FFS 21 1 (Open) FFS 32 1 (Open) FFS 42 0 (Close) FFS 52 0 (Close)
Facility Value Facility Value Value Value ValueFacility Facility Facility
An Investigation Of The Relationship Between Facility Location Decisions, Service Level And Distribution Costs: A Proposed Model For Indonesian LPG Supply Chain
127
to open. Conversely, the less number of facilities, the fewer inventories is required to serve demands.
Ilyas Masudin 94
recommended to open. Conversely, the less number of facilities, the fewer inventories is required to serve de-mands.
This sensitivity analysis also explores the trade-offs between the number of FFS and transportation cost. Trans-portation cost is calculated along the echelons with different number of FFS opened in the distribution system. Total transportation costs tend to increase as the number of potential FFS increases. These costs are calculated based on the volume of LPG transported along the echelons and distance between facilities. The final results re-vealed that the more FFSs operate in the system, the higher expenses for transportation costs. For instance, by opening 9 FFSs in the proposed distribution system, total transportation cost reach US$ 3,076 million per year and increases significantly by 36.85% to US$ 4,871 million as the number of FFSs increase by 6 FFSs. 5.2. Distribution Costs vs. Projected Demand The results also indicate that the components of distribution costs, such as inventory and transportation costs, also increase (see Figures 4a and Figure 4b) as the projected demand increases. Inventory costs in the optimal distribu-tion system are lower than in the existing distribution system as the yearly LPG demand increases. For instance, in 2012, inventory costs increase by 7.9% in the optimal distribution system or 12.1% lower than the existing distri-bution system. In 2013, the difference in inventory costs between the optimal and existing distribution system el-evates by 13%, peaking at 18% per year in 2014.
4,500
5,000
5,500
6,000
6,500
7,000
2011 2012 2013 2014
Tran
spor
tatio
n co
st(A
$ m
illio
n/ye
ar)
Demand Year
Existing
Optimal
150
200
250
300
2011 2012 2013 2014
Inve
ntor
y co
st
(A$
mill
ion
per y
ear)
Demand Year
Existing
Optimal
This sensitivity analysis also explores the trade-offs between the number of FFS and transportation cost. Transportation cost is calculated along the echelons with different number of FFS opened in the distribution system. Total transportation costs tend to increase as the number of potential FFS increases. These costs are calculated based on the volume of LPG transported along the echelons and distance between facilities. The final results revealed that the more FFSs operate in the system, the higher expenses for transportation costs. For instance, by opening 9 FFSs in the proposed distribution system, total transportation cost reach US$ 3,076 million per year and increases significantly by 36.85% to US$ 4,871 million as the number of FFSs increase by 6 FFSs.
5.2. Distribution Costs vs. Projected Demand
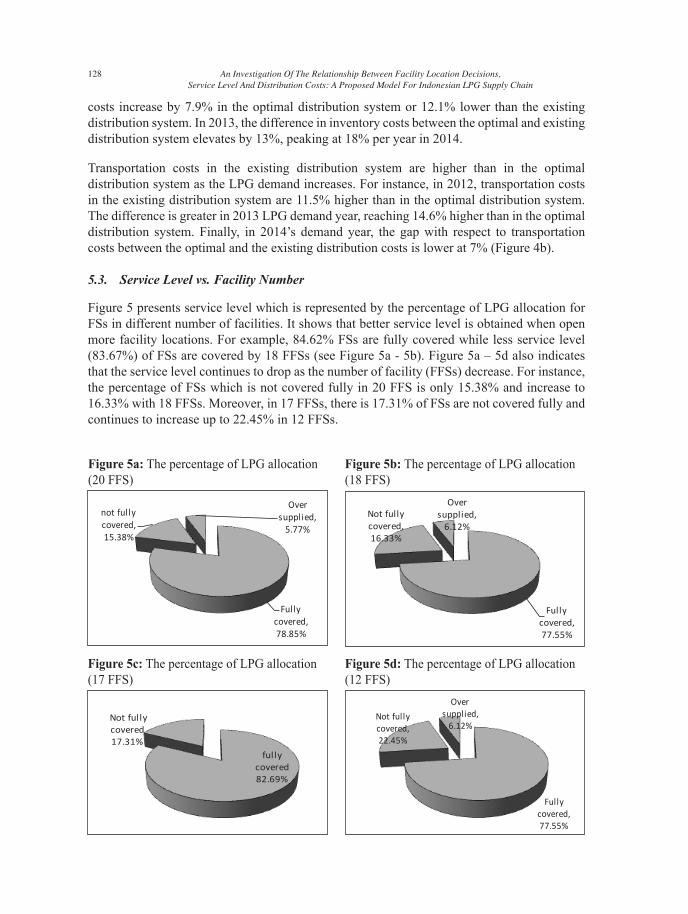
The results also indicate that the components of distribution costs, such as inventory and transportation costs, also increase (see Figures 4a and Figure 4b) as the projected demand increases. Inventory costs in the optimal distribution system are lower than in the existing distribution system as the yearly LPG demand increases. For instance, in 2012, inventory
Figure 3b: Number of FFS vs. transportation costFigure 3a: Number of FFS vs. inventory cost
Figure 4b: Optimal and existing transportation costFigure 4a: Optimal and existing inventory cost
Ilyas Masudin 94
recommended to open. Conversely, the less number of facilities, the fewer inventories is required to serve de-mands.
This sensitivity analysis also explores the trade-offs between the number of FFS and transportation cost. Trans-portation cost is calculated along the echelons with different number of FFS opened in the distribution system. Total transportation costs tend to increase as the number of potential FFS increases. These costs are calculated based on the volume of LPG transported along the echelons and distance between facilities. The final results re-vealed that the more FFSs operate in the system, the higher expenses for transportation costs. For instance, by opening 9 FFSs in the proposed distribution system, total transportation cost reach US$ 3,076 million per year and increases significantly by 36.85% to US$ 4,871 million as the number of FFSs increase by 6 FFSs. 5.2. Distribution Costs vs. Projected Demand The results also indicate that the components of distribution costs, such as inventory and transportation costs, also increase (see Figures 4a and Figure 4b) as the projected demand increases. Inventory costs in the optimal distribu-tion system are lower than in the existing distribution system as the yearly LPG demand increases. For instance, in 2012, inventory costs increase by 7.9% in the optimal distribution system or 12.1% lower than the existing distri-bution system. In 2013, the difference in inventory costs between the optimal and existing distribution system el-evates by 13%, peaking at 18% per year in 2014.
4,500
5,000
5,500
6,000
6,500
7,000
2011 2012 2013 2014
Tran
spor
tatio
n co
st(A
$ m
illio
n/ye
ar)
Demand Year
Existing
Optimal
150
200
250
300
2011 2012 2013 2014
Inve
ntor
y co
st
(A$
mill
ion
per y
ear)
Demand Year
Existing
Optimal
Ilyas Masudin
128
95 An Investigation of the Relationship between Facility Location Decisions, Service Level and Distribution Costs: A Proposed Model for Indonesian LPG Supply Chain
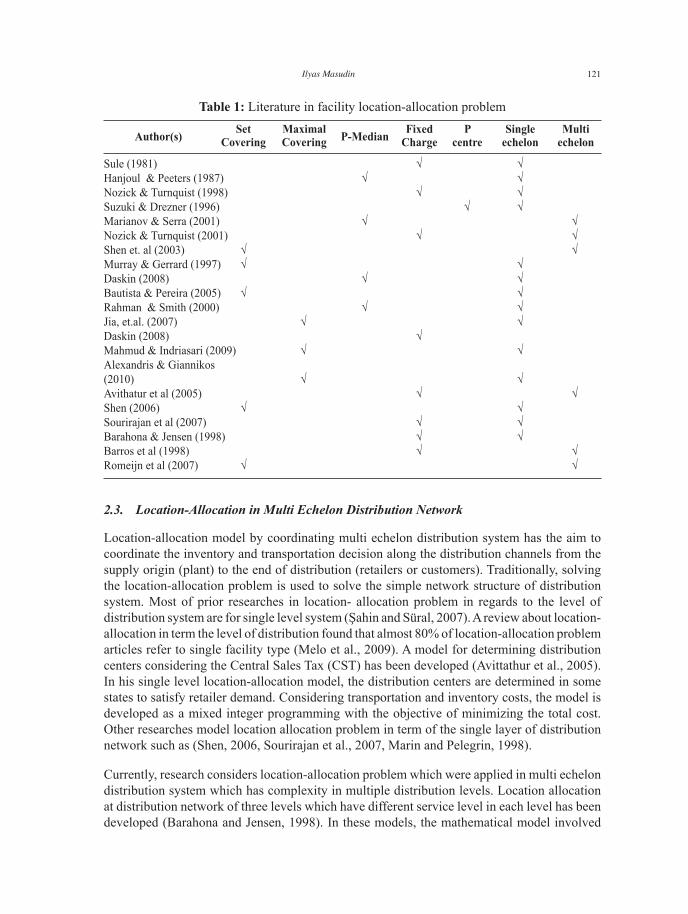
Transportation costs in the existing distribution system are higher than in the optimal distribution system as the LPG demand increases. For instance, in 2012, transportation costs in the existing distribution system are 11.5% higher than in the optimal distribution system. The difference is greater in 2013 LPG demand year, reaching 14.6% higher than in the optimal distribution system. Finally, in 2014’s demand year, the gap with respect to transportation costs between the optimal and the existing distribution costs is lower at 7% (Figure 4b). 5.3. Service Level vs. Facility Number Figure 5 presents service level which is represented by the percentage of LPG allocation for FSs in different number of facilities. It shows that better service level is obtained when open more facility locations. For example, 84.62% FSs are fully covered while less service level (83.67%) of FSs are covered by 18 FFSs (see Figure 5a - 5b). Figure 5a – 5d also indicates that the service level continues to drop as the number of facility (FFSs) de-crease. For instance, the percentage of FSs which is not covered fully in 20 FFS is only 15.38% and increase to 16.33% with 18 FFSs. Moreover, in 17 FFSs, there is 17.31% of FSs are not covered fully and continues to in-crease up to 22.45% in 12 FFSs.
6. CONCLUSION
In this paper, we develop the proposed distribution systems with direct and indirect LPG supplies from FFS can-didates to FSs and agents. Inventory and transportation models are developed addressing four echelons and multi flows distribution system. A capacitated four-echelon location-allocation model that integrates fixed costs, inven-
Fully covered,77.55%
Not fully covered,16.33%
Over supplied,6.12%
Fully covered,78.85%
not fully covered,15.38%
Over supplied,5.77%
Fully covered,77.55%
Not fully covered,22.45%
Over supplied,6.12%
fully covered82.69%
Not fully covered17.31%
costs increase by 7.9% in the optimal distribution system or 12.1% lower than the existing distribution system. In 2013, the difference in inventory costs between the optimal and existing distribution system elevates by 13%, peaking at 18% per year in 2014.
Transportation costs in the existing distribution system are higher than in the optimal distribution system as the LPG demand increases. For instance, in 2012, transportation costs in the existing distribution system are 11.5% higher than in the optimal distribution system. The difference is greater in 2013 LPG demand year, reaching 14.6% higher than in the optimal distribution system. Finally, in 2014’s demand year, the gap with respect to transportation costs between the optimal and the existing distribution costs is lower at 7% (Figure 4b).
5.3. Service Level vs. Facility Number
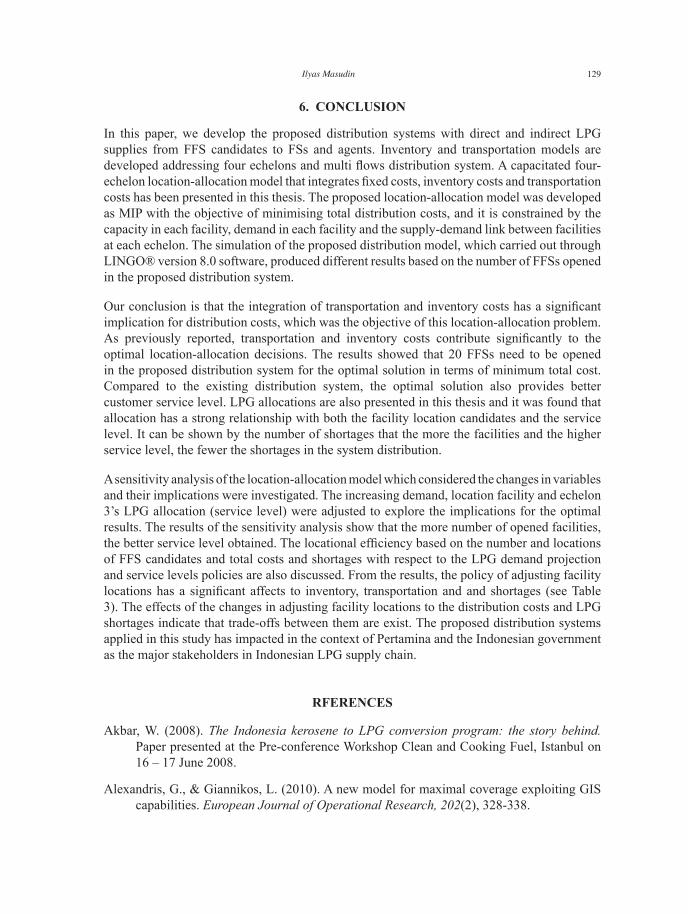
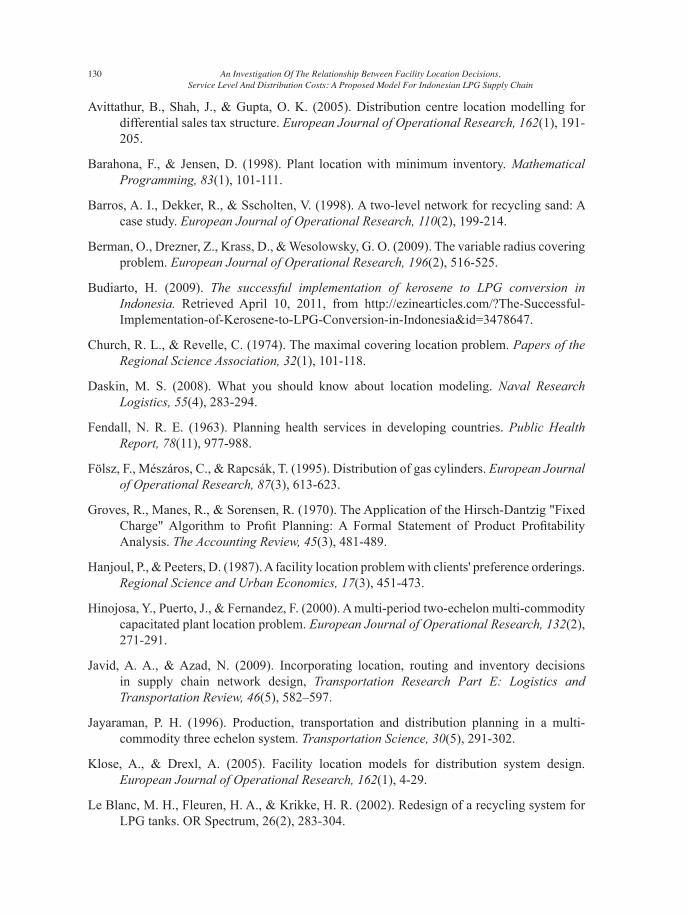
Figure 5 presents service level which is represented by the percentage of LPG allocation for FSs in different number of facilities. It shows that better service level is obtained when open more facility locations. For example, 84.62% FSs are fully covered while less service level (83.67%) of FSs are covered by 18 FFSs (see Figure 5a - 5b). Figure 5a – 5d also indicates that the service level continues to drop as the number of facility (FFSs) decrease. For instance, the percentage of FSs which is not covered fully in 20 FFS is only 15.38% and increase to 16.33% with 18 FFSs. Moreover, in 17 FFSs, there is 17.31% of FSs are not covered fully and continues to increase up to 22.45% in 12 FFSs.
Figure 5b: The percentage of LPG allocation (18 FFS)
Figure 5a: The percentage of LPG allocation (20 FFS)
Figure 5d: The percentage of LPG allocation (12 FFS)
Figure 5c: The percentage of LPG allocation (17 FFS)
An Investigation Of The Relationship Between Facility Location Decisions, Service Level And Distribution Costs: A Proposed Model For Indonesian LPG Supply Chain
129
6. CONCLUSION
In this paper, we develop the proposed distribution systems with direct and indirect LPG supplies from FFS candidates to FSs and agents. Inventory and transportation models are developed addressing four echelons and multi flows distribution system. A capacitated four-echelon location-allocation model that integrates fixed costs, inventory costs and transportation costs has been presented in this thesis. The proposed location-allocation model was developed as MIP with the objective of minimising total distribution costs, and it is constrained by the capacity in each facility, demand in each facility and the supply-demand link between facilities at each echelon. The simulation of the proposed distribution model, which carried out through LINGO® version 8.0 software, produced different results based on the number of FFSs opened in the proposed distribution system.
Our conclusion is that the integration of transportation and inventory costs has a significant implication for distribution costs, which was the objective of this location-allocation problem. As previously reported, transportation and inventory costs contribute significantly to the optimal location-allocation decisions. The results showed that 20 FFSs need to be opened in the proposed distribution system for the optimal solution in terms of minimum total cost. Compared to the existing distribution system, the optimal solution also provides better customer service level. LPG allocations are also presented in this thesis and it was found that allocation has a strong relationship with both the facility location candidates and the service level. It can be shown by the number of shortages that the more the facilities and the higher service level, the fewer the shortages in the system distribution.
A sensitivity analysis of the location-allocation model which considered the changes in variables and their implications were investigated. The increasing demand, location facility and echelon 3’s LPG allocation (service level) were adjusted to explore the implications for the optimal results. The results of the sensitivity analysis show that the more number of opened facilities, the better service level obtained. The locational efficiency based on the number and locations of FFS candidates and total costs and shortages with respect to the LPG demand projection and service levels policies are also discussed. From the results, the policy of adjusting facility locations has a significant affects to inventory, transportation and and shortages (see Table 3). The effects of the changes in adjusting facility locations to the distribution costs and LPG shortages indicate that trade-offs between them are exist. The proposed distribution systems applied in this study has impacted in the context of Pertamina and the Indonesian government as the major stakeholders in Indonesian LPG supply chain.
RFERENCES
Akbar, W. (2008). The Indonesia kerosene to LPG conversion program: the story behind. Paper presented at the Pre-conference Workshop Clean and Cooking Fuel, Istanbul on 16 – 17 June 2008.
Alexandris, G., & Giannikos, L. (2010). A new model for maximal coverage exploiting GIS capabilities. European Journal of Operational Research, 202(2), 328-338.
Ilyas Masudin
130
Avittathur, B., Shah, J., & Gupta, O. K. (2005). Distribution centre location modelling for differential sales tax structure. European Journal of Operational Research, 162(1), 191-205.
Barahona, F., & Jensen, D. (1998). Plant location with minimum inventory. Mathematical Programming, 83(1), 101-111.
Barros, A. I., Dekker, R., & Sscholten, V. (1998). A two-level network for recycling sand: A case study. European Journal of Operational Research, 110(2), 199-214.
Berman, O., Drezner, Z., Krass, D., & Wesolowsky, G. O. (2009). The variable radius covering problem. European Journal of Operational Research, 196(2), 516-525.
Budiarto, H. (2009). The successful implementation of kerosene to LPG conversion in Indonesia. Retrieved April 10, 2011, from http://ezinearticles.com/?The-Successful-Implementation-of-Kerosene-to-LPG-Conversion-in-Indonesia&id=3478647.
Church, R. L., & Revelle, C. (1974). The maximal covering location problem. Papers of the Regional Science Association, 32(1), 101-118.
Daskin, M. S. (2008). What you should know about location modeling. Naval Research Logistics, 55(4), 283-294.
Fendall, N. R. E. (1963). Planning health services in developing countries. Public Health Report, 78(11), 977-988.
Fölsz, F., Mészáros, C., & Rapcsák, T. (1995). Distribution of gas cylinders. European Journal of Operational Research, 87(3), 613-623.
Groves, R., Manes, R., & Sorensen, R. (1970). The Application of the Hirsch-Dantzig "Fixed Charge" Algorithm to Profit Planning: A Formal Statement of Product Profitability Analysis. The Accounting Review, 45(3), 481-489.
Hanjoul, P., & Peeters, D. (1987). A facility location problem with clients' preference orderings. Regional Science and Urban Economics, 17(3), 451-473.
Hinojosa, Y., Puerto, J., & Fernandez, F. (2000). A multi-period two-echelon multi-commodity capacitated plant location problem. European Journal of Operational Research, 132(2), 271-291.
Javid, A. A., & Azad, N. (2009). Incorporating location, routing and inventory decisions in supply chain network design, Transportation Research Part E: Logistics and Transportation Review, 46(5), 582–597.
Jayaraman, P. H. (1996). Production, transportation and distribution planning in a multi-commodity three echelon system. Transportation Science, 30(5), 291-302.
Klose, A., & Drexl, A. (2005). Facility location models for distribution system design. European Journal of Operational Research, 162(1), 4-29.
Le Blanc, M. H., Fleuren, H. A., & Krikke, H. R. (2002). Redesign of a recycling system for LPG tanks. OR Spectrum, 26(2), 283-304.
An Investigation Of The Relationship Between Facility Location Decisions, Service Level And Distribution Costs: A Proposed Model For Indonesian LPG Supply Chain

131
Mahmud, A., & Indriasari, V. (2009). Facility location models development to maximize total service area. Theoritical and Empirical Researches in Urban Management, 4(1S), 87-100.
Marianov, V., & Serra, D. (2001). Hierarchical location-allocation models for congested systems. European Journal of Operational Research, 135(1), 195-208.
Marin, A., & Pelegrin, B. (1998). The return plant location problem: Modelling and resolution. European Journal of Operational Research, 104(2), 375-392.
Melkote, S., & Daskin, M. S. (2001). An integrated model of facility location and transportation network design. Transportation Research Part A: Policy and Practice, 35(6), 515-538.
Melo, M. T., Nickel, S., & Saldanha-Da-Gama, F. (2009). Facility location and supply chain management - A review. European Journal of Operational Research, 196(2), 401-412.
Min, H., & Zhou, G. (2002). Supply chain modeling: past, present and future. Computers & Industrial Engineering, 43(1-2), 231-249.
Moore, G., & Revelle, C. S. (1982). The hierarchical service location problem. Management Science, 28(7), 775-780.
Murray, A. T., & Gerrard, R.. A. (1997). Capacitated service and regional constraints in location-allocation modeling. Location Science, 5(2), 103–118.
Narulla, S. C. (1984). Hierarchical location-allocation problems: a classification scheme. European Journal of Operational Research, 15(1), 93-99.
Nozick, L. K., & Turnquist, M. A. (1998). Integrating inventory impacts into a fixed-charge model for locating distribution centers. Transportation Research Part E: Logistics and Transportation Review, 34(3), 173-186.
Nozick, L. K., & Turnquist, M. A. (2001a). Inventory, transportation, service quality and the location of distribution centers. European Journal of Operational Research, 129(2), 362-371.
Nozick, L. K., & Turnquist, M. A. (2001b). A two-echelon inventory allocation and distribution center location analysis. Transportation Research Part E: Logistics and Transportation Review, 37(6), 425-441.
Okabe, A., Okunuki, K.-I., & Suzuki, T. (1997). A computational method for optimizing the hierarchy and spatial configuration of successively inclusive facilities on a continuous plane. Location Science, 5(4), 255-268.
Peng, Z. Y. (2011). Multi-node distribution centre location model under manufacturing and remanufacturing system. Applied Mechanics and Materials, 39(2011), 140-145.
Peng, Z. Y., & Zhong, D. Y. (2007). Optimization Model for Closed-loop Logistics Network Design in Manufacturing and Remanufacturing System. Paper presented at the Service Systems and Service Management, 2007 International Conference on 9 – 11 June 2007. 1 - 4.
Ilyas Masudin

132
Pertamina. (2007). Annual report 2007. Jakarta.
Rahman, S., & Smith, D. K. (2000). Use of location-allocation models in health service development planning in developing nations. European Journal of Operational Research, 123(3), 437-452.
Randhawa, U. S., & West, M. T. (1995). An integrated approach to facility location problem. Computer and Industrial Engineering, 22(1), 261–265.
Romeijn, H. E., Shu, J. & Teo, C.-P. (2007). Designing two-echelon supply networks. European Journal of Operational Research, 178(2), 449-462.
Şahin, G., & Süral, H. (2007). A review of hierarchical facility location models. Computers & Operations Research, 34(3), 2310-2331.
Sankaran, J. K., & Raghavan, N. R. S. (1997). Locating and sizing plants for bottling propane in South India. Interfaces, 27(6), 1–15.
Schultz, G. P. (1970). The logic of health care facility planning. Socio-Economic Planning Sciences, 4(3), 383-393.
Shen, Z. J. (2006). A profit-maximizing supply chain network design model with demand choice flexibility. Operations Research Letters, 34(6), 673-682.
Shen, Z. J., & Qi, L. (2007). Incorporating inventory and routing costs in strategic location models. European Journal of Operational Research, 179(2), 372-389.
Shen, Z. J., Coullard, C., & Daskin, M. S. (2003). Joint location-inventory model. Transportation Science, 37(1), 40-55.
Sirisoponsilp, S. (1989). Warehouse location under multiple transportation options. Doctor of Philosopy Dissertation, University of Maryland.
Sourirajan, K., Ozsen, L., & Uzsoy, R. (2007). A single product network design model with lead time and safety stock considerations. IIE Transactions, 39(5), 411-424.
Sule, D. R. (1981). Simple methods for uncapacitated facility location/allocation problems. Journal of Operations Management, 1(4), 215-223.
Suzuki, A., & Drezner, Z. (1996). The p-centre location problem in an area. Journal of Location Science, 4(1), 69-82.
Toregas, C., Swain, R., Revelle, C., & Bergman, L. (1971). The location of emergency service facilities. Operation Research, 19(6), 1363-1373.
Van Roy, T. (1989). Multi-level production and distribution planning with transportation fleet optimization. Management Science, 35(12), 1443-14453.
Webber, A. (1909). Uber den standort der industrien, tubingen (translated by CJ, Friedrich as Theory of the location of industries). Chicago, IL: University of Chicago Press.
An Investigation Of The Relationship Between Facility Location Decisions, Service Level And Distribution Costs: A Proposed Model For Indonesian LPG Supply Chain
Related Documents