AN INVESTIGATION OF THE ELECTROWINNING OF COPPER WITH DIMENSIONALLY STABLE TITANIUM ANODES AND CONVENTIONAL LEAD ALLOY ANODES Zvanaka Senzeni Msindo A Dissertation submitted to the Faculty of Engineering and the Built Environment, University of the Witwatersrand, in fulfilment of the requirements of the degree of Master of Science in Engineering February 2010

Welcome message from author
This document is posted to help you gain knowledge. Please leave a comment to let me know what you think about it! Share it to your friends and learn new things together.
Transcript

AN INVESTIGATION OF THE ELECTROWINNING OF COPPER WITH
DIMENSIONALLY STABLE TITANIUM ANODES AND
CONVENTIONAL LEAD ALLOY ANODES
Zvanaka Senzeni Msindo
A Dissertation submitted to the Faculty of Engineering and the Built Environment,
University of the Witwatersrand, in fulfilment of the requirements of the degree of
Master of Science in Engineering
February 2010

ii
DECLARATION “I hereby declare that the thesis submitted for the degree MSc: Chemical Engineering, at
the University of the Witwatersrand is my own work and has not previously been
submitted to any other institution of higher education. I further declare that all sources
cited are indicated and acknowledged by means of a comprehensive list of references”.
Z.S. Msindo Copyright © University of the Witwatersrand 2009

iii
Dedicated to:
The Almighty: Thank you Lord for seeing me through. Without your help and guidance, I would not have made it this far.
My loving husband, Mordecai Mazhandu: Thank you for all the
encouragement and support.
My daughter, Sasha: Thank you for being an inspiration.

iv
ACKNOWLEDGEMENTS I wish to express immeasurable gratitude to:
My supervisors: Prof. Potgieter and Dr Sibanda for their positive attitude and guidance.
Your powerful contributions and constructive criticisms assisted me enormously in
shaping this project. Without your persistent help this dissertation would not have been
possible.
Anglo Platinum and the University of the Witwatersrand, for the financial assistance.
Bronwynne Ferreira, for availing her time and resources which assisted me in producing
this piece of work.
Dr Marjanovic, for all the help she provided in ICP analysis of my samples.
Germaine Ntunka, for all the information he provided in the early stages of the project.
Evans Musapatika and Davison Nyabadza, for all the assistance offered on the use of
AAS and XRD machines.

v
ABSTRACT
The traditional anodes of choice in the electrowinning industry have been lead based
anodes. However, these anodes display high energy consumption and low corrosion
resistance during operation. These problems led to the investigation of other anode
materials such as dimensionally stable anodes (DSAs), consisting of mixed metal oxide
coatings on titanium or nickel substrates. In this study, electrochemical tests, physical
characterisation techniques and electrowinning of copper from synthetic and industrial
electrolytes were carried out on DSAs and lead anodes. These tests focused on stability,
energy consumption and copper deposit quality. Potentiodynamic polarisation showed
that the DSA plate anode exhibited the highest corrosion resistance while, lead and DSA
mesh anodes showed spontaneous passivation in a synthetic solution. These anodes are
therefore likely to succumb to failure earlier than the DSA plate anode. Lead anode
dissolution was observed in galvanostatic chronopotentiometry tests. It was also observed
that the failure mechanism of DSA anodes involves coating loss.
In electrowinning tests, copper deposits from the lead anode cell showed the presence of
lead oxide. Furthermore, it was observed that, despite both mesh anodes (DSA 1 and
DSA 2) exhibiting the lowest total energy consumption, they had the highest energy
consumption per kilogramme of copper produced. The DSA 1 plate anode had the
greatest current efficiency and therefore had the least energy consumption per
kilogramme of copper. It was also noted that DSA anodes of the same composition may
exhibit different behaviours as this depends on the method of preparation of the anode
itself. The presence of iron or manganese in the electrolyte affected cathode quality,
current efficiency, led to voltage fluctuations and an increase in anode potentials.

vi
GLOSSARY
Active - electrocatalytic
BMR solution – industrial electrolyte
Counter electrode - electrode in which an electrical current is expected to flow
Double layer capacitance - The measure of the ability of an electrical double layer to
store electrical charge as a capacitor
Equivalents – electrons
Equivalent weight – weighted average for the major alloying elements in a specimen
Faradaic current – current due to a redox reaction
Galvanostatic – constant current
Limiting current density – maximum current density beyond which cell voltage must be
significantly increased for a small increase in current density.
Metal values – valuable minerals in an ore
Open-circuit potential - potential of the working electrode relative to the reference
electrode when no potential or current is being applied to the cell
Overpotential – extent of polarisation
Passivation - the spontaneous formation of a non-reactive surface film on a metal
specimen
Polarisation - potential change from the equilibrium half-cell electrode potential caused
by a net surface reaction rate for the half-cell reaction
Polarisation resistance – resistance of a specimen to corrode
Potentiodynamic – varying potential
Potentiostatic – constant potential
Reference electrode – electrode which establishes the electrical potential against which
other potentials may be measured
Spalling – peeling off
Voltamperometric charges – Anodic charges
Working area – active surface area
Working electrode - electrode in an electrochemical system on which the reaction of
interest is occurring

vii
LIST OF SYMBOLS
A - Surface area in square metres.
M- Molar mass or molecular mass of the substance in grams per mole.
a - Atomic weight in grams per mole.
ia - Atomic weight of the ith alloying element in grams per mole.
a and c - Anodic and cathodic coefficients.
c- Specific heat capacity in kilocalories per kilogramme per degree Celsius.
C - Constant.
Cdl - Double layer capacitance in Farads per square centimetre.
CPE - Constant phase element in Farads.
D – Constant.
oc - Concentration of the oxidised species in moles per unit volume or mass per unit
volume.
Rc - Concentration of the reduced species in moles per unit volume or mass per unit
volume.
cε - Cathode current efficiency (dimensionless).
2/ HHe + - Hydrogen half-cell reaction.
E - Surface potential in volts. e
AE - Equilibrium anode potentials in volts.
eCE - Equilibrium cathode potentials in volts.
OCE / corrE - Open circuit (corrosion) potential in volts.
eE - Equilibrium potential in volts.
0eE - Standard potential in volts.
0E - Reversible potential in volts.
ocE - Open circuit potential in volts.
Ep – Passivation potential in volts.
E∆ / V∆ - Change in potential in volts.

viii
F - Faraday’s constant (96 500 Coulombs per mole).
if - Mass fraction of the ith alloying element (dimensionless).
G∆ - Standard Gibbs free energy change in Joules.
i /I - Cell current in amperes.
ai - Anodic current in amperes
ci - Cathodic current in amperes.
corrI - Corrosion current in amperes.
pai - Anodic peak current in amperes.
pci - Cathodic peak current in amperes.
appi∆ - Change in applied current in amperes.
IRSOLN – Voltage drop in solution in volts.
j - Current density in amperes per square metre.
oj - Exchange current density in amperes per square metre.
m- Mass in grams.
EQN - Total number of equivalents.
n - Number of electrons participating in the reaction.
n- Surface roughness in electrochemical impedance spectroscopy data (dimensionless).
P- Power in kilowatts.
q* - Voltammetric charge in coulombs per square centimetre.
Q- Flow rate of the electrolyte per cell in millilitres per minute.
r – Corrosion rate in grams per square metre per second, milli-inches per year,
millimetres per year or micrometres per year.
R - Gas constant in joules per Kelvin per mole.
RF – Roughness factor (dimensionless).
Rs – Solution resistance in ohms.
Rct – Charge transfer resistance in ohms.
t - Time in seconds.
T – Temperature in degrees Celsius or Kelvin.

ix
ht - Heat-up time in hours.
T∆ - Temperature rise in degrees Celsius.
V - Volume of solution per cell in litres.
∆VΩ - Ohmic drop (IR) in the inter-electrode gap, in the electrodes and the connections in
volts.
∆Vt - Drift of ∆V with time due to degradation of the electrode performance (stability) in
volts.
W∆ - Weight gain in grams.
aβ - Anodic Tafel constant in volts/decade.
cβ - Cathodic Tafel constant in volts/decade.
α – Charge transfer coefficient (dimensionless)
η – Overpotential in volts.
aη - Anodic polarisation in volts.
cη - Cathodic polarisation in volts.
η∆ - Sum of the anodic and cathodic overpotentials in volts.
ρ - Density in grams per cubic centimetre.

x
LIST OF ABBREVIATIONS
AAS - Atomic absorption spectrometer
A.R. - Analytical reagent
BMR - Base Metal Refinery
CE - Counter electrode
CV- Cyclic Voltammetry
DC – Direct current
DSAs - Dimensionally stable anodes
e.m.f - electromotive force
EASA - Electrochemically active surface area
EDS - Energy dispersive spectroscopy
EIS - Electrochemical Impedance Spectroscopy
E.W. - Equivalent weight
GPES - General Purpose Electrochemical System software
IBCs - Intermediate Bulk Containers
ICP - Inductively coupled plasma
ICP-MS - Inductively coupled plasma-mass spectrometer
Max. Maximum
MoL - Mesh on Lead
Min. - Minimum
OCP - Open circuit potential
OER - Oxygen evolution reaction
OLP – Oxygen low potential
PVC - Polyvinyl chloride
RE - Reference electrode
SEM - Scanning electron microscope
SHE - Standard Hydrogen Electrode
WE - Working electrode
XRD – X-ray diffractometer
XPS - X-ray photoelectron spectroscopy
xi
LIST OF FIGURES
Figure 2.1: Potential-pH Diagram for the System Lead-Water, at 25 0C. ................... 12
Figure 2.2: Potential-pH diagram for the System Lead-Sulphur-Water, at 25 0C. ..... 13
Figure 2.3: Potential-pH Equilibrium Diagram for the System Titanium-Water, at 25
°C. [Figure established by considering, as derivatives of tri- and tetravalent titanium,
the anhydrous oxides Ti203 and Ti02 (rutile).]............................................................. 14
Figure 2.4: Theoretical Domains of Corrosion, Immunity and Passivation of
Titanium, at 25 0C. ...................................................................................................... 15
Figure 2.5: Potential-pH Equilibrium Diagram for the System Tantalum-Water, at 25 0C. ................................................................................................................................ 16
Figure 2.6: Potential-pH Diagrams for the Iridium-Water System at 25°C and
Theoretical Conditions for the Corrosion, Immunity and Passivation of Iridium at
25°C Respectively. ...................................................................................................... 17
Figure 2.7: Cathodic and Anodic Tafel Plot ............................................................... 22
Figure 2.8: Cyclic Voltammogram.............................................................................. 24
Figure 2.9: Effect of Iron in the Electrolyte on Current Efficiency. ........................... 33
Figure 3.1: log I-E Characteristic for a Metal which Shows Passivation ................... 42
Figure 3.2: Dependence of Service Life on Current Density, at Constant Electrolyte
Concentration and Temperature. 150 g/l H2S04 – 60 °C ............................................. 43
Figure 3.3: Current Density-Voltage Curves for Copper Electrowinning Using
Different Types of Anodes. Electrolyte: 50 g/l Cu, 50 g/l H2SO4, temperature: 40 0C;
Cathode: copper clad graphite. .................................................................................... 48
Figure 3.4: Cell Potential Difference (cell voltage) versus Current Density for De
Nora Mercury Cells. (1) Graphite anodes; (2) activated Ti anodes (DSAs). NaCl
concentration: 310 g/l. Temperature: 60 °C. ............................................................... 49
Figure 3.5: Polarisation measurements for the Oxygen Evolution Reaction on a
TiO2/RuO2 Dimensionally Stable Anode (DSA) and a Conventional Lead/Antimony
anode. The electrolyte was 200 g/1 sulphuric acid at 25 0C. ...................................... 50
Figure 4.1: Potentiostat Equipped with a Personal Computer .................................... 55

xii
Figure 4.2: Electrowinning Cells ................................................................................ 62
Figure 4.3: Electrowinning Cells and Auxiliary Equipment ....................................... 63
Figure 4.4: Schematic Diagram of Experimental Setup .............................................. 65
Figure 4.5: Polystyrene Beads ..................................................................................... 65
Figure 4.6: Sample anode with a copper hanger bar ................................................... 67
Figure 5.1: OCP Graphs for Ti-IrO2/Ta2O5 Plate, Ti-IrO2/Ta2O5 Mesh and Pb/Sb in 55
g/l Cu and 100 g/l H2SO4 at Room Temperature (rt). ................................................. 71
Figure 5.2: Tafel Plots for DSA and Lead Alloy Anodes in Synthetic Electrolyte .... 73
Figure 5.3: Tafel Plots for DSA Plate in the Potential range 0.4 V to 1.2 V and -0.4 V
to 1.4 V in Synthetic Electrolyte. ................................................................................ 74
Figure 5.4: Anode potential-time curves for Pb-6% Sb and Ti-Ta2O5/IrO2 (plate and
mesh) in 55 g/l Cu and 100 g/l H2SO4 at 190 A/m2 .................................................. 76
Figure 5.5: Cyclic Voltammograms for the Lead Alloy Anode in the Potential Range
-0.5 to 2.2 V. ............................................................................................................... 82
Figure 5.6: Cyclic Voltammograms for the Lead Alloy Anode in the Potential Range
0 to 2.2 V. .................................................................................................................... 83
Figure 5.7: Cyclic Voltammograms for Ti/IrO2-Ta2O5 Electrodes in 0.5 M H2SO4 at a
Scan Rate of 100 mV/s. ............................................................................................... 84
Figure 5.8: Change of Voltammetric Charge of the DSA Mesh Specimen with
Continuous Cycling. .................................................................................................... 86
Figure 5.9: Change of Voltammetric Charge of the DSA Plate Specimen with
Continuous Cycling. .................................................................................................... 86
Figure 5.10: Change of Voltammetric Charge of the Lead Anode Specimen with
Continuous Cycling. .................................................................................................... 87
Figure 5.11: Relationship between Current Density and Scan Rate at a Fixed Potential
of 1.0 V for Ti/ IrO2-Ta2O5 and Pb/Sb Anodes. .......................................................... 88
Figure 5.12: Typical Graph of Anodic Charge, q* against Double Layer Capacitance,
Cdl for a DSA Anode. .................................................................................................. 89
Figure 5.13: Nyquist Plots for the DSA Plate at Open Circuit Potential and Oxygen
Evolution Potential. ..................................................................................................... 90

xiii
Figure 5.14: Nyquist Plots for the DSA Mesh Anode at Open Circuit Potential and
Oxygen Evolution Potential. ....................................................................................... 91
5.15: Nyquist Plots for the Lead Anode at Open Circuit Potential and Oxygen
Evolution Potential ...................................................................................................... 92
Figure 5.16: Nyquist Plots for a Ti/IrO2-Ta2O5 Plate Anode in Synthetic Electrolyte.
..................................................................................................................................... 94
Figure 5.17: Nyquist Plots for a Ti/IrO2-Ta2O5 Mesh Anode in Synthetic Electrolyte.
..................................................................................................................................... 94
Figure 5.18: Nyquist Plots for a Pb/Sb Anode in Synthetic Electrolyte ..................... 95
Figure 5.19: Chronoamperometry Tests in Synthetic Electrolyte ............................... 96
Figure 5.20: XRD Pattern for Unused DSA Anodes .................................................. 97
Figure 5.21: XRD Pattern for Used DSA Anodes ...................................................... 98
Figure 5.22: XRD Pattern for an Unused Lead Alloy Anode ..................................... 99
Figure 5.23: XRD Pattern for a Used Lead Alloy Anode ........................................... 99
Figure 5.24: SEM Micrograph for an Unused Lead Alloy Anode ............................ 100
Figure 5.25: SEM Micrograph for a Used Lead Alloy Anode .................................. 100
Figure 5.26: SEM Micrograph for an unused DSA Anode ....................................... 101
Figure 5.27: SEM Micrograph for a used DSA Anode ............................................. 101
Figure 5.28: EDS Analysis for an Unused DSA Anode ........................................... 102
Figure 5.29: EDS Analysis for a Used DSA Anode ................................................. 103
Figure 5.30: Cell Voltage against Time in BMR Solution over a Period of 150 Hours.
................................................................................................................................... 106
Figure 5.31: Cell Voltage against Time in BMR Solution over a Period of 150 Hours.
................................................................................................................................... 107
Figure 5.32: Cell Voltage against Time in BMR Solution over a Period of 150 Hours.
................................................................................................................................... 108
Figure 5.33: Cell Voltage against Time in BMR Solution over a Period of 150 Hours.
................................................................................................................................... 109
Figure 5.34: Anode Potential against Time in BMR and Synthetic Solutions for a
DSA Plate Specimen. ................................................................................................ 111

xiv
Figure 5.35: Anode Potential against Time in BMR and Synthetic Solutions for a
DSA Mesh Specimen. ............................................................................................... 111
Figure 5.36: Anode Potential against Time in BMR and Synthetic Solutions for a
Lead Specimen. ......................................................................................................... 112
Figure 5.37: Anode Potential against Time in Synthetic and Synthetic/Manganese
Solution for a DSA Plate Specimen. ......................................................................... 114
Figure 5.38: Anode Potential against Time in Synthetic and Synthetic/Manganese
Solution for a DSA Mesh Specimen. ........................................................................ 115
Figure 5.39: Anode Potential against Time in Synthetic and Synthetic/Manganese
Solution for a Lead Specimen. .................................................................................. 116
Figure 5.40: Heating Rod Showing Electrodeposited Copper in the Lead Anode Cell.
................................................................................................................................... 118
Figure 5.41: Copper from DSA 1 Plate Anode ......................................................... 120
Figure 5.42: Copper from DSA 2 Plate Anode ......................................................... 120
Figure 5.43: Copper from DSA 1 Mesh Anode. ....................................................... 121
Figure 5.44: Copper from DSA 2 Mesh Anode. ....................................................... 121
Figure 5.45: Copper from Lead Anode Cell. ............................................................ 122
Figure 5.46: Micrograph for Copper from DSA 1 Plate Anode Cell ........................ 122
Figure 5.47: Micrograph for Copper from DSA 2 Plate Anode Cell ........................ 123
Figure 5.48: Micrograph for Copper from DSA 1 Mesh Anode Cell. ...................... 123
Figure 5.49: Micrograph for Copper from DSA 2 Mesh Anode Cell. ...................... 124
Figure 5.50: Micrograph for Copper from Lead Anode Cell .................................... 124
Figure 5.51: XRD Peak Height Intensity: DSA 1 Plate Anode Cell ......................... 125
Figure 5.52: XRD Peak Height Intensity: DSA 1 Mesh Anode Cell ........................ 125
Figure 5.53: XRD Peak Height Intensity: DSA 2 Plate Anode ................................ 126
Figure 5.54: XRD Peak Height Intensity: DSA 2 Mesh Anode Cell ........................ 126
Figure 5.55: XRD Peak Height Intensity: Lead Anode ............................................ 127
Figure 5.56: XRD Peak Height Intensity: Standard Copper Sample ........................ 127

xv
LIST OF TABLES
Table 2.1: Potential Values of Common Secondary Reference Electrodes. Standard
Hydrogen Electrode Included for Reference ................................................................. 8
Table 2.2: Components of Cell Voltage in Copper Electrowinning ........................... 30
Table 3.1: De Nora Mercury cells: Comparison of Performances with Graphite and
DSA Anodes. ............................................................................................................... 49
Table 3.2: Conductivities of Some Conductive Polymers .......................................... 52
Table 4.1: Anode Type, Supplier and Composition .................................................... 55
Table 4.2: Reagents Used ............................................................................................ 56
Table 4.3: Concentrations of Electrolytes Used .......................................................... 57
Table 4.4: Equipment Used During Electrowinning Tests ......................................... 61
Table 4.5: Electrodes and Preparation......................................................................... 66
Table 5.1: Linear Polarisation Parameters .................................................................. 75
Table 5.2: Determination of Current Efficiency ......................................................... 78
Table 5.3: Effect of anode substrates on anode potential and deposit morphology .... 79
Table 5.4: Concentration of Lead in the Electrolyte and Standard Deviations ........... 79
Table 5.5: Concentrations of Titanium, Tantalum and Iridium in the Electrolyte ...... 80
Table 5.6: Voltammetric Charges for the Anode Specimens ...................................... 85
Table 5.7: Double Layer Capacitance and Roughness Factor for DSA Anodes ......... 89
Table 5.8: Equivalent Circuit Parameters for DSA Plate and Mesh Anodes and the
Lead Anode at Open Circuit Potential ........................................................................ 92
Table 5.9: Equivalent Circuit Parameters for DSA Plate and Mesh Anodes and the
Lead Anode at Oxygen Evolution Potential ................................................................ 92
Table 5.10: Quantitative Analysis for Unused and Used DSA Anodes. ................... 104
Table 5.11: Values of Minimum (Min.) and Maximum (Max.) Cell Voltages for DSA
1 and DSA 2 Plates. .................................................................................................. 109
Table 5.12: Values of Minimum and Maximum Cell Voltages for DSA 1 and DSA 2
Meshes. ...................................................................................................................... 110

xvi
Table 5.13: Current Efficiencies Achieved Over a Period of 150 hrs Using DSA 1
Anodes and a Lead Anode ........................................................................................ 117
Table 5.14: Current Efficiencies Achieved Over a Period of 150 hrs Using DSA 2
Anodes and a Lead Anode ........................................................................................ 117
Table 5.15: Copper Diffraction Pattern (standard sample) ....................................... 128
Table 5.16: Simplified Economic Evaluation of Replacing Lead Anodes with a DSA
Anode ........................................................................................................................ 130
Table 5.17: Other Fixed Costs in the Study .............................................................. 130

TABLE OF CONTENTS
ACKNOWLEDGEMENTS………………………………………………………......iv
ABSTRACT ……………………………………………………………………….....v
GLOSSARY………………………………………………………………………….vi
LIST OF SYMBOLS……………………………………………...............................vii
LIST OF ABBREVIATIONS………………………………………………………..x
LIST OF FIGURES……………………………………………………………….....xi
LIST OF TABLES …………………………………………………………………..xv
1 INTRODUCTION ............................................................................................... 1
1.1 Background and motivation .......................................................................... 1
1.2 Problem statement ......................................................................................... 2
1.3 Aim ................................................................................................................ 3
1.4 Hypotheses .................................................................................................... 3
1.5 Research questions ........................................................................................ 4
1.6 Objectives ...................................................................................................... 4
1.7 Research lay-out ............................................................................................ 5
2 THEORETICAL BACKGROUND ................................................................... 6
2.1 Electrochemical thermodynamics ................................................................. 6
2.1.1 Electrode processes ................................................................................... 6
2.1.2 Measurement of electrode potentials ......................................................... 6
2.1.2.1 Nernst equation ................................................................................. 7
2.1.2.2 Types of reference electrodes ............................................................ 8
2.1.3 Electrochemical polarisation ..................................................................... 8
2.1.3.1 Butler-Volmer equation................................................................... 10
2.1.4 Measurement of cell voltages .................................................................. 11
2.1.5 Pourbaix stability diagrams ..................................................................... 12
2.2 Electrochemical and physical characterisation techniques ......................... 18
2.2.1 Electrochemical characterisation............................................................. 18

2.2.1.1 Corrosion rate measurements .......................................................... 19
2.2.1.1.1 Tafel extrapolation ..................................................................... 22
2.2.1.1.2 Polarisation resistance method .................................................. 23
2.2.1.2 Cyclic voltammetry ......................................................................... 23
2.2.1.2.1 Qualitative analysis.................................................................... 24
2.2.1.2.2 Quantitative analysis.................................................................. 25
2.2.1.3 Chronoamperometry........................................................................ 25
2.2.1.4 Galvanostatic chronopotentiometry ................................................ 26
2.2.1.5 Electrochemical impedance spectroscopy ....................................... 26
2.2.2 Physical characterisation techniques ....................................................... 27
2.3 Electrowinning of copper ............................................................................ 27
2.3.1 Important parameters in electrowinning ................................................. 27
2.3.2 Electrowinning reactions ......................................................................... 28
2.3.2.1 Oxygen evolution ............................................................................ 29
2.3.3 Electrowinning products ......................................................................... 31
2.3.4 Suppression of acid mist ......................................................................... 31
2.3.5 Current density ........................................................................................ 31
2.3.6 Electrolyte concentration......................................................................... 32
2.3.7 Additives ................................................................................................. 32
2.3.8 Maximising copper purity ....................................................................... 32
2.3.9 Maximising current efficiency ................................................................ 33
2.3.10 Amount of copper deposited ............................................................... 34
3 LITERATURE REVIEW ................................................................................. 36
3.1 Lead alloy anodes used in electrowinning .................................................. 36
3.2 DSA applications in electrochemistry ......................................................... 36
3.2.1 Manufacture of DSA anodes ................................................................... 37
3.2.1.1 Electrochemical oxidation on DSA-type oxide electrodes ............. 38
3.2.1.2 Electrocatalytic coatings for oxygen evolution ............................... 39
3.2.1.3 Structure of oxide coating ............................................................... 40
3.2.1.4 Stability and success of DSA anodes .............................................. 40

3.2.1.5 Deactivation mechanism of DSA anodes ........................................ 40
3.2.1.5.1 Passivation ................................................................................. 40
3.2.1.5.2 Coating consumption ................................................................. 43
3.2.1.5.3 Coating detachment ................................................................... 44
3.2.1.5.4 Mechanical damage ................................................................... 44
3.2.1.5.5 Mixed mechanism...................................................................... 44
3.3 Comparison of lead alloy and DSA anodes ................................................ 45
3.4 Alternative anode materials ......................................................................... 51
4 EXPERIMENTAL PROCEDURES ................................................................ 54
4.1 Electrochemical tests ................................................................................... 54
4.1.1 Electroanalytical equipment .................................................................... 54
4.1.2 Electrode preparation .............................................................................. 55
4.1.3 Reagents .................................................................................................. 56
4.1.4 Electrolyte solutions ................................................................................ 56
4.1.5 Electrochemical measurements ............................................................... 57
4.1.5.1 Open circuit potential (OCP) measurements ................................... 58
4.1.5.2 Potentiodynamic Polarisation .......................................................... 58
4.1.5.3 Chronopotentiometry (galvanostatic) .............................................. 58
4.1.5.4 Cyclic Voltammetry (CV) ............................................................... 59
4.1.5.5 Electrochemical Impedance Spectroscopy (EIS) ............................ 60
4.1.5.6 Chronoamperometry (< 1s) ............................................................. 60
4.1.6 Reproducibility ........................................................................................ 60
4.2 Electrowinning tests .................................................................................... 61
4.2.1 Equipment ............................................................................................... 61
4.2.2 Electrowinning cell configuration and setup ........................................... 61
4.2.2.1 Control of pump flow rate ............................................................... 63
4.2.3 Suppression of acid mist ......................................................................... 64
4.2.4 Electrodes ................................................................................................ 66
4.2.5 Reagents .................................................................................................. 67
4.2.6 Analytical equipment .............................................................................. 68

4.2.7 Equipment Design ................................................................................... 68
4.2.7.1 Pump sizing ..................................................................................... 68
4.2.7.2 Heater sizing .................................................................................... 69
4.3 Physical characterisation ............................................................................. 70
4.3.1 Scanning electron microscope (SEM) and energy dispersive
spectroscopy, EDS .............................................................................................. 70
4.3.2 X-ray diffractometer ................................................................................ 70
4.3.3 Visual inspection ..................................................................................... 70
5 RESULTS AND DISCUSSIONS ..................................................................... 71
5.1 Comparison of anode materials: Electrochemical Investigations ............... 71
5.1.1 Open circuit potential measurements ...................................................... 71
5.1.2 Potentiodynamic polarisation .................................................................. 73
5.1.3 Chronopotentiometry (galvanostatic) ...................................................... 76
5.1.3.1 Determination of current efficiency ................................................ 77
5.1.3.2 Electrolyte contamination ............................................................... 79
5.1.4 Cyclic voltammetry ................................................................................. 81
5.1.4.1 Cyclic voltammograms for lead anodes .......................................... 81
5.1.4.2 Cyclic voltammograms for DSA anodes ......................................... 83
5.1.4.3 Electrochemically active surface area for the anode specimens ..... 84
5.1.4.4 Effect of continuous cycling on voltammetric charge .................... 85
5.1.4.5 Determination of double layer capacitance ..................................... 87
5.1.5 Electrochemical impedance spectrocopy ................................................ 90
5.1.6 Chronoamperometry (<1s) ...................................................................... 96
5.1.7 X-Ray Diffractometry (XRD) analysis ................................................... 97
5.1.8 Scanning Electron Microscopy (SEM) analysis.................................... 100
5.1.9 Energy Dispersive Spectrometry (EDS) analysis .................................. 102
5.2 Comparison of anode materials: Electrowinning Experiments ................. 104
5.2.1 Variation of Cell Voltage with Time..................................................... 104
5.2.1.1 Comparison of DSA 1 Plate and Mesh Anodes and the Lead Anode
105

5.2.1.2 Comparison of DSA 2 Plate and Mesh Anodes and the Lead Anode
107
5.2.1.3 Comparison between the DSA 1 and DSA 2 plate and mesh anodes
108
5.2.1.3.1 Comparison between the DSA 1 and DSA 2 plate anodes ...... 108
5.2.1.3.2 Comparison between the DSA 1 and DSA 2 mesh anodes ..... 109
5.2.1.4 Comparison between BMR and Synthetic solutions ..................... 111
5.2.1.4.1 Comparison between BMR and Synthetic solutions for a DSA
plate 111
5.2.1.4.2 Comparison between BMR and Synthetic solutions for a DSA
mesh anode ................................................................................................ 111
5.2.1.4.3 Comparison between BMR and Synthetic solutions for a lead
anode 112
5.3 Impurities in BMR solution ...................................................................... 113
5.3.1 Effect of manganese on anode potential ............................................... 113
5.3.1.1 Comparison between synthetic and synthetic/manganese solutions
114
5.3.1.1.1 Comparison between synthetic and synthetic/manganese
solutions for a DSA plate anode ................................................................ 114
5.3.1.1.2 Comparison between synthetic and synthetic/manganese
solutions for a DSA mesh anode ............................................................... 115
5.3.1.1.3 Comparison between synthetic and synthetic/manganese
solutions for a lead anode .......................................................................... 116
5.3.2 Current efficiency .................................................................................. 117
5.3.3 Morphology of the copper produced ..................................................... 119
5.4 XRD analysis for copper deposits ............................................................. 125
5.5 Economic evaluation ................................................................................. 130
6 SUMMARY OF RESULTS ............................................................................ 132
6.1 Comparison of anode materials ................................................................. 132
6.1.1 Electrochemical Investigations ............................................................. 132

6.1.1.1 Open circuit potential measurements ............................................ 132
6.1.1.2 Potentiodynamic polarisation ........................................................ 133
6.1.1.3 Chronopotentiometry (galvanostatic) tests.................................... 133
6.1.1.3.1 Determination of current efficiency ........................................ 135
6.1.1.3.2 Electrolyte contamination from anode deterioration ............... 135
6.1.1.4 Cyclic voltammetry ....................................................................... 135
6.1.1.4.1 Cyclic voltammograms for lead anodes .................................. 136
6.1.1.4.2 Cyclic voltammograms for DSA anodes ................................. 136
6.1.1.4.3 Electrochemically active surface area for the anode specimens
137
6.1.1.4.4 Effect of continuous cycling on voltammetric charge ............. 137
6.1.1.4.5 Determination of double layer capacitance ............................. 137
6.1.1.4.6 Determination of Roughness Factor (RF) ............................... 138
6.1.1.5 Electrochemical impedance spectroscopy (EIS) ........................... 138
6.1.1.6 Chronoamperometry (<1s) ............................................................ 139
6.1.2 Physical Characterisation ...................................................................... 139
6.1.2.1 X-Ray Diffractometry (XRD) analysis of anode materials ........... 139
6.1.2.2 Scanning Electron Microscopy (SEM) analysis............................ 139
6.1.2.3 Energy Dispersive Spectrometry (EDS) analysis .......................... 140
6.1.3 Electrowinning Experiments ................................................................. 140
6.1.3.1 Variation of cell voltage with time ................................................ 140
6.1.3.2 Current Efficiency ......................................................................... 141
6.1.3.3 XRD analysis and optical micrography of copper deposits .......... 142
6.1.4 Economic evaluation ............................................................................. 143
7 CONCLUSIONS AND RECOMMENDATIONS ........................................ 144
7.1 Conclusions ............................................................................................... 144
7.1.1 Anode Stability ...................................................................................... 144
7.1.2 Cell voltage ........................................................................................... 145
7.1.3 Techno-economic evaluation ................................................................ 145
7.1.4 Cathode contamination .......................................................................... 146

7.1.5 Effect of impurities in the electrolyte .................................................... 146
7.2 Recommendations for future research....................................................... 146
7.3 Expected contribution to knowledge ......................................................... 147
REFERENCES…………………………………………………………………….149
APPENDIX A: FLOW RATE CALCULATIONS………………………………...159
APPENDIX B: OPERATING PARAMETERS……………………………………161
APPENDIX C: HEATER SIZING…………………………………………………162
APPENDIX D: CURVES SHOWING REPRODUCIBILITY ……………………164
APPENDIX E: SIMILAR ANODE/CATHODE AREAS ………………………..174
APPENDIX F: DATA FOR FIGURES ……………...............................................177
APPENDIX G: COMPOSITION OF BMR ELECTROLYTE …………………...203
APPENDIX H: PHOTOGRAPH OF EXPERIMENTAL SETUP…………………204
SUBMISSION OF RESEARCH PAPER………………………………………..205

1
1 INTRODUCTION
1.1 Background and motivation
Most of the world’s copper produced is extracted using hydrometallurgical processes,
with electrowinning being one of the most important final steps. The electrowinning
process has been in existence since the 1800’s and it has evolved ever since due to
various researches undertaken. Electrowinning is an energy extensive process and as
such it accounts for a significant part of the costs of copper production. In a
conventional copper electrowinning cell, the cathodic reaction is the electrodeposition
of copper from an aqueous solution of copper sulfate containing free sulphuric acid,
and the anodic reaction is the dissociation of water into hydrogen ions and oxygen.
The essential requirements for anodes in electrowinning are electrochemical stability
in sulfate electrolytes, resistance to the chemical effects of oxygen liberated on the
anode surface, low oxygen overvoltage, mechanical stability and structural integrity
under operating conditions, product quality and environmental safety (Weems et al,
2005, Gupta and Mukherjee, 1990).
The traditional anodes of choice in the electrowinning industry have been lead based
anodes with typical compositions of lead-antimony (6%), lead-calcium (0.7%)-tin
(1.3%) and lead-strontium (0.05%) tin (0.6%). The continued use of the lead based
anodes in the electrowinning process has been mainly due to their relatively low cost
compared to other materials. However, certain drawbacks in the use of these anodes
have been documented, where the undesirable physical and chemical characteristics
have prompted further research into alternative materials to replace them. The main
disadvantages of lead based anodes are high energy consumption and low corrosion
resistance. Corrosion results in shorter anode life spans and production of poor
quality cathode deposits due to the incorporation of lead corrosion products (Moats et
al., 2003). Therefore, taking into consideration the low cost of lead based anodes, it is
important that the replacement anodes offer high energy savings and low corrosion

2
rates. Various materials have been proposed by researchers as having the ability to
replace the conventional lead anodes, such as dimensionally stable anodes (DSAs).
Dimensionally stable anodes consist of mixed metal oxide coatings, usually on
titanium or nickel substrates. The oxides that can be used in the oxide coatings
include tantalum oxide (Ta2O5), iridium oxide (IrO2), ruthenium dioxide (RuO2) and
tin oxide (SnO2). Since the discovery of DSAs by Henry Beer in 1957, much work
has been done on these anodes. Initially, the use of the DSA mainly focussed on the
Ti/RuO2-TiO2 anodes, which are popular in the chlor-alkali industry. Although these
anodes exhibited low energy consumption and low corrosion rates, they showed very
poor performances when used as oxygen evolution anodes (Hine et al., 1979).
Nevertheless, the good performance of the Ti/RuO2-TiO2 anode in chloride solutions
suggested that, with an appropriate coating, a new DSA could be found for oxygen
evolution. This motivated intensive research by many authors such as Rolewicz et al.
(1988), which led to the Ti/IrO2-Ta2O5 electrode.
1.2 Problem statement
The electrowinning process is significantly affected by the electrode material.
Conditions of high temperature (30 0C-60 0C), and a strongly acidic electrolyte, due
to the decomposition of water into hydrogen ions and oxygen gas, create a corrosive
environment in the cell. In spite of the low cost of lead anodes (about $US 500/m2),
high energy consumption and physical degradation associated with these anodes have
been a major concern in the electrowinning of copper. During operation, a lead oxide
layer forms on the anodes. Flakes of the lead oxide formed can attach to the growing
copper deposit, leading to lead contamination in the final product. Physical
degradation adversely affects anode life, cathode purity and the market grade of
copper deposited (Weems et al., 2005). Growths which occur on the cathode as a
consequence of the oxide layer may also cause an electrical short circuit, thus
decreasing the production of copper (Tyroler et al., 1987). Cobalt sulphate is usually

3
added to the electrolyte circuit in order to stabilise the lead oxide layer and prevent
spalling under controlled operating conditions. Levels of 120 ppm cobalt are
considered to be sufficient (Weems et al., 2005). However, since cobalt is expensive,
this leads to an increase in operating costs. Other problems which result from the use
of lead alloy anodes include disposal of the lead sludge produced, without violating
environmental constraints and high maintenance costs incurred periodically to clean
the anode surfaces and refurbish the anode area (Alfantazi and Moskalyk, 2003).
1.3 Aim
This project will compare the performance of dimensionally stable anodes (Ti/ (70%)
IrO2- (30%) Ta2O5 against the conventional lead alloy anodes (lead- (6%) antimony)
in synthetic and base metal refinery (BMR) solutions by investigating:
(i) anode stability
(ii) cell voltage
(iii) cost of materials
(iv) cathode contamination
An economic evaluation of the DSAs and lead alloy anodes will be provided.
1.4 Hypotheses
In view of the reported problems of high energy consumption and corrosion
associated with the conventional lead based anodes used in copper electrowinning,
the dimensionally stable anodes (DSAs) may potentially be a good substitute. The
research on DSAs, although still ongoing, suggests that there are advantages of using
dimensionally stable anodes over lead based anodes. Based on the formulation of
DSAs, these anodes are expected to have benefits such as low energy consumption
and great stability. Therefore a number of indicators that include, corrosion
resistance, anode potential, cell voltage and cathode purity will be investigated in this
study in order to prove or disprove these hypotheses. Lead-antimony (6%) anodes and

4
dimensionally stable plate and mesh anodes will be tested in synthetic electrolyte and
industrial electrolyte specific for the company concerned.
1.5 Research questions
What affects anode stability, cell voltage, life expectancy and cathode purity
in electrowinning processes?
What is the relationship between cell voltage and anode life?
Is it technically and economically justifiable to replace conventional lead
based anodes with dimensionally stable anodes in the copper electrowinning
process?
How does the behaviour of DSA anodes from different vendors compare
during electrowinning?
What are the harmful effects of impurities in the electrolyte on anode
performance?
1.6 Objectives
To compare electrode stability and corrosion rates of DSA plate, DSA mesh
and lead anodes.
To assess the life expectancy of DSAs and lead anodes.
To analyse the compositions and morphology of the copper deposits from
electrowinning cells containing the DSA plate and mesh anodes and the lead
anode.
To compare energy consumption for the DSAs and lead anodes in the
electrowinning of copper.
To carry out a financial evaluation of the electowinning process using the
DSA anodes and lead anodes.
To determine the effect of impurities in the electrolyte on the behaviour of the
DSAs and lead anodes.

5
1.7 Research lay-out
The rest of the project lay-out will be as follows:
Chapter 2-Theoretical Background
Chapter 3- Literature Review
Chapter 4- Experimental Procedures
Chapter 5- Results and Discussions
Chapter 6- Summary of Results
Chapter 7- Conclusions and Recommendations

6
2 THEORETICAL BACKGROUND
2.1 Electrochemical thermodynamics
2.1.1 Electrode processes
Electrode processes are chemical reactions that involve the transfer of charge, usually
electrons across the interface between an electrode and an electrolyte. For
electrochemical reactions to occur, an anode, a cathode, ionic contact between the
electrodes via an electrolyte and electronic contact are necessary. At the anode,
oxidation of species occurs, which is a loss of electrons while at the cathode a
simultaneous reduction process occurs. This reaction consumes those electrons
provided by the oxidative process. Unless these electrons can be consumed, then the
anodic reaction cannot occur (Scully, 1975).
2.1.2 Measurement of electrode potentials
Electrochemical reactions that characterise a metal-solution interface occur at the
surface of the metal, when a metal is immersed in a given solution. This leads to
corrosion of the metal. The reactions create an electrochemical or equilibrium
potential called electrode potential, or open circuit potential, ocE (corrosion) potential.
The potential of a metal is the means by which the anodic and cathodic reactions are
kept in balance. Since the open circuit potential ends up at the potential where the
cathodic and anodic currents are equal, it can also be referred to as a mixed potential.
The current from each half reaction depends on the electrochemical potential of the
metal. If the anodic reaction releases too many electrons into the metal, the potential
of the metal becomes more negative as a result of the excess electrons. This
consequently slows the anodic reaction and speeds up the cathodic reaction thereby
counteracting the initial perturbation of the system.

7
This follows Lechatelier’s principle which states that: “a system will always react to
oppose a change imposed upon it” (Meyers, 2003). The value of either the anodic or
cathodic current at ocE is called the corrosion current, corrI . The potential that exists
between a metal and the solution in contact with it, is immeasurable in absolute terms
and only the potential difference between the metal and another electrode can be
measured. Furthermore, the changes in the potential difference can be related to the
metal electrode under investigation, if the other electrode is a reference electrode.
Such an electrode arrangement will enable direct measurement of electrode potential
by using a potentiostat or a high impedance digital voltmeter (Scully, 1975).
Experiments based on the measurement of the open circuit potential have important
applications in corrosion measurements.
Corrosion current cannot be measured directly, but it can be estimated using
electrochemical techniques. Corrosion current is an important parameter in the
determination of the corrosion rate of a metal specimen in solution. In any real
system, corrI and corrosion rate are functions of many system variables such as type
of metal, solution composition, temperature, solution movement and metal history
(Jones, 1996).
2.1.2.1 Nernst equation
Electrode potentials can be calculated from the Nernst equation when the activity of
metal cations is not at unit activity (non-standard conditions):
R
oee c
cnF
RTEE log3.20 += ……………………………………………………………2.1
Where, 0eE is the standard potential (the equilibrium potential when all reactants and
products are at their standard states), n is the number of electrons participating in the
reaction, R is the gas constant, T is temperature, oc and Rc are the concentrations of
the oxidised and reduced species respectively. The thermodynamic equation can also
be written in terms of a ratio of activities.

8
2.1.2.2 Types of reference electrodes
There are several reference electrodes that are in common use in the field of
electrochemistry. The Standard Hydrogen Electrode (SHE) is the primary reference
electrode because it establishes the reference (zero) point on the electrochemical scale
by definition. The hydrogen half-cell reaction has an electrode potential, 02/=+ HH
e
for all reactants and products at standard state. This reference electrode is connected
to another half-cell through a solution salt bridge which contains a porous glass
barrier to permit charge transfer and potential measurement but not mass transfer of
the acid solution in the electrode. Other reference electrodes are secondary reference
electrodes and electrode potentials can also be reported with reference to these, as
shown in table 2.1 (Jones, 1996).
Table 2.1: Potential Values of Common Secondary Reference Electrodes. Standard Hydrogen Electrode Included for Reference Name Half-Cell Reaction Potential V
vs. SHE
Area of Application
Mercury-
Mercurous
Sulphate
−− +=+ 244 2 SOHgeHgSO +0.615 Possible contamination of
cell by chloride is
undesirable
Copper-Copper
Sulphate
−− +=+ 244 2 SOCueCuSO +0.318 Buried metal structures
Saturated
Calomel
−− +=+ ClHgeClHg 22222
+0.241 Laboratory use
Silver-Silver
Chloride
−− +=+ ClAgeAgCl +0.222 Elevated temperatures
(it has a smaller temperature
coefficient of potential)
Standard
Hydrogen 222 HeH =+ −+ +0.000
2.1.3 Electrochemical polarisation
Polarisation is the potential change from the equilibrium half-cell electrode (open-
circuit) potential caused by a net surface reaction rate for the half-cell reaction.

9
This causes current to flow via electrochemical reactions that occur at the electrode
surface. The amount of current is controlled by the kinetics of the reactions and the
diffusion of reactants both towards and away from the electrode.
The extent of polarisation is measured by the overpotential, η. For anodic
polarisation, electrons are removed from the metal and a deficiency results in a
positive potential change due to the slow liberation of electrons by the surface
reaction, and aη must be positive. For cathodic polarisation, cη , electrons are supplied
to the surface, and a build up in the metal due to the slow reaction rate causes the
surface potential, E, to become negative compared to the equilibrium half-cell
electrode potential, eqE . Thus, cη is negative by definition (Jones, 1996).
Overpotential is determined from equations 2.2 and 2.3 given below:
eqEE −=η (Bard and Faulkner, 1980) ……………………………………………..2.2
DiC += logη (Jones, 1996) ………………………………………………………2.3
Equation 2.3 is known as the Tafel equation, where C and D are constants and i is the
cell current in amperes.
More specifically for the anode process the equation becomes:
oaaaa ji loglog ββη −=
For the cathode process:
occcc ji loglog ββη −=
Where, nF
RTa α
β 303.2= and ( )nF
RTc α
β−
=1
303.2

10
The constants aβ and cβ are called the anodic and cathodic Tafel constants in
volts/decade, R is the gas constant in joules per Kelvin per mole, T is the temperature
in Kelvin, F is Faraday’s constant in coulombs per mole, α is the charge transfer
coefficient, n is the number of electrons participating in the reaction, oj is the
exchange current density in amperes per square meter while ai and ci are the anodic
and cathodic currents in amperes respectively .
2.1.3.1 Butler-Volmer equation
The potential of a cell in which two kinetically controlled reactions are occurring can
be related to the current by the Butler-Volmer equation given as: ( ) ( )
)1010( C
OC
A
OC EEEE
corrii ββ−
−−
−= ……………………………………………...2.4
Where,
i is the measured cell current in amperes,
corri is the corrosion current in amperes,
OCE is the open circuit potential in volts,
Aβ is the anodic Tafel constant in volts/decade,
Cβ is the cathodic Tafel constant in volts/decade.
But caocca EEialOverpotent // η=−= where a and c are anodic and cathodic
coefficients. Therefore, equation 2.4 becomes: ( ) ( )
)1010( C
c
A
a
corrii βη
βη
−
−= ………………………………………………………2.5
Rearranging equation 2.5 and differentiation gives an expression for the polarisation
resistance, pR (Stern and Geary, 1957):

11
0→⎥⎥⎦
⎤
⎢⎢⎣
⎡
∆∆
=ηapp
p iER
( )( )CAcorr
CAp i
Rββ
ββ+
=3.2
…………………………………………………………..2.6
Where Aβ and Cβ are the Tafel constants of the anodic and cathodic reactions
respectively.
The termappiE
∆∆ is given in ohms (volts/amperes or millivolts/milliamperes).
2.1.4 Measurement of cell voltages
The magnitude of the equilibrium cell voltage is calculated from (Pletcher, 1991): e
CELLnFEG −=∆ ……………………………………………………………………..2.7
Where, e
CELLE is equilibrium cell voltage.
G∆ is the standard Gibbs free energy change in Joules.
F is Faraday’s constant (96 500 Coulombs).
n is number of electrons participating in the reaction.
For a reaction to proceed spontaneously; G∆ is by convention negative and eCELLE
positive (Scully, 1975). The equilibrium cell voltage can also be calculated from: e
Ae
Ce
CELL EEE −= …………………………………………………………………2.8
Where eCE and e
AE are the equilibrium cathode and anode potentials respectively.

12
2.1.5 Pourbaix stability diagrams
Pourbaix diagrams show the reactions and products that will be present when
equilibrium is attained, assuming that all appropriate reactions have been included.
More importantly, these diagrams show conditions in which corrosion is
thermodynamically impossible (stability regions). Consequently, potential and/or pH
can be adjusted in some cases to prevent corrosion (Jones, 1996). Figures 2.1-2.6 are
Pourbaix diagrams for lead, titanium, tantalum and iridium which are the materials of
concern in this study.
a. Stability of Lead
Figure 2.1: Potential-pH Diagram for the System Lead-Water, at 25 0C. Adopted from Pourbaix, M. (1974) “Atlas of Electrochemical Equilibria in Aqueous Solutions" Pergamon Press, New York,
USA.

13
Figure 2.2: Potential-pH diagram for the System Lead-Sulphur-Water, at 25 0C.
In the presence of neutral and alkaline solutions free from oxidising agents, metallic
lead is generally thermodynamically stable. However, under the influence of
oxidising action, lead ions may be converted into brown quadrivalent lead peroxide
(PbO2). Although lead peroxide is stable in alkaline solutions which are free from
reducing agents, it is thermodynamically unstable at atmospheric pressure in acidic
solutions, where it is reduced to plumbous ions (Pb++). Plumbous oxide (PbO) is
amphoteric and as such, it dissolves in acid, neutral and alkaline solutions (Pourbaix,
1974). During electrowinning, the lead ions in solution react with sulphuric acid in
the electrolyte to form lead sulphate which may migrate to the cathode and result in
contamination of the copper deposit. Lead sulphate is stable in the presence of water
and aqueous solutions of all pHs and both in the presence and in the absence of
oxidising agents (Pourbaix, 1974).

14
b. Stability of Titanium
Figure 2.3: Potential-pH Equilibrium Diagram for the System Titanium-Water, at 25 °C. [Figure
established by considering, as derivatives of tri- and tetravalent titanium, the anhydrous oxides
Ti203 and Ti02 (rutile).] Adopted from Pourbaix, M. (1974) “Atlas of Electrochemical Equilibria in Aqueous Solutions" Pergamon Press, New York,
USA.

F
A
A
p
(
u
d
p
p
o
Figure 2.4: Th
[Deduced fromAdopted from Pou
Although ti
passivating
(1974), Gme
under reduc
diminish the
probable do
potentials, if
on the work
heoretical Dom
m figure 2.3, asurbaix, M. (1974) “
itanium is n
film of ruti
elins stated
cing conditi
e protective n
omain of co
f it is used a
k of Preiser,
mains of Corr
ssuming passiv“Atlas of Electroch
not a noble
le TiO2 that
that TiO2 is
ions and v
nature of the
orrosion in
as an electro
stated that
15
osion, Immun
vation by the anhemical Equilibria
e metal, it
t is formed
s practically
ery powerfu
e oxide film
figure 2.4;
olytic anode.
if titanium i
COR
nity and Passiv
nhydrous oxidea," Pergamon Pres
is corrosion
on its surfa
y insoluble in
ful oxidising
(Donachie,
titanium co
. However, P
is partially c
RROSION
vation of Titan
e TiO2 (rutile).s, New York, USA
n resistant
ace. As cited
n acid. Titan
g environm
2000). As in
orrodes at h
Pourbaix (1
coated with
nium, at 25 0C
] A.
because of
d by Pourba
nium corrod
ments as the
ndicated in t
high electro
974) reporti
a noble me
C.
f a
aix
des
ese
the
ode
ing
etal

16
with low oxygen overpotential such as iridium, its electrode potential is lowered from
the domain of corrosion situated on the upper part of figure 2.4 into the domain of
passivation. This important feature enables titanium to be used in the manufacture of
dimensionally stable anodes.
c. Stability of Tantalum
The Pourbaix diagram for the tantalum-water system at 25 0C shows that the domain
of immunity corresponds to the domain of stability of metallic tantalum (Ta) and the
domain of passivation corresponds to the domain of stability of tantalum pentoxide
(Ta2O5).
Figure 2.5: Potential-pH Equilibrium Diagram for the System Tantalum-Water, at 25 0C.
Immunity
Passivation

17
It is also unaffected by acids such as hydrochloric acid (HCl) and sulphuric acid
(H2SO4) and their mixtures. This lead to the conclusion that tantalum pentoxide
formed on the metal acts as a protective layer. The position of the domain of stability
of tantalum pentoxide in figure 2.5 indicates that, Ta2O5 is thermodynamically stable
in the presence of water and acid. This is the reason why Ta2O5 is used as a coating
stabiliser in DSA anodes.
d. Stability of Iridium
Figure 2.6: Potential-pH Diagrams for the Iridium-Water System at 25°C and Theoretical
Conditions for the Corrosion, Immunity and Passivation of Iridium at 25°C Respectively. (Pourbaix, 1974).
18
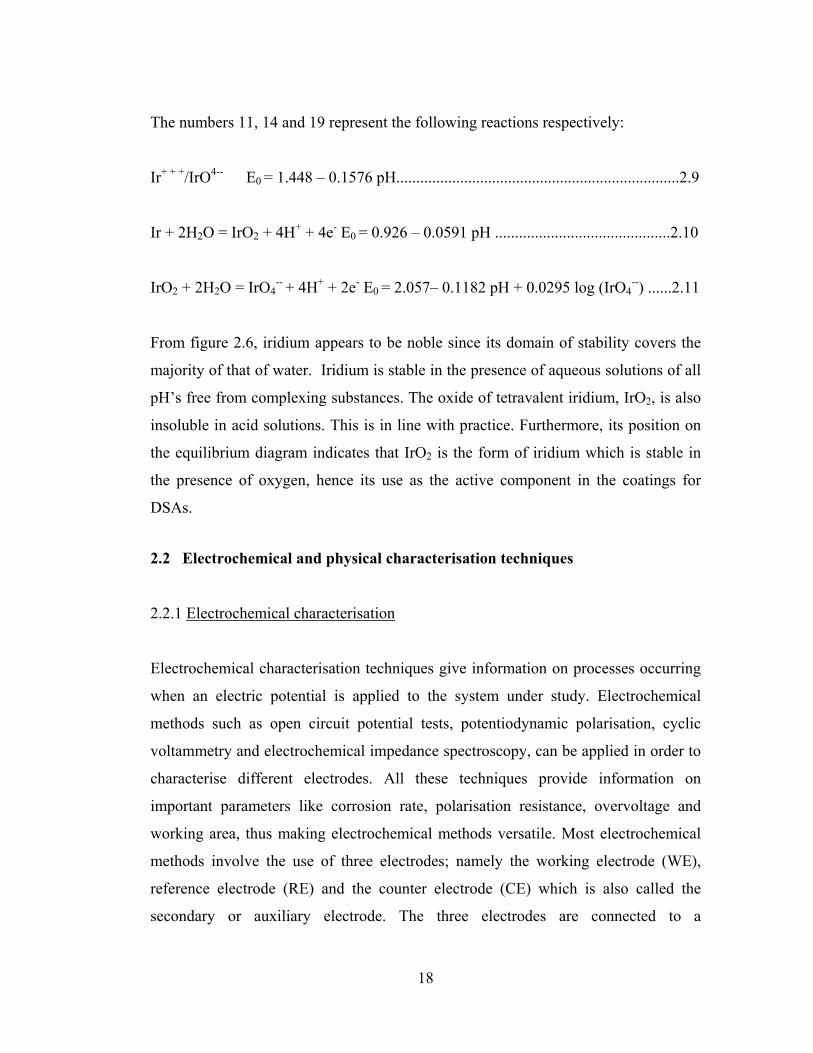
The numbers 11, 14 and 19 represent the following reactions respectively:
Ir+ + +/IrO4-- E0 = 1.448 – 0.1576 pH.......................................................................2.9
Ir + 2H2O = IrO2 + 4H+ + 4e- E0 = 0.926 – 0.0591 pH ............................................2.10
IrO2 + 2H2O = IrO4-- + 4H+ + 2e- E0 = 2.057– 0.1182 pH + 0.0295 log (IrO4
--) ......2.11
From figure 2.6, iridium appears to be noble since its domain of stability covers the
majority of that of water. Iridium is stable in the presence of aqueous solutions of all
pH’s free from complexing substances. The oxide of tetravalent iridium, IrO2, is also
insoluble in acid solutions. This is in line with practice. Furthermore, its position on
the equilibrium diagram indicates that IrO2 is the form of iridium which is stable in
the presence of oxygen, hence its use as the active component in the coatings for
DSAs.
2.2 Electrochemical and physical characterisation techniques
2.2.1 Electrochemical characterisation
Electrochemical characterisation techniques give information on processes occurring
when an electric potential is applied to the system under study. Electrochemical
methods such as open circuit potential tests, potentiodynamic polarisation, cyclic
voltammetry and electrochemical impedance spectroscopy, can be applied in order to
characterise different electrodes. All these techniques provide information on
important parameters like corrosion rate, polarisation resistance, overvoltage and
working area, thus making electrochemical methods versatile. Most electrochemical
methods involve the use of three electrodes; namely the working electrode (WE),
reference electrode (RE) and the counter electrode (CE) which is also called the
secondary or auxiliary electrode. The three electrodes are connected to a

19
potentiostat /galvanostat, which is an instrument that can perform both controlled
potential (potentiostatic) and controlled current (galvanostatic) experiments. The
potential drop near the other current carrying electrode (the counter electrode) is not
important when a three-electrode potentiostat is used.
2.2.1.1 Corrosion rate measurements
Corrosion testing aims to achieve one or more of the following objectives (Sprowls,
1987):
- Screen available materials (alloys) to determine the best one for a specific
application.
- Determine the probable service life of equipment or a product.
- Evaluate new commercial alloys.
- Study corrosion mechanisms.
Depending on the electrochemical system, the most suitable method may be applied
with the aim of determining the corrosion behaviour of the material.
The reasons for the popularity of electrochemical techniques for corrosion
measurement are:
a) They are fast.
While real-time weight loss measurements need days and sometimes weeks to make a
reliable measurements of corrosion rate, electrochemical experiments will require at
most several hours. The speed of electrochemical measurements is especially useful
for those metals or alloys which are highly corrosion resistant.
b) They are sensitive.
Modern, electrochemical instrumentation can measure extremely low corrosion rates
(less than 0.1 milli-inches per year) which are both tedious to perform with
conventional weight-loss or chemical analytical techniques. Low current densities can
also be precisely measured to values as low as 10-9 A/cm2.

20
c) They are accurate.
Electrochemical techniques have been exhaustively tested before finding general
acceptance.
In electrochemical reactions, electrons are either consumed or released. Thus, the rate
of electron flow to or from a reacting interface is a measure of the reaction rate. The
flow of electrons is measured as current, i in amperes where 1-ampere is equal to 1-
coulomb of charge (6.2*1018 electrons) per second. Faraday’s law given below shows
the proportionality between i and mass reacted in grams, m, in an electrochemical
reaction (Jones, 1996):
nFItam = …………………………………………………………………………….2.12
Where F is the Faraday’s constant (96 500 Coulombs/mole), n is the number of
equivalents (electrons transferred) exchanged, a is the atomic weight in grams per
mole, and t is the time in seconds.
Dividing equation (2.12) by t and the surface area in square metres, A yields the
corrosion rate in grams per square metre per second, r:
nFja
tAmr == …………………………………………………………………2.13
Where j is the current density ⎟⎠⎞
⎜⎝⎛
Ai .
Equation 2.13 shows the proportionality between mass loss per unit area per unit time
and current density in which case the proportionality constant includes nFa and any
conversion factors for units. Since the same current concentrated into a smaller

21
surface area results in a larger corrosion rate, current density rather than current is
proportional to corrosion rate whilst corrosion rate is inversely proportional to area
for the same dissolving current. Dividing equation 2.13 by the density, ρ , of the alloy
gives the units of penetration per unit time. For corrosion rate in milli-inches per year
(mpy), equation 2.13 becomes:
ρnajr 129.0= (in mpy) ……………………………………………………………2.14
For units of j , 2cmAµ and ρ , 3cm
g . The proportionality constant, 0.129 changes to
0.00327 and 3.27 for mm/yr and µM/yr.
Calculation of the corrosion rate requires the determination of the equivalent weight
(E.W.), na for the alloy. The alloy equivalent weight is a weighted average of n
a
for the major alloying elements in the alloy (Jones, 1996).
Dean (1987) proposed a procedure for calculating the equivalent weight of an alloy.
He recommended that the fractional number of equivalents of all alloying elements
should be summed up in order to determine the total number of equivalents, EQN ,
which result from dissolving unit mass of the alloy. This is given below as:
∑∑ ⎟⎟⎠
⎞⎜⎜⎝
⎛=
⎟⎟⎟⎟
⎠
⎞
⎜⎜⎜⎜
⎝
⎛
=i
ii
i
iEQ a
nf
na
fN …………………………………………………….2.15
Where if , in and ia are mass fraction, electrons exchanged, and atomic weight,
respectively, of the ith alloying element. Equivalent weight is then the reciprocal of
EQN :
1.. −= EQNWE ……………………………………………………………………...2.16

22
Although, the measurement of open circuit potential ( ocE ) is the first step in most
electrochemical corrosion experiments, the two main electrochemical polarisation
techniques available for the measurement of corrosion rate are Tafel extrapolation
and polarisation resistance.
2.2.1.1.1 Tafel extrapolation
Tafel plots are used to measure corrosion rates of metal specimens in solution by
polarising the specimen about 300mV anodically (positive-going potential) and
cathodically (negative-going potential) from the corrosion potential, corrE . The
resulting current is plotted on the logarithmic scale as shown in 2.7.
Figure 2.7: Cathodic and Anodic Tafel Plot
Tafel plots yield values of the corrosion current, corri by extrapolating the linear
portion of the curve to corrE . The corrosion rate can then be calculated from corri by
using equation 2.17:
( )..
..129.0ρA
WEiRateCorrosion corr= ………………………………………………2.17
where A, is the surface area of specimen.
icorrlogi, A
Eco
rr, m
V

23
2.2.1.1.2 Polarisation resistance method
A potential is applied to the specimen, +/-20 mV about corrE (open circuit potential)
and plots of applied potential versus measured current are made at a typical scan rate
of 0.1 mV/sec. An apparent linearity is observed at the origin of the polarisation curve
for overvoltages up to a few millivolts. The slope of the curve gives the polarisation
resistance, pR (equation 2.6). Not only does the value of pR measure the corrodibility
of a specimen after a potential has been applied, it is also used in the determination of
the corrosion current, corrI for use in the determination of corrosion rate (equation
2.17) if the Tafel constants are known. However, if Aβ and Cβ are unknown, the
corrosion rate can still be estimated within a factor of 2 since CA
CAββ
ββ+ varies
little in magnitude. From equation 2.6, it is evident that the degree of polarisation of a
specimen at a given applied current is greater for a lower corrosion rate. Overall, the
slope of this linear curve is inversely proportional to the corrosion rate (Scully, 1975).
2.2.1.2 Cyclic voltammetry
In a cyclic voltammetry experiment, as in other controlled potential experiments, a
potential is applied to the system, and the faradaic current (current due to a redox
reaction) is measured over a range of potentials often referred to as a potential
window. The potential is varied in a linear manner starting at an initial value up to a
pre-defined limiting value. At this potential, (switching potential) the direction of the
potential scan is reversed, and the same potential window is scanned in the opposite
direction, hence the term cyclic. This means that, for example, species formed by
oxidation on the first (forward) scan can be reduced on the second (reverse) scan
(Bard and Faulkner, 2001). Figure 2.8 below shows a typical cyclic voltammogram.

24
Figure 2.8: Cyclic Voltammogram
The anodic peak current, pai , and cathodic peak current, pci , are equal in magnitude
when the transport of the reduced and oxidised species in the solution is controlled
only by diffusion to a planar electrode surface immersed in an unstirred solution.
Furthermore, the electrode potential 85.0E found at 85% up the CV wave to pai (or paE
), is equal to the reversible potential, 0E (Gosser, 1993).
Cyclic voltammetry (CV) is thus a potentiodynamic electrochemical measurement
which is used to monitor the surface properties of metal specimens. Not only is it a
fast and reliable characterisation tool, it also provides both qualitative and
quantitative information. The method uses a reference electrode, working electrode,
and counter electrode. The range of potential is determined by a combination of the
solvent, electrolyte and specific working electrode material.
2.2.1.2.1 Qualitative analysis
a) Passivation tendencies of electrode materials can be detected from cyclic
voltammograms on performing repetitive scans (Cheng and Hiskey, 1996).

25
b) Since the area under a voltammogram represents electrical charge on a metal
specimen and electrical charge is proportional to the electrode area, the working area
(active surface area) of different materials can be compared (Ortiz et al., 2004). In
electrode processes, a larger working area results in an increase in the number of
active sites which in turn leads to an increase in reaction rate or rate of electron
transfer (Pletcher, 1991).
2.2.1.2.2 Quantitative analysis
a) Voltamperometric (anodic) charges can also be used to determine the anode with
the largest electrochemically active surface area (Hu et al., 1996).
b) The potential for oxygen evolution can be determined from a voltammogram in
electrode processes involving the oxygen evolution reaction (OER) thus enabling
conclusions on the most energy efficient working electrode (anode) to be drawn.
c) Evaluation of remaining activity can be carried out by calculating the anodic
(voltamperometric) charges before and after chronopotentiometry tests (Ortiz et al.,
2004).
2.2.1.3 Chronoamperometry
Chronoamperometry is an electrochemical technique in which the potential of the
working electrode is stepped, and the resulting current from faradic processes
occurring at the electrode (caused by the potential step) is monitored as a function of
time. Chronoamperometry techniques are used to assess the activity of anode
materials since the potential is changed instantaneously. As with all pulsed
techniques, chronoamperometry generates high charging currents, which in this case,
decay exponentially with time. A three electrode system is commonly used. The
potential steps used in chronoamperometry are selected from Tafel plots in the
passivation region.

26
2.2.1.4 Galvanostatic chronopotentiometry
In galvanostatic chronopotentiometry, a constant current is applied between the
auxiliary and working electrodes and the working electrode potential is recorded with
time with respect to the reference electrode. Galvanostatic chronopotentiometry can
also be referred to as constant current electrolysis. A three electrode arrangement is
used. From this test, the anode potential that characterises a specific anode material
can be deduced.
2.2.1.5 Electrochemical impedance spectroscopy
Electrochemical Impedance Spectroscopy (EIS) is a powerful technique for the
characterisation of electrochemical systems. It has found widespread applications in
the characterisation of coatings and corrosion phenomena. EIS has also been used
extensively as a tool for investigating mechanisms in electrodeposition,
electrodissolution and passivity. An important advantage of EIS over other laboratory
techniques is the possibility of using very small amplitude signals without
significantly disturbing the properties being measured. To make an EIS measurement,
a small amplitude signal, usually a voltage between 5 to 50 mV is applied to a
specimen over a range of frequencies of 0.001 Hz to 100,000 Hz. The resistance and
capacitance of the impedance response of the system are recorded by the EIS
instrument (potentiostat). In the characterisation of coatings, when the EIS data has
been fit into a frequency response, a set of parameters which can be correlated with
the coating condition can be obtained. High impedance values obtained from medium
to low frequencies suggest high corrosion resistance of specimen in a given
electrolyte.
EIS retains all the advantages of direct-current methods because it is sensitive, can be
conducted in situ, and often does not require artificial accelerating factors such as
temperature and concentration for testing (de Assisa et al., 2006).

27
2.2.2 Physical characterisation techniques
Physical characterisation techniques are divided on the basis of the interrogating
radiation. Some techniques utilise X-ray techniques, optical or electron microscopy.
These techniques enable composition and surface morphology of specimens to be
studied (Flewitt and Wild, 2003).
2.3 Electrowinning of copper
Electrowinning involves:
(a) immersing metal cathodes and inert, conductive anodes in an aqueous solution of
copper sulphate containing free sulphuric acid (CuSO4-H2SO4-H2O electrolyte),
(b) applying an electrical potential between the anodes and cathodes,
(c) plating pure metallic copper from the electrolyte onto the cathodes.
Cathodes may be stainless steel blanks or copper ‘starter sheets’. Copper is
electrodeposited on the cathodes for about one week, after which harvesting is done
while water dissociates into hydrogen ions and oxygen at the anode (Biswas et al.,
2002).
2.3.1 Important parameters in electrowinning
In electrowinning processes, efficient operation can be achieved by manipulating
temperature and current density. Temperatures of between 30 0C and 60 0C are
considered suitable for the electrowinning of copper. Electrolysis can also be carried
out at low or high current densities. When operating at low current densities (up to
430 A/m2), a cooling coil made of lead or aluminium can be placed in the cell in order
to control the temperature. Higher current densities (861 to 1076 A/m2), are only used
if the copper concentration, acid concentration, purity of the electrolyte and
circulation rate are high.

28
In such a case, Gupta and Mukherjee (1990) stated that the value of copper
concentration should be greater than 170 g/l copper while the acid concentration is
around 200 g/l H2SO4 and external cooling is also employed. They also mentioned
that for each current density applied; a narrow range of acidity exists at which copper
deposition is efficient. Although most plants operate at low current densities and low
acidities, operating at high current density improves throughput and energy efficiency
for the copper cells. Limiting current density is also taken into consideration during
electrowinning. This is defined as the maximum current density beyond which cell
voltage must be increased significantly for a small increase in current density and is a
function of the mass transfer coefficient of the electrode and the concentration of
copper ions in solution. The metal deposited at or above the limiting current density is
rough, less dense, and less pure and consequently has a low market grade. According
to Gupta and Mukherjee (1990), in a conventional electrowinning cell, high quality
metal is produced at a current density of about 200 A/m2 which may be an indication
that it is slightly below the limiting current density.
2.3.2 Electrowinning reactions
During copper electrowinning, the following reactions occur at the electrodes:
Cathode:
Cu2+ (aq) + 2e- = Cu(s) (2.18)
JG 410,640298 −=∆ ; E0
e = +0.334 V
Copper ions (Cu2+) are preferentially discharged because the hydrogen cations also
present in the solution are more electropositive than the Cu2+ ions.
Anode:
H2O (l) = 2H+ (aq) + 1/2O2 (g) + 2e- (2.19)
JG 089,2370298 =∆ ; E0
e = -1.229 V

29
Although hydroxyl ions are also oxidised at the anode, they produce negligible anodic
current since their concentration in the acidic solution is low. Preferential
decomposition of water also occurs at the anode, over the oxidation of sulphate
anions because the electrode potential for their oxidation is much greater than that for
decomposition of water (-1.229 V). Equation 2.19 above is known as the oxygen
evolution reaction (OER). Thus, an oxygen evolution reaction is an electrode reaction
in which oxygen gas is produced at the anode of an electrolytic cell by the oxidation
of hydroxyl (OH-) ions or the oxidation of the water molecules of an aqueous
solution.
2.3.2.1 Oxygen evolution
Oxygen evolution is one of the most important technological reactions in
electrochemistry taking place in many industrial processes namely water electrolysis,
metal electrowinning, cathodic protection and electro-organic synthesis (Fierro et al.,
2007). This reaction has a large bearing on the economics of the process as it operates
at a high overpotential. Furthermore, this reaction enhances the harsh corrosive
environment for the electrode material in acidic media.
Thus the overall cell reaction in copper electrowinning involves the reduction of
copper ions to copper and the oxidation of water to oxygen and hydrogen ions as
indicated by the reaction below:
Cu2+ (aq) + H2O (l) = Cu(s) + 1/2O2 (g) +2H+
(aq) (2.20)
JG 679,1720298 =∆ ; VE 89.00 −=
The value -0.89 V is a measure of the electromotive force (e.m.f) which would have
to be opposed to prevent the reverse reaction from taking place. Therefore, from the
overall reaction above, if a potential of 0.89 V is applied across the electrodes, there
is no net reaction since the cell will be in equilibrium (Gilchrist, 1989). However, for
copper deposition to occur from the solution to the cathode a larger potential is

30
necessary since the potential difference applied to the cell consists of several
components as shown below (Trasatti, 2000):
tVVEV ∆+∆+∆+∆=∆ Ωη ………………………………………………………2.21
Where,
V∆ is potential difference in volts.
∆E is the thermodynamic (equilibrium) potential difference for the given electrode
reactions in volts.
η∆ is the sum of the anodic and cathodic overpotentials in volts.
∆VΩ is ohmic drop (IR) in the inter-electrode gap, in the electrodes and the
connections in volts.
∆Vt = Drift of ∆V with time due to degradation of the electrode performance
(stability) in volts.
The overpotential, η is applied to each electrode in order to enhance the rate of
electron transfer processes and also to supply a potential while IRSOLN (voltage drop
in the solution) is used to drive the current through the electrolyte. Therefore, the
energy requirement is approximately 2 000 kWh/tonne of copper produced while the
electrical potential needed for electrowinning is about 2 V. It is made up of:
Table 2.2: Components of Cell Voltage in Copper Electrowinning
Theoretical voltage for reaction 2.11 V9.0≈
Oxygen deposition overvoltage V5.0≈
Copper deposition overvoltage V05.0≈
Electrical resistance at cathode current density
(300 A/m2) V5.0≈
Adopted from Biswas et al., (2002) “Extractive Metallurgy of Copper”, 4th edition, Pergamon.
Gupta and Mukherjee (1990) gave the power requirement in conventional
electrowinning cells as 0.16 to 2.5 kWh/kg copper.

31
2.3.3 Electrowinning products
The electrowinning products are:
(a) copper metal at the cathode (less than 20 ppm undesirable impurities) (Biswas et
al., 2002)
(b) oxygen gas at the anode
(c) regenerated sulphuric acid in the solution
The copper is manually or machine-stripped from the stainless steel cathode blanks,
washed and sent to the market or the entire copper ‘starter sheet’ is washed and sent
to the market. The oxygen enters the atmosphere while the acid is recirculated to the
leaching circuit.
2.3.4 Suppression of acid mist
“Acid mist” is used to describe the oxygen bubbles that form on the anode and burst
at the electrolyte interface, giving rise to sulphuric acid mist. In electrowinning
plants, hollow polyethylene balls (approximately 2 cm in diameter) are usually
floated, 5 to 10 cm deep, on the electrolyte together with fluorocarbon surfactant.
Polypropylene BB’s, usually 0.3 cm in diameter and 0.15 cm long are also commonly
used. Mechanical mist suppressant systems that include polymer brushes around the
anode tops, are also used while in some plants large blowers are used in order to
minimise generation of acid mist (Pfalzgraff, 1999).
2.3.5 Current density
Copper plating rate increases with increasing current density. However, excessive
current density gives rough, nodular cathode deposits and decreased copper purity.
Therefore, each plant chooses its current density as a balance between these opposing
factors.

32
2.3.6 Electrolyte concentration
Electrowinning electrolyte typically contains 44 kg Cu2+ and 170 kg H2SO4 per m3 as
it enters an electrowinning cell. It contains about 5 kg Cu2+ less per m3 as it leaves the
cell.
2.3.7 Additives
All electrowinning plants dissolve guar gum in their electrolytes (about 250 g/t of
cathode copper) or glue. As cited by Biswas et al. (2002), Stanke reported that these
additives promote dense, level copper deposits with minimum impurity entrainment.
Cobalt sulphate (CoSO4) solution is also added to provide about 150 ppm cobalt ions
(Co2+) in the electrowinning electrolyte. Biswas et al. (2002) reporting the work of
Prengaman and Siegmund mentioned that Co2+ promotes oxygen (O2) evolution at the
anode rather than lead (Pb) oxidation.
2.3.8 Maximising copper purity
The three main impurities in electrowon copper are:
(a) Lead (1 or 2 ppm) from anode corrosion product entrapment
(b) Sulphur (4 or 5 ppm) from lead sulphate anode corrosion product and electrolyte
entrapment and
(c) Iron (1 or 2 ppm) from electrolyte entrapment.
According to Maki (1999), cathode purity may be maximised by:
(a) straight vertical equispaced cathodes and anodes with no anode-cathode contact
(b) immediate thorough washing of the deposited copper
(c) frequent removal of anode corrosion products from the bottom of the
electrowinning cells
(d) Iron in electrolyte below 2 kg/m3 to minimise iron in cathode copper.

33
2.3.9 Maximising current efficiency
Current efficiencies in modern electrowinning plants may be around 90 %. The
unused current is wasted by:
(a) anode/cathode short circuits
(b) stray current to the ground
(c) reduction of Fe3+ to Fe2+ at the cathode and re-oxidation of Fe2+ to Fe3+ at the
anode (Das and Gopala, 1996; Biswas et al., 2002).
High current efficiency is important because it maximises copper plating rate and
minimises electrical energy consumption (Biswas et al., 2002).
Some results of the effect of iron on the current efficiency at a total current density of
280 A/m2 are shown below.
Figure 2.9: Effect of Iron in the Electrolyte on Current Efficiency.
Adapted from “Electrowinning and Electrorefining of Metals: A Course Presented to Anglo Research
by Nicol, M.J. (2006).

34
2.3.10 Amount of copper deposited
According to Faraday’s law (equation 2.12), which gives the theoretical amount of
metal deposited, a gram equivalent of copper is deposited if 96 500 Coulombs (26.8
Ah) of electricity is passed.
However, in practice, the actual amount of electricity required is greater than the
theoretical amount due to current loss which results from (Gupta and Mukherjee,
1990):
Inadequate circulation of the electrolyte
Poor connections
Circuit leakages
Short circuitry of the electrode caused by the dendritic growth of the copper
during deposition.
The ratio between the theoretical and actual amount of electricity used is known as
the current efficiency. Current efficiency can be calculated from the weight gained by
the cathode as shown below:
( )ItM
WnFIc∆
=ε ……………………………………………………………………2.22
Where,
cε is Cathode current efficiency.
W∆ is weight gain.
F is Faraday’s constant.
I is applied current.
M is atomic weight of copper.
t is time taken for the copper to be deposited.
n is the number of electrons participating in the reaction (2 electrons).

35
Another important parameter, which describes the performance of a cell, is the energy
consumption which was given by Pletcher (1991) as:
MnFE
nConsumptioEnergyc
cell
ε6.310 3−−
= ………………………………………2.23 (a)
Where, n – number of electrons, M – molecular weight, cellE – cell voltage, cε -
current efficiency and F- Faraday’s constant.
The energy efficiency of a cell can then be calculated from equation 2.23 (b) below:
( ) ( )%*% efficiencycurrentvoltageapplied
voltageiondecompositreversibleefficiencyEnergy =
2.23 (b)

36
3 LITERATURE REVIEW
3.1 Lead alloy anodes used in electrowinning
Biswas et al. (2002) citing the work of Prengaman and Siegmund mentioned that
electrowinning anodes are almost always cold rolled lead-tin-calcium (Pb-Sn-Ca)
alloys containing about 98.4% lead (oxygen scavenged prior to alloying), 1.5% tin
and 0.1% calcium. Tin provides corrosion resistance and corrosion layer conductivity
while calcium and cold rolling add strength. These authors also stated that, the Pb-Sn-
Ca blades are soldered onto slotted copper hanger bars for support in the electrolytic
cells. Lead is then electrodeposited around the joints to protect them from corrosion.
The Pb-Sn-Ca alloy forms an adherent corrosion layer which minimises lead
contamination of the cathode copper and extends anode life. Other lead alloy anodes
also used in electrowinning contain silver or antimony additions (Yu and O’Keefe,
2002).
3.2 DSA applications in electrochemistry
Dimensionally stable anodes (DSAs) are used in a number of important industrial
applications (Martelli et al., 1994) and have found a wide application in chlorine gas
production for example, chlor-alkali and sodium chlorate production, since their
introduction in the late 1960s. These anodes proved to override the shortcomings of
the previously used magnetite and graphite electrodes which had high overvoltage
and had a tendency to degrade during the process. The life of DSA electrodes in
chlorine evolution is claimed to be up to 10 years (Herlitz, 2004). Recently, there has
been a marked increase in the use of DSA anodes in the field of oxygen evolution
processes (Martelli et al., 1994). DSA electrodes have also found application in
oxygen reduction (Yoshio et al., 2008), organic oxidation (fuel cells and air batteries)
and molten salt electrolysis (Uchida et al., 1981).

37
3.2.1 Manufacture of DSA anodes
Different methods can be used to manufacture DSA anodes. However, the
performance of these anodes is critically dependent on their composition and the
procedure of preparation (solvent of the painting solution, firing temperature). The
morphology and structure of the coating were found to be essential factors
influencing the properties and performances of the Ti/IrO2-Ta2O5 electrode (Vercesi
et al., 1991). Kulandaisamy et al. (1997) also mentioned that an increase in resistivity
of the surface coating for DSA anodes increased the anode potential; the resistivity
being a function of the method of preparation of the oxide coating on the anode.
Martelli et al. (1994) reported that even DSA anodes with the same chemical
composition would show different electrocatalytic activities when their
microstructures are different.
The first operation for the preparation of dimensionally stable electrodes based on
titanium sheets is the pretreatment of titanium (Krysa et al., 1996). The valve metal
substrate (titanium) is degreased in acetone and then etched in boiling oxalic acid
solution or hydrochloric acid. To achieve good adhesion of the coating, the surface of
the base metal must be pretreated to an appropriate degree of roughness. The active
oxides are subsequently applied as a solution of precursor salts using a roller or brush
until the required coating loading has been reached (Martelli et al., 1994). Coating
loading depends on the conditions and type of solution in which the anodes will be
used. As thermal decomposition of precursor salts occurs during the drying stage, the
metallic oxides are produced. One of the oxides will be the catalyst and conducting
component while the other oxide is the stabiliser and dispersant of the catalyst.
The conventional thermal deposition method of film preparation involves the use of
H2IrCl6·6H2O and TaCl5 precursors dissolved in hydrochloric acid and alcohol,
respectively. However, Angelinetta et al. (1989) and Spinolo et al. (1997) reported
that oxide anodes prepared from organic solvent systems display better performance.

38
It was also shown that IrO2–Ta2O5 coatings prepared at low temperature display a low
stability due to incomplete thermal decomposition resulting in the dissolution of the
coating during electrolysis (Hu et al., 2002). However, at higher temperatures
(>500 °C), partial oxidation of the base metal leads to low adhesion of the film to the
support. Therefore, an in situ study of the thermolysis processes is indispensable in
order to improve the design of thermally prepared electrode coatings.
Morimitsu et al. as cited by Moats (2008) stated that decreasing the curing
temperature used in the thermal decomposition process during coating preparation
lowers the anode overpotential although this may be at the expense of anode life.
3.2.1.1 Electrochemical oxidation on DSA-type oxide electrodes
The electrochemical oxidation processes on DSA-type oxide electrodes occur via
oxygen-atom transfer from water in the solvent phase to the oxidation product. The
overall processes of anodic oxygen transfer can be represented by the generic
equation (Savall, 1995).
−+ ++=+ xexHROOxHR x 222 3.1
Where R is the reactant and the ROx is the oxidation product.
In the mechanism proposed for oxidative degradation in aqueous solutions, the first
step is the discharge of water or OH- ions, which leads to the production of hydroxyl
radical (OH*) adsorbed on the electrode surface. The coating of MOx forms an active
species (MOx+1) on DSA-type oxide electrodes by the discharge of H2O according to
the reactions (Comninellis, 1994):
( ) −+∗ ++=+ eHOHMOOHMO xx 2 3.2
( ) −++
∗ ++= eHMOOHMO xx 1 3.3

39
The MOx+1 species are responsible for both reactant oxidation and oxygen evolution
in a competitive process as shown below:
ROMORMO xx +=++1 3.4
221
1 OMOMO xx +=+ 3.5
3.2.1.2 Electrocatalytic coatings for oxygen evolution
Although the service life of DSA anodes is strictly dependent on the operating
conditions, the long and stable operation of these anodes has been attributed to the
mixed metal oxide coatings deposited on the valve metal substrate (Martelli et al.,
1994). The oxides that have been commonly used in the oxide coatings are tantalum
oxide (Ta2O5), iridium oxide (IrO2), ruthenium dioxide (RuO2) and tin oxide (SnO2).
Although the material that is available commercially is Ti/Ta2O5-IrO2 (Rolewicz et
al., 1988), mixtures of tin oxide and iridium oxide (SnO2 + IrO2) have also gained
popularity in acidic environments due to the impressive surface segregation of IrO2,
which increases electroactivity, while at the same time reducing power consumption.
Ruthenium is also considered as an active oxide for the oxygen evolution reaction
(OER). A number of other electrode coatings on titanium or nickel substrates are also
available for oxygen and hydrogen evolution in other common electrochemical
processes (Cardarelli et al., 1998).
In view of the number of metallic oxides available as catalysts for the oxygen
evolution reaction (OER), various couplings between noble metal oxides such as
RuO2, IrO2, PtOx and valve metal oxids, for example TiO2 , ZrO2, Ta2O5 can be
applied as a paint on the substrates of different valve metals, such as Ti, Zr, Ta and
Nb.

40
3.2.1.3 Structure of oxide coating
Martelli et al., (1994) using an X-ray diffractometer (XRD), noticed that IrO2-Ta2O5
coating contained pure crystalline IrO2 and Ta2O5 amorphous phase. They attributed
this to the temperatures used during the drying stage of the precursor salts. Surface
morphology as analysed by a scanning electron microscope (SEM) showed a mud-
cracked structure of the oxide coating and some crystalline agglomerates at the
surface. The electrical and electrochemical properties of DSA anodes are found to
depend strongly on the characteristics of the morphology and structure of Ti substrate
/noble metal interface.
3.2.1.4 Stability and success of DSA anodes
Not only does chemical composition of DSA anodes have great effect on the
chemical stability but also on the electrocatalytic properties of these anodes. Different
types of noble metals will result from quite different properties, and even the anodes
with the same chemical composition would show the different electrocatalytic
activities when their microstructures are different (Martelli et al., 1994).
3.2.1.5 Deactivation mechanism of DSA anodes
Martelli et al. (1994) classified the deactivation mechanism of Ti/IrO2-Ta2O5 anodes
into five classes, namely: metal base passivation, coating consumption, coating
detachment, mechanical damages and mixed mechanism. However, they also
mentioned that these classes were not independent of each other since deactivation
may occur by more than one mechanism. Process related conditions (temperature,
current density and concentration) or internal factors (related to the coating) have an
influence on the deactivation mechanism that occurs. Factors related to the coating
can be reduced by proper fabrication of the coating.
3.2.1.5.1 Passivation
Passivation influences the kinetics of metal dissolution. Passivation is the formation
of a thin, non-porous layer usually 1-15 nm thick, of a corrosion product on the

41
surface which is able to act as a barrier to further oxidation of the metal. A passive
surface is formed over some metals or alloys when exposed to oxygen or other
chemical reactions which can lead to the formation of non-reactive and low solubility
films on metal surfaces. The surface is also electron conducting although it is not able
to transport ions and thus there is no mechanism for the thickening of the film.
The formation of passivating films can be irreversible and their removal may require
quite harsh conditions. Figure 3.1 shows a characteristic curve for a metal undergoing
passivation over a wide range of potential (E). The curve is obtained by scanning the
potential from the potential where there is no corrosion and as the potential becomes
more positive, the metal is oxidised and contains three regions namely (Pletcher,
1991):
a. Active Corrosion Region
The exponential increase in current in the active corrosion region is attributed to the
dissolution of metal into ions. At more positive potentials, there is a sharp drop in
current.
b. Passive Region
In the passive region, the current remains at a low value over a wide potential range
and the corrosion rate is low.
c. Oxide Conversion (H2O to O2)
Due to oxygen evolution and further oxidation of the metal ions in the oxide layer, the
current rises again as depicted in figure 3.1.

42
Figure 3.1: log I-E Characteristic for a Metal which Shows Passivation Adapted from “A first course in Electrode Processes”, (Derek Pletcher, 1991).
In operations involving DSA anodes containing titanium as a substrate, passivation is
attributed to the formation of a thin, insulating layer of TiO2 at the interface between
the metallic base and the active coating. Operations at high current densities are
characterised by passivation as the most frequent deactivation mechanism. From
studies by Martelli et al. (1994), it was discovered that rate of anode passivation is
related to current density, as shown in figure 3.2 below, and at the moment of
deactivation a certain amount of catalyst remains non-utilised on the electrode
surface.
Log I
Act ive corrosion
E
Passive region
H2O to O2

43
Figure 3.2: Dependence of Service Life on Current Density, at Constant Electrolyte
Concentration and Temperature. 150 g/l H2S04 – 60 °C
As cited by Martelli et al. (1994), Denora et al. defined the wear rate as being equal
to:
( )( ) ( )hoursxkAmj
gNMmloadinginitialr 2
2
−
−
= ……………………………………………………... 3.6
Ling et al. (1994) also concluded that electrolyte circulation, direction of electrolyte
circulation and high current densities between 0.23 to 1.50 kA m–2 accelerated anode
passivation. Ling et al. (1994) also cited Sedzimir and Gumowska as having found
similar results pertaining to the effect of current density on the onset of passivation.
Higher temperatures were observed to delay the onset of anode passivation.
3.2.1.5.2 Coating consumption
Coating consumption occurs as a result of electrochemical corrosion and /or chemical
consumption. Electrochemical corrosion is the oxidation and dissolution of a noble
oxide at high potentials. For a coating containing IrO2, dissolution is possible. For
Adapted from “Deactivation Mechanisms Of Oxygen Evolving Anodes at High Current Densities”, (Martelli et al., 1994).

44
example, at potentials greater than 2.0 V vs. SHE, IrO42- is formed. However,
research has shown that iridium rarely reaches such high potentials in oxygen
evolution reactions. Chemical consumption is a consequence of the interactions
which occur between the electrode, electrolyte and/or the impurities in solution.
Martelli et al. (1994) reporting the work of Hardee, mentioned that phosphates and
chromates preferentially react with tantalum in a coating containing Ta2O5, while
organic impurities may also react with the precious metal oxides leading to a mixed
deactivation mechanism.
3.2.1.5.3 Coating detachment
Chemical attack of the valve metal substrate by an acidic electrolyte, may lead to the
weakening of the bond between the substrate and the coating, thus promoting
detachment. Furthermore, since the coating is porous, it provides a large surface area
for gas evolution, which can erode loosely bonded particles.
3.2.1.5.4 Mechanical damage
Mechanical damage is known as the trivial cause of deactivation, which usually
destroys a good coating within a few seconds.
3.2.1.5.5 Mixed mechanism
In practice, at least two of the afore-mentioned mechanisms result in anode
deactivation.
Hu et al. (2002) also carried out a standard accelerated electrolysis test in 0.5 M
H2SO4 solution, at a current density of 2 A cm-2 and a temperature of 50+/- 1 0C.
These authors reported that over the whole electrolysis time in H2SO4 solution,
performance of the long service life Ti/70% IrO2–30% Ta2O5 anodes prepared at 450 0C can be divided into three stages, namely ‘active’, ‘stable’ and ‘de-active’ regions.

45
They found that the following three types of destruction were occurring during the
electrolysis:
(i) dissolution of the active component,
(ii) penetration of electrolyte through the porous structure of the thermally
prepared oxide layer, and
(iii) dissolution and anodic oxidation of the titanium base.
In the active and stable regions, loss of oxide coatings was dominated by dissolution
of the active component, while in the ‘de-active’ region, oxide coatings were lost
mainly by the peeling-off taking place in the Ti/oxide layer interface region.
Furthermore electrocatalytic activity of the oxide catalyst decreased slowly with
electrolysis time. Hu et al. (2002) noticed a sudden increase in electrode potential in
the de-active region which was caused by the degradation in Ti/oxide layer interface.
They concluded that dissolution and anodic oxidation of Ti base, ultimately leads to
deactivation of DSA anodes.
3.3 Comparison of lead alloy and DSA anodes
According to Alfantazi and Moskalyk (2003) and Weems et al. (2005), lead alloys are
not dimensionally stable, since they slowly dissolve in electrolytes, leading to
problems such as changes in the gap between the anode and cathode and product
contamination by lead. Beer (1980) mentioned that dimensionally stable anodes have
brought considerable improvements to the field of electrowinning which include:
(i) lower half-cell potential,
(ii) use of higher current densities,
(iii) lower gas bubble effect through special anode designs,
(iv) no loss of anode material, thus keeping the electrolyte pure,
(v) no contamination of cathode deposits
(vi) high current efficiency, and simple cell constructions.

46
Trasatti (2000) also agrees that the success of DSA anodes has been attributed to their
chemical stability that allows them to maintain nearly constant dimensions during the
life of the anode even when operating in environments with very low pH values. DSA
anodes have been reported to have consumption rates as low as 1 mg/amp.yr due to
their stability, and thus can be operated at high current densities (greater than 200
A/m2) (Alfantazi and Moskalyk, 2003). High current densities result in high yields of
metal deposits. Gupta and Mukherjee (1990) reported that DSA technology can result
in up to 20-25% power savings compared to the lead counterparts.
As cited by Kristóf et al. (2004), Alves et al. reported that IrOx is the most widely
investigated electrocatalyst for O2 evolution. It presents a service life almost 20 times
longer than that of the equivalent RuO2. However, since IrOx is much more expensive
than RuO2 and its activity is slightly lower, in order to save cost and/or to improve the
coating property; other components such as Ta2O5 are usually added.
Balko and Nguyen (1991) also reported that the major technological advantage of
titanium metal anodes activated with iridium oxide based coatings, is their ability to
evolve oxygen in strongly acidic environments while maintaining good catalytic
activity and dimensional stability. According to Trasatti (2000), thermally prepared
IrO2-based coatings deposited on titanium metal supports are the most promising
anodes in electrometallurgy where cheaper, but environmentally undesired materials
like lead alloys, have to be dismissed. Kristóf et al. (2004) also mentioned that in
industrial processes where oxygen evolution is one of the electrochemical reactions
occurring at the anode, IrO2-based coatings may be a success. The authors also
mentioned that tantalum pentoxide would be the optimal stabilising component of
IrO2-based film anodes.
In the search for the most suitable DSA-type electrode for oxygen evolution in acidic
solutions, Comninellis and Vercesi (1991) analysed nine binary coatings with IrO2,
RuO2 and Pt as the conducting component, and TiO2, ZrO2, Ta2O5 as inert oxides,

47
deposited on titanium in H2SO4. These authors examined the microstructural
properties, electrocatalytic activity and anodic stability. In agreement with Rolewicz
et al.’s findings, Comninellis and Vercesi found that Ti/IrO2 (70 mol %)-Ta2O5 (30
mol %) was the best electrode for oxygen evolution in acidic media. The anode was
associated with high catalytic activity and service life. The service life of
Ti/IrO2−Ta2O5 with 70 mol % IrO2 was estimated to be 5−10 years in electroflotation
applications (Mraz and Krysa, 1994).
After analysing the behaviours of various coatings on a titanium substrate, Kotz et al.
(1983) reported that the best coating for oxygen evolution in acidic solutions is
Ti/IrO2 (70% mol)-Ta2O5 (30% mol). Their conclusion was based on the concept of
anodic efficiency (Ah mol-1 of active component that can be supplied) and stability.
Mraz and Krysa (1994) and Krysa et al. (1996) also agree that among the many IrO2-
based film electrodes, an important advantage offered by mixed oxide coatings
consisting of IrO2 and Ta2O5 is the remarkable catalytic activity for the oxygen
evolution reaction, which allows lower energy consumption in the process of interest.
The decisive feature is, however, the service life of these electrodes, which are so far
satisfactory for many practical applications, in spite of the fact that the performance
can be still improved by proper optimisation of the electrode film preparation (Kristóf
et al., 2004). Cooper (1985) carried out experiments in an electrolyte containing 50
g/l Cu and 50 g/l H2SO4. The author reported that, although the addition of cobalt (II)
to the copper electrowinning electrolyte can lower the oxygen overvoltage on the Pb-
Sb anodes, an even greater reduction of 500-600 mV in the overvoltage can be
realised by the replacement of lead alloy anodes with dimensionally stable anodes
(DSA) as shown in figure 3.3. The particular anodes referred to in figure 3.3 are
titanium anodes with an oxygen low potential (OLP) coating of iridium and platinum.

48
Figure 3.3: Current Density-Voltage Curves for Copper Electrowinning Using Different Types of
Anodes. Electrolyte: 50 g/l Cu, 50 g/l H2SO4, temperature: 40 0C; Cathode: copper clad graphite. Adapted from “Advances and Future Prospects in Copper Electrowinning”, Journal of Applied Electrochemistry, 15 (6),
(Cooper, 1985)
The author also mentioned that, although the reduction of the oxygen overvoltage via
the use of DSA anodes may be expensive, continuing advances in anode materials
and further increases in energy costs will undoubtedly lead to the wider acceptance of
anodes having low oxygen overpotential such as DSA anodes in copper
electrowinning. Forti et al. (2001), in agreement with other authors, mentioned that
DSA-type electrodes show good technological performance and their success is due
to desirable features such as high stability of the active coating, good overall
performance under mild conditions, high conductivity and commercial availability.
However, these authors (Forti et al., 2001) seem to contradict other authors such as
Loufty and Leroy (1978), Alfantazi and Moskalyk (2003) and Moats et al. (2003) by
mentioning that DSA electrodes are inexpensive.
Trasatti (2000) reported that Vittorio and Oronzio carried out experiments using
mercury cells with graphite and DSA electrodes. After plotting graphs of cell voltage
versus current, these authors noted that the slope of the graph was higher for graphite

49
electrodes. Furthermore, values of cell voltage at constant current were also higher
(4.97 V) than those with the DSA electrode (3.90 V). In this case, although the
composition of the DSA anodes used in the experiments was not revealed, the
conclusion drawn was that DSA anodes were more suitable for the process. Table 3.1
and its corresponding graph show the results of the comparison.
Table 3.1: De Nora Mercury cells: Comparison of Performances with Graphite and DSA
Anodes.
Graphite DSA
Anode potential (V) 1.47 1.37
Cathode potential (V) -1.85 -1.85
Anode ohmic drop (V) 0.15 0.15
Electrolyte ohmic drop (V) 0.60 0.40
Gas bubble effect (V) 0.90 0.13
Current efficiency (%) 96 97
Energy consumption (kWht-1) 3910 3040 Adapted from “Electrocatalysis: understanding the success of DSA®”, Electrochimica Acta, 45 (15-16), (Trasatti, 2000)
Figure 3.4: Cell Potential Difference (cell voltage) versus Current Density for De Nora Mercury
Cells. (1) Graphite anodes; (2) activated Ti anodes (DSAs). NaCl concentration: 310 g/l.
Temperature: 60 °C.

50
Kulandaisamy et al. (1997) reported that the energy consumed in the electrowinning
of metals accounted for a substantial portion of the overall cost of the metal
production. According to these authors, since 50-60% of the energy is consumed in
the anode reaction alone, the appropriate selection of the anode is crucial. They
carried out potentiodynamic studies in 2 M sulphuric acid and achieved about 450
mV reduction in anode potential compared to the lead anode. Although their study
focused on the Ti/Ir-Co anode, these authors also agreed that catalytically activated
anodes reduced anode potential significantly. Loufty and Leroy (1978) carried out an
experiment comparing a dimensionally stable anode and an antimonial lead anode in
200 g/l sulphuric acid and found that the anode potential for the lead alloy anode was
500 mV higher than that of the DSA anode as shown in figure 3.5.
Figure 3.5: Polarisation measurements for the Oxygen Evolution Reaction on a TiO2/RuO2
Dimensionally Stable Anode (DSA) and a Conventional Lead/Antimony anode. The electrolyte
was 200 g/1 sulphuric acid at 25 0C. Adapted from “Energy Efficiency in Metal Electrowinning”, Journal of Applied Electrochemistry, 8 (6), (Loufty and Leroy,
1978)
They attributed the high anode potential of the lead alloy anode to the PbO2 surface
formed on the anode, which exhibits one of the largest oxygen overpotentials known.

51
However, Loufty and Leroy (1978) also reported that although the use of
dimensionally stable anodes seems attractive in this case, the energy saving benefit
may not be as great as that which would be expected from considerations of the
electrode overvoltages alone. The limited electronic resistivity of the valve metals
(titanium), and their relatively high cost, may result in a limitation on the cell-voltage
reduction which is economically achievable.
3.4 Alternative anode materials
Some researchers have proposed that the cell voltage in electrowinning may also be
reduced by utilising other anode materials that have been developed. Rubel et al.
(1994) and De Pauli and Trasatti (1995) reported on the surface properties of Ti/
(SnO2 + IrO2), a dimensionally stable anode by using Scanning Electron Microscopy
(SEM), X-ray photoelectron spectroscopy (XPS) and cyclic voltammetry. They
claimed that these anodes showed stability under excessive oxygen production, thus
making them suitable for practical applications. Ortiz et al. (2004) carried out
research on the properties of this anode Ti/(SnO2 + IrO2) by analysing the surface
response using cyclic voltammetry and impedance measurements in the potential
range where no reactions occurred. The electrode samples were prepared at 10 mol %
intervals of composition from pure SnO2 to pure IrO2, with a few more concentrations
between 0 and 10 mol % IrO2. Electrocatalytic properties were studied using the
chlorine evolution reaction while the reaction mechanism was analysed using Tafel
slopes and reaction orders with respect to hydrogen and chloride ions. After
comparing the voltammetric charges for fresh electrodes and those that had been used
in the study, it was concluded that the oxide electrodes showed stability.
Although Alfantazi and Moskalyk (2003) mentioned that DSA anodes are chemically
stable and they reduce anode potential, they suggested that DSA anodes are not the
ideal replacements for lead alloy anodes due to their prohibitive capital cost and the
requirement of periodic recoating with precious metals.

52
In the same year, Alfantazi and Moskalyk carried out a preliminary study on the use
of conductive polymers, namely polyaniline and poly 3, 4, 5-trifluoro phenythiophene
(TFPT) as protective coatings on lead alloy anodes. The coatings successfully
reduced physical degradation and overpotential of the anodes without hindering the
flow of current. Table 3.2 below shows the conductivities of some conductive
polymers.
Table 3.2: Conductivities of Some Conductive Polymers
POLYMER CONDUCTIVITY (S/cm)
Polyacetylene 102-105 (stretched)
Polythiophene 102-104
Polypyrrole 10-103 (stretched)
Poly-phenylenevinylene 103
Polyaniline 10-150 (heated)
102-103
Poly 1,2,3-ethyldioxythiophene 10-780 (in nanopores) Adopted from “Conductive Polymer Coatings for Anodes in Aqueous Electrowinning” (Alfantazi and Moskalyk, 2003)
Thus as an alternative to DSA anodes, they proposed the application of conductive
polymer coatings on lead alloy anodes. They reported that this would be a cheaper
means of addressing the shortcomings of traditional lead alloy anodes. Hrussanova et
al. (2001) carried out a comprehensive study on the behaviour of the Pb–Co3O4
composite anode in copper electrowinning using synthetic electrolyte (30 g/l Cu in 85
g/l H2SO4). They reported that the Pb–Co3O4 anode had a considerable depolarising
effect on the oxygen evolution reaction compared to commonly used metallurgical
Pb–Sb 5.85% and Pb–Ca 0.08%–Sn 0.74% anodes. As a result, the anode potential
was 40 mV lower than Pb–Sb and about 70 mV lower than the Pb–Ca–Sn anode. The
corrosion rate of the anode during prolonged polarization (96 h) under galvanostatic
conditions was approximately 6.7 times lower than that of Pb–Sb anode. These
authors concluded that the use of a Pb–Co3O4 anode under conditions similar to those
used industrially should cause a decrease in energy consumption.

53
Lead based metal oxide anodes such as the Mesh on Lead (MoL) anodes developed
by Eltech Systems Corporation have also been studied by many researchers. These
anodes utilise conventional lead alloy anodes as the anode substrate, while their
electrocatalytic activity is increased by the addition of electrocatalytic metal oxides to
the lead anode surface. Moats et al. (2003) reported that MoL anodes are very
promising and have lifetimes of 12–16 months in commercial copper electrowinning
tank houses.
After this time the electrocatalytic activity of the anode is lost and oxygen evolution
begins to occur predominantly at the lead anode surface. The reported advantages of
MoL anodes include energy savings of 12-17%, enhanced current efficiency (up to
5%), lower cost compared to dimensionally stable anodes, ease of preparation and as
such they can be prepared on site, reduction in sludge generation and improved
cathode quality (< 1 ppm Pb).
Another anode of interest is the titanium-lead anode (Ti-Pb), which is reported to
have life times of 10 to 12 years. Ferdman (2000) claims that when using this anode,
spalling does not occur and as such lead content in copper cathodes is ten times lower
than that obtained with conventional lead alloy anodes.
It has also been mentioned that anodes with oxide coatings such as IrO2-Bi2O3 are
likely to inhibit MnO2 deposition even with high concentrations of Mn (5 g/l) and are
therefore less susceptible to passivation. Manganese has been reported to form either
soluble species or insoluble manganese dioxide that may passivate the anode surface
and hinder the OER reaction (Kao and Weibel, 1992). Passivation of the anode
surface results in an increase in anode potential. Thus, IrO2-Bi2O3 oxide coatings are
claimed to have high overpotential for the deposition of MnO2 such that this reaction
is practically inhibited at temperatures up to 60 0C (Tuffrey et al., 2006).

54
4 EXPERIMENTAL PROCEDURES
In these investigations, three main tests were performed in order to analyse and
characterise the anode materials being compared. These methods were:
i. Electrochemical tests
ii. Electrowinning tests
iii. Morphological tests
Electrochemical tests were carried out in order to compare stability, corrosion
resistance, and electrocatalytic activities of the lead alloy and dimensionally stable
anodes. Electrowinning tests were done in order to assess cell voltages with the aim
of determining energy consumption, cathode contamination and stability of the same
anode materials. Morphological studies and determination of composition of the
anodes were carried out using a scanning electron microscope and x-ray
diffractometer respectively. All tests were conducted at room temperature unless
stated otherwise.
4.1 Electrochemical tests
4.1.1 Electroanalytical equipment
An Autolab, potentiostat/galvanostat/ (Eco Chemie)/PGSTAT302 was used to obtain
a three-electrode cell configuration for all the electrochemical tests. The control of
the equipment, real time monitoring of experiments and data acquisition were
accomplished by use of General Purpose Electrochemical System 4.9 (GPES)
software, installed on a personal computer as shown in figure 4.1. The
electrochemical cell used in the study was a 500 ml pyrex beaker, covered with a
perspex lid with three guidance holes through which the working electrode (WE),
counter electrode (CE) and reference electrode (RE) could be inserted.

55
A graphite rod and a silver/silver chloride electrode (0.222 V vs Standard Hydrogen
Electrode) were used as the counter and reference electrodes respectively. The
Ag/AgCl reference electrode was positioned as close as possible to the working
electrode in order to minimise ohmic drop due to uncompensated resistance. The base
electrolyte in the RE was a 3 M solution of potassium chloride (3 M KCl).
Figure 4.1: Potentiostat Equipped with a Personal Computer
4.1.2 Electrode preparation
Table 4.1: Anode Type, Supplier and Composition
Anode Type Supplier Composition
Antimonial lead (Pb/Sb) Anglo Platinum 94% lead and 6% antimony
Dimensionally stable anodes (DSAs) DISA Anodes, NMT
Electrodes
Ti-IrO2/Ta2O5
The titanium substrate used in the DSAs was ASTM grade 1. The composition of the
coating was:
- Inner layer:30/70% IrO2-Ta2O5; 10 g/m2, followed by
- Outer layer: 70/30% IrO2- Ta2O5; 10 g/m2
Potentiostat/ Galvanostat

56
The anode pieces were cut to provide a 1 cm2 surface area unless where stated
otherwise. For all DSA mesh anode samples, the true area was taken into
consideration after consultation with other experts in the field.
Conductive wire was taped on the back of each specimen using electrically
conductive tape, before mounting it in epoxy resin. The sample surfaces for lead alloy
anodes to be analysed were ground and polished with silicon carbide paper
successively from 240-grit to 1 000 grit, to ensure complete removal of pits.
However, for the DSA plate anode specimens, only 1 000 grit paper was used to clean
the surface in order to prevent removal of the coating. Microscopic investigations
were done to ensure that the coating was still intact. After grinding and polishing, the
samples were cleaned with deionised water.
4.1.3 Reagents
Table 4.2: Reagents Used
Reagent Supplier Grade Molecular Mass (g/mol)
Concentrated sulphuric acid (H2SO4) Merck a (AR) 98.01
Hydrated copper sulphate (CuSO4.5 H2O) Merck a (AR) 249.69 a AR – Analytical Reagent
4.1.4 Electrolyte solutions
The test electrolytes used in this study were 0.5 M sulphuric acid, synthetic solution
and base metal refinery electrolyte. The 0.5 M H2SO4 was prepared by diluting 28 ml
of concentrated H2SO4 with 1 litre of distilled water. The synthetic solution was
prepared from 216.23 g reagent grade copper sulphate (CuSO4. 5H2O), 100 g
sulphuric acid and 1 litre of distilled water in order to simulate the primary
constituents for industrial operating conditions. Table 4.3 summarises the
concentrations of the two electrolytes used in the electrochemical tests.

57
Table 4.3: Concentrations of Electrolytes Used
Electrolyte Solution Concentration (M)
H2SO4 Cu
H2SO4 0.5 -
Synthetic 1 0.9
Base Metal Refinery 1 0.9
4.1.5 Electrochemical measurements
In this work, the following electrochemical methods were used to monitor the
properties of the anode materials:
(i) open circuit potential
(ii) potentiodynamic polarisation
(iii) cyclic voltammetry
(iv) chronoamperometry
(v) chronopotentiometry (galvanostatic)
(vi) electrochemical impedance spectroscopy.
Prior to carrying out open circuit potential tests, potentiodynamic polarisation, and
galvanostatic chronopotentiometry tests, the lead anode samples were conditioned in
order to replicate a commercial surface by forming a stable lead (IV) dioxide layer on
the oxide. This was done by following a procedure outlined by Cifuentes et al.
(1998). A constant anodic current density of 200 A/m2 was applied over a period of
two and half hours in a solution of 55 g/l Cu, 100 g/l H2SO4 and 120 ppm cobalt (Co).
The cobalt was used to stabilise the oxide layer (Weems et al., 2005).
In the electrochemical impedance spectroscopy tests, initially, 50 consecutive cyclic
voltametry scans were performed on the lead anode followed by 20 minutes of
conditioning prior to the experiments, in order to produce a more stable and
reproducible surface layer (Yu and O’Keefe, 2002).

58
4.1.5.1 Open circuit potential (OCP) measurements
Open circuit potential (OCP) measurements were carried out for a period of two
hours using synthetic solution in order to assess the stability of the anodes under
investigation. The tests also furnished information on the anode material with the
highest corrosion resistance and the redox transitions controlling the surface
electrochemistry of the anodes. The measurements were carried out in synthetic
solution.
4.1.5.2 Potentiodynamic Polarisation
In potentiodynamic polarisation the specimens were polarised in synthetic solution
from 250 mV below the corrosion potential (Ecorr) to a final potential of
approximately 1-1.2 V above Ecorr. A scan rate of 20 mV/s was used. Plots of
potential (volts) against log. current density (A/cm2) were constructed. These
potentiodynamic plots were used to assess:
- corrosion rate of the metal specimens in synthetic solution
- the ability of materials to passivate spontaneously in the synthetic solution and
- the potential region over which the specimen remains passive.
4.1.5.3 Chronopotentiometry (galvanostatic)
Chronopotentiometry tests were carried out in order to evaluate electrode potentials
and chemical stability under galvanostatic conditions in synthetic electrolyte. A
current density of 190 A/m2 (similar to plant conditions) was applied to the
electrochemical cell and the anode potential was recorded with time. The three
electrode arrangement was used, although the graphite rod was replaced with a 316
stainless steel cathode plate of dimensions 12 cm x 2 cm x 1 mm. The cell used was a
500 ml pyrex beaker covered with a perspex lid with three guidance holes through
which the anode, cathode and reference electrode could be inserted. The anode sizes
for this experiment are indicated in table 5.2 as 1 cm2, 1.36 cm2 and 1.90 cm2 for the
lead anode, DSA plate anode and the DSA mesh anode respectively. The active
cathode area used in all these tests was constant. Therefore the cathodic current

59
density was the same for all the experiments. Visual inspection of the copper deposits
was also done while current efficiencies for all the anodes were determined from the
weight gained by the cathodes.
Galvanostatic chronopotentiometry tests were also carried out in base metal refinery
electrolyte and manganese containing synthetic electrolyte in order to assess the
extent to which contaminants in the electrolyte can affect the anode potential or cell
voltage during electrowinning operations.
4.1.5.4 Cyclic Voltammetry (CV)
Cyclic voltammetry tests were performed in order to monitor the surface properties of
metal specimens. The CV tests were also used to determine the potential for oxygen
evolution and assess working area of the electrode materials. The experiments were
performed in 0.5 M sulphuric acid in order to avoid masking of the anode surface by
copper cations.
In each CV experiment, a potential was applied to the system, and the faradaic current
measured over a range of potentials referred to as a potential window. The potential
was varied in a linear manner starting at an initial value up to a pre-defined limiting
value. At this potential, (switching potential) the direction of the potential scan was
reversed, and the same potential window scanned in the opposite direction. Therefore
any species formed on the anode material by oxidation on the first (forward) scan
would probably be reduced on the second (reverse) scan.
Multiple, consecutive scans for the lead alloy specimens were performed at a low
scan rate (2 mV/s). According to Yu and O’Keefe (1999), consecutive CV tests on the
lead anodes at a lower scan rate of 2 mV/s provide more stable, consistent, and
comparable trends. The lead anode curves were generated over potential ranges of 0
to 2 V and -0.5 to 2.2 V; which covered the reactions from metallic lead, Pb0 to Pb
(IV) and oxygen evolution.

60
Voltammetric curves for the DSA anodes (plate and mesh) were recorded between
-0.6 to 1.5 V (the oxygen evolution potential) and measured at a scan rate of 100
mV/s. Nijjer et al. (2001) reported that the anodic peaks for DSA anodes, resulting
from the Ir(III)/Ir(IV) redox transition are clearly visible at scan rates higher than 20
mV/s. Hence beyond 20 mV/s, as scan rate increases much broader peaks are
exhibited.
4.1.5.5 Electrochemical Impedance Spectroscopy (EIS)
EIS was used as a tool for investigating the corrosion phenomena of DSA anode
specimens (plate and mesh) and the lead anode in synthetic electrolyte. The
impedance spectra were initially obtained at open circuit and oxygen evolution
potentials. A single sine wave was used with a perturbation amplitude of 5 mV for the
rest potential measurements. The frequency was swept from 100 mHz to 1 kHz.
Impedance tests were also carried out at different potentials in the region of the
oxygen evolution reaction (OER). Frequency response analyser software (FRA) was
used to analyse the EIS data.
4.1.5.6 Chronoamperometry (< 1s)
Chronoamperometry (< 1s) was carried out in synthetic solution in order to rapidly
characterise the anode materials by reducing the sampling time. This aided in the
assessment of anode activity. A potential step of 1.5 V was used for all the anode
specimens.
4.1.6 Reproducibility
To assess reproducibility of results, a number of experiments were performed for
each test. Some of the raw data and corresponding graphs have been included in the
appendices section.

61
4.2 Electrowinning tests
4.2.1 Equipment
The major equipment used in this work is indicated in table 4.4 below:
Table 4.4: Equipment Used During Electrowinning Tests
Equipment Purpose Technical Data
DC power supply and 3 data
loggers
To supply current to the electrowinning
cell and record cell voltage with time
100 A power supply
3 electrowinning cells Electrowinning 16 litres/cell
3 intermediate bulk containers
(IBCs)
Bulk storage of electrolyte 1 000 litres/container
1 industrial peristaltic pumps For draining the IBCs
165 rpm maximum
1 laboratory scale peristaltic
pump
For electrolyte feed 110 ml/minute
2 electrolyte tanks Storage of fresh and spent electrolyte 200 litres/tank
Titanium mini hot rod, with
temperature control box and
PT100 sensor HALAR
To heat the solution from room
temperature to 55 0C
600 W, 230 V
Thermometer To measure electrolyte temperature -
4.2.2 Electrowinning cell configuration and setup
The electrowinning cells rig shown in figure 4.2 was constructed of polyvinyl
chloride (PVC) material. Each cell measured 0.375 m x 0.12 m x 0.365 m and
contained two cathodes and one anode spaced 2 cm apart. The cells had electrolyte
overflow chambers. Overflow would drain through the outlet ports (figure 4.3) at one
end of the cell into the spent solution tank (Appendix H). Electrolyte was pumped by
a peristaltic pump from the fresh electrolyte tank at a constant flow rate of 110
ml/minute. A four-way valve was then used to divide the flow into three equal

62
streams of flow rate 36.7 ml/minute for the three cells. The total plating cycle was
150 hours which required 330 litres of electrolyte per cell. Thus a total of 990 litres of
solution per plating cycle was used for the experiments. Three Intermediate Bulk
Containers (IBCs) containing the electrolyte were supplied from the Base Metal
Refinery in Rustenburg. Heating rods were used for maintaining the desired
electrolyte temperature (50-55 0C).
Figure 4.2: Electrowinning Cells
The electrodes were connected externally to an electrical circuit (figure 4.3) while the
current was supplied by a DC power supply unit (0-10 V; 0-100 A) to give a constant
current density of 190 A/m2 as shown in figure 4.4. Since the project focused on the
anode, the anode was put into the centre of each cell and the two cathodes on the
outside.
Necessary safety measures which included the use of an emergency switch on the
power supply unit were also put in place in order to ensure safe operation. Real-time
measurements of cell voltage with time were recorded by data loggers for all the three
cells.

63
Figure 4.3: Electrowinning Cells and Auxiliary Equipment
4.2.2.1 Control of pump flow rate
Peristaltic pumps are characterised by unstable pumping rates. However, to ensure
accuracy the following procedures were carried out:
a) The peristaltic pump fitted with its new tubing was operated for half an hour before
calibration. Most tubing materials have a break-in period, during which the shape
memory of the tubing and the fluid flow rate adjust and stabilise. The length of this
break-in period is dependent on the size of tubing and material
(http://www.coleparmer.com).
Curtain
Chemical spillage tray
Cells: A, B, C
Overflow pipes
Inflow pipes
Electrical wiring
Data loggers

64
b) The pump was periodically calibrated by first adjusting the variable speed on the
analog control knob and then using a stopwatch. A 2-litre measuring cylinder was
filled with BMR solution using the peristaltic pump and when the BMR level reached
a predetermined volume (2 litres, 1 litre, 0.5 litres and 0.25 litres), the timer was
stopped and the time recorded was rounded to the nearest second.
Once the electrowinning process had begun, the pump, pumped out BMR solution
from a 200-litre tank. At a flow rate of 110 ml/min and within 24 hours, 158.4 litres
of fluid was depleted from the 200-litre tank which needed to be replaced.
Throughout the experiments, 158.4 litres +/- 500 ml per day were used to fill the tank
to capacity; an indication that the pump was consistently pumping out solution at a
flow rate acceptably close or equal to 110 ml/min.
4.2.3 Suppression of acid mist
Three measures were put in place to ensure the suppression of acid mist.
These are:
Addition of an aluminium foil pipe to the cell fume hood and directing it to
the fume extractor fan as shown in Appendix H.
Making use of curtains as highlighted in Appendix H.
The use of polystyrene beads of diameter approximately 0.3 cm as indicated
in figure 4.5.
Figure 4.4 shows a schematic diagram of the experimental setup.

65
Figure 4.4: Schematic Diagram of Experimental Setup
Figure 4.5: Polystyrene Beads
11/2008

66
4.2.4 Electrodes
Table 4.5: Electrodes and Preparation
Electrodes Material Dimensions
(mm)
Hanger bar
material
Supplier
Cathodes Copper 405 *330 Copper Anglo
Platinum
Anodes
Lead
Alloy
Pb (6% Sb) 405 *330 Copper Castle Lead
Works
DSA 1 Ti- (70%)IrO2/(30%)Ta205 plate
and mesh
405 *330 Titanium DISA Anodes
DSA 2 Ti- (70%)IrO2/(30%)Ta205 plate
and mesh
405 *330 Titanium NMT
Electrodes
The dimensionally stable anodes from DISA Anodes and NMT electrodes were
denoted as DSA 1 and DSA 2 anodes respectively and their performance was
assessed in order to determine the best anode to use in the electrowinning of copper at
Anglo Platinum in comparison to the antimonial lead anode which is currently being
used.
The hanger bars were screwed to the top edge of each electrode in order to establish
electrical connection as shown in figure 4.6. During operation the electrolyte level
was kept constant at 360 mm above the lower edge of the anode.

67
Figure 4.6: Sample anode with a copper hanger bar
4.2.5 Reagents
- Copper feed to the electrowinning cells at base metal refinery (BMR) was used as
the main solution. The solution contained 55 g/l Cu and 100 g/l H2SO4.
- Hydrated copper sulphate solution was used to prepare standards to calibrate the
Atomic absorption spectrometer.
After electrolysis, the cathodes were removed and thoroughly washed with tap water
followed by distilled water and air dried after washing it in acetone. The current
efficiency was calculated from the weight gained by the cathodes using equation
2.22:
( )ItM
WnFIc∆
=ε …………………………………………………………………….2.22
360 mm 405 mm
11/2008

68
Where,
W∆ - Weight gained by the cathode.
F - Faraday’s constant.
I - Applied current
M - Atomic weight of copper
t - Time taken for the copper to be deposited
n – Number of electrons participating in the reaction (2 electrons)
4.2.6 Analytical equipment
In the study an atomic absorption spectrometer (AAS) was used to periodically
analyse the copper concentration in the overflow solution. An inductively coupled
plasma (ICP) and inductively coupled plasma-mass spectrometer (ICP-MS) were also
used to provide a compositional analysis of the base metal refinery electrolyte.
4.2.7 Equipment Design
4.2.7.1 Pump sizing
Calculations for pump sizing were carried out initially by assuming, 90% current
efficiency and using equations 2.22 and 4.1 as shown in Appendix A.
IMWnFt
ε∆
= …………………………………………………………………………2.22
tVQ = ………………………………………………………………………………4.1
Where, V - volume of solution per cell
t - time taken for the copper to be deposited (from equation 2.22)
Q- flowrate of the electrolyte per cell

69
The spreadsheet supplied by Anglo Platinum (Appendix B) was then used to validate
the result.
4.2.7.2 Heater sizing
The following equations supplied by Hi-tech Elements were used in the sizing of the
heating rods. Calculations on the sizing of the heating rods are shown in Appendix C.
a) Calculation of the power required to heat the solution and container:
htTmcP
*860∆
= …………………………………………………………………………4.2
Where,
P- power (kW)
m- mass (kg)
c- specific heat capacity (kcalories/kg0C)
T∆ - temperature rise (0C)
ht - heat-up time (hours)
b) Calculation of the power required to heat the container:
- Same as equation 4.2.
c) Calculation of the power required to overcome heat losses:
Heat losses are governed by the installation; that is, indoors, outdoors, thermal
insulation and in most cases between 10-20% of the sum of steps (a) and (b) above is
sufficient. In the study, heat losses were assumed to be 20%, which gives a good
overdesign factor.
Therefore the total power rating of the heater is given by the sum of steps (a), (b) and
(c).
70
4.3 Physical characterisation
4.3.1 Scanning electron microscope (SEM) and energy dispersive spectroscopy, EDS
Surface morphology and elemental composition of the DSAs and antimonial lead
were analysed using a JSM-840 (JEOL) scanning electron microscope, with energy
dispersive spectroscopy (EDS). Morphological studies were carried out in order to
establish the relationship between surface morphology and anode behaviour. EDS
analysis was performed in order to determine the elemental compositions of the anode
materials. The operating voltage of the electronic beam was 20 keV for both
morphological studies and EDS analysis.
4.3.2 X-ray diffractometer
Compositional analysis of the anode materials and crystallographic orientation of the
copper deposits from electrowinning were done using a Philips-PW1710, X-ray
diffractometer with a copper K-alpha as anode. The generator settings were set at 40
kV and 50 mA. The start and end angles were 200 and 800 respectively for the
continuous scan while the scan step time was 1 second. Xpert Highscore Software
was then used to match the resulting peaks.
4.3.3 Visual inspection
Visual inspection of cathodes was carried out after the experiments. This assisted in
assessing the physical appearance of the copper deposits.

71
5 RESULTS AND DISCUSSIONS
5.1 Comparison of anode materials: Electrochemical Investigations
5.1.1 Open circuit potential measurements
Open circuit potential (OCP) measurements were carried out in order to assess the
stability of the anodes under investigation. The tests also furnished information on the
anode material with the highest corrosion resistance and the redox transitions
controlling the surface electrochemistry of the anodes. Figure 5.1 shows the graphs
for open circuit potential measurements for the DSA anodes and lead anode. The
experiments were conducted within a period of two hours each.
Figure 5.1: OCP Graphs for Ti-IrO2/Ta2O5 Plate, Ti-IrO2/Ta2O5 Mesh and Pb/Sb in 55 g/l Cu
and 100 g/l H2SO4 at Room Temperature (rt).
Open Circuit Potential Measurement in Synthetic Electrolyte
0.05
0.1
0.15
0.2
0.25
0.3
0.35
0.4
0.45
0.5
0 1000 2000 3000 4000 5000 6000 7000 8000Time (sec.)
Pote
ntia
l vs A
g/A
gCl (
V)
a. Antimonial lead b. DSA Plate c. DSA Mesh
b
c
a

72
The results indicate that for the DSA plate, there is initially a sharp decrease in
potential from 0.49 V to 0.45 V, within the first 200 s, after which the potential
stabilizes for the remaining duration of the measurement. The initial decrease in OCP
can be attributed to the erosion of coating particles that are weakly bonded to the
substrate once there is interaction between the electrolyte and the anode (Martelli et
al., 1994). For the DSA mesh anode, the potential is shifted more rapidly towards the
nobler potentials from 0.33 V to 0.41 V within the first 3750 seconds and then tends
to stabilise. For the antimonial lead specimen, there is a small increase of the potential
from 0.08 V to 0.10 V for the whole duration of the experiment.
It can be observed that the DSAs showed differences in behaviour despite being of
similar composition. However, it would not be possible to relate the differences in
behaviours to the mechanisms of these anodes since there was not enough
information about their manufacture. The manufacturers were not at liberty to
disclose this information. Despite this, the purpose of the investigation, which was to
establish if these DSA anodes (plate and mesh) had different behaviours and if so, to
what extent, was achieved.
Figure 5.1 also shows that the DSA anodes have nobler potentials compared to the
lead alloy anode with the DSA plate having the largest average Eoc value of 0.44 V.
These results suggest that the DSA plate has the highest corrosion resistance followed
by the DSA mesh and lastly the lead alloy anode.
Eoc measurements also provide information about the electrodes surface active sites.
Comparison of the Eoc-data with the theoretical value of the standard potential of the
solid-state transitions present in the coating suggests that the surface electrochemistry
for the DSA anodes could be controlled by hydrated Ir(III)/Ir(IV) redox transition
(Alves et al., 1998).
2 IrO2 + 2H+ + 2e ⇔ Ir2O3 + H2O E0 = + 0.6 V versus SHE ……………………5.1

73
The surface electrochemistry for the lead anodes can be said to be controlled by the
Pb/Pb(II) redox transition.
Pb + SO4²¯ → PbSO4 + 2e- + H+ E0 = + 0.356 V versus SHE …………………5.2
5.1.2 Potentiodynamic polarisation
Potentiodynamic polarisation was used to determine the corrosion rate of the anodes
in synthetic electrolyte. Figure 5.2 shows the potential against log. current graphs
used in the evaluation of cathodic and anodic Tafel constants and corrosion rate.
Figure 5.2: Tafel Plots for DSA and Lead Alloy Anodes in Synthetic Electrolyte
Tafel Plots in Synthetic Electrolyte
-0.4
-0.2
0
0.2
0.4
0.6
0.8
1
1.2
0.0001 0.001 0.01 0.1 1
Log. current density (A/cm2)
Pote
ntia
l vs
Ag/
AgC
l (V
)
b. DSA Plate a. Antimonial Lead c. DSA Mesh
bca

74
Unlike the lead alloy and DSA mesh anodes, the DSA plate does not show
passivation tendencies, in the potential range of -0.4 V to 1.2 V despite it having the
same composition as the mesh anode. Only the active and pseudo-passive behaviour
is evident. However, in the potential range of -0.4 V to 1.4 V the DSA plate anode
also shows active-passive behaviour as shown in figure 5.3 below.
Figure 5.3: Tafel Plots for DSA Plate in the Potential range 0.4 V to 1.2 V and -0.4 V to 1.4 V in
Synthetic Electrolyte.
There has been no documented data on the behaviours of dimensionally stable mesh
and plate anodes. However, despite the two anodes having similar chemical
composition, the differences in behaviour may be attributed to the adhesion of the
coating, which in plate anodes could probably be higher than in mesh anodes. As a
result mesh anodes are likely to passivate earlier than plate anodes under the same
operating conditions.
-0.6
-0.4
-0.2
0
0.2
0.4
0.6
0.8
1
1.2
1.4
1.6
0.0001 0.001 0.01 0.1 1
Pote
ntia
l vs A
g/A
gCl (
V)
Log. current density (A/cm2)
Tafel Plots in Synthetic Electrolyte
DSA plate (-0.4 V to 1.2 V) DSA plate (-0.4 V to 1.4 V)

75
The passivation of the DSA anodes is attributed to the formation of a thin, insulating
layer of TiO2 at the interface between the metallic base and the active coating. The
passivation is also indicative of coating consumption which exposes the titanium
substrate to the electrolyte.
Table 5.1 shows that the lowest corrosion rate (maximum polarisation resistance) was
observed for the DSA plate anode followed by the DSA mesh anode and lastly the
lead anode, which is in agreement with open circuit potential measurements. The
corrosion rates for the lead and DSA mesh anodes were 210% and 197% greater than
the corrosion rate for the DSA plate anode.
The high corrosion rate of the lead anode shows that the anode is associated with the
problem of physical degradation which has an adverse effect on anode life and
cathode purity (Weems et al., 2005). For the DSA mesh anode, more area is available
for corrosion to occur due to the anode’s large working area, hence the high corrosion
rate.
Table 5.1: Linear Polarisation Parameters
Anode Material DSA Plate DSA Mesh Lead Alloy (Pb/Sb)
corri (A) 7.434E-5 1.031E-3 1.13E-4
Ecorr, obs. (V) 0.088 0.082 0.090
I (A/cm2) 9.29E-5 2.75E-4 1.13E-4
cβ (V/dec) 0.0034 0.0220 0.0031
aβ (V/dec) 0.0081 0.0800 0.0076
pR (ohm) 13.89 3.61 8.46
Begin potential 0.088 0.079 0.091
End potential (V) 0.093 0.089 0.096
Equivalent weight (g) 11.97 11.97 99.41
Density (g/cm3) 4.54 4.54 14.82
Corrosion rate (mm/year) 0.80 2.37 2.48

76
Table 5.1 also shows that the anodic ( aβ ) and cathodic ( cβ ) Tafel constants for the
DSA mesh anode were an order of magnitude greater than those for the DSA plate
and lead anodes. These higher Tafel constant values may have been due to surface
film formation on the DSA mesh anode as a result of passivation. This resulted in
high film resistances being encountered at the electrolyte/electrode interface (Kear
and Walsh, 2005). The lead anode was associated with low Tafel constants while for
the DSA plate anode, no passivation layer was detected as indicated in figure 5.2.
5.1.3 Chronopotentiometry (galvanostatic)
Figure 5.4: Anode potential-time curves for Pb-6% Sb and Ti-Ta2O5/IrO2 (plate and mesh) in 55
g/l Cu and 100 g/l H2SO4 at 190 A/m2
Anode Potential against Time
0
0.5
1
1.5
2
2.5
0 1000 2000 3000 4000 5000 6000 7000 8000
Time (s)
Ano
de p
oten
tial v
s Ag/
AgC
l (V
).
c. DSA mesh b. DSA plate a. Antimonial Lead
b
a
c

77
Figure 5.4 compares the performance of the DSA anodes (Ti-Ta2O5/IrO2) and the
traditional Pb-6%Sb under oxygen evolution conditions. Since in the entire
investigation the bath composition, temperature, electrode distance, current density
and cathode material were kept constant, the differences observed in the anode
potentials may be attributed to the nature of these anode materials.
In this study, the lead anode is found to be associated with the highest anode potential
of 1.97 V. This may be due to higher oxygen over-potential with this anode material.
When the anode potentials for the DSA plate and mesh anodes were compared with
that of the lead anode they were found to be 19% and 24% lower, respectively. Anode
potential is a major component of the cell voltage, also making it a significant cost
issue in the electrowinning process. Thus, if lead anodes are replaced by DSA anodes
which have low anode potentials, energy savings around 19% to 24% could be
realised. The anode potentials for the DSA anodes were observed to increase with
time until they reached constant values while that for the lead anode decreased until it
also attained a constant potential. For both DSA anodes, this can be a result of some
erosion of the porous outer layer of the active coating due to intense oxygen evolution
(Mraz and Krysa, 1994) while for the lead anode this could be attributed to the
passive film of PbO2.
5.1.3.1 Determination of current efficiency
Current efficiency was also determined in each of the three cells from the weight
gained by the cathode as indicated by equation 2.22 below:
( )ItM
WnFIc∆
=ε ………………………………………………………………2.22
Where,
cε - Cathode current efficiency.
W∆ - Weight gained by cathode.
F - Faraday’s constant.
I - Applied current
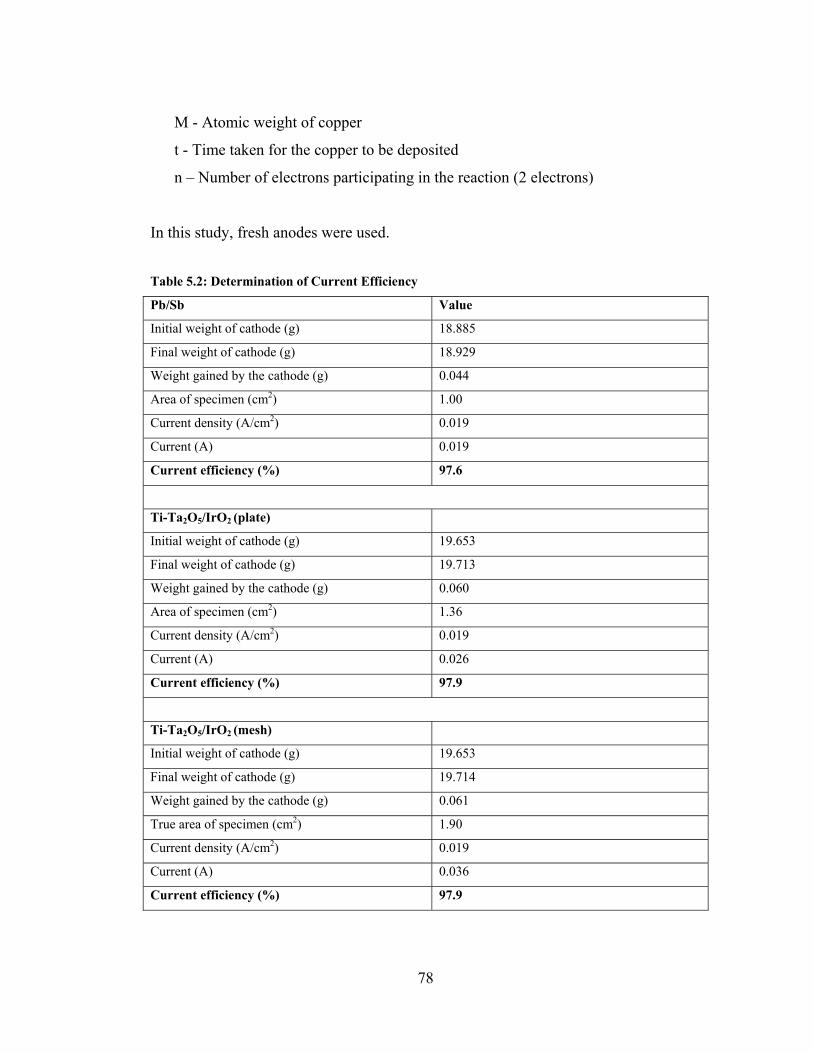
78
M - Atomic weight of copper
t - Time taken for the copper to be deposited
n – Number of electrons participating in the reaction (2 electrons)
In this study, fresh anodes were used.
Table 5.2: Determination of Current Efficiency
Pb/Sb Value
Initial weight of cathode (g) 18.885
Final weight of cathode (g) 18.929
Weight gained by the cathode (g) 0.044
Area of specimen (cm2) 1.00
Current density (A/cm2) 0.019
Current (A) 0.019
Current efficiency (%) 97.6
Ti-Ta2O5/IrO2 (plate)
Initial weight of cathode (g) 19.653
Final weight of cathode (g) 19.713
Weight gained by the cathode (g) 0.060
Area of specimen (cm2) 1.36
Current density (A/cm2) 0.019
Current (A) 0.026
Current efficiency (%) 97.9
Ti-Ta2O5/IrO2 (mesh)
Initial weight of cathode (g) 19.653
Final weight of cathode (g) 19.714
Weight gained by the cathode (g) 0.061
True area of specimen (cm2) 1.90
Current density (A/cm2) 0.019
Current (A) 0.036
Current efficiency (%) 97.9

79
Table 5.3: Effect of anode substrates on anode potential and deposit morphology
Electrode material
Anode potential
(V)
Cathode Current
Efficiency (%)
Deposit morphology
DSA plate 1.67, 1.67a 97.9 Bright, smooth, compact
DSA mesh 1.50, 1.51a 97.9 Bright, smooth, compact
Antimonial Lead 1.96, 1.95a 97.6 Dull, adheres to the surface
Cu concentration, 55 g/L; H2SO4 concentration, 100 g/L; current density, 190 A/m2 ; bath temperature,
55 0C; duration of electrolysis, 2 h.
a Data obtained in 1 h of electrolysis.
The results from tables 5.2 and 5.3 indicate that there is an insignificant difference
between all the anodes in terms of initial current efficiency in synthetic electrolyte.
These results are substantiated by the work reported by Panda and Das (2001).
5.1.3.2 Electrolyte contamination
The electrode stability was also evaluated under galvanostatic conditions in 55 g/l Cu
and 100 g/l H2SO4. The electrolytes were analysed for lead, titanium, iridium and
tantalum contamination after two hours of galvanostatic chronopotentiometry using
the Atomic Absorption Spectrometer. The results are shown in tables 5.4 and 5.5
below for the three runs carried out.
Table 5.4: Concentration of Lead in the Electrolyte and Standard Deviations
SAMPLE No.
Run 1 Run 2 Run 3
CONCENTRATION (ppm)
1 8.8 8.5 8.5
2 6.8 7.0 6.8
3 7.1 6.9 7.3
AVERAGE 7.6 7.5 7.5
STANDARD
DEVIATION
0.9 0.7 0.7

80
Table 5.5: Concentrations of Titanium, Tantalum and Iridium in the Electrolyte
SAMPLE 1 (containing DSA plate anode) 2 (containing DSA mesh anode)
CONCENTRATION (ppm)
ELEMENT Ti Ta Ir Ti Ta Ir
Run 1 0.017 0.001 0.003 0.015 0.000 0.004
Run 2 0.017 0.001 0.003 0.015 0.000 0.004
Run 3 0.017 0.001 0.003 0.016 0.000 0.004
AVERAGE 0.017 0.001 0.003 0.015 0.000 0.004
The results in table 5.4 indicate that during electrowinning of copper using lead alloy
anodes, anodic dissolution of lead occurs. The lead ions in solution are most likely to
result in cathode contamination when they form lead sulphate which in turn attaches
to the growing copper deposit. Dissolution of the lead alloy anodes may also
contribute to a reduced life span for the anodes and varying current distribution due to
changing electrode thickness and flatness. The resultant lead sludge that must be
removed from the cells and handled with environmental constraints is also a major
environmental problem.
From table 5.5 the presence of traces of tantalum (coating stabiliser) and iridium
(active component) shows that during electrowinning operations using DSA anodes,
some loss of coating occurs. The amount of iridium loss is 3 times greater than the
tantalum loss. This is attributed to the high stability of tantalum in the coating. Traces
of the titanium substrate were also detected in the samples analysed. The amount of
iridium loss in the electrochemical cell containing the DSA mesh anode was 33%
greater than the iridium loss in the cell containing the DSA plate specimen. This can
be attributed to the large electrochemically active surface area (EASA) characteristic
of mesh anodes. A greater EASA, results in more area being available for corrosion.
Hu and co-workers (1996) investigated the degradation mechanism of the Ti - (70%)
IrO2/ (30%) Ta2O5 anodes in H2SO4 and found out that the deactivation mechanism of

81
these anodes during electrolysis was in three stages, namely; active, stable and de-
active. In the first two stages, the dissolution of the coating dominated (with IrO2
component preferential loss over Ta2O5).
5.1.4 Cyclic voltammetry
Cyclic voltammetry was carried out in order to assess the surface characteristics and
determine the electrochemically active surface area (EASA) for the anodes. The
voltammetric charge, obtained usually by integration between hydrogen and oxygen
gas evolution region of a cyclic voltammetric curve, has been proven to be
proportional to the EASA of metal oxide electrode, and thought to be able to
represent the number of electrochemically active sites (Hu et al., 1996).
5.1.4.1 Cyclic voltammograms for lead anodes
For the lead anode, curves were generated over a potential range of 0 to 2 V and -0.5
to 2.2 V; ranges that cover the reactions from metallic lead, Pb0 to Pb (IV) and
oxygen evolution in 0.5 M sulphuric acid. Figure 5.5 and 5.6 characterise the
electrochemical behaviour of Pb–Sb anodes in synthetic electrolyte at a scan rate of
2 mV/s.
All curves show two anodic peaks at scanning in a positive direction while only
figure 5.5 shows two cathodic peaks at scanning in the negative direction. The first
process which takes place is the anodic dissolution of lead and formation of a PbSO4
layer, which has passivating properties, followed by a wide passive region. As the
anodic potential increases to about 1.75 V, lead (IV) oxide forms at the surface of the
electrode, and with a further increase in the potential, O2 evolution commences
around 1.9 V. Oxygen evolution intensifies with the increase in cycle number. The
cathodic peak which appeared at 1.4 V in the reverse scan could be attributed to the
reduction of PbO2 formed on the surface, back into PbSO4. For figure 5.5, another

82
small cathodic peak is evident at -0.5 V. This is attributed to the reduction of PbSO4
to Pb.
Figure 5.5: Cyclic Voltammograms for the Lead Alloy Anode in the Potential Range
-0.5 to 2.2 V.
Multiple, Consecutive CV Scans for Unused Antimoial Lead Anode
-5.00E-02
0.00E+00
5.00E-02
1.00E-01
1.50E-01
2.00E-01
2.50E-01
-1.00E+00 -5.00E-01 0.00E+00 5.00E-01 1.00E+00 1.50E+00 2.00E+00 2.50E+00
Potential vs Ag/AgCl (V)
Cur
rent
Den
sity
(A/c
m2 )
Scan 1Scan 2Scan 3Scan 4Scan 5Scan 6Scan 7Scan 8Scan 9Scan 10
PbO2 PbSO4
PbSO4 Pb
H2O O2
PbO2PbSO4

83
Figure 5.6: Cyclic Voltammograms for the Lead Alloy Anode in the Potential Range 0 to 2.2 V.
5.1.4.2 Cyclic voltammograms for DSA anodes
Voltammetric curves for these anodes were recorded between -0.6 to 1.5 V in 0.5 M
sulphuric acid at a scan rate of 100 mV/s.
Multiple, Consecutive Scans for Unused Antimonial Lead
-2.00E-02
-1.50E-02
-1.00E-02
-5.00E-03
0.00E+00
5.00E-03
1.00E-02
1.50E-02
2.00E-02
2.50E-02
0 0.5 1 1.5 2 2.5
Potential vs Ag/AgCl (V)
Cur
rent
den
sity
(A/c
m2 )
Scan 1 Scan 2 Scan 3 Scan 4 Scan 5 Scan 6 Scan 7 Scan 8
H2O
PbSO4
PbO2 PbSO4
PbO2
O2

84
Figure 5.7: Cyclic Voltammograms for Ti/IrO2-Ta2O5 Electrodes in 0.5 M H2SO4 at a Scan Rate
of 100 mV/s.
Figure 5.7 shows the CV curves for DSA mesh and plate anodes in 0.5 M H2SO4
solution. These curves were recorded in the potential range -0.6 to 1.5 V (the oxygen
evolution potential). It can be seen that the CV curves have a similar shape. Several
current peaks are present in both voltammograms. The anodic peak at a potential of ≈
1.5 V is due to the oxygen evolution reaction, while the cathodic peak at a potential of
about –0.6 V is indicative of intensive hydrogen evolution. A pair of peaks observed
at potentials between 0.3 and 0.5 V for the DSA mesh is likely to be a result of the
redox transition, Ir(III)/Ir(IV) while for the DSA plate a smaller current peak
appearing around 0.5 V is also attributed to the same redox transition as that of the
mesh. The broad nature of these peaks is attributed to the heterogeneity of the surface
active sites on the electrodes.
5.1.4.3 Electrochemically active surface area for the anode specimens
Table 5.5 below shows the voltammetric charges q* measured at a scan rate of 20
mV/s for the three anode specimens; in the potential range 0 to 1.5 V.
Cyclic Voltammogram for DSA Plate in 0.5 M H2SO4
-1.50E-02
-1.00E-02
-5.00E-03
0.00E+00
5.00E-03
1.00E-02
-1 -0.5 0 0.5 1 1.5 2
Potential vs Ag/AgCl
Cur
rent
Den
sity
(A/c
m2 )
Cyclic Voltammogram for DSA Mesh in 0.5 M H2SO4
-6.00E-02
-3.00E-02
0.00E+00
3.00E-02
6.00E-02
-1 -0.5 0 0.5 1 1.5 2
Potential vs Ag/AgCl (V)C
urre
nt D
ensit
y (A
/cm
2 )

85
The mesh has the greatest value of q*. Since the voltammetric charge has been
proven to be proportional to the EASA of metal oxide electrode, and thought to be
able to represent the number of electrochemically active sites, the results in table 5.6
indicate that the mesh has the largest working area for oxygen evolution. This may be
attributed to its structure. In electrode processes, a larger working area results in
increased catalytic activity. The high activity facilitates lowering of the effective
current density, resulting in reduced anode potential (Kulandaisamy et al., 1997).
Table 5.6: Voltammetric Charges for the Anode Specimens
Anode Specimen q*(mC/cm2)
Ti/IrO2-Ta2O5 Plate 51
Ti/IrO2-Ta2O5Mesh 226
Pb/ 6 % Sb 26
5.1.4.4 Effect of continuous cycling on voltammetric charge
Figures 5.8, 5.9 and 5.10 show the variation of voltammetric charge with continuous
cycling for the DSA mesh and plate and the lead anode specimens respectively.
The voltammetric charge q*, calculated by graphical integration of the CV curves in
figure 5.7 in the range between 0 and 1.5 V, increases with cycling time. In the first
40 cycles for the plate and 20 cycles for the mesh, q* increases, after which there is
little change in the voltammetric charge. This suggests that after these cycles, the
DSA anode specimens attain a stable condition.
Xu and Scantlebury (2003) reported that such behaviour is typical of stable oxide
electrodes. The increase in q* is attributed to the further hydration and activation of
the inside pores or microcracks which are not activated in the first few cycles. The
cracked, porous structure of the oxide coating is shown on the SEM micrograph in
figure 5.23. Of the two DSA anodes, figure 5.8 indicates that the mesh stabilises
faster (after 20 cycles) since it has a greater EASA which consequently results in
shorter hydration time of the inner layer.

86
Figure 5.8: Change of Voltammetric Charge of the DSA Mesh Specimen with Continuous
Cycling.
Figure 5.9: Change of Voltammetric Charge of the DSA Plate Specimen with Continuous
Cycling.
Change of Voltammetric Charge of the DSA Mesh Specimen with Continuous Cycling
212
213
214
215
216
217
218
219
220
221
222
5 10 15 20 25 30 35 40 45 50
Cycle No.
q* (m
C/c
m2 )
Chnage of Voltammetric Charge of the DSA Plate Specimen with Continuous Cycling
56.5
57
57.5
58
58.5
59
59.5
60
0 10 20 30 40 50 60Cycle No.
q* (m
C/c
m2 )

87
Figure 5.10: Change of Voltammetric Charge of the Lead Anode Specimen with Continuous
Cycling.
The voltammetric charge q*, calculated by graphical integration of the CV curve in
figure 5.6 in the range between 0 and 2.0 V, also increases with cycling times for the
lead anode specimen. In the first 15 cycles there is a rapid increase in q*, after which
there is a steady continuous increase in voltammetric charge which can be attributed
to the formation of a passive film of porous lead (ІV) oxide as cycling progresses.
5.1.4.5 Determination of double layer capacitance
The value of the double layer capacitance (Cdl) depends on many variables including
electrode potential, temperature, ionic concentrations and types of ions, oxide layers
and electrode roughness. For the DSA anode materials the double layer capacitance
was determined by evaluating the slopes of the graphs of current density against scan
rate at a fixed potential at which no main redox transitions occurred on the surface,
according to the method proposed by Xu and Scantlebury (2003). In this study a
potential of 1.0 V vs Ag/AgCl was selected to give the graphs below.
Change of Voltammetric Charge of the Lead Anode Specimen with Continuous Cycling
4
6
8
10
12
14
16
18
20
5 10 15 20 25 30 35 40Cycle No.
q* (m
C/c
m2 )

88
Figure 5.11: Relationship between Current Density and Scan Rate at a Fixed Potential of 1.0 V
for Ti/ IrO2-Ta2O5 and Pb/Sb Anodes.
Figure 5.11 above indicates that a linear relationship exists between current density
and scan rate for the DSA anodes. For the lead anode specimen, the relationship
between current density and scan rate showed a large deviation from linearity and for
this reason, the double layer capacitance, Cdl was replaced by the constant phase
element (CPE). Similarly to the anodic charge, q*, the DSA mesh has a higher double
layer capacitance and as such Cdl can be used to describe the EASA of each anode. A
linear relationship has been found to exist between the anodic charge q, and the
double layer capacitance, Cdl as indicated in figure 5.12 (Xu and Scantlebury, 2003).
Relationship between Current Density and Scan Rate at 1.0 V
0
0.5
1
1.5
2
2.5
0 50 100 150 200 250
Scan Rate (mV/s)
Cur
rent
Den
sity
(mA
/cm
2 )
a. DSA Plate b. DSA Mesh c. Lead
b
a
c

89
Figure 5.12: Typical Graph of Anodic Charge, q* against Double Layer Capacitance, Cdl for a
DSA Anode.
The roughness factor was also evaluated for the DSA anode specimens by dividing
the values of the double layer capacitance with 60 µFcm-2. This is the value for a
smooth and compact TiO2 film with a rutile structure (Lassali et al., 1997). Table 5.7
shows the capacitances and roughness factors for the DSA anodes. The RF value for
the Ti/IrO2-Ta2O5 mesh is 60% greater than that of the Ti/IrO2-Ta2O5 plate. This
suggests that both porous morphology and the structure of oxide anodes have an
influence on the surface roughness and consequently the electrochemically active
surface area. RF values in the range 83-395 for the oxide electrodes have been
reported by Xu and Scantlebury (2003).
Table 5.7: Double Layer Capacitance and Roughness Factor for DSA Anodes
Electrode Cdl (mFcm-2) Roughness factor
(RF)
Ti/IrO2-Ta2O5 plate 8.0 133
Ti/IrO2-Ta2O5 mesh 12.8 213
Graph of Anodic Charge, q* against Double Layer Capacitance, Cdl
8
9
10
11
12
13
50 70 90 110 130 150 170 190 210 230
Double Layer Capacitance (Cdl)
Ano
dic
Cha
rge
(q*)
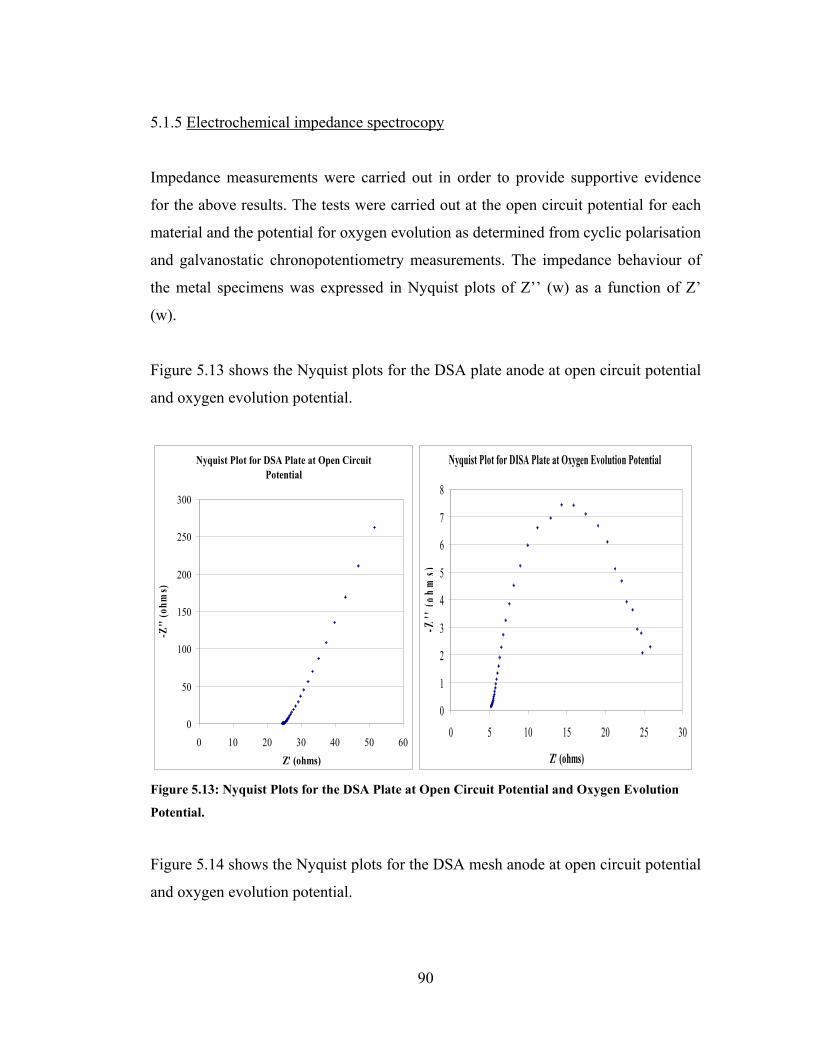
90
5.1.5 Electrochemical impedance spectrocopy
Impedance measurements were carried out in order to provide supportive evidence
for the above results. The tests were carried out at the open circuit potential for each
material and the potential for oxygen evolution as determined from cyclic polarisation
and galvanostatic chronopotentiometry measurements. The impedance behaviour of
the metal specimens was expressed in Nyquist plots of Z’’ (w) as a function of Z’
(w).
Figure 5.13 shows the Nyquist plots for the DSA plate anode at open circuit potential
and oxygen evolution potential.
Figure 5.13: Nyquist Plots for the DSA Plate at Open Circuit Potential and Oxygen Evolution
Potential.
Figure 5.14 shows the Nyquist plots for the DSA mesh anode at open circuit potential
and oxygen evolution potential.
Nyquist Plot for DSA Plate at Open Circuit Potential
0
50
100
150
200
250
300
0 10 20 30 40 50 60Z' (ohms)
-Z''
(ohm
s)
Nyquist Plot for DISA Plate at Oxygen Evolution Potential
0
1
2
3
4
5
6
7
8
0 5 10 15 20 25 30
Z' (ohms)
-Z''
(ohm
s)

91
Figure 5.14: Nyquist Plots for the DSA Mesh Anode at Open Circuit Potential and Oxygen
Evolution Potential.
It can be noted that the Nyquist plots for the DSAs are similar in shape.
Figure 5.15 shows the Nyquist plots for the lead anode at open circuit potential and
oxygen evolution potential.
Nyquist Plot for DISA Mesh
0
5
10
15
20
25
30
35
40
0 2 4 6 8 10
Z' (ohms)
-Z''
(ohm
s)
Nyquist Plot for DSA Mesh at Oxygen Evolution Potential
00.10.20.30.40.50.60.70.80.9
1
0 1 2 3 4 5
Z' (ohms)-Z
''(o
hms)

92
5.15: Nyquist Plots for the Lead Anode at Open Circuit Potential and Oxygen Evolution
Potential
Tables 5.8 and 5.9 give the equivalent circuit parameters evaluated from the Nyquist
plots for all the anodes.
Table 5.8: Equivalent Circuit Parameters for DSA Plate and Mesh Anodes and the Lead Anode
at Open Circuit Potential
Anode Potential (V) Rp (ohm) CPE (F) n
DSA plate 0.72 1.33*104 5.90*10-7 1.08
DSA mesh 0.36 2.76*103 1.98*10-6 1.56
lead 0.08 5.24*102 1.67*10-7
0.23
Table 5.9: Equivalent Circuit Parameters for DSA Plate and Mesh Anodes and the Lead Anode
at Oxygen Evolution Potential
Anode Ep (V) Rs (ohm) Rp (ohm) CPE (F) n
DSA plate 1.50 0.51*101 2.19*101 9.26*10-3 0.60
DSA mesh 1.50 5.90*10-1 0.33*101 1.32*10-2 0.67
lead 1.96 0.48*101 0.87*101 7.76*10-4 0.15
0
5
10
15
20
25
30
35
40
0 20 40 60 80 100
-Z''
(o
hm
s)
Z' (ohms)
Nyquist Plot for Lead at Open Circuit Potential
0
0.2
0.4
0.6
0.8
1
1.2
0 2 4 6 8 10-Z
'' (
oh
ms)
Z' (ohms)
Nyquist Plot for Lead at Oxygen Evolution Potential

93
Eoc – open circuit potential in volts.
Ep – passivation potential in volts.
Rs – solution resistance in ohms.
Rp – polarisation resistance in ohms.
It can be seen from the tables that the polarisation resistance for all the anodes are
higher at the open circuit potential compared to the oxygen evolution potential. This
indicates that an unused anode in the case of lead anodes or an anode covered with an
undamaged or fresh coating in the case of DSAs generally has very high corrosion
resistance. At both potentials at which EIS studies were carried out, the polarisation
resistance measured with the help of Nyquist plots clearly confirms the superior
performance of the DSA plate anode with respect to its corrosion resistance over the
DSA mesh and lead anodes.
Comparing the polarisation resistances in tables 5.1, 5.8 and 5.9, it can be observed
that the resistances from linear polarisation tests in table 5.1, differ by orders of
magnitude with those evaluated at open circuit potential (table 5.8) while they are of
the same order with the resistances evaluated at the oxygen evolution potential (table
5.9). This is an indication that when investigating the polarisation resistance of an
anode at the oxygen evolution potential, linear polarisation can also be used.
The variation of the constant phase element, CPE and surface roughness, n in tables
5.8 and 5.9 determined from impedance plots shows that the DSA mesh has the
greatest working area among the three anode materials tested. These results are also
in agreement with the values of double layer capacitance, Cdl and roughness factor
shown in table 5.7.
CPE (in Farads) is the constant phase element that depicts the double layer
capacitance including surface roughness (Qdl,n).
n – surface roughness

94
Impedance tests were also carried out at different potentials in the region of the
oxygen evolution reaction. The influence of the potentials on the complex plane plots
is shown in figures 5.16, 5.17 and 5.18.
Figure 5.16: Nyquist Plots for a Ti/IrO2-Ta2O5 Plate Anode in Synthetic Electrolyte.
Figure 5.17: Nyquist Plots for a Ti/IrO2-Ta2O5 Mesh Anode in Synthetic Electrolyte.
Nyquist Plots for a DSA Plate
0
5
10
15
20
2530
35
40
45
50
0 20 40 60 80 100 120
Z' (ohms)
Z''
(ohm
s)
1.35 V 1.4 V 1.5 V
Nyquist Plots for a DSA Mesh
0
0.5
1
1.5
2
2.5
3
3.5
4
0 2 4 6 8 10Z' (ohms)
Z''
(ohm
s)
1.35 V 1.4 V 1.45 V

95
Figure 5.18: Nyquist Plots for a Pb/Sb Anode in Synthetic Electrolyte
The analysis of the low frequency domain of the impedance spectra for all the anodes
shows a marked decrease in charge transfer, Rct for oxygen evolution as the potential
increases. The resistances are in the region of 120 Ω, 60 Ω and 40 Ω at potentials of
1.35 V, 1.40 V and 1.45 V respectively, for the plate. For the mesh, the resistances
decrease in the order 10 Ω, 4 Ω and 2 Ω as potential increases while for the lead
anode the resistances are in the region of 25 Ω, 10 Ω and 8 Ω. Comparing the values
of Rct for these anodes, the mesh has the lowest Rct values. This may be attributed to
better catalytic performance of the mesh as a result of its greater EASA.
0
0.2
0.4
0.6
0.8
1
1.2
1.4
1.6
0 5 10 15 20 25 30
-Z'' (
ohms
)
Z' (ohms)
Nyquist Plot for Antimonial Lead
1.96 V 1.86 v 1.81 V

96
5.1.6 Chronoamperometry (<1s)
Figure 5.19: Chronoamperometry Tests in Synthetic Electrolyte
Chronoamperometry (1s) was used for the rapid characterisation of the three anodes.
The results in synthetic electrolyte show that upon applying a potential step of 1.5 V,
the resulting OER current initially decreases and quickly reaches a quasi steady-state
value. However, in this case the corresponding steady-state oxidation currents were
slightly lower than each other. Figure 5.19 indicates that, for the DSA anodes, the
decrease in current density represents the dissolution of the active component
occurring during electrolysis. As penetration of the electrolyte occurs through the
Chronoamperometry(<1s)
0.00E+00
2.00E-02
4.00E-02
6.00E-02
8.00E-02
1.00E-01
1.20E-01
0 0.1 0.2 0.3 0.4 0.5 0.6 0.7 0.8 0.9 1
Time (s)
Cur
rent
Den
sity
(A/c
m2 )
c. DSA Mesh a. Lead Anode b. DSA Plate
c
b
a

97
mud cracked, porous structure of the thermally prepared oxide layer, the DSA anodes
becomes stable around 0.3 seconds. As a consequence of dissolution of the active
component, electrocatalytic activity of oxide catalyst decreases slowly with time until
deactivation is reached by base metal passivation. For the lead alloy anode, the initial
decrease in current density may be attributed to the partial blockage of the electrode
surface due to the formation of a passivating layer. As the layer grows in thickness,
the anode tends to stabilise as evidenced by the constant current density at 0.05
seconds.
5.1.7 X-Ray Diffractometry (XRD) analysis
Figure 5.20: XRD Pattern for Unused DSA Anodes
Position [°2Theta]
30 40 50 60 70
Counts
0
100
400
Ir T
i3
Ti O
2; T
a2 O
5
Ta2
O5
Ta0.
15 T
i0.8
5; T
a0.9
7 O
2Ti
; Ir
O2;
Ta2
O5
Ta0.
15 T
i0.8
5Ta
2 O
5Ta
0.97
O2 Ta;
Ti;
Ti O
2; T
a2 O
5Ta
0.15
Ti0
.85;
Ta0
.97
O2
Ir;
Ti;
Ir O
2; T
i O2;
Ta2
O5
Ti O
2; T
a2 O
5
Ir;
Ta2
O5
Ta0.
15 T
i0.8
5; T
a0.9
7 O
2; T
a2 O
5Ta
0.15
Ti0
.85;
Ti O
2
Ta;
Ti O
2; T
a2 O
5
Ta0.
97 O
2; T
i O2;
Ta2
O5
Ta0.
15 T
i0.8
5; T
i O2;
Ta2
O5
Ir;
Ti O
2Ta
0.15
Ti0
.85;
Ta;
Ir
Ti3
ZVANAKA XRD 3.CAF

98
Figure 5.21: XRD Pattern for Used DSA Anodes
The XRD analysis in figure 5.20 showed that the IrO2-Ta2O5 coating in the unused
DSA anodes contained IrO2 and Ta2O5 phases while for used DSA anodes, the XRD
spectrum in figure 5.21 only showed the presence Ta2O5 and titanium phases. This is
an indication of IrO2 loss from the coating during anode use (Hu et al., 2002).
Position [°2Theta]
20 30 40 50 60
Counts
0
500
1000
O2 Ta
2 O
5
Ta2
O5
Ta2
O5 Ti
6 O
; O
2Ta
2 O
5
Ti6
OTi
; Ti
O2;
Ta2
O5;
O2
Ti6
O
Ti6
O;
Ta2
O5
Ta2
O5
Ti6
OTi
O2;
O2
Ti;
Ti O
2; T
a2 O
5Ti
6 O
; Ta
2 O
5
Ta2
O5
Ti6
O;
Ti O
2; O
2Ta
2 O
5Ta
2 O
5; O
2
ZVANAKA.RD

99
Figure 5.22: XRD Pattern for an Unused Lead Alloy Anode
Figure 5.23: XRD Pattern for a Used Lead Alloy Anode
Position [°2Theta]
30 40 50 60 70
Counts
0
1000
2000
Sb
Pb
Pb
Sb
Sb SbPb
Pb
Pb
FRESHLEAD.CAF
Position [°2Theta]
30 40 50 60 70
Counts
0
100
200
300
400
Pb S
O4
Pb S
O4
Pb S
O4
Pb S
O4
Pb S
O4
Pb S
O4
Pb S
O4
PbPb
S O
4Pb
S O
4Pb
S O
4
PbPb
S O
4
Pb S
O4
Pb S
O4
Pb S
O4
Pb S
O4
Pb S
O4
Pb S
O4
Pb S
O4
Pb S
O4
Pb S
O4
Pb S
O4
Pb S
O4
Pb S
O4
Pb S
O4
Pb S
O4
Pb S
O4
Pb S
O4
Pb S
O4;
Pb
Pb S
O4
Pb S
O4
Pb S
O4;
Pb
Pb S
O4
Pb S
O4
Pb S
O4
USESLEAD.RD

T
i
t
5
F
F
The unused
indicated in
the presence
5.1.8 Scanni
Figure 5.24: S
Figure 5.25: S
lead alloy a
figure 5.22
e of lead sulp
ing Electron
SEM Microgra
SEM Microgra
anode spectr
while the XR
phate (PbSO
Microscopy
aph for an Un
aph for a Used
Pb
PbSO4
100
rum showed
RD spectrum
O4) on the ano
y (SEM) ana
nused Lead All
d Lead Alloy A
d only lead a
m for a used
ode surface a
alysis
loy Anode
Anode
and traces o
d lead alloy a
as shown in
of antimony
anode reveal
figure 5.23.
PbSO4
Pb
as
led

101
Figure 5.25 indicates that the Pb/Pb(II) redox transition controls the surface of the
lead alloy anode as previously suggested from the open circuit potential
measurements and XRD analysis.
Figure 5.26: SEM Micrograph for an unused DSA Anode
Surface morphology of unused DSA anodes as analysed by a scanning electron
microscope (SEM) showed a mud-cracked structure of the oxide coating as shown in
figure 5.26 above.
Figure 5.27: SEM Micrograph for a used DSA Anode
Coating (mud--cracked structure)

102
Figure 5.27 shows the morphology of a used DSA anode. The absence of the mud-
cracked structure is further proof that, during electrowinning operations using
dimensionally stable anodes, coating loss occurs (Martelli et al., 1994, Hu et al.,
2002).
5.1.9 Energy Dispersive Spectrometry (EDS) analysis
Figures 5.28 and 5.29 are the EDS patterns of the Ti/ IrO2-Ta2O5 anodes before and
after long term use. No EDS analysis was performed on the lead alloy anodes since
the results from XRD analysis were conclusive.
Figure 5.28: EDS Analysis for an Unused DSA Anode

103
Figure 5.28 indicates that iridium and tantalum are the major elements on the surface
of the titanium substrate for an unused DSA anode. Other trace elements such as
carbon, silicon and aluminium may be attributed to impurities coming from the
preparation method of the anode.
Figure 5.29: EDS Analysis for a Used DSA Anode
Figure 5.29 shows the heavy presence of the titanium substrate and traces of iridium
and tantalum which are the active and inert components respectively. This EDS result
suggests that the failure mechanism of the DSA anodes is due to coating consumption
(reduction in coating thickness) which results in a stronger titanium signal. The
results also indicate that some residual coating remains on the DSA anodes, after
deactivation. The results from figure 5.28 and 5.29 are further substantiated by the
quantitative analysis for unused and used DSA anodes in Table 5.10. The percentage
compositions of iridium and tantalum were much higher in a fresh (unused) anode

104
than in a used anode while for titanium, the composition was greater in a used anode
than in a fresh anode.
Table 5.10: Quantitative Analysis for Unused and Used DSA Anodes.
Element Wt % Ti Ir Ta
DSA Fresh Used Fresh Used Fresh Used
Composition 1.47 96.77 64.33 0.00 28.16 0.47
5.2 Comparison of anode materials: Electrowinning Experiments
5.2.1 Variation of Cell Voltage with Time
Cell voltage is a function of a number of variables, which may be varied to enhance
the overall efficiency; the major contributor being the decomposition potential
(section 2.3.2.1). Anode overpotential and resistance according to Ohm’s law also
significantly affect the cell voltage. The different cell voltage values recorded for the
three electrowinning cells can thus be attributed to the difference in the anode
materials since all the other conditions (temperature, electrode distance,
concentration, electrode connections, and cathode material) were kept constant.
Figures 5.30 and 5.31 show the graphs of cell voltage with time for the anode
materials considered under the study in BMR solution of concentration 55 g/l Cu and
100 g/l sulphuric acid, at a current density of 190 A/m2 and a temperature of 55 0C.
Despite the voltage fluctuations which characterised the electrowinning operation,
mean cell voltages and the corresponding energy consumption were calculated in
order to give some form of basis for comparison of these anodes. The voltage
fluctuations could have been due to a number of factors such as electrode stability,
differences in cell hydrodynamics and impurities in the electrolyte.

105
5.2.1.1 Comparison of DSA 1 Plate and Mesh Anodes and the Lead Anode
Generally the DSA 1 mesh anode cell had the lowest mean cell voltage of the three
anode materials used, followed by the DSA 1 plate anode cell and the lead anode cell.
However despite this trend, the cell voltage values in the DSA 1 plate containing cell
were higher than the cell voltage values in the cell containing the lead anode in the
first 95 hours of operation. These high voltage values may be attributed to erosion of
the porous outer layer of the active coating due to intense oxygen evolution. Mraz and
Krýsa (1994) reported that the initial dissolution rate for the IrO2 based coating is
reported to be several orders higher than the steady state dissolution rate. Beyond that
the cell voltage values decreased to around 1.57 V as shown in figure 5.30. This
voltage was lower than that of the lead anode during the same period by a magnitude
of 15%. Thus the decrease in cell voltage for the DSA 1 plate around 95 hours as seen
in figure 5.30 may indicate that a stable voltage of 1.57 V has been attained for the
anode (Cardarelli et al., 1998).
Any increase in the cell voltage from 1.57 V after continuous operation will therefore
be a result of anode deactivation (Cardarelli et al., 1998). The cell voltage values in
the cell containing the DSA 1 mesh anode were also initially higher than the cell
voltage values in the cells containing the DSA 1 plate and lead anodes. The values
were in the range 1.98 V to 2.2 V but dropped after about 15 hours. This can also be
attributed to erosion of the porous outer layer of the coating.

106
Figure 5.30: Cell Voltage against Time in BMR Solution over a Period of 150 Hours.
a) Mean Voltages for DSA 1 Anodes and the Lead Anode
The mean voltages for the DSA 1 plate, DSA 1 mesh and lead anodes were 1.787 V,
1.688 V and 1.838 V respectively over a period of 150 hours of electrowinning. This
shows that the lead anode had the highest average energy consumption which was
calculated to be 45 656 kJ. The DSA 1 plate and mesh anodes’ average energy
consumption was 3% and 8% lower than that of the lead anode respectively.
After performing electrowinning tests in synthetic electrolyte, Hu et al. (1996) and
other authors have also reported that the DSA anodes should have the least energy
consumption when compared to the lead anode. Furthermore, this trend is in
agreement with the results from chronopotentiometry tests carried out in synthetic
solution earlier in the study.
Cell Voltage against Time
1
1.2
1.4
1.6
1.8
2
2.2
0 10 20 30 40 50 60 70 80 90 100 110 120 130 140 150
Time (hours)
Cel
l Vol
tgae
(V)
a. Lead b. DSA 1 Plate c. DSA 1 Mesh20 per. Mov. Avg. (c. DSA 1 Mesh) 10 per. Mov. Avg. (b. DSA 1 Plate) 15 per. Mov. Avg. (a. Lead)
a
c
b

107
5.2.1.2 Comparison of DSA 2 Plate and Mesh Anodes and the Lead Anode
Figure 5.31: Cell Voltage against Time in BMR Solution over a Period of 150 Hours.
b) Mean Voltages for DSA 2 Anodes and the Lead Anode
The mean voltages for the DSA 2 plate, DSA 2 mesh and lead anode cells were 2.042
V, 1.661 V and 1.952 V respectively over a period of 150 hours of electrowinning.
This shows that the lead anode cell had an average energy consumption of 48 488 kJ.
The average energy consumption for the DSA 2 plate anode cell was found to be 5%
higher than that of the lead anode cell while the average energy consumption for the
DSA 2 mesh anode cell was 15% lower than that of the lead anode cell. However, as
was seen for the DSA 1 plate anode cell, the cell voltage values for the DSA 2 plate
anode cell might decrease to values below the lead anode cell and stabilise with
continued operation if steady state dissolution is reached. This will however, depend
on the method of preparation (solvent of the painting solution, firing temperature) of
this anode. The morphology and structure of the coating were found to be essential
factors influencing the properties and performances of the Ti/IrO2-Ta2O5 electrode
Cell Voltage against Time
1
1.2
1.4
1.6
1.8
2
2.2
2.4
0 10 20 30 40 50 60 70 80 90 100 110 120 130 140 150Time (hours)
Cel
l Vol
tage
(V)
vs A
g/A
gCl
b. DSA 2 Plate a. Lead c. DSA 2 Mesh15 per. Mov. Avg. (a. Lead) 10 per. Mov. Avg. (c. DSA 2 Mesh) 15 per. Mov. Avg. (b. DSA 2 Plate)
a
b
c

108
(Vercesi et al., 1991). Kulandaisamy et al. (1997) also mentioned that an increase in
resistivity of the surface coating for DSA anodes increased the anode potential. The
resistivity is a function of the method of preparation of the oxide coating on the
anode. Martelli et al. (1994) also reported that even DSA anodes with the same
chemical composition would show different electrocatalytic activities when their
microstructures are different. Morimitsu et al., as cited by Moats (2008), stated that
decreasing the curing temperature used in the thermal decomposition process during
coating preparation lowers the anode overpotential and in turn the cell voltage.
5.2.1.3 Comparison between the DSA 1 and DSA 2 plate and mesh anodes
DSA 1 and DSA 2 anodes (both plate and mesh) were also compared over a period of
150 hours in order to determine the best DSA anode. Figures 5.32 and 5.33 show the
comparison between these plates and mesh anodes.
5.2.1.3.1 Comparison between the DSA 1 and DSA 2 plate anodes
Figure 5.32: Cell Voltage against Time in BMR Solution over a Period of 150 Hours.
Cell Voltage against Time
1.4
1.6
1.8
2
2.2
2.4
2.6
0 10 20 30 40 50 60 70 80 90 100 110 120 130 140 150Time (hours)
Cel
l Vol
tage
(V)
a. DSA 1 Plate b. DSA 2 Plate 10 per. Mov. Avg. (a. DSA 1 Plate) 15 per. Mov. Avg. (b. DSA 2 Plate)
b
a
a

109
The initial cell voltages in the DSA 1 plate and DSA 2 plate cells were 2.019 V and
2.131 V. Overall, the DSA 1 plate cell had lower cell voltage values than its DSA 2
plate counterpart. The mean cell voltage for the DSA 1 plate cell over a period of 150
hours was 1.787 V; 12% lower than the DSA 2 plate cell which had a mean voltage of
2.042 V. This can be attributed to the high resistivity of the mixed metal oxide
coating on the DSA 2 plate anode. Since current and duration of the study were
constant, the energy saving also translates to 12% when using the DSA 1 plate anode
instead of the DSA 2 plate anode. Table 5.11 below shows other parameters evaluated
for the two plate anodes.
Table 5.11: Values of Minimum (Min.) and Maximum (Max.) Cell Voltages for DSA 1 and DSA
2 Plates.
Anode Min. Cell
Voltage
Max. Cell Voltage
DSA 1 1.539 2.061
DSA 2 1.799 2.555
5.2.1.3.2 Comparison between the DSA 1 and DSA 2 mesh anodes
Figure 5.33: Cell Voltage against Time in BMR Solution over a Period of 150 Hours.
Cell Voltage against Time
0
0.5
1
1.5
2
2.5
0 10 20 30 40 50 60 70 80 90 100 110 120 130 140 150Time (hours)
Cel
l Vol
tage
(V)
DSA 1 Mesh DSA 2 Mesh
DSA 1 Mesh
DSA 2 Mesh

110
The initial cell voltages in the DSA 1 mesh and DSA 2 mesh cells were 2.108 V and
2.123 V. Figure 5.33 shows that the cell voltage values in the cell containing the DSA
1 mesh anode were higher than the values from the DSA 2 mesh cell in the first 15
hours of electrowinning. Beyond that, the cell voltage values are almost equal. The
mean cell voltage for the DSA 1 mesh cell was 1.688 V; 1.6% higher than the DSA 2
mesh cell which had a mean voltage of 1.661 V. Thus in terms of operation, the DSA
2 mesh anode will result in energy consumption, 1.6% lower than that of the DSA 1
mesh anode.
Table 5.12: Values of Minimum and Maximum Cell Voltages for DSA 1 and DSA 2 Meshes.
Anode Min. Cell Voltage Max. Cell Voltage
DSA 1 0.736 2.196
DSA 2 1.121 2.122
Figures 5.34, 5.35 and 5.36 below show the graphs of galvanostatic tests carried out
in BMR and synthetic solutions using a potentiostat/galvanostat over eight hours and
a current density of 190 A/m2 at room temperature.

111
5.2.1.4 Comparison between BMR and Synthetic solutions
5.2.1.4.1 Comparison between BMR and Synthetic solutions for a DSA plate
Figure 5.34: Anode Potential against Time in BMR and Synthetic Solutions for a DSA Plate
Specimen.
5.2.1.4.2 Comparison between BMR and Synthetic solutions for a DSA mesh anode
Figure 5.35: Anode Potential against Time in BMR and Synthetic Solutions for a DSA Mesh
Specimen.
Anode Potential against Time
1.5
1.7
1.9
2.1
2.3
2.5
2.7
2.9
0 5000 10000 15000 20000 25000 30000Time (s)
Ano
de P
oten
tial (
V) v
s Ag/
AgC
l
DSA Plate in BMR Solution DSA Plate in Synthetic Solution
Anode Potential against Time
0.9
1.1
1.3
1.5
1.7
1.9
2.1
2.3
2.5
0 5000 10000 15000 20000 25000 30000Time (s)
Ano
de P
oten
tial (
V) v
s Ag/
AgC
l
DSA Mesh in Synthetic Solution DSA Mesh in BMR Solution

112
5.2.1.4.3 Comparison between BMR and Synthetic solutions for a lead anode
Figure 5.36: Anode Potential against Time in BMR and Synthetic Solutions for a Lead
Specimen.
An analysis of figures 5.34, 5.35 and 5.36 for the different anode materials indicates
that the anode potentials for the DSA plate, DSA mesh and lead anodes are higher in
BMR solution than in synthetic solution. The average values of anode potential in
BMR solution were 1.91 V, 2.16 V and 2.33 V for the DSA mesh, DSA plate and
lead anodes respectively. This would result in energy savings of 7% for the DSA
plate anode and 18% for the DSA mesh anode if the lead anode were to be replaced.
These energy savings differ from the range of 19-24% given in earlier tests carried
out using synthetic electrolyte. Furthermore, in the BMR solution voltage fluctuations
were also common, while in synthetic solution the anode potentials stabilised within
the first hour. This can be attributed to the difference in composition of the two
solutions used.
Anode Potential against Time
1.8
2
2.2
2.4
2.6
2.8
0 5000 10000 15000 20000 25000 30000Time (s)
Ano
de P
oten
tial (
V) v
s Ag/
AgC
l
Lead in Synthetic Solution Lead in BMR Solution

113
5.3 Impurities in BMR solution
5.3.1 Effect of manganese on anode potential
From the various impurities in industrial electrolytes, manganese ions were added to
synthetic electrolyte in order to assess their effect on the magnitude of the anode
potential for the different anodes. Manganese has been reported to cause an increase
of 10–15% in energy consumption in zinc electrowinning electrolytes (Zhang and
Cheng, 2007). The manganese was added as aliquots from stock solutions prepared
from its sulphate salt. Yu and O’Keefe (2002) reported that, despite oxygen evolution
being the main reaction, in copper electrowinning, secondary reactions may occur in
the presence of manganese impurities. Manganese may react at the anode surface
during oxidation to form either soluble species or insoluble manganese dioxide that
may passivate the anode surface and hinder the OER reaction (Kao and Weibel,
1992). Passivation of the anode surface results in an increase in anode potential.
Figures 5.37, 5.38 and 5.39 show the variation of anode potential with time in the
presence and absence of manganese ions for the DSA plate and mesh anodes and the
lead anode. The manganese concentration was 8 mg Mn/l; similar to the BMR
solution used in the study.

114
5.3.1.1 Comparison between synthetic and synthetic/manganese solutions
5.3.1.1.1 Comparison between synthetic and synthetic/manganese solutions for a
DSA plate anode
Figure 5.37: Anode Potential against Time in Synthetic and Synthetic/Manganese Solution for a
DSA Plate Specimen.
0.6
0.8
1
1.2
1.4
1.6
1.8
2
0 1000 2000 3000 4000 5000 6000 7000 8000An
ode
pot
enti
al v
s Ag/
AgC
l (V
)
Time (s)
Anode potential against time
a. DSA plate in synthetic/manganese solution b. DSA plate in synthetic solution

115
5.3.1.1.2 Comparison between synthetic and synthetic/manganese solutions for a
DSA mesh anode
Figure 5.38: Anode Potential against Time in Synthetic and Synthetic/Manganese Solution for a
DSA Mesh Specimen.
00.20.40.60.8
11.21.41.61.8
0 1000 2000 3000 4000 5000 6000 7000 8000
Ano
de p
oten
tial v
s Ag/
AgC
l (V
)
Time (s)
Anode potential against time
a. DSA mesh in synthetic/manganesse solutionb. DSA mesh in synthetic solution

116
5.3.1.1.3 Comparison between synthetic and synthetic/manganese solutions for a
lead anode
Figure 5.39: Anode Potential against Time in Synthetic and Synthetic/Manganese Solution for a
Lead Specimen.
It can be observed that addition of manganese into the synthetic solution increased
anode potential for both DSA anodes while for the lead anode; manganese had a
slight depolarising effect. Yu and O’Keefe (2002) found out that when oxygen
evolution became more significant, manganese depolarised the Pb-Ca-Sn anode.
Anode potential is a major component of cell voltage; therefore, the cell voltage for
the DSA anodes is also expected to increase. This in turn, decreases the energy saving
benefit that otherwise could have been realised. The average energy saving in
synthetic/manganese solution was 6% for the DSA plate and 14% for the DSA mesh
as compared to 19% and 24% previously reported for the synthetic solution. The
graphs also show that addition of manganese into synthetic solution resulted in some
0
0.5
1
1.5
2
2.5
0 2000 4000 6000 8000
Ano
de p
oten
tial v
s Ag/
AgC
l
Time (s)
Anode potential against time
a. lead anode in sythetic solution
b. lead anode in synthetic/manganese solution
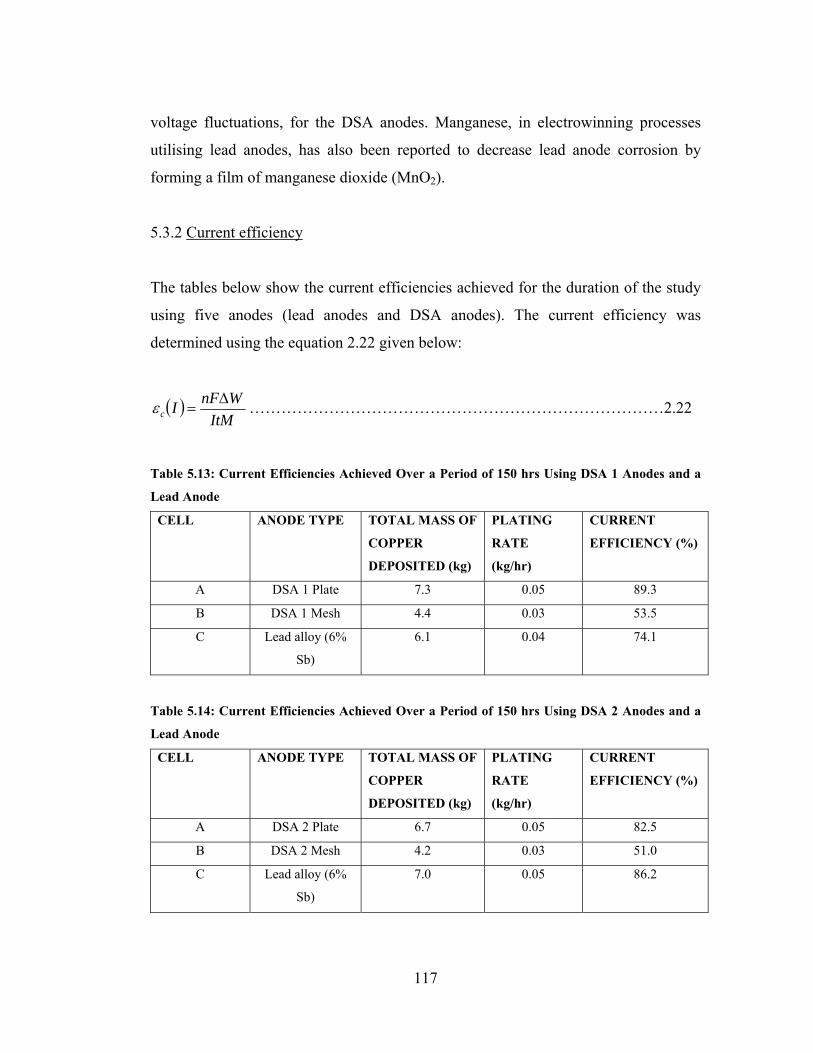
117
voltage fluctuations, for the DSA anodes. Manganese, in electrowinning processes
utilising lead anodes, has also been reported to decrease lead anode corrosion by
forming a film of manganese dioxide (MnO2).
5.3.2 Current efficiency
The tables below show the current efficiencies achieved for the duration of the study
using five anodes (lead anodes and DSA anodes). The current efficiency was
determined using the equation 2.22 given below:
( )ItM
WnFIc∆
=ε ……………………………………………………………………2.22
Table 5.13: Current Efficiencies Achieved Over a Period of 150 hrs Using DSA 1 Anodes and a
Lead Anode
CELL ANODE TYPE TOTAL MASS OF
COPPER
DEPOSITED (kg)
PLATING
RATE
(kg/hr)
CURRENT
EFFICIENCY (%)
A DSA 1 Plate 7.3 0.05 89.3
B DSA 1 Mesh 4.4 0.03 53.5
C Lead alloy (6%
Sb)
6.1 0.04 74.1
Table 5.14: Current Efficiencies Achieved Over a Period of 150 hrs Using DSA 2 Anodes and a
Lead Anode
CELL ANODE TYPE TOTAL MASS OF
COPPER
DEPOSITED (kg)
PLATING
RATE
(kg/hr)
CURRENT
EFFICIENCY (%)
A DSA 2 Plate 6.7 0.05 82.5
B DSA 2 Mesh 4.2 0.03 51.0
C Lead alloy (6%
Sb)
7.0 0.05 86.2

118
Overall, in the electrowinning studies conducted using DSA and lead anodes in BMR
solution, the current efficiencies for all the anodes in BMR solution were markedly
lower than the current efficiencies in synthetic electrolyte (table 5.3). Das and Gopala
(1996) mentioned that during hydrometallurgical extraction of copper from its ores,
the leach liquors often contain a substantial amount of iron. The presence of Fe (III)
in the electrolyte not only leads to production of poor quality cathode copper but also
causes a loss in current efficiency due to the reduction of Fe3+ to Fe2+ at the cathode
and re-oxidation of Fe2+ to Fe3+.
The differences observed in the current efficiencies for the lead alloy anode (74% and
86%) were not due to the failure of the experiment itself, but rather copper deposition
which occurred on the heating rod inside the lead anode cell as shown in figure 5.40.
So theoretically, the results were the same within acceptable experimental error.
Figure 5.40: Heating Rod Showing Electrodeposited Copper in the Lead Anode Cell.
DSA 1 and 2 mesh anodes had the lowest current efficiencies as indicated in tables
5.13 and 5.14. A number of factors could have contributed to this problem. Firstly,
since coated titanium electrode have been reported to oxidise ferrous ions to ferric
11/2008

119
ions, which has a bearing on current efficiency; the oxidation with mesh anodes may
have been more profound than that resulting from DSA plate anodes. Therefore, this
may have inadvertently led to reduced cathode current efficiency in the cells
containing these anodes.
Furthermore, other factors such as; precise material composition, impurities, cross-
sectional areas of the cathodes or anode current density, could have played a role too
in affecting the cathode current efficiency. Ettel et al. (1974) suggested that there
could be a relationship between anode current density and cathode current efficiency
since gas evolution at the anode results in electrolyte movement and in turn affects
mass transfer coefficients at the cathode.
5.3.3 Morphology of the copper produced
Some nodules were observed on the copper produced in the cells containing the lead
anode and both DSA plate anodes. This could be attributed to the likelihood of
varying current distributions in these cells since some areas on the copper deposits
were uniform. Varying current distributions are mainly caused by imperfections on
the surface of the electrode (Nicol, 2006). The copper deposited in the cells
containing both mesh anodes was uniform. Figures 5.41 to 5.45 show these copper
deposits.

120
Figure 5.41: Copper from DSA 1 Plate Anode
Figure 5.42: Copper from DSA 2 Plate Anode

121
Figure 5.43: Copper from DSA 1 Mesh Anode.
Figure 5.44: Copper from DSA 2 Mesh Anode.

122
Figure 5.45: Copper from Lead Anode Cell.
The optical micrographs below also show the deposit morphology for copper
deposited in cells containing the DSA 1 and DSA 2 plate anodes, DSA 1 and DSA 2
mesh anodes and the lead anode.
Figure 5.46: Micrograph for Copper from DSA 1 Plate Anode Cell
Crack formation
due to nodules

123
Figure 5.47: Micrograph for Copper from DSA 2 Plate Anode Cell
Figure 5.48: Micrograph for Copper from DSA 1 Mesh Anode Cell.
Crack formation
due to nodules
Uniform copper
deposit
(no nodules, therefore
no cracks present)

F
F
Figure 5.49: M
Figure 5.50: M
Micrograph fo
Micrograph fo
or Copper from
or Copper from
124
m DSA 2 Mes
m Lead Anode
h Anode Cell.
e Cell
.
Unifo
depo
(no n
no c
Hea
crac
depo
nodu
Nodu
form copper
osit
nodules, therefo
cracks present)
avy presence of
cks on copper
osit as a result o
ule formation
ules
re
f

125
5.4 XRD analysis for copper deposits
Figure 5.51: XRD Peak Height Intensity: DSA 1 Plate Anode Cell
Figure 5.52: XRD Peak Height Intensity: DSA 1 Mesh Anode Cell
XRD Peak Height Intensity: DSA 1 Plate Anode Cell
0
20
40
60
80
100
120
29 36 42 43 50 61
2θ/degrees
Inte
nsity
XRD Peak Height Intensity: DSA 1 Plate Anode Cell
XRD Peak Height Intensity: DSA 1 Mesh Anode Cell
0
20
40
60
80
100
120
36 43 42 50 612θ/degrees
Inte
nsity
XRD Peak Height Intensity: DSA 1 Mesh Anode Cell
Cu
CuO CuO
Cu2O
Cu
CuO
Cu
CuO CuO
Cu
CuO

126
Figure 5.53: XRD Peak Height Intensity: DSA 2 Plate Anode
Figure 5.54: XRD Peak Height Intensity: DSA 2 Mesh Anode Cell
XRD Peak Height Intensity: DSA 2 Plate Anode Cell
0
20
40
60
80
100
120
36 43 50
2θ/degrees
Inte
nsity
XRD Peak Height Intensity: DSA 2 Plate Anode Cell
XRD Peak Height Intensity: DSA 2 Mesh Anode Cell
0
20
40
60
80
100
120
42.7 43 49.8 502θ/degrees
Inte
nsity
XRD Peak Height Intensity: DSA 2 Mesh Anode Cell
Cu
Fe
Cu
Fe
Cu
Cu
CuO

127
Figure 5.55: XRD Peak Height Intensity: Lead Anode
Figure 5.56: XRD Peak Height Intensity: Standard Copper Sample
XRD Peak Height Intensity: Lead Anode Cell
0
20
40
60
80
100
120
29 36 42 43 50 61
2θ/degrees
Inte
nsity
XRD Peak Height Intensity: Lead Anode Cell
XRD Peak Height Intensity: Standard Copper Sample
0
20
40
60
80
100
120
43 50 74 89.9 95
2θ/degrees
Inte
nsity
XRD Peak Height Intensity: Standard Copper Sample
Pb2O3 Pb2O3
Cu
Cu2O CuO
Cu
Cu
Cu
Cu Cu
Cu

128
Figures 5.51 to 5.55 show the peak height intensities measured from the XRD spectra
while table 5.17 below lists the preferential planes along with their relative intensities
for a standard copper sample (International Center for Diffraction Data, 1980).
Table 5.15: Copper Diffraction Pattern (standard sample)
Bragg angle (2θ) Plane (h k l) Intensities (I/I1)
43.30 (111) 100
50.44 (200) 46
74.12 (220) 20
89.91 (311) 17
95.14 (222) 5
In four of the copper deposit samples, the (111) plane was preferred as shown in
figures 5.51, 5.52, 5.53 and 5.55. These were deposits from the DSA 1 plate and mesh
anode cells, DSA 2 plate anode cell and the lead anode cell. This is similar to a
standard copper sample as shown in figure 5.56.
However, for the DSA 2 mesh anode cell, the dominant crystal orientation was in the
(200) crystal plane as shown in figure 5.54. This is a deviation from the standard
crystal orientation, which can be attributed to the iron contaminant from electrolyte
entrapment (Biswas et al. 2002), found in the deposit. Iron has been reported to
adversely affect the morphology of copper deposits by hindering the formation of
copper seeds in such a way that it cannot undergo any mechanical working (De
Filippo et al., 1989).
The BMR solution used in the study contained 12.4 kg/m3 Fe in comparison to
2 kg/m3, stated by Maki (1999) as the concentration necessary to minimise iron in
cathode copper. Therefore, in this study, the high level of iron in the BMR solution
significantly increased the chances of iron contamination through electrolyte
entrapment, despite washing the cathodes thoroughly.
129
According to Alfantazi and Valic (2003), good quality copper deposits are produced
when a single crystal growth plane is dominant. In this study, copper deposits from
the cells containing the DSA 1 mesh and lead anodes had one dominant plane (111).
However a good quality deposit was only produced in the cell containing the DSA 1
mesh anode. As previously mentioned the deposit was also uniform (figures 5.43 and
5.48) and had no traces of harmful cations like iron or lead which exert a detrimental
effect on the deposit quality thereby reducing its grade. The copper from the lead cell
was contaminated with lead. Lead which accumulates on the edges of the copper
grains inhibits growth of the seeds, thus reducing the final dimensions of the
microcrystals. This leads to a reduction in copper conductivity and consequently
reduces not only its grade but also its competitiveness in the market.
Copper deposits from the DSA 1 plate, DSA 2 plate and DSA 2 mesh cells had more
than one dominant crystal plane ((111) and (200) planes); the (200) plane being the
second preferred plane for the DSA 1 plate and DSA 2 plate cells. These copper
deposits both exhibited nodular growth as shown in pictures 1 and 2 and micrographs
1 and 2. In the DSA 2 mesh cell, the (111) crystal plane was the second preferred
plane and although the deposit was uniform it was impure as shown in figure 5.54.
All copper deposits also contained traces of copper oxide either as CuO or Cu2O. This
may have been the reason why other crystal planes were not evident in the copper
deposits as is the case with a standard copper sample. In consultation with other
experts in the field, it was noted that there is always some oxygen present in a
cathode. Furthermore, occlusion of electrolyte could have been another main source
of oxygen in the copper deposit (Nicol, 2006). It is therefore possible that these
oxides may or may not have been formed after removal from the cell.

130
5.5 Economic evaluation
A simplified economic evaluation was carried out as shown in table 5.18. The energy
consumption per kg copper for the five anodes was in the range 1.7 to 2.7 kWh/kg
copper; close to the range reported by Gupta and Mukherjee (1990) of 0.16 to 2.5
kWh/kg copper.
Table 5.16: Simplified Economic Evaluation of Replacing Lead Anodes with a DSA Anode
Anode
Material
(405
mm*330
mm)
Materials
Costs a
($)
Energy
Consumption
(kWh)
Copper
Deposited
in 150 hrs
(kg)
Current
Efficiency
(%)
Energy
Consumption
(kWh/kg Cu)
Energy
Consumption
(kWh/t Cu)
Energy
Cost/kg
Cu
($/kg)b
Pb-
6%Sb
124 13.1 6.6 86.2 2.0 2 000 0.300
DSA 1
Plate
410 12.3 7.3 89.3 1.7 1 700 0.255
DSA 2
Plate
755 14.1 6.7 82.5 2.1 2 100 0.315
DSA 1
Mesh
434 11.6 4.4 53.5 2.6 2 600 0.390
DSA 2
Mesh
578 11.5 4.2 51.0 2.7 2 700 0.405
a Material costs were calculated in U.S. dollars and they include prices of hanger bars. b Energy costs were calculated at US$0.15/kWh.
Table 5.17: Other Fixed Costs in the Study
Equipment Fixed Capital Costs (US$)
Power Supply Unit 3300
Pump 1840
Cathodes 600
Heating Elements & Control boxes 965
Piping 245
Total 6950

131
The economic evaluation shows that the DSA 1 plate anode had the least energy
consumption per kilogramme of copper produced among all the five materials
considered under the investigation. As a result its energy cost was 15% lower than
that of the conventional lead anode. Moats and Free (2007) reported that DSA anodes
coated with a precious metal oxide coating based on IrO2 resulted in power
consumption 10-17% lower than that of the conventional lead anodes.
Although both DSA 1 and 2 mesh anodes exhibited the lowest total energy
consumption, they had the highest energy consumption per kilogramme of copper
produced. As a result, their energy costs per kg copper were significantly high (30%-
35% greater than the lead anode respectively). This can be attributed to the low
current efficiencies of 53.5% and 51% respectively in the cells containing these
anodes. Biswas et al. (2002) reported that high current efficiency is important because
it maximises copper plating rate and minimises electrical energy consumption.
Energy cost per kg of copper produced for the DSA 2 plate anode was also 5% higher
than that of the lead anode due to the high cell voltage values in its cell.

132
6 SUMMARY OF RESULTS
6.1 Comparison of anode materials
6.1.1 Electrochemical Investigations
Several tests were conducted in order to determine the best anode under conditions of
constant current, temperature and concentration. All electrochemical tests were
performed in a single compartment, 500 ml Pyrex beaker at room temperature and in
synthetic solution of concentration 55 g/l Cu and 100 g/l H2SO4.
6.1.1.1 Open circuit potential measurements
Open circuit potential (OCP) measurements were carried out in order to assess the
stability of the anodes under investigation. The tests also furnished information on the
anode material with the highest corrosion resistance and the redox transitions
controlling the surface electrochemistry of the anodes.
The results indicated that the initial sharp decrease in potential from 0.49 V to 0.45 V,
within the first 200 s for the DSA plate, could have been caused by the erosion of
coating particles that are weakly bonded to the substrate once there is interaction
between the electrolyte and the anode (Martelli et al., 1994). For the DSA mesh, the
potential shifted more rapidly towards the nobler potentials from 0.33 V to 0.41 V
within the first 3750 seconds and then stabilised while for the antimonial lead
specimen, a small increase in potential from 0.08 V to 0.10 V was observed for the
whole duration of the experiment.
The OCP measurements showed that the DSA anodes had nobler potentials compared
to the lead alloy anode with the DSA plate having the largest average open circuit
potential (Eoc) value of 0.44 V vs Ag/AgCl. These results suggest that the DSA plate
had the highest corrosion resistance.

133
The OCP measurements also indicated that the DSA anodes could be controlled by
hydrated Ir(Ш)/Ir(ΙV) redox transition (Alves et al., 1998) while the lead anode
surface is controlled by the Pb/Pb(ΙΙ) redox transition.
6.1.1.2 Potentiodynamic polarisation
Potentiodynamic polarisation was used to assess:
- the ability of materials to passivate spontaneously in the synthetic solution and
- the potential region over which the specimen remained passive
- corrosion rate of the metal specimens in the synthetic solution.
Unlike the lead alloy and DSA mesh anodes, the DSA plate anode did not show early
passivation tendencies in the potential range of -0.4 V to 1.2 V. Only active and
pseudo-passive behaviour were evident. However, in the potential range of -0.4 V to
1.4 V the DSA plate anode also showed active-passive behaviour. Since passivation is
the most frequent deactivation mechanism for DSA anodes (Martelli et al., 1994), it
can be concluded that the DSA mesh anode is likely to succumb to failure earlier than
the DSA plate anode after continuous operation.
The potentiodynamic polarisation tests also showed that the DSA plate anode
exhibited the highest corrosion resistance of 0.8 mm/year against 2.37 mm/year for
the DSA mesh anode and 2.48 mm/year for the lead anode. These results reveal the
corrodible nature of lead alloy anodes over DSA plate anodes (Alfantazi and
Moskalyk, 2003). Despite the mesh anode being a dimensionally stable anode, its
high corrosion (3 times greater than the DSA plate anode) can be attributed to the
large electrochemically active surface area (EASA) available for corrosion.
6.1.1.3 Chronopotentiometry (galvanostatic) tests
Chronopotentiometry tests were carried out in order to evaluate anode potentials and
electrode stability under galvanostatic conditions at a current density of 190 A/cm2.
The results showed that the lead anode has the highest anode potential of 1.97 V vs

134
Ag/AgCl, followed by the DSA plate anode (1.6 V vs Ag/AgCl) and lastly, the DSA
mesh anode (1.5 V vs Ag/AgCl). Since anode potential is a major component of the
cell voltage, and is directly related to energy consumption, the use of dimensionally
stable anodes in the place of the lead anodes can considerably lower the energy
demand of electrowinning. An energy reduction of 19% and 24% can be achieved
with the DSA plate anode and the DSA mesh anode, respectively.
The extent to which contaminants in the electrolyte can affect the cell voltage during
electrowinning was also investigated using galvanostatic chronopotentiometry tests.
The tests showed that addition of manganese to the synthetic electrolyte increased the
anode potential values for the DSAs from averages of: 1.6 V to 1.8 V for the DSA
plate anode and 1.5 V to 1.65 V for the DSA mesh anode. However, for the lead
anode, a slight depolarising effect to the magnitude of 3% was observed. The results
indicate that, if lead anodes were to be replaced, the average energy savings in
synthetic/manganese solution would be 6% for the DSA plate anode and 14% for the
DSA mesh anode as compared to 19% and 24% previously reported for the synthetic
solution.
Manganese oxide deposition blocks the catalytic sites on the DSA anodes, leading to
an increase in anode potential and inevitably the cell voltage. This reduces the energy
saving benefit that would have otherwise been achieved. On the lead anode the
presence of a manganese oxide layer has been reported to result in the reduction of
the anode’s corrosion rate.
Chronopotentiometry tests were also carried out for base metal refinery (BMR)
electrolyte and higher average anode potential values than those in the synthetic
solution were recorded. These mean values were 2.33 V, 2.16 V and 1.91 V for the
lead anode, DSA plate and mesh anodes respectively.

135
6.1.1.3.1 Determination of current efficiency
The current efficiencies as determined for the three anodes from the weight gained by
the cathode were 97.9% for both DSA anodes (plate and mesh) and 97.6% for the
lead anode. This shows an insignificant difference between all the anodes in terms of
initial current efficiency for fresh anodes in synthetic electrolyte. These results are
substantiated by the work reported by Panda and Das (2001).
6.1.1.3.2 Electrolyte contamination from anode deterioration
The electrolytes were analysed for lead, titanium, iridium and tantalum contamination
after two hours of galvanostatic chronopotentiometry using the Atomic Absorption
Spectrometer. The results revealed that during electrowinning of copper using lead
alloy anodes, anodic dissolution of lead occurs. This is likely to result in cathode
contamination and reduced life span for the anodes.
The presence of traces of tantalum (coating stabiliser) and iridium (active component)
in electrolytes containing both DSA anodes was also confirmed in the AAS analysis.
This indicates that during electrowinning operations using DSA anodes, some loss of
coating occurs. The amount of iridium loss was 0.003 ppm; three times greater than
the tantalum loss. This is attributed to the high stability of tantalum in the coating.
Traces of the titanium substrate were also detected in the samples analysed.
The amount of iridium loss in the electrochemical cell containing the DSA mesh
anode was 33% greater than the iridium loss in the cell containing the DSA plate
specimen (0.004 ppm against 0.003 ppm) as a result of the large electrochemically
active surface area (EASA) characteristic of the mesh anodes.
6.1.1.4 Cyclic voltammetry
Cyclic voltammetry was carried out in order to assess the surface characteristics and
determine the anode with the greatest electrochemically active surface area (EASA).
All experiments were carried out in 0.5 M sulphuric acid solution.

136
6.1.1.4.1 Cyclic voltammograms for lead anodes
For the lead anode, curves generated over the potential ranges of 0 to 2 V and -0.5 to
2.2 V, covered the reactions from metallic lead, Pb0, to Pb (ΙV) and oxygen evolution.
All the curves showed two anodic peaks at scanning in the positive direction, the first
peak being attributed to the anodic dissolution of lead and formation of a PbSO4
layer, which has passivating properties. This was followed by a wide passive region.
As the anodic potential increased to about 1.75 V, lead (IV) oxide formed at the
surface of the electrode. A further increase in the potential resulted in O2 evolution
around 1.9 V. The results also showed that oxygen evolution intensified with the
increase in cycle number. The cathodic peak which appeared at 1.4 V in the reverse
scan could be attributed to the reduction of PbO2 formed on the surface, back into
PbSO4, while a small cathodic peak at -0.5 V was attributed to the reduction of PbSO4
to Pb.
6.1.1.4.2 Cyclic voltammograms for DSA anodes
Voltammetric curves for the DSA anodes were recorded between -0.6 to 1.5 V (up to
the oxygen evolution potential). Several current peaks were observed in both
voltammograms. The anodic peak at a potential of approximately 1.5 V was due to
the oxygen evolution reaction, while the cathodic peak at a potential of about –0.6 V
indicated intensive hydrogen evolution. A pair of peaks observed at potentials
between 0.3 and 0.5 V for the DSA mesh was likely to be a result of the redox
transition, Ir (Ш)/Ir (ΙV) while for the DSA plate a smaller current peak appearing
around 0.5 V was also attributed to the same redox transition as that of the mesh. The
broad nature of these peaks showed the heterogeneity of the surface active sites on
these electrodes.

137
6.1.1.4.3 Electrochemically active surface area for the anode specimens
Voltammetric charges (q*) were measured at a scan rate of 20 mV/s for the three
anode specimens in the potential range 0 to 1.5 V. The results showed that the mesh
had the greatest value of q* and as such it has the largest working area for oxygen
evolution. This may be attributed to its structure. The larger working area results in
increased catalytic activity, thereby facilitating the lowering of the effective current
density and resulting in reduced anode potential (Kulandaisamy et al., 1997).
6.1.1.4.4 Effect of continuous cycling on voltammetric charge
The variation of voltammetric charge with continuous cycling for the DSA mesh and
plate anodes and the lead anode specimens was also investigated. It was observed that
the voltammetric charge q*, calculated by graphical integration of the cyclic
voltammetry (CV) curves in the range between 0 and 1.5 V, increased with cycling
time in the first 40 cycles for the plate and 20 cycles for the mesh, q*, after which
there was little change in the voltammetric charge. These results suggested that the
DSA anode specimens had attained a stable condition (Xu and Scantlebury, 2003). Of
the two DSA anodes, the mesh stabilised faster (after 20 cycles) due to its large
EASA which consequently results in shorter hydration time of the inner layer.
The voltammetric charge q* calculated in the range between 0 and 2.0 V for the lead
anode also increased with cycling time. There was a rapid increase in the first 15
cycles, which was followed by a steady continuous increase in voltammetric charge.
This may have been due to the formation of a passive film of porous lead (1V) oxide
as cycling progressed.
6.1.1.4.5 Determination of double layer capacitance
Determination of the double layer capacitance for both DSA mesh and plate anodes
indicated that a linear relationship exists between current density and scan rate. For
the lead anode specimen, the relationship between current density and scan rate
showed a large deviation from linearity and for this reason, the double layer

138
capacitance, Cdl, was replaced by the constant phase element (CPE). Similarly to the
anodic charge, q*, the DSA mesh had a higher double layer capacitance than the DSA
plate anode and as such it can be concluded that Cdl can be used to describe the EASA
of each anode (Xu and Scantlebury, 2003). A linear relationship was also found to
exist between the anodic charge q, and the double layer capacitance, Cdl.
6.1.1.4.6 Determination of Roughness Factor (RF)
The RF value for the Ti/IrO2-Ta2O5 mesh anode was 60% greater than that for
Ti/IrO2-Ta2O5 plate anode, suggesting that both porous morphology and the structure
of oxide anodes have an influence on the surface roughness and consequently the
electrochemically active surface area.
6.1.1.5 Electrochemical impedance spectroscopy (EIS)
Impedance measurements were carried out in order to provide supportive evidence
for the above results. The tests were carried out at the open circuit potential and the
oxygen evolution potential as determined from cyclic polarisation and galvanostatic
chronopotentiometry measurements. The results showed that polarisation resistances
for all the anode materials were higher at the open circuit potential compared to the
oxygen evolution potential.
This is an indication that an unused metal in the case of lead anodes or a metal
covered with an undamaged or fresh coating in the case of DSAs generally has very
high impedance. At both potentials at which EIS studies were carried out, the
polarisation resistances measured confirmed the superior performance of the DSA
plate anode with respect to its corrosion resistance over the DSA mesh and lead
anodes. The variation of the constant phase element, CPE and n, from impedance
plots was also in agreement with the calculated values of double layer capacitance,
Cdl, and roughness factor previously mentioned for the DSAs.

139
Impedance tests were also carried out at different potentials in the region of the OER
reaction. The DSA mesh anode had the lowest Rct values among the three anode
materials probably due to its greater EASA which results in better catalytic
performance.
6.1.1.6 Chronoamperometry (<1s)
Chronoamperometry (<1s) was used for the rapid characterisation of the three anodes.
The results in synthetic electrolyte showed that upon applying a potential step of 1.5
V, the resulting OER current initially decreases and quickly reaches a quasi steady-
state value. For the DSA anodes, the initial decrease in current density represented the
dissolution of the active component occurring during electrolysis. As penetration of
the electrolyte occurred through the mud cracked, porous structure of the thermally
prepared oxide layer, the DSA anodes stabilised at 0.3 seconds. For the lead alloy
anode, the initial decrease in current density may be attributed to the partial blockage
of the electrode surface due to the formation of a passivating layer. However, as the
thickness of the layer increased, the anode stabilised at 0.05 seconds.
6.1.2 Physical Characterisation
6.1.2.1 X-Ray Diffractometry (XRD) analysis of anode materials
The XRD analysis for unused DSAs showed IrO2 and Ta2O5 phases while for used
DSAs the XRD spectrum only showed the presence Ta2O5 and titanium phases. This
is an indication of IrO2 loss from the coating during anode use (Hu et al., 2002). The
unused lead alloy anode spectrum showed only lead and traces of antimony while the
XRD spectrum for a used lead alloy anode revealed the presence of lead sulphate
(PbSO4) on the anode surface.
6.1.2.2 Scanning Electron Microscopy (SEM) analysis
Results from the SEM analysis showed that the Pb/Pb(ΙΙ) redox transition controls the
surface of the lead alloy anode as previously suggested from the open circuit potential

140
measurements and XRD analysis. Surface morphology of the unused DSAs showed a
mud-cracked structure of the oxide coating while for the used DSAs, the absence of
the mud-cracked structure indicated that coating loss had occurred during operation.
6.1.2.3 Energy Dispersive Spectrometry (EDS) analysis
EDS analysis revealed that iridium and tantalum are the major elements on the
surface of the titanium substrate for an unused DSA anode. However, an analysis of a
used DSA anode showed a heavy presence of the titanium substrate and traces of
iridium and tantalum which are the active and inert components respectively. This
EDS result suggests that the failure mechanism of the DSA anodes is due to coating
consumption (reduction in coating thickness) which results in a stronger titanium
signal. The results also indicate that some residual coating remains on the DSA
anodes, after deactivation.
6.1.3 Electrowinning Experiments
Electrowinning tests were carried out in a PVC cell having three separated
compartments, using base metal refinery (BMR) solution of concentration 55 g/l Cu
and 100 g/l H2SO4 at 55 0C and a current density of 190 A/m2. Anodes tested were
two types of DSA plate anodes, two types of DSA mesh anodes and one type of lead
anode.
6.1.3.1 Variation of cell voltage with time
The results show that both DSA 1 and 2 mesh anodes had the lowest average energy
consumption of 41 760 kJ and 41 400 kJ respectively. The cell voltage values in the
cells containing the DSA 1 plate and lead anodes where almost similar in the first 95
hours of operation with mean cell voltages of 1.92 V and 1.84 V respectively.
However, the significant drop in cell voltage for the DSA 1 plate anode to
approximately 1.57 V may indicate that the anode had reached a stable condition at
which any increase in cell voltage after continuous operation would indicate failure or

141
anode deactivation. The cell voltage values for the lead anode remained in the region
of 1.80 V.
For the DSA 2 plate and lead anodes the cell voltage values remained quite high for
the whole duration of the experiment (150 hours), with mean voltages of 2.05 V and
1.96 V respectively. From these results it can be seen that the traditional lead anodes
result in high energy consumption during electrowinning. The DSA 2 plate anode
showed a deviation from DSA 1 anode behaviour since the cell voltage values
remained high during the investigation. This may be attributed to the methods used
during the preparation of this anode, causing the anode to take a longer time than its
DSA 1 plate counterpart to attain its stable condition.
6.1.3.2 Current Efficiency
Overall, the current efficiencies in the electrowinning tests were lower than those
from electrochemical tests which were >> 90 % for all the anodes. This may be
attributed to the presence of iron in the BMR solution which is not contained in
synthetic solution.
The DSA 1 plate anode had the greatest current efficiency of 89.3%, while DSA 1
and DSA 2 mesh anodes had the lowest current efficiencies of 53.5% and 51.0%,
respectively.
A number of factors could have contributed towards the low current efficiencies
which characterised both DSA mesh anodes. Firstly, since coated titanium electrode
have been reported to oxidise ferrous ions to ferric ions, which has a bearing on
current efficiency; the oxidation with mesh anodes may have been more profound
than that resulting from DSA plate anodes. This may have led to reduced cathode
current efficiency in the cells containing these anodes. Other factors such as; precise
material composition, impurities, cross-sectional areas of the cathodes and anode

142
current density could have played a role too in affecting the cathode current
efficiency.
6.1.3.3 XRD analysis and optical micrography of copper deposits
XRD analysis and optical micrography were carried out in order to characterise the
crystallographic orientation and morphology of the copper deposits produced. In four
of the copper deposit samples, the (111) plane was preferred; similar to a standard
copper sample. These were deposits from the DSA 1 plate and mesh anode cells,
DSA 2 plate anode cell and the lead anode cell. However, for the DSA 2 mesh anode
cell, the dominant crystal orientation was in the (200) crystal plane. This is a
deviation from the standard crystal orientation, which can be attributed to the iron
contaminant found in the deposit, which affected the morphology of the copper
deposit (De Filippo et al., 1989).
Copper deposits from the DSA 1 plate, DSA 2 plate and DSA 2 mesh cells had more
than one dominant crystal plane ((111) and (200) planes); the (200) plane being the
second preferred plane for the DSA 1 plate and DSA 2 plate cells. These copper
deposits both exhibited nodular growth. In the DSA 2 mesh cell, the (111) crystal
plane was the second preferred plane and, although the deposit was uniform, it was
impure.
Copper deposits from the cells containing the DSA 1 mesh and lead anodes had one
dominant plane (111). However, a good quality deposit was only produced in the cell
containing the DSA 1 mesh anode. The deposit was uniform and had no traces of
harmful cations like iron or lead which exert a detrimental effect on the deposit
quality thereby reducing its grade.
The copper from the lead cell was contaminated with lead; an indication that the
anode degrades during electrowinning. Lead which accumulates on the edges of the
copper grains inhibits growth of the seeds, thus reducing the final dimensions of the

143
microcrystals. This leads to a reduction in copper conductivity and consequently
reduces not only its grade but also its competitiveness in the market.
All copper deposits also contained traces of copper oxide either as CuO or Cu2O. This
may have been the reason why crystal planes 220, 311 and 222 were not evident in
the copper deposits as is the case with a standard copper sample. In consultation with
other experts in the field, it was noted that there is always some oxygen present in a
cathode. Furthermore, occlusion of electrolyte could have been another main source
of oxygen in the copper deposit. It is therefore possible that these oxides may or may
not have been formed after removal from the cell.
6.1.4 Economic evaluation
The economic evaluation showed that the DSA 1 plate anode had the least energy
consumption per kilogramme of copper produced among all the five anode materials
considered under the investigation. As a result its energy cost was 15% lower than
that of the conventional lead anode. Although both DSA 1 and 2 mesh anodes
exhibited the lowest total energy consumption, they had the highest energy
consumption per kilogramme of copper produced. As a result, their energy costs per
kg copper were 30%-35% greater than the lead anode respectively. This can be
attributed to the low current efficiencies of 53.5% and 51% respectively in the cells
containing these anodes. Energy cost per kg of copper produced for the DSA 2 plate
anode was also 5% higher than that of the lead anode due to the high cell voltage
values in its cell.

144
7 CONCLUSIONS AND RECOMMENDATIONS
7.1 Conclusions
A good anode material should remain inert and enable oxygen to be evolved at the
lowest possible overpotential during the electrowinning process. Electrochemical
tests, physical characterisation techniques and electrowinning of copper from acidic
sulphate media were carried out on DSA and lead anodes in order to determine the
most suitable anode based on stability, energy consumption and copper deposit
quality. The following key findings were made:
7.1.1 Anode Stability
Potentiodynamic polarisation tests showed that the DSA plate anode exhibited the
highest corrosion resistance followed by the DSA mesh anode and lead anode
respectively. The DSA mesh anode’s corrosion rate was three times greater than the
DSA plate anode and almost equivalent to that of the lead anode. This could be a
result of the large electrochemically active surface area (EASA) associated with mesh
anodes as determined from cyclic voltammetry tests. Open circuit potential
measurements performed were also in agreement with these results.
Galvanostatic chronopotentiometry tests showed that lead anode dissolution occurs
during electrowinning of copper, since lead ions were detected in the electrolyte
containing the lead anode. Furthermore, there were traces of iridium, and tantalum in
the electrolyte from both DSA plate and mesh anodes; an indication that the failure
mechanism of DSA anodes not only involves passivation but also coating
consumption due to the interaction between the anodes and the electrolyte (Martelli et
al., 1994, Hu et al. 2002).

145
Life expectancies of the DSA plate, DSA mesh and lead anodes were also assessed
using potentiodynamic polarisation. The lead and DSA mesh anodes showed
spontaneous passivation in synthetic solution, an indication that these anodes are
likely to succumb to failure by passivation earlier than the DSA plate anode.
7.1.2 Cell voltage
Generally, DSA mesh anodes had the lowest mean cell voltages compared to the DSA
plates and lead anodes. Furthermore, it was also noted that DSA anodes of the same
composition may exhibit different behaviours as this depends on the method of
preparation of the anode itself. This was seen for the DSA 2 plate anode cell, whose
mean cell voltage was higher than that of the lead anode cell while the DSA 1 plate
anode had a lower mean cell voltage. Therefore, oxygen overpotential and
conditioning times in DSA anodes depend critically on the method of preparation of
the anode itself.
7.1.3 Techno-economic evaluation
The results from the economic evaluation indicated that although both DSA 1 and 2
mesh anodes exhibited the lowest total energy consumption as a result of the low
mean cell voltages in their cells, these anodes were associated with the highest energy
consumption per kilogramme of copper produced among the five anodes considered
under the electrowinning investigation. This was due to the low current efficiencies of
these mesh anodes. Energy cost per kg of copper produced for the DSA 2 plate anode
was comparable to that of the lead anode due to the high cell voltage values in its cell.
In this investigation, the DSA 1 plate anode had the greatest current efficiency and as
such was associated with the least energy consumption per kilogramme of copper
produced. Therefore, energy saving is not entirely dependent on cell voltage but also
on current efficiency.

146
7.1.4 Cathode contamination
Copper deposits harvested from the lead anode cell, during the electrowinning
process, showed the presence of lead oxide on analysis with an X-ray diffractometer.
7.1.5 Effect of impurities in the electrolyte
Electrowinning tests and galvanostatic chronopotentiometry tests conducted in BMR
solution and synthetic solution containing manganese, revealed that the presence of
contaminants such as iron or manganese in the electrolyte is not only detrimental to
cathode quality and current efficiency, but may also lead to voltage fluctuations and
an increase in anode potential or cell voltage for dimensionally stable anodes.
Therefore, an overall analysis taking all the electrode materials studied under this
investigation into account, indicates that the best electrode option for the
electrowinning of copper in industrial electrolytes is the DSA 1 plate anode.
7.2 Recommendations for future research
There is a need for further classification of dimensionally stable anodes in
terms of the preparation method (solvent of the painting solution, firing
temperature) and composition since it was shown that DSA anodes with the
same material compositions may have different behaviours (anode potentials,
conditioning times). Therefore, the conventional lead anodes used in the
electrowinning of copper may be replaced once a proper classification of the
DSA anodes has been established.
BMR solution contains other impurities such as arsenic, selenium and
chromium, all of which may have an adverse effect on the anode potential and
stability of the anode itself. Thus more research should be done in this area in

147
order to determine how much impurities can override the said benefits of DSA
anodes and to what extent the structure of the titanium substrate and coating
can be modified in order to make it less susceptible to attack by impurities.
Chromates in BMR solution have also been mentioned to react with Ta2O5 in
DSA anode coatings resulting in early deactivation of the anode.
Further investigations can be carried out on other anode materials such as the
Mesh on Lead (MoL), the Pb-Co (0.5-6% Co) and Pb-Co3O4, the titanium-
lead anode (Ti-Pb) and the IrO2-Bi2O3 based anodes, which have been
documented to have advantages over the conventional lead based anodes.
In order to improve the economics of the DSA anodes, the power savings can
be improved further by lowering the oxygen overpotential. The use of
stabilised ruthenium oxide (RuO2) has been reported to be economically
attractive because not only do ruthenium based coatings have a lower oxygen
overpotential than their iridium based counterparts, the cost of ruthenium is
half that of iridum.
More investigation into the effects of anode current density on cathode current
efficiency is required especially on the DSA mesh anodes.
7.3 Expected contribution to knowledge
Most researchers have focused on the behaviour of anode materials in
synthetic solution (copper in sulphuric acid) but this project has shown that
results obtained in synthetic solution are only ideal conditions and do not
exactly satisfy plant conditions, due to the impurities in industrial (BMR)
electrolytes. Therefore, in order to carry out laboratory scale experiments to
simulate electrowinning processes, additional elements found in BMR
electrolytes need to be added in synthetic solutions in order to determine the

148
extent to which each contaminant has a bearing on anode potentials, cell
voltages and deposit morphology.
The research also showed that DSA anodes of the same composition may
exhibit different behaviours as this depends on the method of preparation of
the anode itself.
In this investigation, tests were carried out on DSA mesh anodes which most
researchers have not focused on. The results from this study suggested that,
anode current density may play a role in the determination of cathode current
efficiency. Therefore, further investigations should be done by varying anode
current density in order to determine the extent to which anode current density
may affect cathode current efficiency.
The study also showed that the presence of manganese in copper
electrowinning electrolytes increases anode potentials for the DSAs while it
has a slight depolarising effect on the antimonial lead anode.

149
REFERENCES
Alfantazi, A.M. and Valic, D. (2003) “A Study of Copper Electrowinning
Parameters Using a Statistically Designed Methodology”, Journal of Applied
Electrochemistry, 33 (2), 217-225.
Alfantazi, A.M. and Moskalyk, R.R. (2003) “Conductive Polymer Coatings
for Anodes in Aqueous Electrowinning”, Journal of the Minerals, Metals and
Materials Society 55 (7), 49-55, 57.
Alves, V. A. L., da Silva, A. and Boodts, J. F. C. (1998) “Surface
Characterisation of IrO2/TiO2/CeO2 Oxide Electrodes and Faradaic Impedance
Investigation of the Oxygen Evolution Reaction from Alkaline Solution”, Electrochimica Acta., 44 (8-9), 1525-1534.
Angelinetta, C., Trasatti, S., Atanasoska, Lj.D., Minevski, Z.S. and
Atanasoski, R.T. (1989) “Effect of Preparation on the Surface and
Electrocatalytic Properties of RuO2 + IrO2 Mixed Oxide Electrodes”, Journal
of Materials, Chemistry and Physics, 22 (1-2), 535-546.
Balko, E.N. and Nguyen, P.H. (1991): “Iridium-Tin Mixed Oxide Anode
Coatings”, Journal of Applied Electrochemistry, 21 (8), 678-682.
Bard, A.J., and Faulkner, L.R. “Electrochemical Methods-Fundamentals and
Applications”, John Wiley & Sons, Inc., New York, USA, 1980.
Bard, A. J.; Faulkner, L. R. “Electrochemical Methods. Fundamentals and
Applications” 2nd Ed., John Wiley& Sons, New York, USA, 2001.
Beer, H.B. (1980) “The Invention and Industrial Development of Metal
Anodes, Journal of the Electrochemical Society, 127 (8) 303C-307C.
Biswas, A.K., Davenport, W.G., King, M., and Schlesinger, M. “Extractive
Metallurgy of Copper”, 4th edition, Pergamon, New York, USA, 2002.
Cardarelli, F., Taxil, P., Savall, A., Comninellis, C., Manoli, G. & Leclerc, O.
(1998) “Preparation of Oxygen Evolving Electrodes With Long Service Life
Under Extreme Conditions” Journal of Applied Electrochemistry, 28 (3), 245-
250.

150
Cheng, X. and Hiskey, J.B. (1996) “Fundamental Studies of Copper Anode
Passivation During Electrorefining: Part I. Development of Techniques”,
Metallurgical and Materials Transactions B, 27 (3), 393-398.
Cifuentes, G., Cifuentes, L. and Crisostomo, G. (1998) “A Lead-Acid Battery
Analogue to In Situ Anode Degradation in Copper Electrometallurgy”,
Corrosion Science, 40 (2-3), 225-234.
Comninellis, Ch. and Vercesi, G. P. (1991) “Characterisation of DSA-Type
Oxygen Evolving Electrodes: Choice of a Coating”, Journal of Applied
Electrochemistry, 21 (4), 335-345.
Comninellis, C. (1994) “Electrochemical oxidation of organic pollutants for
wastewater treatment”, In Environmental Oriented Electrochemistry;
Sequeira, C. A. C., Ed.; Elsevier: Amsterdam, Netherlands, 77-102.
Cooper, W.C. (1985) “Advances and Future Prospects in Copper
Electrowinning”, Journal of Applied Electrochemistry, 15 (6), 789-805.
Das, S.C. and Gopala K.P. (1996) “Effect of Fe (III) During Copper
Electrowinning at Higher Current Density”, International Journal of Mineral
Processing, 46 (1-2), 91-105.
Da Silva, L.M., Boodts, J. F. C. and De Faria, L.A. (2001) “Oxygen Evolution
at RuO2(x) + Co3O4 (1−x) Electrodes from Acid Solution”, Electrochimica
Acta, 46 (9), 1369-1375.
Dean, S.W. (1987) “Technical Note: Calculation of Alloy Equivalent
Weight”, Materials Performance, 25 (12), 51-52.
De Assisa, S.L., Wolynec, S. and Costa, I. (2006) “Corrosion characterization
of titanium alloys by electrochemical techniques”, Electrochimica Acta, 51 (8-
9), 1815-1819.
De Filippo, D., Dessi', L. and Rossi, A. (1989) “Effect of Iron (III) and Lead
(II) on the Quality of Copper Electrodeposited from a Pyrophosphate Bath”,
Journal of Applied Electrochemistry, 19 (1), 37-42.

151
De Pauli, C.P. and Trasatti, S. (1995) “Electrochemical Surface
Characterization of IrO2 + SnO2 Mixed Oxide Electrocatalysts”, Journal of
Electroanalytical Chemistry, 396 (1-2), 161-168.
Donachie, M.J. “Titanium: A Technical Guide”, 2nd Ed., ASM International,
Ohio, USA, 2000.
Ferdman, A., (2000) “Insoluble Titanium-Lead Anode for Sulphate
Electrolytes”, US Patent 6129822.
Fierro, S., Nagel, T., Baltruschat, H. and Comninellis, C. (2007)
“Investigation of the Oxygen Evolution Reaction On Ti/IrO2 Electrodes Using
Isotope Labelling and On-Line Mass Spectrometry” Electrochemistry
Communications, 9(8), 1969-1974.
Flewitt, P.E.J. and Wild, R.K. “Physical Methods for Materials
Characterisation”, 2nd Edition, Institute of Physics Publishing, Philadelphia,
USA, 2003.
Forti, J.C., Olivi, P. and De Andrade, A.R. (2001) “Characterisation of
DSA®-Type Coatings with Nominal Composition Ti/Ru0.3Ti(0.7−x) SnxO2
Prepared via a Polymeric Precursor”, Electrochimica Acta, 47 (6), 913-920.
Gilchrist, J.D. “Extraction Metallurgy”, 3rd Edition, Pergamon Press, Oxford,
UK, 1989.
Gosser, D.K. (Jr). “Cyclic Voltammetry: Simulation and Analysis of Reaction
Mechanisms”, VCH Publishers, New York, USA, 1993.
Gupta, C.K. and Mukherjee, T.K. “Hydrometallurgy in Extraction Processes”,
Volume 2, CRC Press, Florida, USA, 1990.
Herlitz, F. (2004) “Titanium in the Electrochemical Industry-Use and
Protection”, Permascand AB, Sweden, [ ]WWW .
Hine, F., Yasuda, M., Noda, T., Yoshida, T. and Okuda, J. (1979)
“Electrochemical Behavior of the Oxide-Coated Metal Anodes”, Journal of
Electrochemical Society, 126 (9), 1439-1445.
Hine, F. “Electrode Processes and Electrochemical Engineering”, Plenum
Press, New York and London, USA&UK, 1985.

152
Hrussanova, A., Mirkova, L. and Dobrev, Ts. (2001) “Anodic Behaviour of
the Pb–Co3O4 Composite Coating in Copper Electrowinning”,
Hydrometallurgy, 60 (3), 199-213.
Hu, C. C., Lee, C. H. and Wen, T. C. (1996) “Oxygen Evolution and
Hypochlorite Production on Ru-Pt Binary Oxides” Journal of Applied
Electrochemistry, 26(1), 72-82.
Hu, J.M., Meng, H.M., Zhang, J.Q. and Cao, C.N. (2002) “Degradation
Mechanism of Long Service Life Ti/IrO2–Ta2O5 Oxide Anodes in Sulphuric
Acid”, Corrosion Science, 44 (8), 1665-1668.
Hu, J., Zhang, J. and Cao, C. (2004) “Oxygen evolution reaction on IrO2-
based DSA® type electrodes: kinetics analysis of Tafel lines and EIS”,
International Journal of Hydrogen Energy, 29 (8), 791-797.
International Center for Diffraction Data (1980), “Mineral Powder Diffraction
File”, JCPDS, Pennsylvania, USA.
Jones, D.A. “Principles and prevention of corrosion, 2nd edition, Prentice
Hall, Upper Saddle River, New Jersey, USA, 1996.
Kao, W.H. and Weibel, V. J. (1992) “Electrochemical Oxidation of
Manganese (II) at a Platinum Electrode” Journal of Applied Electrochemistry,
22 (1), 21-27.
Kear, G. and Walsh, C. (2005) “The Characteristics of a True Tafel Slope”,
Journal of Corrosion and Materials, 30 (6), 51-55.
Kotz, R., Lewerenz, H.J. and Stucki, S. (1983) “XPS Studies of Oxygen
Evolution on Ru and RuO2 Anodes”, Journal of Electrochemical Society, 130
(4), 825-829.
Kristóf, J., Szilágyi, T., Horváth, E., De Battisti, A., Frost, R.L. and Rédey, Á.
(2004) “Investigation of IrO2/Ta2O5 Thin Film Evolution”, Thermochimica
Acta, 413 (1-2), 93-99.
Krysa, J., Kule, L., Mraz, R. and Rousar, I. (1996) “Effect of Coating
Thickness and Surface Treatment of Titanium on the Properties of IrO2-Ta2O5
Anodes”, Journal of Applied Electrochemistry, 26 (10), 999-1005.

153
Kulandaisamy, S., Prabhakar, R.S., Chockalingam, S.C., Visvanathan, S.,
Venkateswaran, K.V., Ramachandran, P. and Nandakumar, V. (1997)
“Performance of Catalytically Activated Anodes in the Electrowinning of
Metals”, Journal of Applied Electrochemistry, 27 (5), 579-583.
Lassali, T.A., Bulhoes, L.O., Abeid, L.M. and Boodts, J.F. (1997) “Surface
Characterisation of Thermally Prepared, Ti-Supported, Ir-Based
Electrocatalysts Containing Ti and Sn”, Journal of the Electrochemical
Society, 144(10), 3348-3354.
Ling, X., Gu, Z.H. and Fahidy, T.Z. (1994) “Effect of Operating Conditions
on Anode Passivation in the Electrorefining of Copper “, Journal of Applied
Electrochemistry, 24 (11), 1109-1115.
Loufty, R.O. and Leroy, R.L. (1978) “Energy Efficiency in Metal
Electrowinning”, Journal of Applied Electrochemistry, 8 (6), 549-555.
Maki, T. (1999) “Evolution of Cathode Quality at Phelps Dodge Mining
Company” In Copper Leaching, Solvent Extraction, and Electrowinning
Technology, ed. Jergensen ll, G.V., SME, Littelton, CO., USA, 223-225.
Martelli, G.N., Ornelas, R. and Faita, G. (1994) “Deactivation Mechanisms Of
Oxygen Evolving Anodes at High Current Densities”, Electrochimica Acta,
39 (11-12), 1551-1558.
Meyers, R. “The Basics of Chemistry (Basics of the Hard Sciences)”,
Greenwood Press, Westport, USA, 2003.
Moats, M., Hardee, K., and Brown, C., (2003) “Mesh-on-Lead Anodes for
Copper Electrowinning”, Journal of Metals, 55(7), 46-48.
Moats, M. and Free, M. (2007) “A Bright Future for Electrowinning”, Journal
of the Minerals, Metals and Materials Society, 59 (10), 34-36.
Moats, M.S. (2008) “Will Lead-based Anodes Ever be Replaced in Aqueous
Electrowinning?”, Journal of Minerals, Metals and Materials Society, 60 (10),
46-49.
Mráz, R. and Krýsa, J. (1994) “Long Service Life IrO2/Ta2O5 Electrodes for
Electroflotation”, Journal of Applied Electrochemistry, 24 (12), 1262-1266.

154
Nicol, M.J. (2006) “Electrowinning and Electrorefining of Metals”, A Course
Presented To Anglo Research.
Nijjer, S., Thonstad, J., and Haarberg, G.M. (2001) “Cyclic and Linear
Voltammetry on Ti/IrO2-Ta2O5-MnOx Electrodes in Sulphuric Acid
Containing Mn2+ Ions”, Electrochimica Acta, 46(23), 3503-3508.
Ortiz, P.I., De Pauli, C.P. and Trasatti, S. (2004) “Composite Materials for
Electrocatalysis: Ti/(SnO2+IrO2) Surface and Electrocatalytic Properties
Studied by Impedance and Chlorine Evolution”, Journal of New Materials for
Electrochemical Systems, 7 (2), 153-159.
Panda B. and Das S. C. (2001) “Electrowinning of Copper from Sulphate
Electrolyte in the Presence of Sulfurous Acid”, Hydrometallurgy, 59 (1), 55-
67.
Pfalzgraff, C.L. (1999) “Do’s and Don’t’s of Tankhouse Design and
Operation” In Copper Leaching, Solvent Extraction, and Electrowinning
Technology, ed. Jergensen ll, G.V., SME, Littelton, CO., USA, 217-221.
Pletcher, D. “Industrial Electrochemistry”, Chapman and Hall, UK, 1982.
Pletcher, D. “A first course in Electrode Processes”, Alresford Press Ltd.,
Alresford, Hants, UK, 1991.
Pourbaix, M. “Atlas of Electrochemical Equilibria, in Aqueous Solutions"
Pergamon Press, New York, USA, 1974.
Rolewicz, J., Comninellis, C., Plattner, E. and Hinden, J. (1988)
“Characterisation of DSA-type electrodes for Oxygen Evolution- 1.
Titanium/Iridium Dioxide-Tantalum Pentoxide Electrode”, Journal of
Electrochimica Acta, 33 (4), 573-580.
Rubel, M., Haasch, R., Mrozek, P., Wieckowski, A., De Pauli, C. and Trasatti,
S. (1994) “Characterization of IrO2-SnO2 Thin Layers by Electron and Ion
Spectroscopies”, Vacuum, 45 (4), 423-427.
Savall, A. (1995) “Electrochemical treatment of industrial organic effluents”,
Chimia International Journal for Chemistry, 49 (1-2), 23-27.
155
Scully, J. C. “The Fundamentals of Corrosion”, 2nd edition, Pergamon Press
Ltd, Headington Hill Hall, Oxford, UK, 1975.
Spinolo, G., Ardizzone, S. and Trasatti, S. (1997) “Surface Characterisation of
Co3O4 Electrodes Prepared by the Sol-Gel Method” Journal of
Electroanalytical Chemistry, 423 (1-2), 49-57.
Sprowls, D.O. “Metals Handbook”, Volume 13, 9th edition, Corrosion, ASM
International, Metals Park, OH., USA, 1987.
Stern, M. and Geary, A.L. (1957) “Electrochemical Polarization: A
Theoretical Analysis of the Shape of Polarization Curves”, Journal of
Electrochemical Society, 104 (1), 56-63.
Trasatti, S. (2000) “Electrocatalysis: understanding the success of DSA®”,
Electrochimica Acta, 45 (15-16), 2377-2385.
Tuffrey, N. Fletcher, H., Marinovich, Y. and McGinnity, J. (2006) “Improved
Anode and Cathode Processes in Base Metal Electrowinning”, AMIRA
Project.
Tyroler, P.M., Sanmiya, T.S., Krueger, D.W. and Stupavsky, S. (1987)
“Copper Electrowinning at Inco's Copper Refinery” In The Electrorefming
and Winning of Copper, ed. J.E. Hoffmann, R.G., Bautista, V.A., Ettel, V.,
Kudryk, R.J., Wesely, published by The Metallurgical Society Inc., 421-435.
Uchida, I., Urushibata, H. and Toshima, S. (1981) “Electrocatalysis for
Chlorine Electrode Reaction on RuO2 Electrode in NaAlCl4 Melt”, Journal of
Electrochemical Society, 128 (11), 2351-2357.
Vercesi, G.P., Salamin, J.Y. and Comninellis, Ch. (1991) “Morphological and
Microstructural Study of the Ti/IrO2-Ta2O5 Electrode: Effect of the
Preparation Temperature”, Electrochimica Acta, 36 (5-6), 991-998.
Weems, D., Schledorn, M. and Farmer, M. D. (2005) “An Insoluble Titanium-
Lead Anode for Sulphate Electrolytes”, Electrodes International, Inc.
Technical Report.

156
Xu, L. K. and Scantlebury, J. D. (2003), “Electrochemical Surface
Characterisation of IrO2-Ta2O5 Coated Titanium Electrodes in Na2SO4
Solution”, Journal of the Electrochemical Society, 150 (6), B288-B293.
Yoshio, T., Norihiro, Y. and Wataru, S., (2008) "Oxygen reduction behaviour
of RuO2/Ti, IrO2/Ti and IrM (M: Ru, Mo, W, V) Ox/Ti binary oxide electrodes
in a sulphuric acid solution", Electrochemistry Communications, 10(4), 668-
672.
Yu, Pu. and O’Keefe, T.J. (1999) “Evaluation of Lead Anode Reactions in
Acid Sulphate Electrolytes I. Lead Alloys with Cobalt Additive”, Journal of
the Electrochemical Society, 146 (4), 1361-1369.
Yu, Pu. and O’Keefe, T.J. (2002) “Evaluation of Lead Anode Reactions in
Acid Sulphate Electrolytes II. Manganese Reactions”, Journal of the
Electrochemical Society, 149 (5), A558-A569.
Zhang, W. and Cheng, C.Y. (2007) “Manganese Metallurgy Review. Part III:
Manganese Control in Zinc and Copper Electrolytes”, Hydrometallurgy, 89
(3-4), 178-188.
Other Bibliographic Sources Consulted and Used
Christensen, P. A., and Hamnett, A. “Techniques and Mechanisms in
Electrochemistry”, Chapman and Hall, Oxford, UK, 1994.
Comninellis, Ch. and Vercesi, G. P. (1991) “Problems in DSA Coating
Deposition by Thermal Decomposition”, Journal of Applied Electrochemistry,
21 (2), 136-142.
(http://www.coleparmer.com/techinfo/techinfo.asp?htmlfile=pump_challenge.
htm&ID=623)
http://www.permascand.com/content/leftmenu/electrochemical_systems-
general/images/R&D0411.pdf (2 November 2007).
http://www.cp.umist.ac.uk

157
Kotz, R., and Stucki, S. (1986) “Stabilisation of RuO2 by IrO2 for Anodic
Oxygen Evolution in Acid Media”, Electrochimica Acta, 31 (10).
Laibach, S., Anastasijevic, N., Nepper, J.P., Bilson, E. and Grider J. (2001)
“Innovations in Electrowinning Technology”, (11 November 2007).
www.hydrometallurgysection.org/2001electro/paperno2-6.pdf
Massot, L., Palau, P., A. Savall, A. and Taxil, P. (2006) “Comparison between
Derived Sol-Gel and Conventional Methods for the Preparation of
Dimensionally Stable Ta/IrO2 Anodes for Oxygen Evolution”, Journal of New
Materials for Electrochemical Systems 10, 123-128.
Princeton Applied Research, “Electrochemistry and Corrosion Overview and
Techniques”.
Rashkov, S., Dobrev, T., Noncheva, Z., Stefanov, Y., Rashkova, B., and
Petrova, M., (1999) “Lead-Cobalt Anodes for Electrowinning of Zinc from
Sulphate Electrolytes”, Hydrometallurgy, 52(3), 223-230.
Straumanis, M. and Chen, P. (1951) “The corrosion of titanium in acids: the
rate of solution in sulphuric, hydrochloric, hydrobromic and hydroiodic
acids”, Corrosion 7 (7), 229-237.
Trasatti, S., and Buzzanca, G. (1971) “Ruthenium Dioxide: A New Interesting
Electrode Material, Solid State Structure and Electrochemical Behaviour”,
Journal of Electroanalytical Chemistry”, 29 (1), 1-5.

158
APPENDICES

159
APPENDIX A: FLOW RATE CALCULATIONS
Concentration of copper in BMR electrolyte = lg /55
Volume of electrolyte per cell = l16
∴Total mass of copper in electrolyte per cell:
glgl
880/5516
=×
27.5g
Minimum concentration of copper = lg /5.47
∴Minimum mass of copper in spent electrolyte:
glgl
760/5.4716
=×
23.75
∴Amount of copper deposited:
ggg
120760880
=−
3.75
Applied Current per cell:
( ) ( )AAreajdensityCurrentI ×=

160
( )22376.0
233.036.0m
facesAareaAnode=
××=
A
mmAI
46
2376.0190 22
≈
×=
0.019A
Assuming 90% current efficiency:
IMWnFt
ε∆
=
hrst 44.25.63*46*9.0
120*96500*2== 666528.52
185.14
Sincet
VQ = ; At t =2.44 hrs:
min/110/56.6
min/02.044.2
16
mlhrl
lQ
==
==

161
G iv e n p a r a m e t e r S a m e C S a m e CS e t p a r a m e te r S a m e c u r re n t d e n s i t y S a m e c u r r e n t d e n s i t y
S a m e c y c le t im e S a m e c y c le t im e
P a r a m e te r U n i t P la n t M in i - c e l l ( B M R ) W it s c e l l
C e l l L e n g th m 4 .1 0 0 0 .5 2 0 . 3 7 5W id t h m 1 .0 5 0 0 .2 9 0 . 1 2D e p th m 1 .3 0 0 0 . 3A c t iv e d e p t h m 1 .0 9 2 0 .2 7 5 0 . 3 7R e a l v o lu m e m 3 5 .6 0 .0 4 5 0 . 0 0 0A c t iv e V o lu m e m 3 4 .7 0 .0 4 1 0 . 0 1 7F lo w r a t e m 3 /h r 0 .3 3 0 .0 0 2 6 0 . 0 0 6 7
l / m in 5 .5 0 .0 4 4 0 0 . 1 1 1 2l / h r 3 3 0 2 .6 3 9 6 . 6 7 0
R e s id e n c e t im e h 1 4 .2 1 5 . 7 2 .5V o lu m e e le c t r o ly te p e r c y c le L 5 5 4 4 0 4 4 3 1 1 2 1
I n le t c o n c g /L 7 5 7 5 5 5O u t le t c o n c g /L 3 5 3 5 4 7 .5R a te o f p la t in g g /h 1 3 2 0 0 1 0 6 5 0P la t in g c y lc e h 1 6 8 1 6 8 1 6 8P la t e d m a s s k g 2 2 1 7 .6 1 8 8
C u r re n t A 1 3 0 0 0 9 9 4 7C u r re n t D e n s i ty A / m 2 1 9 2 1 9 2 1 9 2
C a t h o d e T h ic k m 0 . 0 0 0 9 2 0 .0 0 0 9 2 0 .0 0 0 9 2W id t h m 0 .9 2 0 .2 8 0 . 3 3H e ig h t m 0 .9 2 0 .2 3 0 . 3 7S u r a c e a r e a ( o n e f a c e ) m 2 0 .8 5 0 .0 6 0 . 1 2S u r f a c e a r e a p e r c a th o d e ( 2 s id e sm 2 1 .7 0 .1 3 0 . 2 4 4N o . o f c a t h o d e s 4 0 4 1T o ta l s u r f a c e a re a m 2 6 8 0 .5 1 5 0 . 2 4 4M a s s p e r c a t h o d e k g 5 5 .4 4 0 4 .4 3 3 8 . 4 0 4M a s s p e r c a t h o d e 's id e ' k g 2 7 .7 2 0 2 .2 1 6 4 . 2 0 2S p e c i f ic m a s s c a t h o d e k g / m 2 3 2 .7 5 0 3 4 .4 1 6 3 4 . 4 1 6
F a r a d a y m a s s p la te d g 2 2 1 7 6 0 0 1 7 7 3 1 8 4 0 4m o l 2 2 2F a r a d a y A s / m o l 9 6 4 8 5 9 6 4 8 5 9 6 4 8 5M g /m o l 6 3 .5 5 6 3 .5 5 6 3 . 5 5t im e s 6 0 4 8 0 0 6 0 4 8 0 0 6 0 4 8 0 0T h e o r e t i c a l c u r re n t A 1 1 1 3 3 .8 6 8 9 4 2C u r re n t e f f i c ie n c y % 8 6 9 0 9 0
A d d in f o C a th o ly t e t o s u r f a c e a r e a m 3 /m 2 0 .0 6 9 4 0 .0 8 0 5 0 . 0 6 8 2
APPENDIX B: OPERATING PARAMETERS

162
APPENDIX C: HEATER SIZING
Assumptions:
-All calculations were based on synthetic electrolyte.
- Specific heat capacity of solution is similar to the specific heat capacity of water.
a) Calculation of the power required to heat the solution and container:
htTmcP
*860∆
= …………………………………………………………………………4.2
Where,
P- power (kW)
m- mass (kg)
c- specific heat capacity (kcalories/kg0C)
T∆ - temperature rise (0C)
ht - heat-up time (hours)
VolumeDensitymMass *)( =
llkgmMass 16*/3.1)( =
kWkWP 48.02*860
40*1*16*3.1)( ==
b) Calculation of the power required to heat the container:
kWkWP 066.01*860
40*25.0*7.5)( ==

163
c) Calculation of the power required to overcome heat losses:
kWkWlossesHeat 11.0)066.048.0(*2.0 =+=
d) Total Heat Rating
kWratingHeat 66.011.0066.048.0 =++=

164
APPENDIX D: CURVES SHOWING REPRODUCIBILITY OF RESULTS
Figure 1: Open Circuit Potential Tests for the Lead Anode.
Figure 2: Open Circuit Potential Tests for the DSA Plate Anode.
0
0.02
0.04
0.06
0.08
0.1
0.12
0 2000 4000 6000 8000
Pote
ntia
l vs A
g/A
gCl
Time (s)
Open circuit potential tests
a. lead anode run 1 b. lead anode run 2 c. lead anode run 3
0
0.1
0.2
0.3
0.4
0.5
0.6
0.7
0 2000 4000 6000 8000
Pote
ntia
l vs A
g/A
gCl (
V)
Time (s)
Open circuit potential tests
a. DSA plate run 1 b. DSA plate run 2 c. DSA plate run 3

F
F
Figure 3: Ope
Figure 4: Tafe
-0.6
-0.4
-0.2
0
0.2
0.4
0.6
0.8
1
1.2
1.4
0.000Pote
ntia
l vs A
g/A
gCl (
V)
en Circuit Pote
el Plots for the
001 0.
a. lead an
ential Tests fo
e Lead Anode
.0001
Log
node run 1
165
or the Lead An
e.
0.001
g. current de
Tafel plot
c. lead anode
node.
0.01
ensity (A/cm
s
de run 3
0.1
m2)
b. lead anode ru
1
un 2
1

166
Figure 5: Tafel Plots for the DSA Plate Anode.
Figure 6: Tafel Plots for the DSA Mesh Anode.
-0.6
-0.4
-0.2
0
0.2
0.4
0.6
0.8
1
1.2
1.4
0.00001 0.0001 0.001 0.01 0.1 1Pote
ntia
l vs A
g/A
gCl (
V)
Log. current density (A/cm2)
Tafel plots
a.DSA plate run 1 b. DSA plate run 2 c. DSA plate run 3
-0.6
-0.4
-0.2
0
0.2
0.4
0.6
0.8
1
1.2
1.4
0.0001 0.001 0.01 0.1 1Pote
ntia
l vs A
g/A
gCl (
V)
Log. current density (A/cm2)
Tafel plots
c. DSA mesh run 3 a. DSA mesh run 1 b. DSA mesh run 2

167
Figure 7: Tafel Plots for the DSA Plate Anode in the Potential Range (-0.4 V to 1.4 V).
Figure 8: Galvanostatic Chronopotentiometry Curves for the Lead Anode.
-0.6
-0.4
-0.2
0
0.2
0.4
0.6
0.8
1
1.2
1.4
1.6
0.00001 0.0001 0.001 0.01 0.1 1
Pote
ntia
l vs A
g/A
gCl (
V)
Log. current density (A/cm2)
Tafel plots for DSA plate anode (-0.4 to 1.4 V)
a. DSA plate run 1 b. DSA plate run 2 c. DSA plate run 3
0
0.5
1
1.5
2
2.5
0 1000 2000 3000 4000 5000 6000 7000 8000
Ano
de p
oten
tial v
s Ag/
AgC
l (V
)
Time (s)
Anode potential against time
a. lead anode run 1 b. lead anode run 2 c. lead anode run 3

168
Figure 9: Galvanostatic Chronopotentiometry Curves for the DSA Plate Anode.
Figure 10: Galvanostatic Chronopotentiometry Curves for Mesh Anodes.
0
0.5
1
1.5
2
0 2000 4000 6000 8000
Ano
de p
oten
tial v
s Ag/
AgC
l (V
)
Time (s)
Anode potential against time
a. DSA plate run 1 b. DSA plate run 2 c. DSA plate run 3
0
0.5
1
1.5
2
0 2000 4000 6000 8000
Ano
de p
oten
tial v
s Ag/
AgC
l (V
)
Time (s)
Anode potential against time
a. DSA mesh run 1 b. DSA mesh run 2 c. DSA mesh run 3

169
Figure 11: Cyclic Voltammograms for a DSA Plate Anode.
Figure 12: Cyclic Voltammograms for a DSA Mesh Anode.
-1.50E-02
-1.00E-02
-5.00E-03
0.00E+00
5.00E-03
1.00E-02
-1 -0.5 0 0.5 1 1.5 2
Cur
rent
den
sity
(A/c
m2 )
Potential vs Ag/AgCl (V)
Cyclic voltammograms for a DSA plate
a. DSA plate run 1 b. DSA plate run 2 c. DSA plate run 3
-5.00E-02-4.00E-02-3.00E-02-2.00E-02-1.00E-020.00E+001.00E-022.00E-023.00E-024.00E-025.00E-02
-1 -0.5 0 0.5 1 1.5 2
Cur
rent
den
sity
(A/c
m2 )
Potential vs Ag/AgCl (V)
Cyclic voltammograms for a DSA mesh
a. DSA mesh run 1 b. DSA mesh run 2 c. DSA mesh run 3

170
Figure 13: Chronoamperometry Tests for a Lead Anode.
Figure 14: Chronoamperometry Tests for a DSA plate Anode.
0.00E+00
1.00E-02
2.00E-02
3.00E-02
4.00E-02
5.00E-02
6.00E-02
0 0.2 0.4 0.6 0.8 1 1.2
Cur
rent
den
sity
(A/c
m2 )
Time (s)
Chronoamperometry (< 1 s)
a. lead anode run 1 b. lead anode run 2 c. lead anode run 3
0.00E+00
2.00E-02
4.00E-02
6.00E-02
8.00E-02
1.00E-01
1.20E-01
0 0.2 0.4 0.6 0.8 1 1.2
Cur
rent
den
sity
(A/c
m2 )
Time (s)
Chronoamperometry (< 1 s)
a. DSA plate run 1 b. DSA plate run 2

171
Figure 15: Chronoamperometry Tests for a DSA Mesh Anode.
Figure 16: Galvanostatic Chronopotentiometry Curves for the Lead Anode in
Synthetic/Manganese Solution.
0.00E+00
5.00E-03
1.00E-02
1.50E-02
2.00E-02
2.50E-02
0 0.2 0.4 0.6 0.8 1 1.2
Cur
rent
den
sity (
A/cm
2 )
Time (s)
Chronoamperometry (< 1 s)
a. DSA mesh run 1 b. DSA mesh run 2
0
0.5
1
1.5
2
2.5
0 2000 4000 6000 8000
Anod
e pot
entia
l vs A
g/Ag
Cl
Time (s)
Anode potential against time
a. Lead anode in synthetic/manganese solution run 1
b. Lead anode in synthetic/manganese solution run 2

172
Figure 17: Galvanostatic Chronopotentiometry Curves for the DSA Plate Anode in
Synthetic/Manganese Solution.
Figure 18: Galvanostatic Chronopotentiometry Curves for the DSA Mesh Anode in
Synthetic/Manganese Solution.
00.20.40.60.8
11.21.41.61.8
2
0 1000 2000 3000 4000 5000 6000 7000 8000Ano
de p
oten
tial v
s Ag/
AgC
l (V
)
Time (s)
Anode potential against time
a. DSA plate run 1 in synthetic/manganese solutionb. DSA plate run 2 in synthetic/manganese solution
11.11.21.31.41.51.61.71.8
0 2000 4000 6000 8000
Ano
de p
oten
tial v
s Ag/
AgC
l (V
)
Time (s)
Anode potential against time
a. DSA mesh in synthetic/manganese solution run1 b. DSA mesh in synthetic/manganese solution run 2

173
Figure 19: Consecutive Cyclic Voltammograms for the Lead Anode Performed Before
Electrochemical Impedance Tests.
-1.00E-01
-5.00E-02
0.00E+00
5.00E-02
1.00E-01
1.50E-01
0 0.5 1 1.5 2 2.5
Cur
rent
Den
sity
(A/c
m2 )
Potential vs Ag/AgCl
Cyclic Voltammograms for a Lead Anode
scan 1 scan 5 scan 10 scan 15 scan 20 scan 25scan 30 scan 35 scan 40 scan 45 scan 50 scan 55

174
APPENDIX E: GALVANOSTATIC CHRONOPOTENTIOMETRY CURVES
WITH SIMILAR ANODE/CATHODE AREAS AND CURRENT
EFFICIENCIES
Figure 20: Galvanostatic Chronopotentiometry Curves for the Lead Anode.
Figure 21: Galvanostatic Chronopotentiometry Curves for the DSA Plate Anode.
0
0.5
1
1.5
2
2.5
0 2000 4000 6000 8000
Anod
e pot
entia
l vs A
g/AgC
l (V)
Time (s)
Anode potential against time
a. lead anode run 1 b.lead anode run 2
00.20.40.60.8
11.21.41.61.8
2
0 1000 2000 3000 4000 5000 6000 7000 8000
Ano
de p
oten
tial v
s Ag/
AgC
l (V
)
Time (s)
Anode potential against time
a. DSA plate run 1 b. DSA plate run 2

175
Figure 22: Galvanostatic Chronopotentiometry Curves for the DSA Mesh Anode.
Table 1: Determination of Current Efficiency
Pb/Sb Value
Weight gained by the cathode (g) 0.044
Anode/cathode area (cm2) 1.00
Current density (A/cm2) 0.019
Current (A) 0.019
Volume of electrolyte injected (ml/hr) 2.7
Current efficiency (%) 97.8
Ti-Ta2O5/IrO2 (plate)
Weight gained by the cathode (g) 0.056
Anode/cathode area (cm2) 1.28
Current density (A/cm2) 0.019
Current (A) 0.024
Volume of electrolyte injected (ml/hr) 3.4
Current efficiency (%) 97.8
Ti-Ta2O5/IrO2 (mesh)
Weight gained by the cathode (g) 0.032
00.20.40.60.8
11.21.41.61.8
0 1000 2000 3000 4000 5000 6000 7000 8000Ano
de p
ontia
l vs A
g/A
gCl (
V)
Time (s)
Anode potential against time
a. DSA mesh run 1 b. DSA mesh run 2

176
Anode/cathode area (cm2) 0.75
Current density (A/cm2) 0.019
Current (A) 0.014
Volume of electrolyte injected (ml/hr) 2.0
Current efficiency (%) 97.7

177
APPENDIX F: DATA FOR FIGURES
A sample of part of the raw data used to plot figure 5.31 in the electrowinning tests is
shown below. Real time monitoring of the cell voltage with time was done by means
of data loggers for all the anodes.
Anode Time
Cell voltage
(V)
Anode Cell voltage (V) Anode Cell voltage (V)
DSA
plate 0:00'0.000" 2.131
DSA mesh 2.122 lead 2.374
0:08'0.000" 2.068 2.006 2.188
0:16'0.000" 2.073 1.957 2.143
0:24'0.000" 2.079 1.949 2.106
0:32'0.000" 1.995 1.919 2.05
0:40'0.000" 1.993 1.933 2.027
0:48'0.000" 1.972 1.924 2.025
0:56'0.000" 1.968 1.9 2.032
1:04'0.000" 1.955 1.868 2.023
1:12'0.000" 1.958 1.907 2.003
1:20'0.000" 1.96 1.879 2.002
1:28'0.000" 1.952 1.845 2.01
1:36'0.000" 1.944 1.874 2.008
1:44'0.000" 1.959 1.883 2.003
1:52'0.000" 1.974 1.886 1.999
2:00'0.000" 1.939 1.894 1.998
2:08'0.000" 1.945 1.845 2.009
2:16'0.000" 1.975 1.8 2.01
2:24'0.000" 1.955 1.886 1.982
2:32'0.000" 1.945 1.878 1.992
2:40'0.000" 1.938 1.865 2.003
2:48'0.000" 1.956 1.863 2.002
2:56'0.000" 1.956 1.876 1.988
3:04'0.000" 1.944 1.893 1.986
3:12'0.000" 1.94 1.845 1.999
3:20'0.000" 1.934 1.884 1.98
3:28'0.000" 1.941 1.867 1.974
3:36'0.000" 1.937 1.847 1.978
3:44'0.000" 1.946 1.891 2.001
3:52'0.000" 1.965 1.9 1.977
4:00'0.000" 1.958 1.848 1.981
4:08'0.000" 1.959 1.851 1.987
4:16'0.000" 1.935 1.899 1.998

178
4:24'0.000" 1.953 1.884 1.987
4:32'0.000" 1.961 1.873 1.983
4:40'0.000" 1.96 1.905 1.986
4:48'0.000" 1.955 1.881 1.985
4:56'0.000" 1.932 1.867 1.973
5:04'0.000" 1.94 1.916 1.977
5:12'0.000" 1.93 1.88 1.968
5:20'0.000" 1.943 1.878 1.99
5:28'0.000" 1.944 1.908 1.977
5:36'0.000" 1.939 1.859 1.972
5:44'0.000" 1.933 1.877 1.968
5:52'0.000" 1.928 1.873 1.969
6:00'0.000" 1.932 1.872 1.972
6:08'0.000" 1.936 1.899 1.972
6:16'0.000" 1.957 1.893 1.99
6:24'0.000" 1.943 1.895 1.977
6:32'0.000" 1.923 1.878 1.967
6:40'0.000" 1.921 1.878 1.967
6:48'0.000" 1.92 1.885 1.964
6:56'0.000" 1.932 1.895 1.962
7:04'0.000" 1.966 1.744 1.977
7:12'0.000" 1.975 1.655 2.006
7:20'0.000" 1.921 1.945 1.956
7:28'0.000" 1.927 1.884 1.961
7:36'0.000" 1.985 1.633 2.01
7:44'0.000" 1.942 1.849 1.981
7:52'0.000" 1.994 1.743 1.977
8:00'0.000" 1.933 1.894 1.964
8:08'0.000" 1.956 1.652 1.998
8:16'0.000" 1.948 1.768 1.987
8:24'0.000" 1.926 1.872 1.951
8:32'0.000" 1.928 1.896 1.969
8:40'0.000" 2.022 1.521 2.033
8:48'0.000" 1.91 1.943 1.953
8:56'0.000" 1.951 1.905 1.971
9:04'0.000" 1.931 1.822 1.971
9:12'0.000" 1.919 1.889 1.974
9:20'0.000" 2.017 1.588 2.004
9:28'0.000" 1.928 1.815 1.962
9:36'0.000" 1.909 1.917 1.961
9:44'0.000" 1.898 1.882 1.966
9:52'0.000" 1.932 1.908 1.955
10:00'0.000" 1.933 1.909 1.972
179
10:08'0.000" 1.965 1.686 2.002
10:16'0.000" 1.954 1.758 1.973
10:24'0.000" 1.991 1.653 1.992
10:32'0.000" 1.922 1.836 1.967
10:40'0.000" 1.883 1.927 1.951
10:48'0.000" 1.957 1.697 1.975
10:56'0.000" 1.951 1.759 1.974
11:04'0.000" 1.922 1.815 1.972
11:12'0.000" 1.913 1.853 1.956
11:20'0.000" 1.973 1.6 1.991
11:28'0.000" 1.933 1.817 1.967
11:36'0.000" 1.903 1.906 1.96
11:44'0.000" 1.931 1.815 1.959
11:52'0.000" 1.915 1.891 1.961
12:00'0.000" 1.922 1.918 1.967
12:08'0.000" 1.913 1.917 1.956
12:16'0.000" 1.905 1.911 1.953
12:24'0.000" 1.937 1.883 1.956
12:32'0.000" 1.919 1.828 1.96
12:40'0.000" 1.899 1.894 1.946
12:48'0.000" 1.908 1.867 1.957
12:56'0.000" 1.91 1.863 1.962
13:04'0.000" 1.914 1.85 1.954
13:12'0.000" 1.899 1.89 1.954
13:20'0.000" 1.982 1.621 2.002
13:28'0.000" 1.945 1.807 1.971
13:36'0.000" 1.982 1.632 1.995
13:44'0.000" 1.986 1.568 2.007
13:52'0.000" 2.005 1.547 2.016
14:00'0.000" 1.915 1.876 1.946
14:08'0.000" 1.906 1.892 1.959
14:16'0.000" 1.916 1.884 1.965
14:24'0.000" 1.933 1.885 1.964
14:32'0.000" 1.927 1.837 1.961
14:40'0.000" 1.904 1.887 1.955
14:48'0.000" 1.898 1.895 1.954
14:56'0.000" 2.001 1.541 2.001
15:04'0.000" 1.958 1.687 1.99
15:12'0.000" 1.969 1.654 2.005
15:20'0.000" 1.979 1.703 1.977
15:28'0.000" 1.904 1.938 1.95
15:36'0.000" 1.903 1.882 1.962
15:44'0.000" 1.919 1.86 1.962

180
15:52'0.000" 1.986 1.619 1.989
16:00'0.000" 1.972 1.647 1.994
16:08'0.000" 1.896 1.928 1.96
16:16'0.000" 1.906 1.903 1.949
16:24'0.000" 1.916 1.891 1.955
16:32'0.000" 1.955 1.669 1.988
16:40'0.000" 1.891 1.897 1.949
16:48'0.000" 1.915 1.847 1.943
16:56'0.000" 1.9 1.879 1.951
17:04'0.000" 1.89 1.871 1.959
17:12'0.000" 1.957 1.742 1.968
17:20'0.000" 1.92 1.908 1.952
17:28'0.000" 1.947 1.646 1.989
17:36'0.000" 1.965 1.713 1.983
17:44'0.000" 1.973 1.723 1.977
17:52'0.000" 1.898 1.946 1.942
18:00'0.000" 1.881 1.897 1.949
18:08'0.000" 1.966 1.607 1.981
18:16'0.000" 2.001 1.613 2.003
18:24'0.000" 1.899 1.91 1.954
18:32'0.000" 1.938 1.694 1.975
18:40'0.000" 1.91 1.919 1.943
18:48'0.000" 1.914 1.867 1.956
18:56'0.000" 1.94 1.679 2.003
19:04'0.000" 1.908 1.91 1.95
19:12'0.000" 1.923 1.857 1.951
19:20'0.000" 1.914 1.911 1.957
19:28'0.000" 1.959 1.68 2.002
19:36'0.000" 1.976 1.637 2.014
19:44'0.000" 1.908 1.881 1.942
19:52'0.000" 1.974 1.627 1.987
20:00'0.000" 1.922 1.825 1.967
20:08'0.000" 1.945 1.675 1.995
20:16'0.000" 1.978 1.648 1.994
20:24'0.000" 1.987 1.583 2.004
20:32'0.000" 2.007 1.574 2.016
20:40'0.000" 1.965 1.634 2.012
20:48'0.000" 1.993 1.511 2.034
20:56'0.000" 1.961 1.64 1.982
21:04'0.000" 1.923 1.924 1.958
21:12'0.000" 1.954 1.645 2.001
21:20'0.000" 1.895 1.868 1.971
21:28'0.000" 1.962 1.673 2.011

181
21:36'0.000" 1.984 1.629 2.004
21:44'0.000" 1.991 1.576 2.021
21:52'0.000" 1.896 1.456 1.959
22:00'0.000" 1.886 1.901 1.959
22:08'0.000" 1.906 1.86 1.959
22:16'0.000" 1.903 1.859 1.942
22:24'0.000" 1.895 1.893 2.005
22:32'0.000" 1.962 1.662 2.008
22:40'0.000" 1.977 1.646 1.98
22:48'0.000" 1.98 1.682 1.981
22:56'0.000" 1.918 1.844 1.961
23:04'0.000" 1.899 1.919 1.936
23:12'0.000" 1.9 1.858 1.917
23:20'0.000" 1.919 1.636 1.954
23:28'0.000" 1.909 1.674 1.957
23:36'0.000" 1.884 1.786 1.926
23:44'0.000" 1.877 1.874 1.906
23:52'0.000" 1.916 1.702 1.948
24:00'0.000" 1.864 1.63 1.933
24:08'0.000" 1.889 1.601 1.905
24:16'0.000" 1.888 1.594 1.922
24:24'0.000" 1.9 1.539 1.943
24:32'0.000" 1.799 1.86 1.937
24:40'0.000" 1.916 1.575 1.928
24:48'0.000" 1.92 1.565 1.948
24:56'0.000" 1.878 1.707 1.927
25:04'0.000" 1.866 1.988 1.915
25:12'0.000" 1.958 1.653 1.96
25:20'0.000" 1.951 1.634 1.973
25:28'0.000" 1.987 1.452 2.001
25:36'0.000" 1.905 1.838 1.926
25:44'0.000" 1.891 1.903 1.914
25:52'0.000" 1.88 1.908 1.931
26:00'0.000" 1.963 1.626 1.975
26:08'0.000" 1.972 1.61 1.96
26:16'0.000" 1.925 1.694 1.952
26:24'0.000" 1.94 1.636 1.962
26:32'0.000" 1.944 1.661 1.95
26:40'0.000" 1.957 1.681 1.951
26:48'0.000" 1.893 1.913 1.927
26:56'0.000" 1.946 1.683 1.963
27:04'0.000" 1.931 1.81 1.929
27:12'0.000" 1.915 1.839 1.92

182
27:20'0.000" 1.898 1.874 1.916
27:28'0.000" 1.965 1.632 1.966
27:36'0.000" 1.915 1.898 1.907
27:44'0.000" 1.985 1.624 1.964
27:52'0.000" 1.978 1.585 1.972
28:00'0.000" 1.977 1.633 1.963
28:08'0.000" 1.971 1.801 1.931
28:16'0.000" 1.953 1.669 1.937
28:24'0.000" 1.999 1.489 1.976
28:32'0.000" 1.993 1.581 1.946
28:40'0.000" 1.905 1.898 1.906
28:48'0.000" 1.968 1.647 1.957
28:56'0.000" 1.958 1.714 1.937
29:04'0.000" 1.906 1.908 1.899
29:12'0.000" 1.972 1.626 1.95
29:20'0.000" 2.002 1.52 1.959
29:28'0.000" 1.955 1.639 1.941
29:36'0.000" 1.911 1.789 1.898
29:44'0.000" 1.973 1.649 1.944
29:52'0.000" 1.985 1.621 1.956
30:00'0.000" 2.001 1.208 1.925
30:08'0.000" 2.035 1.621 1.936
30:16'0.000" 2.039 1.564 1.931
30:24'0.000" 2.025 1.686 1.923
30:32'0.000" 1.975 1.625 1.921
30:40'0.000" 2.04 1.645 1.919
30:48'0.000" 1.975 1.882 1.888
30:56'0.000" 1.975 1.87 1.884
31:04'0.000" 2.047 1.609 1.917
31:12'0.000" 2.028 1.713 1.905
31:20'0.000" 1.986 1.912 1.889
31:28'0.000" 2.052 1.588 1.922
31:36'0.000" 2.024 1.634 1.907
31:44'0.000" 1.992 1.785 1.9
31:52'0.000" 1.99 1.747 1.895
32:00'0.000" 2.041 1.731 1.907
32:08'0.000" 2.017 1.808 1.901
32:16'0.000" 1.993 1.837 1.892
32:24'0.000" 2.045 1.684 1.922
32:32'0.000" 2.01 1.852 1.892
32:40'0.000" 2.038 1.515 1.969
32:48'0.000" 1.923 1.882 1.912
32:56'0.000" 2.022 1.699 1.954
183
33:04'0.000" 1.945 1.901 1.914
33:12'0.000" 2.029 1.715 1.959
33:20'0.000" 2.003 1.642 1.951
33:28'0.000" 2.009 1.659 1.941
33:36'0.000" 1.943 1.926 1.951
33:44'0.000" 1.905 1.864 1.914
33:52'0.000" 1.991 1.675 1.941
34:00'0.000" 2.019 1.596 1.948
34:08'0.000" 2.031 1.586 1.958
34:16'0.000" 1.917 1.85 1.906
34:24'0.000" 1.994 1.678 1.928
34:32'0.000" 1.977 1.747 1.923
34:40'0.000" 1.947 1.887 1.915
34:48'0.000" 1.94 1.9 1.982
34:56'0.000" 1.996 1.78 1.917
35:04'0.000" 1.956 1.91 1.915
35:12'0.000" 1.939 1.909 1.921
35:20'0.000" 2.008 1.683 1.942
35:28'0.000" 2.029 1.611 1.949
35:36'0.000" 2.033 1.642 1.951
35:44'0.000" 2.007 1.741 1.955
35:52'0.000" 1.988 1.724 1.925
36:00'0.000" 1.992 1.696 1.931
36:08'0.000" 1.971 1.738 1.927
36:16'0.000" 1.97 1.72 1.919
36:24'0.000" 1.942 1.853 1.905
36:32'0.000" 1.947 1.859 1.914
36:40'0.000" 1.939 1.921 1.919
36:48'0.000" 1.95 1.885 1.9
36:56'0.000" 1.969 1.869 1.908
37:04'0.000" 2.023 1.643 1.95
37:12'0.000" 1.985 1.779 1.926
37:20'0.000" 2.027 1.691 1.922
37:28'0.000" 1.98 1.749 1.934
37:36'0.000" 2.009 1.724 1.936
37:44'0.000" 1.957 1.929 1.898
37:52'0.000" 2.023 1.701 1.946
38:00'0.000" 2.056 1.556 1.961
38:08'0.000" 1.946 1.918 1.91
38:16'0.000" 2.019 1.677 1.929
38:24'0.000" 2.026 1.692 1.944
38:32'0.000" 1.977 1.839 1.931
38:40'0.000" 2.017 1.734 1.927

184
38:48'0.000" 1.957 1.958 1.899
38:56'0.000" 2.034 1.663 1.948
39:04'0.000" 2.01 1.617 1.936
39:12'0.000" 2.004 1.691 1.916
39:20'0.000" 1.946 1.903 1.895
39:28'0.000" 1.962 1.906 1.92
39:36'0.000" 2.026 1.718 1.929
39:44'0.000" 2.001 1.806 1.918
39:52'0.000" 2.027 1.689 1.937
40:00'0.000" 2.021 1.678 1.941
40:08'0.000" 2.01 1.829 1.908
40:16'0.000" 1.979 1.901 1.908
40:24'0.000" 1.962 1.542 1.965
40:32'0.000" 2.042 1.618 1.938
40:40'0.000" 2.06 1.565 1.944
40:48'0.000" 2.108 1.332 1.983
40:56'0.000" 1.946 1.893 1.906
41:04'0.000" 2.004 1.704 1.916
41:12'0.000" 1.962 1.893 1.908
41:20'0.000" 2.002 1.692 1.943
41:28'0.000" 2.009 1.661 1.929
41:36'0.000" 2.009 1.663 1.926
41:44'0.000" 1.998 1.689 1.932
41:52'0.000" 2.008 1.647 1.936
42:00'0.000" 2.018 1.742 1.914
42:08'0.000" 1.962 1.9 1.903
42:16'0.000" 2.015 1.653 1.942
42:24'0.000" 2 1.636 1.936
42:32'0.000" 1.995 1.694 1.915
42:40'0.000" 1.991 1.779 1.923
42:48'0.000" 1.995 1.793 1.92
42:56'0.000" 2.028 1.64 1.93
43:04'0.000" 2.037 1.668 1.946
43:12'0.000" 1.96 1.885 1.926
43:20'0.000" 1.947 1.903 1.908
43:28'0.000" 2.03 1.665 1.933
43:36'0.000" 2.024 1.678 1.941
43:44'0.000" 2.017 1.645 1.948
43:52'0.000" 2.024 1.638 1.926
44:00'0.000" 2.043 1.634 1.945
44:08'0.000" 2.033 1.698 1.942
44:16'0.000" 2.01 1.77 1.93
44:24'0.000" 1.996 1.905 1.91

185
44:32'0.000" 2.024 1.695 1.925
44:40'0.000" 1.946 1.931 1.898
44:48'0.000" 1.984 1.848 1.906
44:56'0.000" 1.95 1.917 1.884
45:04'0.000" 2.039 1.657 1.933
45:12'0.000" 2.001 1.771 1.919
45:20'0.000" 2.067 1.576 1.933
45:28'0.000" 2.058 1.663 1.938
45:36'0.000" 2.074 1.58 1.955
45:44'0.000" 2.072 1.564 1.954
45:52'0.000" 1.979 1.883 1.89
46:00'0.000" 2.024 1.681 1.92
46:08'0.000" 2.064 1.608 1.951
46:16'0.000" 2.059 1.581 1.917
46:24'0.000" 2.068 1.676 1.921
46:32'0.000" 2.052 1.54 1.921
46:40'0.000" 1.965 1.873 1.888
46:48'0.000" 2.041 1.669 1.902
46:56'0.000" 2.036 1.662 1.908
47:04'0.000" 1.961 1.822 1.887
47:12'0.000" 2.04 1.675 1.915
47:20'0.000" 2.021 1.671 1.894
47:28'0.000" 1.979 1.797 1.877
47:36'0.000" 1.967 1.821 1.886
47:44'0.000" 1.96 1.899 1.872
47:52'0.000" 2.021 1.661 1.902
48:00'0.000" 2.005 1.659 1.899
48:08'0.000" 1.938 1.897 1.872
48:16'0.000" 1.971 1.862 1.872
48:24'0.000" 2.011 1.715 1.895
48:32'0.000" 1.974 1.885 1.882
48:40'0.000" 1.972 1.892 1.883
48:48'0.000" 2.005 1.726 1.887
48:56'0.000" 1.993 1.766 1.886
49:04'0.000" 1.944 1.883 1.87
49:12'0.000" 1.969 1.813 1.87
49:20'0.000" 1.984 1.89 1.876
49:28'0.000" 2.055 1.663 1.906
49:36'0.000" 2.068 1.668 1.915
49:44'0.000" 2.049 1.706 1.902
49:52'0.000" 2.035 1.758 1.894
50:00'0.000" 1.967 1.818 1.874
50:08'0.000" 2.037 1.63 1.877

186
50:16'0.000" 2.023 1.918 1.933
50:24'0.000" 2.087 1.7 1.92
50:32'0.000" 2.095 1.676 1.925
50:40'0.000" 2.037 1.852 1.905
50:48'0.000" 2.089 1.654 1.917
50:56'0.000" 2.082 1.65 1.915
51:04'0.000" 2.093 1.642 1.926
51:12'0.000" 2.016 1.887 1.892
51:20'0.000" 2.1 1.703 1.921
51:28'0.000" 2.113 1.625 1.928
51:36'0.000" 2.127 1.587 1.94
51:44'0.000" 2.091 1.705 1.913
51:52'0.000" 2.029 1.889 1.889
52:00'0.000" 2.018 1.93 1.888
52:08'0.000" 2.14 1.521 1.94
52:16'0.000" 2.041 1.818 1.888
52:24'0.000" 2.008 1.865 1.892
52:32'0.000" 2.019 1.908 1.893
52:40'0.000" 2.054 1.78 1.914
52:48'0.000" 2.052 1.725 1.891
52:56'0.000" 2.078 1.618 1.917
53:04'0.000" 2.05 1.605 1.912
53:12'0.000" 1.984 1.873 1.876
53:20'0.000" 2.077 1.687 1.896
53:28'0.000" 2.068 1.671 1.908
53:36'0.000" 2.053 1.61 1.91
53:44'0.000" 2.034 1.72 1.885
53:52'0.000" 2.013 1.767 1.873
54:00'0.000" 1.969 1.878 1.92
54:08'0.000" 2.068 1.552 1.914
54:16'0.000" 2.112 1.481 1.92
54:24'0.000" 2.16 1.467 1.936
54:32'0.000" 2.059 1.522 1.918
54:40'0.000" 2.065 1.614 1.907
54:48'0.000" 2.077 1.571 1.897
54:56'0.000" 2.089 1.459 1.914
55:04'0.000" 2.117 1.491 1.93
55:12'0.000" 2.117 1.441 1.932
55:20'0.000" 2.082 1.598 1.897
55:28'0.000" 2.107 1.529 1.918
55:36'0.000" 2.099 1.528 1.926
55:44'0.000" 2.09 1.609 1.918
55:52'0.000" 2.073 1.616 1.893

187
56:00'0.000" 1.966 1.844 1.859
56:08'0.000" 2.034 1.782 1.891
56:16'0.000" 2.017 1.902 1.878
56:24'0.000" 2.055 1.681 1.89
56:32'0.000" 1.997 1.831 1.874
56:40'0.000" 1.996 1.804 1.88
56:48'0.000" 1.988 1.87 1.868
56:56'0.000" 2.003 1.768 1.872
57:04'0.000" 1.974 1.879 1.865
57:12'0.000" 2.399 1.569 1.864
57:20'0.000" 2.424 1.527 1.862
57:28'0.000" 2.496 1.161 1.901
57:36'0.000" 2.523 1.206 1.903
57:44'0.000" 2.385 1.387 1.865
57:52'0.000" 2.253 1.811 1.818
58:00'0.000" 2.361 1.568 1.864
58:08'0.000" 2.393 1.487 1.876
58:16'0.000" 2.555 1.121 1.913
58:24'0.000" 2.487 1.235 1.879
58:32'0.000" 2.24 1.762 1.827
58:40'0.000" 2.411 1.499 1.882
58:48'0.000" 2.365 1.472 1.853
58:56'0.000" 2.22 1.806 1.827
59:04'0.000" 2.338 1.556 1.863
59:12'0.000" 2.282 1.719 1.842
59:20'0.000" 2.315 1.619 1.853
59:28'0.000" 2.356 1.563 1.865
59:36'0.000" 2.361 1.467 1.88
59:44'0.000" 2.386 1.42 1.869
59:52'0.000" 2.343 1.544 1.859
60:00'0.000" 2.217 1.831 1.833
60:08'0.000" 2.359 1.524 1.866
60:16'0.000" 2.365 1.53 1.863
60:24'0.000" 2.261 1.76 1.841
60:32'0.000" 2.239 1.821 1.842
60:40'0.000" 2.285 1.704 1.843
60:48'0.000" 2.368 1.476 1.87
60:56'0.000" 2.359 1.464 1.878
61:04'0.000" 2.25 1.798 1.838
61:12'0.000" 2.31 1.656 1.848
61:20'0.000" 2.292 1.697 1.854
61:28'0.000" 2.289 1.75 1.858
61:36'0.000" 2.243 1.826 1.834

188
61:44'0.000" 2.32 1.532 1.86
61:52'0.000" 2.289 1.59 1.857
62:00'0.000" 2.325 1.53 1.867
62:08'0.000" 2.222 1.495 1.856
62:16'0.000" 2.249 1.849 1.843
62:24'0.000" 2.141 1.839 1.851
62:32'0.000" 2.134 1.661 1.872
62:40'0.000" 2.174 1.562 1.9
62:48'0.000" 2.122 1.607 1.89
62:56'0.000" 2.057 1.778 1.876
63:04'0.000" 2.133 1.689 1.879
63:12'0.000" 2.057 1.891 1.868
63:20'0.000" 2.15 1.571 1.899
63:28'0.000" 2.158 1.526 1.891
63:36'0.000" 2.149 1.576 1.899
63:44'0.000" 2.128 1.677 1.899
63:52'0.000" 2.122 1.69 1.886
64:00'0.000" 2.129 1.645 1.888
64:08'0.000" 2.193 1.442 1.922
64:16'0.000" 2.067 1.79 1.871
64:24'0.000" 2.139 1.574 1.884
64:32'0.000" 2.152 1.538 1.904
64:40'0.000" 2.164 1.519 1.915
64:48'0.000" 2.179 1.522 1.9
64:56'0.000" 2.032 1.869 1.856
65:04'0.000" 2.133 1.552 1.898
65:12'0.000" 2.162 1.526 1.903
65:20'0.000" 2.198 1.484 1.906
65:28'0.000" 2.059 1.805 1.87
65:36'0.000" 2.072 1.852 1.874
65:44'0.000" 2.12 1.656 1.881
65:52'0.000" 2.097 1.767 1.875
66:00'0.000" 2.024 1.859 1.861
66:08'0.000" 2.049 1.841 1.88
66:16'0.000" 2.133 1.589 1.89
66:24'0.000" 2.097 1.78 1.884
66:32'0.000" 2.047 1.853 1.855
66:40'0.000" 2.084 1.803 1.868
66:48'0.000" 2.067 1.78 1.869
66:56'0.000" 2.181 1.588 1.909
67:04'0.000" 2.148 1.643 1.882
67:12'0.000" 2.068 1.843 1.869
67:20'0.000" 2.155 1.599 1.903

189
67:28'0.000" 2.145 1.623 1.888
67:36'0.000" 2.112 1.622 1.892
67:44'0.000" 2.154 1.513 1.924
67:52'0.000" 2.047 1.871 1.856
68:00'0.000" 2.163 1.569 1.905
68:08'0.000" 2.167 1.518 1.911
68:16'0.000" 2.177 1.542 1.903
68:24'0.000" 2.03 1.904 1.852
68:32'0.000" 2.133 1.651 1.891
68:40'0.000" 2.141 1.627 1.892
68:48'0.000" 2.13 1.588 1.88
68:56'0.000" 2.158 1.581 1.897
69:04'0.000" 2.188 1.595 1.911
69:12'0.000" 2.197 1.536 1.899
69:20'0.000" 2.189 1.575 1.905
69:28'0.000" 2.262 1.303 1.955
69:36'0.000" 2.165 1.728 1.909
69:44'0.000" 2.151 1.766 1.899
69:52'0.000" 2.171 1.66 1.911
70:00'0.000" 2.152 1.819 1.908
70:08'0.000" 2.124 1.923 1.885
70:16'0.000" 2.25 1.577 1.94
70:24'0.000" 2.257 1.552 1.943
70:32'0.000" 2.139 1.896 1.899
70:40'0.000" 2.224 1.565 1.919
70:48'0.000" 2.214 1.533 1.93
70:56'0.000" 2.268 1.545 1.947
71:04'0.000" 2.165 1.751 1.897
71:12'0.000" 2.148 1.802 1.896
71:20'0.000" 2.2 1.654 1.924
71:28'0.000" 2.147 1.788 1.901
71:36'0.000" 2.133 1.83 1.884
71:44'0.000" 2.235 1.619 1.932
71:52'0.000" 2.223 1.586 1.931
72:00'0.000" 2.162 1.811 1.892
72:08'0.000" 2.14 1.867 1.883
72:16'0.000" 2.236 1.592 1.929
72:24'0.000" 2.266 1.523 1.935
72:32'0.000" 2.148 1.916 1.88
72:40'0.000" 2.255 1.601 1.92
72:48'0.000" 2.199 1.804 1.931
72:56'0.000" 2.173 1.877 1.9
73:04'0.000" 2.262 1.611 1.92

190
73:12'0.000" 2.304 1.535 1.933
73:20'0.000" 2.287 1.519 1.944
73:28'0.000" 2.293 1.533 1.94
73:36'0.000" 2.32 1.369 1.941
73:44'0.000" 2.311 1.463 1.927
73:52'0.000" 2.242 1.644 1.924
74:00'0.000" 2.297 1.54 1.928
74:08'0.000" 2.245 1.594 1.909
74:16'0.000" 2.254 1.547 1.924
74:24'0.000" 2.228 1.637 1.92
74:32'0.000" 2.176 1.814 1.889
74:40'0.000" 2.178 1.854 1.933
74:48'0.000" 2.294 1.53 1.942
74:56'0.000" 2.37 1.514 1.927
75:04'0.000" 2.391 1.674 1.88
75:12'0.000" 2.326 1.779 1.872
75:20'0.000" 2.314 1.845 1.871
75:28'0.000" 2.385 1.712 1.892
75:36'0.000" 2.36 1.731 1.882
75:44'0.000" 2.317 1.738 1.886
75:52'0.000" 2.42 1.529 1.913
76:00'0.000" 2.405 1.573 1.897
76:08'0.000" 2.391 1.609 1.889
76:16'0.000" 2.319 1.837 1.866
76:24'0.000" 2.301 1.545 1.867
76:32'0.000" 2.284 1.564 1.853
76:40'0.000" 2.239 1.715 1.845
76:48'0.000" 2.201 1.786 1.837
76:56'0.000" 2.315 1.492 1.873
77:04'0.000" 2.311 1.514 1.864
77:12'0.000" 2.306 1.534 1.848
77:20'0.000" 2.215 1.776 1.849
77:28'0.000" 2.307 1.57 1.861
77:36'0.000" 2.309 1.53 1.872
77:44'0.000" 2.322 1.427 1.875
77:52'0.000" 2.159 1.832 1.885
78:00'0.000" 2.279 1.53 1.853
78:08'0.000" 2.286 1.572 1.856
78:16'0.000" 2.268 1.559 1.858
78:24'0.000" 2.231 1.702 1.852
78:32'0.000" 2.096 1.779 2.055
78:40'0.000" 2.206 1.454 2.115
78:48'0.000" 2.209 1.385 2.127

191
78:56'0.000" 2.186 1.421 2.13
79:04'0.000" 2.278 1.337 2.15
79:12'0.000" 2.19 1.412 2.091
79:20'0.000" 2.161 1.457 2.083
79:28'0.000" 2.24 1.426 2.135
79:36'0.000" 2.077 1.796 2.029
79:44'0.000" 2.108 1.729 2.033
79:52'0.000" 2.175 1.528 2.079
80:00'0.000" 2.216 1.409 2.114
80:08'0.000" 2.214 1.443 2.104
80:16'0.000" 2.225 1.398 2.093
80:24'0.000" 2.1 1.742 2.028
80:32'0.000" 2.194 1.485 2.087
80:40'0.000" 2.242 1.328 2.126
80:48'0.000" 2.244 1.411 2.098
80:56'0.000" 2.142 1.361 2.134
81:04'0.000" 2.037 1.53 2.116
81:12'0.000" 1.996 1.423 2.118
81:20'0.000" 2.017 1.349 2.168
81:28'0.000" 2.009 1.529 2.106
81:36'0.000" 1.929 1.792 2.054
81:44'0.000" 1.946 1.784 2.067
81:52'0.000" 1.943 1.786 2.123
82:00'0.000" 2.025 1.482 2.118
82:08'0.000" 2.056 1.44 2.129
82:16'0.000" 2.084 1.299 2.151
82:24'0.000" 2.002 1.627 2.066
82:32'0.000" 2.001 1.631 2.116
82:40'0.000" 1.997 1.664 2.087
82:48'0.000" 1.938 1.738 2.048
82:56'0.000" 2.013 1.553 2.112
83:04'0.000" 2.021 1.553 2.125
83:12'0.000" 1.98 1.737 2.072
83:20'0.000" 2.015 1.566 2.095
83:28'0.000" 2.039 1.486 2.108
83:36'0.000" 2.038 1.43 2.122
83:44'0.000" 2.033 1.48 2.121
83:52'0.000" 2.079 1.532 2.073
84:00'0.000" 2.043 1.657 1.885
84:08'0.000" 2.081 1.608 1.915
84:16'0.000" 2.038 1.553 1.912
84:24'0.000" 2.024 1.718 1.874
84:32'0.000" 1.948 1.701 2.346
192
84:40'0.000" 1.915 1.741 2.234
84:48'0.000" 1.944 1.657 2.233
84:56'0.000" 1.939 1.746 2.208
85:04'0.000" 1.914 1.761 2.194
85:12'0.000" 1.921 1.742 2.188
85:20'0.000" 2.013 1.485 2.239
85:28'0.000" 2.043 1.462 2.273
85:36'0.000" 1.929 1.816 2.18
85:44'0.000" 2.031 1.484 2.244
85:52'0.000" 2.036 1.423 2.256
86:00'0.000" 2.07 1.328 2.284
86:08'0.000" 2.035 1.464 2.243
86:16'0.000" 2.032 1.518 2.231
86:24'0.000" 2.026 1.511 2.236
86:32'0.000" 2.037 1.489 2.219
86:40'0.000" 2.007 1.557 2.206
86:48'0.000" 1.956 1.714 2.163
86:56'0.000" 1.97 1.68 2.17
87:04'0.000" 1.959 1.71 2.152
87:12'0.000" 1.968 1.702 2.171
87:20'0.000" 1.963 1.73 2.161
87:28'0.000" 2.019 1.577 2.189
87:36'0.000" 2.005 1.606 2.19
87:44'0.000" 2.024 1.58 2.207
87:52'0.000" 1.978 1.644 2.167
88:00'0.000" 1.962 1.779 2.144
88:08'0.000" 2.02 1.539 2.219
88:16'0.000" 2.021 1.583 2.176
88:24'0.000" 2.007 1.596 2.188
88:32'0.000" 2.008 1.577 2.184
88:40'0.000" 1.979 1.659 2.156
88:48'0.000" 1.968 1.78 2.125
88:56'0.000" 2.007 1.569 2.193
89:04'0.000" 2.035 1.498 2.196
89:12'0.000" 2.061 1.412 2.204
89:20'0.000" 2.002 1.559 2.173
89:28'0.000" 1.991 1.552 2.169
89:36'0.000" 1.996 1.642 2.145
89:44'0.000" 1.955 1.75 2.136
89:52'0.000" 1.95 1.779 2.132
90:00'0.000" 2.045 1.48 2.186
90:08'0.000" 2.033 1.438 2.184
90:16'0.000" 1.958 1.678 2.145

193
90:24'0.000" 1.941 1.795 2.1
90:32'0.000" 2.082 1.457 2.21
90:40'0.000" 2.019 1.529 2.176
90:48'0.000" 2 1.61 2.137
90:56'0.000" 2.053 1.459 2.178
91:04'0.000" 2.008 1.712 2.164
91:12'0.000" 2.019 1.549 2.192
91:20'0.000" 2.078 1.399 2.191
91:28'0.000" 2.051 1.435 2.185
91:36'0.000" 1.926 1.81 2.124
91:44'0.000" 2.053 1.469 2.178
91:52'0.000" 2.074 1.435 2.209
92:00'0.000" 2.07 1.436 2.201
92:08'0.000" 2.05 1.465 2.187
92:16'0.000" 2.055 1.479 2.192
92:24'0.000" 2.04 1.468 2.187
92:32'0.000" 2.05 1.388 2.196
92:40'0.000" 2.059 1.483 2.203
92:48'0.000" 2.036 1.406 2.196
92:56'0.000" 1.906 1.785 2.169
93:04'0.000" 2.085 1.456 2.002
93:12'0.000" 2.048 1.649 1.903
93:20'0.000" 2.097 1.562 1.896
93:28'0.000" 2.092 1.574 1.891
93:36'0.000" 2.121 1.494 1.895
93:44'0.000" 2.139 1.518 1.908
93:52'0.000" 2.089 1.507 1.901
94:00'0.000" 2.108 1.471 1.889
94:08'0.000" 2.097 1.492 1.89
94:16'0.000" 2.113 1.44 1.902
94:24'0.000" 2.137 1.382 1.916
94:32'0.000" 2.119 1.431 1.903
94:40'0.000" 2.082 1.569 1.869
94:48'0.000" 2 1.813 1.85
94:56'0.000" 2.075 1.564 1.888
95:04'0.000" 2.112 1.48 1.892
95:12'0.000" 2.042 1.659 1.859
95:20'0.000" 2.061 1.598 1.877
95:28'0.000" 2.05 1.633 1.878
95:36'0.000" 2.077 1.652 1.864
95:44'0.000" 2.096 1.573 1.871
95:52'0.000" 2.044 1.845 1.884
96:00'0.000" 2.134 1.485 1.89

194
96:08'0.000" 2.091 1.546 1.873
96:16'0.000" 2.152 1.535 1.879
96:24'0.000" 2.146 1.539 1.886
96:32'0.000" 2.096 1.6 1.868
96:40'0.000" 2.106 1.511 1.888
96:48'0.000" 2.121 1.549 1.884
96:56'0.000" 2.108 1.562 1.866
97:04'0.000" 2.134 1.484 1.883
97:12'0.000" 2.104 1.543 1.876
97:20'0.000" 2.014 1.855 1.865
97:28'0.000" 2.115 1.571 1.885
97:36'0.000" 2.058 1.791 1.846
97:44'0.000" 2.001 1.802 1.836
97:52'0.000" 2.098 1.535 1.884
98:00'0.000" 2.084 1.601 1.874
98:08'0.000" 2.159 1.531 1.887
98:16'0.000" 2.127 1.52 1.877
98:24'0.000" 2.137 1.493 1.888
98:32'0.000" 2.125 1.497 1.889
98:40'0.000" 2.063 1.662 1.857
98:48'0.000" 2.03 1.772 1.837
98:56'0.000" 2.094 1.622 1.866
99:04'0.000" 2.012 1.872 1.895
99:12'0.000" 2.134 1.522 1.892
99:20'0.000" 2.136 1.539 1.882
99:28'0.000" 2.033 1.88 1.832
99:36'0.000" 2.211 1.299 1.909
99:44'0.000" 2.17 1.336 1.892
99:52'0.000" 2.117 1.658 1.868
100:00'0.000" 2.071 1.777 1.844
A sample of the raw data used to plot figure 5.2 in the potentiodynamic polarisation
tests is shown below.
Potential vs
Ag/AgCl (V)
Log. Current density
(A/cm2)
Log. Current density
(A/cm2)
Log. Current density
(A/cm2)
lead -0.3999 0.06528
DSA
mesh 0.009888
DSA
plate 0.501
-0.3951 0.06442 0.009448 0.4942
-0.3902 0.06363 0.009 0.4876
-0.3853 0.06284 0.008624 0.4814
-0.3804 0.0621 0.008362 0.4749

195
-0.3755 0.06137 0.007837 0.469
-0.3706 0.06064 0.007504 0.4629
-0.3658 0.05994 0.00719 0.4571
-0.3609 0.0592 0.006778 0.4517
-0.356 0.05847 0.006445 0.4457
-0.3511 0.05777 0.006076 0.4399
-0.3462 0.05707 0.005661 0.4338
-0.3413 0.05634 0.00535 0.4279
-0.3365 0.0556 0.005017 0.4218
-0.3316 0.05487 0.004648 0.4155
-0.3267 0.05414 0.004315 0.4094
-0.3218 0.05341 0.003952 0.4033
-0.3169 0.05267 0.00365 0.3972
-0.312 0.05191 0.003339 0.3916
-0.3072 0.05115 0.003009 0.3853
-0.3023 0.05038 0.002702 0.3792
-0.2974 0.04962 0.002483 0.373
-0.2925 0.04883 0.002218 0.367
-0.2876 0.04807 0.001948 0.3607
-0.2827 0.04727 0.001699 0.3546
-0.2779 0.04648 0.001465 0.3484
-0.273 0.04568 0.001239 0.3421
-0.2681 0.04471 0.001037 0.336
-0.2632 0.04391 0.0008493 0.3299
-0.2583 0.04309 0.0006821 0.3236
-0.2534 0.04228 0.0005368 0.3175
-0.2486 0.04146 0.0004083 0.3114
-0.2437 0.04063 0.0002982 0.3053
-0.2388 0.03981 0.0002042 0.2991
-0.2339 0.03898 0.0001254 0.2928
-0.229 0.03815 0.00005829 0.2867
-0.2242 0.03731 0.000002136 0.2808
-0.2193 0.03648 0.00004761 0.2747
-0.2144 0.03565 0.00008661 0.2686
-0.2095 0.03481 0.00012 0.2622
-0.2046 0.03398 0.0001487 0.256
-0.1997 0.03315 0.0001738 0.25
-0.1949 0.03231 0.0001951 0.244
-0.19 0.03148 0.0002147 0.2379
-0.1851 0.03065 0.0002325 0.2319
-0.1802 0.02982 0.000248 0.226
-0.1753 0.029 0.0002629 0.2202
-0.1704 0.02818 0.0002762 0.2142

196
-0.1656 0.02737 0.0002888 0.2083
-0.1607 0.02656 0.0003008 0.2024
-0.1558 0.02575 0.0003116 0.1966
-0.1509 0.02495 0.0003225 0.1908
-0.146 0.02415 0.0003318 0.185
-0.1411 0.02336 0.0003417 0.1793
-0.1363 0.02258 0.0003506 0.1736
1.119 0.00485 0.001144 0.007938
1.124 0.004843 0.001153 0.007866
1.128 0.004829 0.001159 0.00784
1.133 0.004813 0.001167 0.00775
1.138 0.004796 0.001174 0.007687
1.143 0.00477 0.001182 0.007633
1.148 0.004744 0.001191 0.007567
1.153 0.004715 0.0012 0.007557
1.158 0.004683 0.001208 0.007578
1.163 0.004649 0.001217 0.00757
1.167 0.004611 0.001227 0.007475
1.172 0.004569 0.001238 0.00756
1.177 0.004534 0.001247 0.007438
1.182 0.004507 0.001258 0.007437
1.187 0.004484 0.001269 0.007406
1.192 0.004458 0.001281 0.007405
1.197 0.004445 0.001293 0.007416
1.202 0.004425 0.001306 0.007348

197
A sample of part of the raw data used to plot figure 19 showing 55 cyclic voltammetry scans for the lead anode is shown below.
Potential
Current density Potential
Current density Potential
Current density Potential
Current density Potential
Current density
scan 5 0 -3.27E-04
scan 10 0 -2.61E-03
scan 15 0 -6.93E-03
scan 20 0 -6.76E-03
scan 25 0 -7.58E-03
4.88E-03 -3.12E-04 4.88E-03 -2.53E-03 4.88E-03 -6.77E-03 4.88E-03 -6.60E-03 4.88E-03 -7.39E-03
9.77E-03 -2.99E-04 9.77E-03 -2.46E-03 9.77E-03 -6.60E-03 9.77E-03 -6.43E-03 9.77E-03 -7.19E-03
1.47E-02 -2.86E-04 1.47E-02 -2.39E-03 1.47E-02 -6.43E-03 1.47E-02 -6.26E-03 1.47E-02 -7.00E-03
1.95E-02 -2.75E-04 1.95E-02 -2.33E-03 1.95E-02 -6.26E-03 1.95E-02 -6.09E-03 1.95E-02 -6.80E-03
2.44E-02 -2.64E-04 2.44E-02 -2.26E-03 2.44E-02 -6.09E-03 2.44E-02 -5.92E-03 2.44E-02 -6.61E-03
2.93E-02 -2.54E-04 2.93E-02 -2.20E-03 2.93E-02 -5.93E-03 2.93E-02 -5.76E-03 2.93E-02 -6.42E-03
3.42E-02 -2.44E-04 3.42E-02 -2.15E-03 3.42E-02 -5.77E-03 3.42E-02 -5.61E-03 3.42E-02 -6.24E-03
3.91E-02 -2.35E-04 3.91E-02 -2.09E-03 3.91E-02 -5.61E-03 3.91E-02 -5.45E-03 3.91E-02 -6.06E-03
4.40E-02 -2.27E-04 4.40E-02 -2.03E-03 4.40E-02 -5.45E-03 4.40E-02 -5.30E-03 4.40E-02 -5.89E-03
4.88E-02 -2.19E-04 4.88E-02 -1.98E-03 4.88E-02 -5.30E-03 4.88E-02 -5.15E-03 4.88E-02 -5.73E-03
5.37E-02 -2.11E-04 5.37E-02 -1.93E-03 5.37E-02 -5.15E-03 5.37E-02 -5.01E-03 5.37E-02 -5.56E-03
5.86E-02 -2.04E-04 5.86E-02 -1.88E-03 5.86E-02 -5.01E-03 5.86E-02 -4.87E-03 5.86E-02 -5.41E-03
6.35E-02 -1.97E-04 6.35E-02 -1.83E-03 6.35E-02 -4.87E-03 6.35E-02 -4.74E-03 6.35E-02 -5.26E-03
6.84E-02 -1.91E-04 6.84E-02 -1.79E-03 6.84E-02 -4.73E-03 6.84E-02 -4.61E-03 6.84E-02 -5.11E-03
7.32E-02 -1.85E-04 7.32E-02 -1.74E-03 7.32E-02 -4.60E-03 7.32E-02 -4.48E-03 7.32E-02 -4.96E-03
7.81E-02 -1.79E-04 7.81E-02 -1.70E-03 7.81E-02 -4.47E-03 7.81E-02 -4.36E-03 7.81E-02 -4.82E-03
8.30E-02 -1.73E-04 8.30E-02 -1.66E-03 8.30E-02 -4.34E-03 8.30E-02 -4.24E-03 8.30E-02 -4.69E-03
8.79E-02 -1.67E-04 8.79E-02 -1.62E-03 8.79E-02 -4.21E-03 8.79E-02 -4.12E-03 8.79E-02 -4.56E-03
9.28E-02 -1.62E-04 9.28E-02 -1.58E-03 9.28E-02 -4.09E-03 9.28E-02 -4.00E-03 9.28E-02 -4.43E-03
9.77E-02 -1.57E-04 9.77E-02 -1.54E-03 9.77E-02 -3.97E-03 9.77E-02 -3.89E-03 9.77E-02 -4.30E-03
0.1025 -1.53E-04 0.1025 -1.50E-03 0.1025 -3.86E-03 0.1025 -3.78E-03 0.1025 -4.18E-03
198
0.1074 -1.48E-04 0.1074 -1.46E-03 0.1074 -3.75E-03 0.1074 -3.67E-03 0.1074 -4.06E-03
0.1123 -1.44E-04 0.1123 -1.43E-03 0.1123 -3.63E-03 0.1123 -3.57E-03 0.1123 -3.95E-03
0.1172 -1.40E-04 0.1172 -1.39E-03 0.1172 -3.53E-03 0.1172 -3.47E-03 0.1172 -3.84E-03
0.1221 -1.35E-04 0.1221 -1.36E-03 0.1221 -3.42E-03 0.1221 -3.37E-03 0.1221 -3.73E-03
0.127 -1.32E-04 0.127 -1.32E-03 0.127 -3.32E-03 0.127 -3.27E-03 0.127 -3.62E-03
0.1318 -1.28E-04 0.1318 -1.29E-03 0.1318 -3.22E-03 0.1318 -3.18E-03 0.1318 -3.52E-03
0.1367 -1.24E-04 0.1367 -1.26E-03 0.1367 -3.12E-03 0.1367 -3.09E-03 0.1367 -3.42E-03
0.1416 -1.21E-04 0.1416 -1.23E-03 0.1416 -3.03E-03 0.1416 -3.00E-03 0.1416 -3.32E-03
0.1465 -1.17E-04 0.1465 -1.20E-03 0.1465 -2.94E-03 0.1465 -2.91E-03 0.1465 -3.23E-03
0.1514 -1.14E-04 0.1514 -1.17E-03 0.1514 -2.85E-03 0.1514 -2.83E-03 0.1514 -3.14E-03
0.1563 -1.11E-04 0.1563 -1.14E-03 0.1563 -2.76E-03 0.1563 -2.75E-03 0.1563 -3.05E-03
0.1611 -1.08E-04 0.1611 -1.11E-03 0.1611 -2.68E-03 0.1611 -2.67E-03 0.1611 -2.96E-03
0.166 -1.05E-04 0.166 -1.08E-03 0.166 -2.59E-03 0.166 -2.59E-03 0.166 -2.87E-03
0.1709 -1.02E-04 0.1709 -1.06E-03 0.1709 -2.51E-03 0.1709 -2.52E-03 0.1709 -2.79E-03
0.1758 -9.97E-05 0.1758 -1.03E-03 0.1758 -2.44E-03 0.1758 -2.44E-03 0.1758 -2.71E-03
0.1807 -9.70E-05 0.1807 -1.00E-03 0.1807 -2.36E-03 0.1807 -2.37E-03 0.1807 -2.63E-03
0.1855 -9.45E-05 0.1855 -9.76E-04 0.1855 -2.29E-03 0.1855 -2.30E-03 0.1855 -2.56E-03
0.1904 -9.20E-05 0.1904 -9.51E-04 0.1904 -2.21E-03 0.1904 -2.24E-03 0.1904 -2.48E-03
0.1953 -8.96E-05 0.1953 -9.27E-04 0.1953 -2.14E-03 0.1953 -2.17E-03 0.1953 -2.41E-03
0.2002 -8.74E-05 0.2002 -9.03E-04 0.2002 -2.08E-03 0.2002 -2.11E-03 0.2002 -2.34E-03
0.2051 -8.52E-05 0.2051 -8.80E-04 0.2051 -2.01E-03 0.2051 -2.05E-03 0.2051 -2.28E-03
0.21 -8.29E-05 0.21 -8.57E-04 0.21 -1.94E-03 0.21 -1.99E-03 0.21 -2.21E-03
0.2148 -8.09E-05 0.2148 -8.34E-04 0.2148 -1.88E-03 0.2148 -1.93E-03 0.2148 -2.15E-03
0.2197 -7.88E-05 0.2197 -8.12E-04 0.2197 -1.82E-03 0.2197 -1.87E-03 0.2197 -2.08E-03
0.2246 -7.67E-05 0.2246 -7.90E-04 0.2246 -1.76E-03 0.2246 -1.82E-03 0.2246 -2.02E-03
0.2295 -7.47E-05 0.2295 -7.69E-04 0.2295 -1.71E-03 0.2295 -1.76E-03 0.2295 -1.97E-03

199
0.2344 -7.29E-05 0.2344 -7.49E-04 0.2344 -1.65E-03 0.2344 -1.71E-03 0.2344 -1.91E-03
0.2393 -7.10E-05 0.2393 -7.28E-04 0.2393 -1.60E-03 0.2393 -1.66E-03 0.2393 -1.85E-03
0.2441 -6.90E-05 0.2441 -7.08E-04 0.2441 -1.54E-03 0.2441 -1.61E-03 0.2441 -1.80E-03
0.249 -6.74E-05 0.249 -6.89E-04 0.249 -1.49E-03 0.249 -1.57E-03 0.249 -1.75E-03
0.2539 -6.56E-05 0.2539 -6.70E-04 0.2539 -1.44E-03 0.2539 -1.52E-03 0.2539 -1.70E-03
0.2588 -6.39E-05 0.2588 -6.51E-04 0.2588 -1.39E-03 0.2588 -1.48E-03 0.2588 -1.65E-03
0.2637 -6.23E-05 0.2637 -6.33E-04 0.2637 -1.35E-03 0.2637 -1.43E-03 0.2637 -1.60E-03
0.2686 -6.08E-05 0.2686 -6.15E-04 0.2686 -1.30E-03 0.2686 -1.39E-03 0.2686 -1.55E-03
0.2734 -5.93E-05 0.2734 -5.97E-04 0.2734 -1.26E-03 0.2734 -1.35E-03 0.2734 -1.51E-03
0.2783 -5.78E-05 0.2783 -5.80E-04 0.2783 -1.22E-03 0.2783 -1.31E-03 0.2783 -1.46E-03
0.2832 -5.63E-05 0.2832 -5.63E-04 0.2832 -1.17E-03 0.2832 -1.27E-03 0.2832 -1.42E-03
0.2881 -5.48E-05 0.2881 -5.46E-04 0.2881 -1.13E-03 0.2881 -1.23E-03 0.2881 -1.38E-03
0.293 -5.34E-05 0.293 -5.30E-04 0.293 -1.09E-03 0.293 -1.19E-03 0.293 -1.34E-03
0.2979 -5.21E-05 0.2979 -5.14E-04 0.2979 -1.06E-03 0.2979 -1.16E-03 0.2979 -1.30E-03
0.3027 -5.08E-05 0.3027 -4.98E-04 0.3027 -1.02E-03 0.3027 -1.12E-03 0.3027 -1.26E-03
0.3076 -4.94E-05 0.3076 -4.83E-04 0.3076 -9.82E-04 0.3076 -1.09E-03 0.3076 -1.22E-03
0.3125 -4.81E-05 0.3125 -4.68E-04 0.3125 -9.47E-04 0.3125 -1.06E-03 0.3125 -1.19E-03
0.3174 -4.68E-05 0.3174 -4.54E-04 0.3174 -9.13E-04 0.3174 -1.02E-03 0.3174 -1.15E-03
0.3223 -4.56E-05 0.3223 -4.39E-04 0.3223 -8.80E-04 0.3223 -9.92E-04 0.3223 -1.12E-03
0.3271 -4.44E-05 0.3271 -4.25E-04 0.3271 -8.48E-04 0.3271 -9.61E-04 0.3271 -1.08E-03
0.332 -4.31E-05 0.332 -4.11E-04 0.332 -8.17E-04 0.332 -9.31E-04 0.332 -1.05E-03
0.3369 -4.19E-05 0.3369 -3.98E-04 0.3369 -7.86E-04 0.3369 -9.02E-04 0.3369 -1.02E-03
0.3418 -4.08E-05 0.3418 -3.84E-04 0.3418 -7.56E-04 0.3418 -8.73E-04 0.3418 -9.84E-04
0.3467 -3.96E-05 0.3467 -3.71E-04 0.3467 -7.27E-04 0.3467 -8.45E-04 0.3467 -9.53E-04
0.3516 -3.85E-05 0.3516 -3.59E-04 0.3516 -6.99E-04 0.3516 -8.18E-04 0.3516 -9.23E-04
0.3564 -3.74E-05 0.3564 -3.46E-04 0.3564 -6.72E-04 0.3564 -7.92E-04 0.3564 -8.93E-04

200
0.3613 -3.64E-05 0.3613 -3.34E-04 0.3613 -6.45E-04 0.3613 -7.66E-04 0.3613 -8.64E-04
0.3662 -3.54E-05 0.3662 -3.22E-04 0.3662 -6.19E-04 0.3662 -7.41E-04 0.3662 -8.35E-04
0.3711 -3.44E-05 0.3711 -3.10E-04 0.3711 -5.94E-04 0.3711 -7.16E-04 0.3711 -8.07E-04
0.376 -3.34E-05 0.376 -2.98E-04 0.376 -5.69E-04 0.376 -6.92E-04 0.376 -7.80E-04
0.3809 -3.24E-05 0.3809 -2.87E-04 0.3809 -5.44E-04 0.3809 -6.68E-04 0.3809 -7.54E-04
0.3857 -3.14E-05 0.3857 -2.76E-04 0.3857 -5.21E-04 0.3857 -6.45E-04 0.3857 -7.27E-04
0.3906 -3.05E-05 0.3906 -2.65E-04 0.3906 -4.98E-04 0.3906 -6.22E-04 0.3906 -7.02E-04
0.3955 -2.96E-05 0.3955 -2.54E-04 0.3955 -4.76E-04 0.3955 -6.00E-04 0.3955 -6.76E-04
0.4004 -2.86E-05 0.4004 -2.44E-04 0.4004 -4.54E-04 0.4004 -5.78E-04 0.4004 -6.52E-04
0.4053 -2.78E-05 0.4053 -2.33E-04 0.4053 -4.32E-04 0.4053 -5.56E-04 0.4053 -6.27E-04
0.4102 -2.69E-05 0.4102 -2.23E-04 0.4102 -4.11E-04 0.4102 -5.35E-04 0.4102 -6.04E-04
0.415 -2.60E-05 0.415 -2.13E-04 0.415 -3.91E-04 0.415 -5.15E-04 0.415 -5.80E-04
0.4199 -2.51E-05 0.4199 -2.03E-04 0.4199 -3.71E-04 0.4199 -4.94E-04 0.4199 -5.57E-04
0.4248 -2.43E-05 0.4248 -1.94E-04 0.4248 -3.51E-04 0.4248 -4.75E-04 0.4248 -5.34E-04
0.4297 -2.35E-05 0.4297 -1.84E-04 0.4297 -3.32E-04 0.4297 -4.55E-04 0.4297 -5.12E-04
0.4346 -2.24E-05 0.4346 -1.75E-04 0.4346 -3.13E-04 0.4346 -4.36E-04 0.4346 -4.90E-04
0.4395 -2.16E-05 0.4395 -1.66E-04 0.4395 -2.95E-04 0.4395 -4.17E-04 0.4395 -4.68E-04
0.4443 -2.08E-05 0.4443 -1.57E-04 0.4443 -2.77E-04 0.4443 -3.98E-04 0.4443 -4.47E-04
0.4492 -2.00E-05 0.4492 -1.48E-04 0.4492 -2.59E-04 0.4492 -3.80E-04 0.4492 -4.26E-04
0.4541 -1.93E-05 0.4541 -1.39E-04 0.4541 -2.42E-04 0.4541 -3.62E-04 0.4541 -4.05E-04
0.459 -1.86E-05 0.459 -1.31E-04 0.459 -2.25E-04 0.459 -3.44E-04 0.459 -3.85E-04
0.4639 -1.79E-05 0.4639 -1.22E-04 0.4639 -2.09E-04 0.4639 -3.26E-04 0.4639 -3.65E-04
0.4688 -1.71E-05 0.4688 -1.14E-04 0.4688 -1.92E-04 0.4688 -3.09E-04 0.4688 -3.45E-04
0.4736 -1.64E-05 0.4736 -1.06E-04 0.4736 -1.77E-04 0.4736 -2.92E-04 0.4736 -3.26E-04
0.4785 -1.57E-05 0.4785 -9.78E-05 0.4785 -1.61E-04 0.4785 -2.75E-04 0.4785 -3.07E-04
0.4834 -1.50E-05 0.4834 -8.98E-05 0.4834 -1.45E-04 0.4834 -2.59E-04 0.4834 -2.88E-04

201
0.4883 -1.43E-05 0.4883 -8.20E-05 0.4883 -1.30E-04 0.4883 -2.42E-04 0.4883 -2.69E-04
0.4932 -1.36E-05 0.4932 -7.43E-05 0.4932 -1.15E-04 0.4932 -2.26E-04 0.4932 -2.51E-04
0.498 -1.29E-05 0.498 -6.67E-05 0.498 -1.01E-04 0.498 -2.10E-04 0.498 -2.33E-04
0.5029 -1.22E-05 0.5029 -5.93E-05 0.5029 -8.64E-05 0.5029 -1.95E-04 0.5029 -2.15E-04
0.5078 -1.16E-05 0.5078 -5.19E-05 0.5078 -7.22E-05 0.5078 -1.79E-04 0.5078 -1.97E-04
0.5127 -1.09E-05 0.5127 -4.46E-05 0.5127 -5.83E-05 0.5127 -1.64E-04 0.5127 -1.80E-04
0.5176 -1.03E-05 0.5176 -3.74E-05 0.5176 -4.45E-05 0.5176 -1.49E-04 0.5176 -1.62E-04
0.5225 -9.69E-06 0.5225 -3.03E-05 0.5225 -3.10E-05 0.5225 -1.34E-04 0.5225 -1.45E-04
0.5273 -9.05E-06 0.5273 -2.33E-05 0.5273 -1.76E-05 0.5273 -1.19E-04 0.5273 -1.29E-04
0.5322 -8.38E-06 0.5322 -1.63E-05 0.5322 -4.46E-06 0.5322 -1.04E-04 0.5322 -1.12E-04
0.5371 -7.83E-06 0.5371 -9.40E-06 0.5371 8.55E-06 0.5371 -8.92E-05 0.5371 -9.56E-05
0.542 -7.23E-06 0.542 -2.64E-06 0.542 2.14E-05 0.542 -7.46E-05 0.542 -7.94E-05
0.5469 -6.59E-06 0.5469 4.07E-06 0.5469 3.41E-05 0.5469 -6.02E-05 0.5469 -6.34E-05
0.5518 -6.01E-06 0.5518 1.07E-05 0.5518 4.66E-05 0.5518 -4.59E-05 0.5518 -4.73E-05
0.5566 -5.44E-06 0.5566 1.74E-05 0.5566 5.91E-05 0.5566 -3.17E-05 0.5566 -3.15E-05
0.5615 -4.87E-06 0.5615 2.39E-05 0.5615 7.14E-05 0.5615 -1.76E-05 0.5615 -1.58E-05
0.5664 -4.29E-06 0.5664 3.03E-05 0.5664 8.36E-05 0.5664 -3.69E-06 0.5664 -2.14E-07
0.5713 -3.71E-06 0.5713 3.67E-05 0.5713 9.56E-05 0.5713 1.02E-05 0.5713 1.52E-05
0.5762 -3.19E-06 0.5762 4.31E-05 0.5762 1.08E-04 0.5762 2.39E-05 0.5762 3.04E-05
0.5811 -2.62E-06 0.5811 4.94E-05 0.5811 1.19E-04 0.5811 3.75E-05 0.5811 4.54E-05
0.5859 -2.07E-06 0.5859 5.57E-05 0.5859 1.31E-04 0.5859 5.10E-05 0.5859 6.03E-05
0.5908 -1.56E-06 0.5908 6.19E-05 0.5908 1.43E-04 0.5908 6.45E-05 0.5908 7.51E-05
0.5957 -1.05E-06 0.5957 6.81E-05 0.5957 1.54E-04 0.5957 7.78E-05 0.5957 8.98E-05
0.6006 -4.93E-07 0.6006 7.42E-05 0.6006 1.66E-04 0.6006 9.10E-05 0.6006 1.04E-04
0.6055 3.45E-08 0.6055 8.03E-05 0.6055 1.77E-04 0.6055 1.04E-04 0.6055 1.19E-04
0.6104 5.46E-07 0.6104 8.63E-05 0.6104 1.88E-04 0.6104 1.17E-04 0.6104 1.33E-04

202
0.6152 1.08E-06 0.6152 9.23E-05 0.6152 1.99E-04 0.6152 1.30E-04 0.6152 1.47E-04
0.6201 1.62E-06 0.6201 9.83E-05 0.6201 2.10E-04 0.6201 1.43E-04 0.6201 1.61E-04
0.625 2.10E-06 0.625 1.04E-04 0.625 2.21E-04 0.625 1.56E-04 0.625 1.75E-04
0.6299 2.60E-06 0.6299 1.10E-04 0.6299 2.32E-04 0.6299 1.69E-04 0.6299 1.89E-04
0.6348 3.11E-06 0.6348 1.16E-04 0.6348 2.43E-04 0.6348 1.81E-04 0.6348 2.02E-04
0.6396 3.60E-06 0.6396 1.22E-04 0.6396 2.54E-04 0.6396 1.94E-04 0.6396 2.16E-04
0.6445 4.08E-06 0.6445 1.28E-04 0.6445 2.65E-04 0.6445 2.06E-04 0.6445 2.29E-04
0.6494 4.56E-06 0.6494 1.34E-04 0.6494 2.75E-04 0.6494 2.19E-04 0.6494 2.42E-04
0.6543 5.06E-06 0.6543 1.39E-04 0.6543 2.86E-04 0.6543 2.31E-04 0.6543 2.55E-04
0.6592 5.52E-06 0.6592 1.45E-04 0.6592 2.97E-04 0.6592 2.43E-04 0.6592 2.68E-04
0.6641 5.96E-06 0.6641 1.51E-04 0.6641 3.07E-04 0.6641 2.55E-04 0.6641 2.81E-04
0.6689 6.42E-06 0.6689 1.56E-04 0.6689 3.18E-04 0.6689 2.67E-04 0.6689 2.94E-04
0.6738 6.87E-06 0.6738 1.62E-04 0.6738 3.28E-04 0.6738 2.79E-04 0.6738 3.06E-04
0.6787 7.33E-06 0.6787 1.68E-04 0.6787 3.39E-04 0.6787 2.91E-04 0.6787 3.19E-04
0.6836 7.76E-06 0.6836 1.73E-04 0.6836 3.49E-04 0.6836 3.03E-04 0.6836 3.31E-04
0.6885 8.21E-06 0.6885 1.79E-04 0.6885 3.59E-04 0.6885 3.14E-04 0.6885 3.44E-04
0.6934 8.67E-06 0.6934 1.84E-04 0.6934 3.70E-04 0.6934 3.26E-04 0.6934 3.56E-04
0.6982 9.11E-06 0.6982 1.90E-04 0.6982 3.80E-04 0.6982 3.37E-04 0.6982 3.68E-04
0.7031 9.56E-06 0.7031 1.96E-04 0.7031 3.90E-04 0.7031 3.49E-04 0.7031 3.79E-04
* Potential in volts.
* Current density in amperes per square centimetre

203
APPENDIX G: COMPOSITION OF BMR ELECTROLYTE
Sample Pt Pd Au Rh Ru Ir Os
Unit mg/l mg/l mg/l mg/l mg/l mg/l mg/l
Method *ICP-MS *ICP-MS *ICP-MS *ICP-MS *ICP-MS *ICP-MS *ICP-MS
TANK 1 <0.2 <0.2 <0.2 3.9 30 1.0 0.4
TANK 2 <0.2 <0.2 <0.2 4.0 32 1.0 <0.2
Sample Ag Bi Pb Se As Cu Ni
Unit mg/l mg/l mg/l mg/l mg/l mg/l mg/l
Method *ICP-MS *ICP-MS *ICP-MS *ICP-MS *ICP-MS *ICP *ICP
TANK 1 <0.2 5.6 2.2 11 150 55.73g/l 59.28g/l
TANK 2 <0.2 5.7 2.6 11 158 53.43g/l 61.45g/l
Sample Co S Al Ca Cr Mn Fe
Unit mg/l mg/l mg/l mg/l mg/l mg/l
Method *ICP *ICP *ICP *ICP *ICP *ICP *ICP
TANK 1 1434 90.23g/l 121 77.60 23.45 8.05 12.4g/l
TANK 2 1436 89.18g/l 116 73.70 22.70 8.4 12.3g/l

204
APPENDIX H: PHOTOGRAPH OF THE EXPERIMENTAL SETUP (ELECTROWINNING)
Fresh and Spent Electrolyte tanks
Temperature control boxes
Aluminium foil pipe to extractor fan 100 A DC Power Supply

205
SUBMISSION OF RESEARCH PAPER
The following article from a section of the results has been accepted for publication in
an ISI-peer-reviewed journal after the corrections suggested by both examiners have
been made:
Z.S. Msindo, V. Sibanda and J.H. Potgieter, Electrochemical and physical
characterization of lead based anodes in comparison to Ti- (70%) IrO2/ (30%) Ta2O5
dimensionally stable anodes for use in copper electrowinning, Journal of Applied
Electrochemistry (in press)
Related Documents