Lehigh University Lehigh Preserve eses and Dissertations 1993 An investigation of electrorheologial material adaptive structures David L. Don Lehigh University Follow this and additional works at: hp://preserve.lehigh.edu/etd is esis is brought to you for free and open access by Lehigh Preserve. It has been accepted for inclusion in eses and Dissertations by an authorized administrator of Lehigh Preserve. For more information, please contact [email protected]. Recommended Citation Don, David L., "An investigation of electrorheologial material adaptive structures" (1993). eses and Dissertations. Paper 181.

Welcome message from author
This document is posted to help you gain knowledge. Please leave a comment to let me know what you think about it! Share it to your friends and learn new things together.
Transcript

Lehigh UniversityLehigh Preserve
Theses and Dissertations
1993
An investigation of electrorheologial materialadaptive structuresDavid L. DonLehigh University
Follow this and additional works at: http://preserve.lehigh.edu/etd
This Thesis is brought to you for free and open access by Lehigh Preserve. It has been accepted for inclusion in Theses and Dissertations by anauthorized administrator of Lehigh Preserve. For more information, please contact [email protected].
Recommended CitationDon, David L., "An investigation of electrorheologial material adaptive structures" (1993). Theses and Dissertations. Paper 181.

o
AUTH()R~ .~
Don~ David lc
T~Tl :
An Inve tigati n f
I ctr he logical Material
daptive tructures
A E: May 30, 1993

An Investigation of Electrorheological Material Adaptive Structures
by
David L. Don
A Thesis
Presented to the Graduate and Research Committee
of Lehigh University
in Candidacy for the Degree of
Masters of Science
in
The Department of Mechanical Engineering and Mechanics
Lehigh University
1993


Acknowledgements
First, I would like to thank my parents, Dr. Sherman Don and Gloria Chang, for
supporting me throughout my academic career. Without-their never ending emotional
and financial support through these years, the completion of this effort would not have
been possible. I will forever be indebted.
Second, I would like to thank Dr. John P. Coulter for choosing me as your first
graduate student. My confidence in my abilities and my understanding of the
surrounding environment has forever benefited. As a friend and advisee - thank you.
I would also like to acknowledge my fellow gradpate students who I have
worked, played, and partied with. There are so many to recognize - My roommates
Alejandro Martin Mayori, Edward I. Wolfe IV, Steven P. Wolfe, and Joe Towfigi for not
only providing support but doing the dishes; Muge Demir (pronounced muge) and
friends for keeping me entertained and well fed; My co-workers, William H. Umbenhaur
III, Aki, and the rest of the gang for letting me think I was important; My drinking
buddies Jin H. Kim, James Mitrano, Eric Brause, and the rest of the Thursday night crew
for keeping me up all night and making the house smell like beer and cigarettes. I will
remember the times.
I can't forget myoid friends Parker M. Normann, Edward S. Regan, the rest of
the Lehigh gang, and Glen S. Gregory. Guys, Parker is going to marry first. Thanks for
hanging around.
I would like to also acknowledge a couple of undergraduates who worked on the
project with me. Michelle Parker and Mike Butzkies, thanks for doing some of the grunt
work. Your persistence and efforts are appreciated. Thanks goes to out Dr. Stanley H.
Johnson for giving me the "spark" to pursue an engineering career. You made it look
fun.
Finally, I would like to acknowledge and thank the sponsors for this project.
Funding was provided by Lehigh University, the National Science Foundation (grant no.
MSS-9110909), and the U.S. Army Research Office (grant no. DAAL03-92-G-0388).
Materials and supplies were generously provided by Dr. Keith D. Weiss, and Dr. Ted G.
Duclos from Lord Corporation, and Dr. Frank Arcella and Paul Biermann from Johns
Hopkins Applied Physics Laboratory.
iii

TABLE OF CONTENTS
ABSTRACT 1
CHAPTER 1: INTRODUCTION TO ELECTRORHEOLOGICAL MATERIAL
ADAPTIVE STRUCTURES 2
1.1 What is an electrorheological (ER) material? 2
1.2 Engineering Applications for ER Materials 10
1.3 Purpose of this investigation 19
CHAPTER 2: BACKGROUND ON STATE OF THE ART ENGINEERING OF
ER ADAPTIVE STRUCTURES 22
. 2.1 Effectiveness of ER Adaptive Structures 22
2.2 Rheological Problems 24
2.3 Modeling of the Dynamic Behavior of ER Based Beam Struct~es 27
2.4 Feasibiiity of Mode Shape Control.. 30
CHAPTER 3: RHEOLOGICAL INVESTIGATION 31
3.1 Introduction 31
3.2 Rheology Theory 31
3.3 Experimental Set up 38
3.3.1 Experimental Apparatus :; 38
3.3.2 Instrument Calibration 41
3.3.3 Material Preparation 41
3.3.4 Experimental Procedure 41
3.3 Results and Discussion 43
CHAPTER 4: INVESTIGATION ON THE MODELING OF ER BASED
STRUCTURAL BEAMS 55
iv
4.1 Introduction 55
4.2 Structural Theory ~ : 55
4.2.1 Derivation of a Bernoulli-Euler Beam 56
4.2.2 Derivation of the Ross, Kerwin, Ungar (RKU) Model 62
4.2.3 Derivation of the Mead and Markus Model.. 69
4.3 Experimental Set up : 77
4.3.1 Fabrication of ER Adaptive Beam Structures 77
4.3.2 Instrumentation 82
4.3.3 Experimental Procedure .. : 84
4.4 Resul~s and Discussion 85
CHAPTER 5: INVESTIGATION OF MODE SHAPE CONTROL USING A
MULT-ELECTRODE STRUCTURE 95
5.1 Introduction 95
5.2 Experimental Set up 95
5.2.1 Fabrication of a Multi-electrode PaneL 95
5.2.2 Instrumentation 95
5.2.3 Experimental Procedure 99
5.3 Results and Discussion 101
CHAPTER 6: CONCLUSIONS 108
6.1 Rheological Behavior of ERMaterials 108
6.2 Modeling of ER based Structural Beams 109
6.3 Mode Shape Control Using Multi-electrode Panels 110
6.4 Future Investigations 111
BIBLIOGRAPHY 115
VITA 120
v

LIST OF FIGURES
Figure 1.1.1 ER Phenomenon a)no electric field b)with electric field applied 3
Figure 1.1.2 Idealized Constitutive Shear Behavior of ER Materials 6
Figure 1.1.3 Observed Post-yield Shear Behavior 9
Figure 1.1.4 Pre-yield Shear Behavior of ER Materials 9
Figure 1.2.1 ER Engine Mount 11
Figure 1.2.2 ER Clutch and/or Brake(a) Concentric Cylinder Configuration (b)Parallel Plate Configuration 13
Figure 1.2.3 ER Controllable Damper(a) Fixed Plate Damper (b) Sliding Plate Damper 13
Figure 1.2.4 A Conceptualization of an ER Adaptive Structural System 15
Figure 1.2.5 ER Adaptive Structure Designsa) Single Constrained Layers b) Multiple Stacked Constrained Layersc) Extensional Structure d) Multi-Electrode Structure 18
Figure 1.3.1 Summary of Investigation 21
Figure 3.2.1 Modeling of a Linear Viscoelastic Material with Discrete Springsand Dampers 32
Figure 3.2.2 Response of a Linear Viscoelastic Material to a Sinusoidal StrainInput. : 36
Figure 3.3.1.1 Concentric Cylinder Rheometer used in the Investigation 39
Figure 3.3.1.2 Instrumentation of Rheometer 40
Figure 3.3.1 Magnitude of Stress versus Strain at 3 kV/mm at 30 Hz 44
Figure 3.3.2 Magnitude of Stress versus Strain at Electric Fields of 1.5, 2.0, 2.5,and 3.0 kV/mm 44
Figure 3.3.3 Magnitude of Stress vs. Strain at Frequencies of 10, 30, and50 Hz at 3 kV/mm 45
vi
Figure 3.3.4 Phase Angle versus Strain at an Electric Field of 3 kV/rnrn and 10Hz 47Figure 3.3.5 Phase Angle versus Strain at 10 Hz and Electric Fields of 1.5, 2.0,2.5, and' 3.0 kV/mm 47.Figure 3.3.6 Phase Angle versus Strain at an Electric field of 3.0 kV/rnrn at 10,30, and 50 Hz 48
Figure 3.3.7a Yield Strain as Defined by the Stress Criteria versus Frequencyat Electric Fields of 1.5, 2.0,2.5, and 3.0 kV/mm 50
Figure 3.3.7b Yield Strain as Defined by the Phase Criteria versus Frequencyat Electric Fields of 1.5,2.0,2.5,3.0 kV/mm 50
Figure 3.3.8 Magnitude of G versus Frequency at Electric Fields of 1.5, 2.0,2.5, and 3.0 kV/mm 51
Figure 3.3.9 Magnitude of G' versus Electric Field 54
Figure 4.2.1.1 Schematic of a Bernoulli-Euler Beam 57
Figure 4.2.2.1 RKU Free-Body Diagram 63
Figure 4.2.3.1 Schematic of the Strain due to Elongation and Bending 71
Figure 4.2.3.2 Strain in the Second Layer 71
Figure 4.3.1.1 Basic Preparation of an ER Structure 81
Figure 4.3.1.2 Structures S5 and S8: Composite beams 81
Figure 4.3.2.1 Experimental Input and Output 83
Figure 4.3.2.2 Experimental Setup for Testing Composite Beams 83
Figure 4.4.1 Frequency Response for Structure S5 at Electric Fields of 0, 1.5,2.5, and 3.5 kV/mm 86
Figure 4.4.2 Resonance Frequency Dependenceon Electric Field for Mode 1 87
Figure 4.4.3 Resonance Frequency Dependence on Electric Field for Mode 2 87
Figure 4.4.4 Resonance Frequency Dependence on Electric Field for Mode 3 88
vii
Figure 4.4.5 Resonance Frequency Dependence on Electric Field for Mode 4 88
Figure 4.4.6 Structural Damping Dependence on Electric Field for Mode 1 90,
Figure 4.4.7 Structural Damping Dependence on Electric Field for Mode 2 90
Figure 4.4.8 Structural Damping Dependence on Electric Field for Mode 3 91
Figure 4.4.9 Structural Damping Dependence on Electric Field for Mode 4 91
Figure 4.4.10 Resonance Frequency Dependence on Electric Field forStructure S9, Mode 1 93
Figure 4.4.11 Resonance Frequency Dependenc'e on Electric Field forStructure S9, Mode 2 93
Figure 4.4.12 Resonance Frequency Dependence on Electric Field forStructure S9, Mode 3 94
Figure 4.4.13 Resonance Frequency Dependence on Electric Field forStructure S9, Mode 4 94
Figure 5.2.1.1 Structure S3: Multi-electrode Panel Structur 97
Figure 5.2.2.1 Experimental Setup for Plate Structure 98
Figure 5.2.3.1 Different Electric Field Conditions of the Multi-electrode Plate 100
Figure 5.3.1 Resonance Frequency for Panel Conditions 1 through 6 103
Figure 5.3.2 Mode 1 a) Panel condition 1 b) Panel-condition 2 c) Panel"-
condition 3 d) Panel condition 4 e) Panel conditioni5 f) Panel condition 6 104-5"
Figure 5.3.3 Mode 2 a) Panel condition 1 b) Panel condition 2 c) Panelcondition 3 d) Panel condition 4 e) Panel condition 5 f) Panel condition 6 106-7
Figures 6.4.1 Optimal Electric Field to Minimize Vibration at OneLocation on a Structure 113
US! OF TABLES
Table 4.3.1.1 Summary of Materials to Make ER Structures 79
viii

NOMENCLATURE
RUEOLOGLICAwNYESTIGATION
't
G
Y
Shear stress
Shear Modulus
Shear strain
Radial sinusoidal excitation frequency
Phase angle
STRUCTURAL INyESTIGATION
m(x) Mass per unit length
w Displacement in the vertical direction
Ej Tensile elasticity of the ith layer•
I j Moment of inertia of layer ith layer
Hi ' Height of ith layer
Hi) Distance away of ith layer from the jth layer
HiD Distance away from ith layer to the new neutral plane constructed by theaddition of the constraining and sandwiched layers
.~ Flexural angle
B Effective Flexural Rigidity
D Distance the neutral plane is adjusted by the addition of constraining andsandwiched layers
g Geometric shear parameter
Y Geometric parameter
G/ Real part of the shear modulus of the sandwiched layer
~ Loss factor of the sandwiched material
ix

Wave number for simply supported boundary condition
Natural frequency of the structure
Damping of the structure
"
x

ABSTRACT ,-_
The investigation examined the application of electrorheological (ER) materials in
adaptive or intelligent structural systems. The first phase of this investigation
characterized the linear viscoelastic behavior of ER material 6533-30B obtained from
Lord Corporation. The material behaved linear viscoelastically up to approximately 1%I
strain within an electric field range from 1.5 to 3.0 kV/mm and a frequency range from 0
to 50 Hz. The yield strain was dependent upon electric field and slightly dependent upon
frequency. A positive correlation existed between electric field and yield strain and a
negative correlation existed between frequency and yield strain. Within the linear
regime, the material behavior, as quantified by the complex shear modulus, was
dependent upon electric field. The modulus increased in a parabolic manner with
increases in electric field. These experimentally determined properties were substituted
into the Ross, Kerwin, and Ungar, and Mead and Markus models that predict dynamic
response of 3 layer composite beam structures. The models predicted the resonance
frequency of the experimentally fabricated structures, but was less effective in predicting
the damping of those structures. In addition to simple beam structures, an experimental
feasibility analysis of a multi-electrode ER based structure was done. The resonance
frequencies of the structure changed dramatically when various electrodes were
activated. The modal shapes changed less dramatically when different panels were
activated.
1

CHAPTER 1: INTRODUCTION TO ELECTRORHEOLOGICAL MATERIAL
ADAPTIVE STRUCTURES
1.1 What is an electrorheological (ER) material?
Electrorheological (ER) materials are suspensions of dielectric particles in non
polar liquids that exhibit dramatic reversible changes in rheological response when
exposed to an electric field. A simple physical description of the behavior is that the
material transforms from a liquid without an "applied field to a solid like gel with an
applied field. A mechanism for this transformation is the formation of particle chains
aligned with the applied field as seen in Figure 1.1.1. Several papers have reviewed the
causes of this phenomenon [1-4,50].
Before discussing possible mechanisms for the ER phenomenon, it is important to
comprehend the physical restructuring of the ER material components that occurs when
the material is exposed to an electric field. Winslow's early work demonstrated the
formation of a fibrous mass when particles suspended in low viscosity oils were exposed
to an electric field [5]. He suggested that the mutual attraction of spherical particles in
regions of high electric field intensity leads to the formation of particle chains between
electrodes. In the presence of a shear stress, the equilibrium that is established between
the formation and breaking of the inter electrode chains corresponds to the yield strength
defined in the Bingham plastic model described later in this section [6]. When the
electric field is removed, the particles return to a random distribution allowing fluid flow
to resume. Several microscopy studies have provided evidence for the existence of these
fibrillated structures [5, 7-9].
2

Dielectric Non-PolarParticles Liquid Matrix
a)ParticleChain Formation
b)
Figure 1.1.1 ER Phenomenon a)no electric field b)with electric field applied
3

The primary criticism of particle fibrillation has been that the amount of time
required for mass migration does not correlate with the millisecond response time
observed for the electrorheological effect. However, the question that needs to be
answered is not so much as to whether particle fibrillation occurs, but rather what
happens to these particle chains under shear? Most of the concern over the formation of
a single fibril structure or the lack of this structure in an ER material is academic from an
application point of view. Utilization of ER materials in any practical device requires
such a high loading of particles that individual chains are not discernible. In this case,
the formation of thick columns or three dimensional particle structuring is evident [9-11].
Although it is generally accepted that the electrorheological phenomenon
originates from particle polarization induced by an electric field, no consensus regarding
the mechanism for the observed effect has been reached. Klass and Martinek were the
first to propose the induced polarization of the double layer surrounding each individual
particle in the fluid as a plausible mechanism for the electrorheological phenomenon [12,
13]. This double-layer can be defined as the asymmetric distribution of charges caused
by the influence of an external potential. The main criticism of this mechanism has been
that the Debye length of the double layers surrounding the particles is too large. In fact,0,
it can be argued that the extent of an individual double layer is often greater than the
distance actually separating the electrodes. This inconsistency led Stangroom to propose
that water acts as a bridge between particles through an electro-osmosis process [8, 14].
This mechanism assumes that ions trapped within the pores of the particle increase their
mobility by dissolving in the water. In the presence of an electric field these mobile ions
shift the water layer surrounding the particle toward the oppositely charged electrode.
Thus one side of the particle becomes overly saturated with water. Overlap of the water
between the particles is considered to be the bridge or glue that causes the ER effect.
4

Although it is possible that this mechanism is active in systems inherently containing
water, the development of ER materials containing semiconducting particles [15], lithium
hydrazinium sulfate [39], and substantially "anhydrous" alumino-silicates [16] has
eliminated the possibility of the presence of water being a necessary prerequisite for the
observation of the ER effect. A third mechanism that has been proposed to explain the
ER phenomenon is simply particle polarization [1, 5, 17-19]. It has been suggested that
the origin of polarization [1], such as charge migration through the bulk, on the surface
or in the double-layer, does not matter. Once polarization has been established, the
interaction of inter particle coulombic forces leads to the formation of a fibrillated
network. Again, from an design engineering point of view, this is all academic. The
macroscopic, rather than the microscopic, properties of the material are going to define
how the engineer chooses the design. With this in mind, the macroscopic rheological
characteristics of the material when exposed to different excitations - the two most
prevalent being steady-state shear and dynamic excitations - have been investigated.
The electrorheological effect initially was defined as the apparent change in
viscosity observed~ the materials developed by Winslow. Although from a
macroscopic point of view, a change in apparent or effective viscosity does occur, the
actual plastic viscosity (11) of the material defined -as the change in stress per unit change
in shear strain rate remains approximately constant as the applied electric field is varied.
In this situation the parameter that changes is the amount of shear stress needed to initiate
flow. An exall,1ple of the typical shear stress versus shear strain rate behavior observed
for an ER material in the presence of an electric field is shown in Figure 1.1.2. A
Bingham plastic model, as described by equation 1.1.1, can often provide a sufficiently
accurate description of the observed behavior to be used for the designing of ER material
devices;
5.

Increasing.Electric Field
'ry
Shear
Stress
Shear Rate
Figure 1.1.2 Idealized Constitutive Shear Behavior ofER Materials
6
't='ty+TlY (1.1.1)
This model recognizes that the property of an ER material generally observed to change
with an increase in electric field is the yield stress ('ty) defining the onset of flow. TheI
electric field induced yield stress, 'ty' and viscosity, 11, are the two most significant
parameters used in designing electroactive devices where flow properties or post-yield
properties are essential [20-22]. The dynamic yield stress ('ty,d) in a Bingham plastic
modeled ER material can be defined as the zero-rate intercept of the linear regression
curve fit. Naturally, the plastic viscosity of the material in the post-yield regime is
accurately reflected by the slope of the linear regression curve fit used in the analysis.
Many scientists have reported observing a higher static yield stress than dynamic
yield stress [1, 23] as shown in Figure 1.1.3. It is suggested that this apparent static yield
stress is related to the transient fracture. of the particle chains which is highly dependent
upon particle size, particle shape, the prior electric field, and flow history of the material.
In designing a device to utilize a particular ER material, it is necessary to consider the-
possible occurrence of this static yield. Upon returning to the flow regime from the static
situation, the rheology for an ER material is observed to follow the more typical behavior
exemplified by Figure 1.1.2.
The observed static regime is related to the pre-yield behavior observed in Figure
1.1.4. Several studies have investigated the behavior within this regime[23-26]. The
pre-yield regime is defined by a yield strain, 'Yy' and a static yield stress ('ty's)' In reality
there is no such thing as static yield stress, there is always some shear rate, albeit very
small. For primarily elastic materials, the static yield actually is an approximation for the
steady-state dynamic yield characterized by the complex shear modulus G*. The
complex shear modulus can be separated into its real, 0', and imaginary, Oil, parts called
7

the storage modulus and loss modulus, respectively. The loss factor, tan 0, is obtained
through the ratio Gil/G'. For ER materials these properties are dependent upon the
applied electric field. In the design of non-flowing devices, such as flexible or adaptive
structures, control of the pre-yield complex shear modulus is essential.
8
G.

't static y ~
'tdynamic y-..........~
ShearStress
Shear Rate
Figure 1.1.3 Observed Post-yield Shear Behavior
Pre-Yield't static y- -
't dynami~y-
ShearStress
y
Post Yield
IncreasingElectric Field
Shear Strain
Figure 1.104 Pre-yield Shear Behavior of ER Materials
9

1.2 Engineering Applications for ER Materials
The controllable rheological behavior of electrorheological materials is useful in
engineering systems and structures where variable performance is desired. When a
tunable product based on electrorheological behavior is implemented so as to have
sensory and control capabilities, the result is an intelligent material system or an adaptive
structure. In general terms such systems or structures are those that can sense external
stimuli and react appropriately to optimally meet pre-specified performance criteria
There have been many identified applications for ER materials in which there is
research including dampers, clutches, valves, and brakes. Significant advancements
related to these applications have recently been reviewed by Coulter et. al [27,50].
Controllable valves were among the original classes of ER material devices
identified and investigated by Winslow [5]. Provided that th~ial flowing through
the device is an ER suspension, the pressure drop across and flow rate through the device
can be controlled by the application of an electric field. Benefits of ER valves include
fast response time and an absence of mechanical moving parts.
Another class of devices that have been made controllable through the
incorporation of ER material valve technology is machinery and engine mounts. A
sche.~atic diagram of a possible controllable mount configuration is shown in Figure
1.2.1. Traditional fluid filled mounts, which are configured much like that shown in
Figure 1.2.1, are designed to have fluid inertia track characteristics, as well as top and
bottom compliance values, appropriate for specific force transmission applications. The
number, size, and shape of fluid inertia tubes is application specific, and in traditional
mounts is fixed once the mount is fabricated. The introduction of ER valves as inertia
10

Primary RubberSpring Element
(Top Compliance)
\
Inertia TrackContainingElectrodes
Figure 1.2.1 ER Engine Mount
11
BottomCompliance
}

track components brings with it a capability for temporal fluid inertia variation, and as a
result overall mount performance control.
Like ER valves, controllable ER clutches and brakes were originally investigated
by Winslow and reported in his 1949 disclosure [5]. Little was done to further the
d~velopment these devices over the next three decades. Since the early 1980's, however,
ER clutches and brakes have received much attention. ER clutches are based on sliding
plate configurations. They can be set up in either concentric cylinder or parallel disk
configurations as shown in Figure 1.2.2.
Example configurations for the two damper type devices, IChown as fixed plate
and sliding plate dampers, respectively, are shown in Figure 1.2.3. In a fixed plate
damper, the damping force on a piston is realized by the control of the pressure drop
across valve-like channels through which the ER material is forced to flow. In a sliding
plate damper, the damping force originates from the controlled shear resistimce between
.. the moving piston, which acts as one electrode, and adjacent parallel surfaces, which
remain motionless and act as the other electrode. In .both types of damping devices,
accumulators are often required to account for volume variations due to the travel of the
piston rod into and out of the damper cavity.
The inherent advantage of using ER materials in all of these devices is the ability
to alter almost instantaneously their rheological behavior by controlling an applied
electric field giving the device the ability to change it's performance in real time.
One of the latest ER technology applications is in adaptive or smart structures.
Adaptive or smart structures are structures that contain their own sensors, actuation, or
computational and/or control capabilities [28]. There are three classifications of general
structures; passive, semi-active, and active controlled structures. Passively controlled,.
structures offer no ability to change the already present mechanical system. The design
12

ER Material
(0)
ER Material
(b)
Figure 1.2.2 ER Clutch and/or Brake(a) Concentric Cylinder Configuration (b) Parallel Plate Configuration
!
;.;:
'. ;:::::::: : ;:.
: :
{ :;: ::','::
Accumulator I
(0)
v
!
Accumulator
(b)
v
Figure 1.2.3 ER Controllable Damper(a) Fixed Plate Damper (b) Sliding Plate Damper
13

of a passive structure must be predetermined to known operating conditions. There are
two fundamental ways to incorporate variability in a mechanical system. One involves
the addition of mechanical energy to the system (active control), while the other involves
the modification of the mechanical properties of the system (semi-active control). Active
and semi-active sytems comprise the realm of adaptive structures. Piezoelectric,
electrostrictive, magnetostrictive, and shape memory materials are all capable of adding
external mechanical energy to systems, and are useful within the active domain.
Structures comprised of ER material elements have the capability to control their
stiffness and damping; hence are classified as semi-active. A conceptualization of an ER
based adaptive structural system is shown. in Figure 1.2.4. Semi-active systems are
advantageous to passive and active structures in many ways.
ER adaptive structures will potentially be able to replace present methods of
structural damping in which passive polymer damping systems are presently being
employed. In many applications engineers seek to reduce the resonance phenomenon.
Resonance is the most efficient condition for energy transfer and occurs when the forcing'''...r!
frequency approaches the natural frequency of the structure. To passively dampen the
.resonant response, thin layers of polymer material are sandwiched between the structure
and a constraining layer. This arrangement produces shearing strains within the polymer
layer. When sheared, the polymer material absorbs some of the energy and transforms it
into heat; thereby reducing some of the response. By replacing this polymer layer with
ER material, as shown in Figure 1.2.4, the structure would be able to alter its natural
frequency; avoiding resonance altogether. The result is a much larger reduction in
response versus a totally passive polymer damping system.
14

Sensors
High VoltageSource
Figure 1.2.4 A Conceptualization of an ER Adaptive Structural System
15

Another advantage ER based structures have over passive polymer systems is the
frequency and temperature dependence of the polymer material. Systems utilizing
polymers have a optimal effectiveness at only one temperature and frequency. By using
ER systems, again with the ability to alter their damping properties, the goal would be to
develop some type of control system where damping would always be optimal.
ER adaptive structures may also be advantageous when compared with active
structures. Two types of active structures are shape memory and piezoelectric structures.
Shape memory adaptive structures apply very strong forces, but are only responsive in
low frequency range(< 5 Hz). Piezoelectric structures are much more responsive but are
very hard to fabricate, too brittle, and weigh too much to be used in some applications.
Newer piezoelectric polymers which solve the problem of manufacturing, brittleness, and
weight do not have enough force to be effective in some applications. The use of ER
materials in adaptive structures may be able. to solve some of these problems in a semi
active fashion [29].
Several examples of ER adaptive structure configurations that have been
suggested are shown in Figure 1.2.5. A siinpl~ constrained layer design similar to that
which was described above was patented by Carlson et. al [29]. This is shown in Figure
1.2.5a . Suggested along the same lines was the use of stacked constrained layers as
shown in Figure 1.2.5b. This would allow the ER elements to contribute more in the
structural dynamics by increasing the area of the ER layer. A design which
compartmentalizes the ER elements allows the structure to utilize the ER extensional
properties, rather than the shear properties as in a co~strained layer approach is shown in
Figure 1.2.5c. Multi-electrode configurations within the structure, such as in Figure
1.2.5d, allow the possibility for the structure to change or enhance it's modal shapes. In
many circumstances, most possible shapes of the structure can be approximated by a
16

weighted summation of the mode shapes. These mode shapes are based upon the
stiffness of the structure. If a structure is fabricated with different regions of stiffness
these modes could be altered. ER adaptive structures would be able to achieve different
areas of stiffness and therefore have different mode shapes. The significance of the
application has yet to be examined. Possible real world applications for these designs
include helicopter rotor blades, space platforms, airplane skins, robotics, complex
manufacturing, etc [30-34].
17

a)
":L m:I=~b)
~I
+
c) (d)
Figure 1.2.5 ER Adaptive Structure Designsa) Single Constrained Layers b) Multiple Stacked Constrained Layers c) Extensional Structure
d) Multi-Electrode Structure
18

1.3 Purpose of this investigation
The purpose of this investigation is to examine some of the problems concerning
the eventual physical realization of ER adaptive structures - this includes addressing
some of the rheological, modeling, and feasibility problems. The directions for the
investigation are shown in Figure 1.3.1.
Specifically, an in-depth rheological characterization was performed to increase
the scope of the understanding of the dynamic behavior of ER materials at small strains
characteristic of structural applications. Many of the previous investigations use the
quantity known as the complex modulus G*, 'where G' is the real part and Gil is the
imaginary part, to describe a materials viscoelastic behavior without adequately
commenting on the linearity. This quantity is a measurement of a materials linear
viscoelastic behavior and is virtually meaningless outside the linear range. The present
study provided a quantified definition of linear viscoelastic behavior in terms of yield
strain. The investigation experimentally examined the effects of electric field and
frequency on the transition from linearity. In hopes of developing a model to predict the
materials rheological response, the behavior of the complex modulus of the material was
also observed with respect to frequency and electric field. The repeatability of the
material over an expanded time frame was noted.
Utilizing the experimentally determined ER material properties, the behavior of
some simple ER structures were modeled using both Ross, Kerwin, and Ungar and Mead
and Markus theories. These pre-existent theories model the dynamic behavior of three
layer sandwiched composite structures. Experimental ER Structures were built and
tested to compare theory and experiment. In addition, a more complex plate structure
was experimentally tested to verify a possible application in mode shape control.
19

In summary:
o An in-depth rheological characte~ization of an electrqrheological material was
performed.
o The results of the rheological investigation were substituted into the Ross,
Kerwin, and Ungar model and Mead and Markus model to predict dynamic
structural response.
o Experimental adaptive structures were fabricated and tested to verify these
models...
o A experimental investigation was performed on a multi-electrode structure to
examine the feasibility of mode shape based adaptiv~ucture control.
20

DYNAMIC RHEOLOGICALCHARACTERIZATION OF ,
ELECTRORHEOLOGICAL MATERIALS
What is the linearrange of behavior?
PHASE 1
How does the material,. , behave in the linear
range?
Determine dynamic behaviorof the beams using RKU and Mead "-
and Markus theories ~
MODELING OF ELECTRORHEOLOGICALMATERIAL BASED BEAMS
Do theory and/ experiment match?
Fabricate ExperimentalBeams
PHASE 2
INVESTIGATE THE FEASIBILITY OFMODE SHAPE CONTROL USING
MULTI-ELETRODE PANELS
, 1
Construct experimentalmulti-electrode panel structuresand experimentally determine
mode shapes
PHASE 3'
--~,. Feasible?
Figure 1.3.1 Summary of Investigation
21
CHAPTER 2: BACKGROUND ON STATE OF THE ART ENGINEERING OF
ER ADAPTIVE STRUCTURES
2.1 EffectiVeness of ER Adaptive Structures
Several studies investigated. the effectiveness of a ER based constrained layer
structures. Coulter et al. [30, 35] examined ER material sandwiched between
constraining layers of aluminum. Latex material, attached along the sides, sealed in the
ER material. At ends and the middle of the beam, silicon rubber completed the seal and
acted as a spacer to keep the electrodes apart. The investigation determined the
resonance and damping of simply supported structures. The investigators characterized
these properties over a frequency range from 0-200 Hz for electric fields up to 2.5
kV/mm. Structural resonant frequency increased linearly with respect to changes in
electric field. The slope of this increase for modes 1, 2, and 3 was 12.1, 13.0, and 18.6
(Hz·mm)/kV, respectively. Structural loss factors ranging from 9.03 to 0.11 also
increased with electric field, but decreased with mode number. There was no clearly
observable relationship between increases in loss factor and electric field.
Choi et al. [36, 37] investigated beams comprised of polystyrene, aluminum, and
70/30 brass constraining layers. Silicon rubber, attacheo around the entire outside edge
of the beam, sealed in the ER material. The investigation calculated the effective
bending modulus and the effective loss factor per equations provided in ASTM standard.G756-83 [45] for cantilevered beams. The effective bending modulus increased 25
100% and the effective loss factor increased 42-133% with an electric field of 2 kV/mm.
The magnitude of increase depended upon the material used as constraining layers.
Thompson and Gandhi [31-34, 37-39] investigated ER beams with aluminum. .
constraining layers. Again, silicon rubber, around the entire outside edge, sealed the ER
22

material in. Both resonant frequency and damping increased with increases in electric
field. The investigation also examined the effects of temperature on these properties.
Changes in resonant frequencies and damping with respect to increases in electric field,
decreased at higher temperatures.
Though these studies have shown the potential applications and effectiveness of
ER structures, some problems need to be addressed before the systems are physically
realizable.
23

2.2 Rheological Problems
One fundamental problem is the rheological understanding of ER material
behavior. Most rheological investigations performed to date utilized constant shear rate
tests. There is a need to do more dynamic type testing at shear strain amplitudes that are
characteristic of structural damping applications. More specifically, there is a need to
model the behavior, standardize the testing, and expand the operational testing
parameters of the materials. Several studies have partially address these rheological
Issues.
Jordan et al. [9] tested a suspension of a mineral in oil, supplied by Lord
Corporation, using both parallel plate and Couette rheometry. The instruments used were
a Rheometries Mechanieal Spectrometer model 7200 and a Rheometries System IV. The
investigation presented a model based on the assembly of particle strings between two
plates. For small strains, they approximated the elastic storage modulus to be
(2.2.1).~
where
(2.2.2)
and Eo is the permittivity in a vacuum, E1 is the permittivity of dispersing medium, E2 is
the permittivity of a particulate phase, E is the electric field, $ is the volume fraction of
particulate phase, and "'I is the shear strain. A point dipole model under predieted the
elastic modulus of their materials. A multipolar approximation used for highly
24

polarizable particles more accurately predicted the modulus. In addition, they
microscopically observed the fracture of particle chains and reformation within the
material. When the thin fibrils break off, they reformed and joined onto other chains
forming thick columns.
Gamota and Filisko [25, 26] studied ER materials composed of alumina-silicate
particles in paraffin oil. The materials were tested using rotational rheometry at
moderate frequencies; 10-50 Hz, and at high frequencies; 300-400 Hz. The investigation
identified three regions of behavior: pre-yield, yield, and post-yield. "Each region had its
own deformation characteristics; linear viscoelastic in the pre-yield, viscoelastic plastic
in the yield, and plastic in the post-yield. The yield strain was defined as a sharp
deviation of the first derivative of the stress function with respect to time. Yield strain
decreased with increases in electric field, while yield strain increased. with increases in
frequency. A Zener element modeled the pre-yield behavior.
Yen and Achorn [23] experimented with hydrated particulates of lithium salt of
poly(methacrylate) dispersed in chlorinated paraffin oil. The materials were tested with a
Rheometrics RMS-605 parallel plate rheometer. They observed linear elastic behavior at
small strains and plastic behavior at high strains. Yield stress, defined as the stress
transition point from elastic to plastic behavior, increased with increases in particle
concentration and electric field.
Spurk and Huang [40] tested dispersions of silica particles in silicone oil using a
non-conventional. low inertia rheometer system. The investigation observed a
deterioration of the electroviscosity under the application of a d.c. electric field over a
period of time, while a.c. fields were found to be more stable.
Thurston and Gaertner [41] tested corn starch in mineral oil fluid using a
rectangular channel. They observed a rapid change in viscoelastic response with the
25

initial application of electric field and a slower change In viscoelasticity with the
continued application. Their conclusions conjectured that though the initial response is
very fast, the formation of a complete and final microstructure was a very slow process.
Coulter et al. [35] tested ER materials using an axial rheometer attached to an
MTS testing system. The investigation found that G' increased with increases in electric
field while the loss factor decreased. Storage modulli as high as 70 kPa were seen. Loss
factors generally remained within the range 0 to 4.
Shulman et al. [18, 42] and Vinagradov et al. [17] tested diatomite particles in
transformer oil using a Couette type rheometer. At high electric fields G' and G"
increased dramatically with increases of particle concentration until about 30%. With
further increased particle concentration G' still increased, though less dramatically, while
G" remained constant. They attribute this phenomenon to the increase in defects in the
skeleton of the structure and the enhancement of the elastic interactions between the
particles. They also observed a frequency dependence of G' and G" related to what they
called the natural frequency of the micro structures. G' and G" were constant at
frequencies below the natural frequency, as the frequency approached the natural
frequency there were abrupt changes in the moduli.
Brooks et al. [43] did investigations using lithium poly methacrylate dispersed in
cholorinated hydrocarbon oil. The materials were tested using shear wave propagation
with the Rank Pulse Shearometer at a frequency of 191 Hz. The storage and loss moduli
increased with applied field to a maximum then decreased. At lower fields, the storage
modulus was higher than the loss modulus, but at higher fields, the moduli are found to
be similar.
26
2.1 Modeling of the Dynamic Behavior of ER Based Beam Structures
Another problem that needs to be addressed, is the "intelligence" that will control
the structure. By themselves these ER structures are not different from passive polymer
systems. The "adaptiveness" arises when a control system is added. Some suggested
control systems are classical feedback, state-space, or neural network based
methodologies. One of the first steps in selecting an appropriate control system is to
develop a mathematical model of the system response. The development of a model will
significantly aid in the selection and creation of-a control scheme.
Much work has been done in modeling the vibration of composite beams. These
models are based on constrained layer polymer damping systems, whose shear behavior
of the sandwiched layer accounts for the damping. It is generally accepted that ER
materials will shear before elongating in a bending arrangement as suggested in Figure
1.2.4. Some ofthese theories may be applicable. Two generally accepted theories in the
vibration community are the Ross, Kerwin, and Ungar (RKU) model [44, 45] and the,I
Mead and Markus model [46]. The RKU model is based on the classical fourth order
Bemoulli-Euler beam, while the Mead and Markus model is based on a sixth order
equation. Section 4.2 examines these theories in detail. Several previous investigations
have attempted to model ER based beams using these theories.
Coulter et al. [30, 35] investigated the applicability of the RKU model in its
original form using a simply supported boundary conditio~. The study substituted
material property data obtained from a rheological investigati,on into the RKU model.
The theory under predicted both the modal frequencies and the damping of the structure.
The author's attribute this to uncertainty in the" rheology and the experimental deviation
from the theories original assumptions. The deviation of the original assumptions in the
27

theories were mainly attributed to the use of the silicon rubber to seal and separate the
electrodes surrounding the ER material.
Choi et al. [36] theoretically modeled the behavior of ER material beams using
the ASTM standard number 0756-83. The ASTM standard measures damping
properties of polymers utilizing a cantilevered beam based on the RKU model. The
methodology is to measure material properties of the sandwiched layer by calculating the
resonance and damping of a constrained layer structure containing that material. In this
investigation, ER material replaced the polymer layer. The study compared rheological
data in the form of 0' and Oil obtained from a previous investigation to the rheological
data obtained from the ASTM standard. The results showed that the ASTM standard did
not adequately predict the results obtained from rheological testing. The change in the
stiffness of the ER layer obtained from results on a rheometer was on the order of 105 Pa
while change in effective stiffness of the structure based on the ASTM standarQ was on
the order of 109 Pa.
Mahjoob et al. [47] investigated both the RKU and the Mead and Markus models.~
The investigation determined rheological data from the results of a structural
investigation examining the resonance and d~mping of ER based beams. Mead and
Markus models better predicted the properties. A linear extrapolation of the behavior of
a beam with no interference from sealant was performed based on the results obtained for
experimental tests using varying amounts of the sealant. The conclusions of the
investigation seem to find that both of these models could be used to predict the response
of structures. The results of this investigation were dubious since G' was observed to be
around 300 kPa; three to four times as strong as any other material available.
28

None of these investigations has definitively concluded that the prior theories
were applicable or inapplicable to ER adaptive structures. There are three plausible
explanations why previous investigations faltered.
One, the rheology data was not accurate. Many of the investigations reported
rheology daU! while none adequately comment on the linearity of the materials,
repeatability of the testing, or the uncertainty of the properties.
Two, the experimental structures did not meet the theoretical models specified
criteria. The theories assumed pure sinusoidal mode shapes and unconstrained shear
strain within the sandwiched layer. Some of the experimental investigations used
cantilevered boundary conditions and completely sealed the edges of their structures with
silicon. A cantilevered beam at the first modal frequency does not have a sinusoidal
modal shape. The use of silicon sealant constrained the shear within the sandwiched
layer.
Three, the past theories may not llave been applicable due to some of the
approximations used in the theories. Use of these theories may not have been sensitive
enough for materials in the range of hundreds of kPa.
It would seem practical, before concluding that these theories were completely
inapplicable, to investigate the rheology more thoroughly and modify the experimental
procedure to· simulate the theoretical models more accurately.
29

C
2.4 Feasibility of Mode Shape Control
Many investigations describe the use of a multi-paneled electrode design. The
advantages of using multi paneled electrodes are two fold. These configurations are used,
to stiffen or weaken different areas of the structure. By changing the stiffness in
different areas, one, the resonance frequency and damping have more variability, and
two, the modal shapes of the structure can be altered. The advantages of varying the
resonance and damping of the structure are discussed in the preceding sections. The use
of mode shape control is a more innovative application. The concept would be for the
structure to be able to choose what shape it vibrates in. For example, if a simply
supported beam is forced· at a frequency that excites the second mode there is no
vibration in the center. This point of zero displacement is known as a node. If the
designer wanted to put a piece of equipment, sensitive to motion, onto the structure the
best place would be to put it in the center. The advantage ER materials have over a
passive system methodology is increased robustness. A passive system could use this
application for only one pre-determined forcing frequency and at only one location. ER
materials make it possible to excite different modes and place nodal points onto different
areas of the stru~ture. The feasibility and effectiveness of this innovative application has
not been researched significantly.
30

CHAPTER 3: RHEOLOGICAL INVESTIGATION
3.1 Introduction
The motivation for this phase of the research was to increase the scope and
understanding of ER material dynamic behavior at small strains. The investigation
proposed to define a linear range of behavior for ER materials and quantify this region in
terms of a yield strain. The yield strain's dependence on frequency and electric field was
observed. The investigation then examined the rheological property known as the
complex shear modulus within this linear region.
A annular pumping mechanism described in Section 3.3, was us
properties. The methodology was to induce a shear strain and measur the transmitted
stress across the material. By comparing the induced shear strain and nsmitted stress,-I
the rheological properties were determined. The following section des ibes the usage of
the complex shear modulus in characterizing linear viscoelastic shear havior.
3.2 Rheology Theory
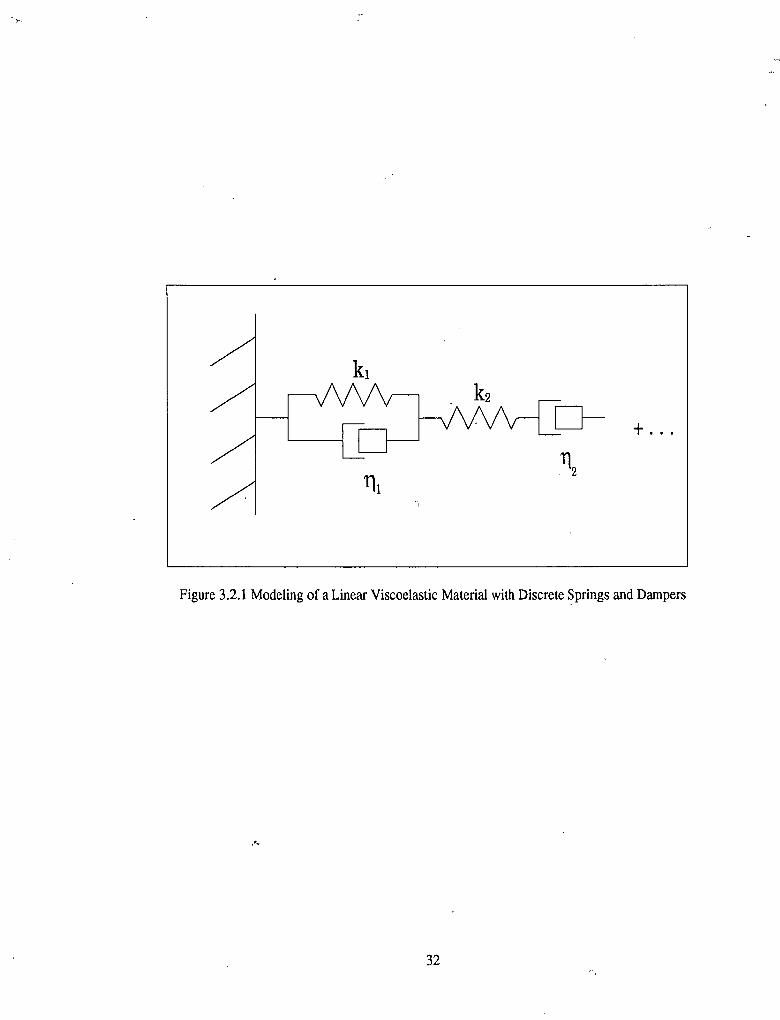
A quantity known as the complex shear modulus descri s a materials linear
viscoelastic shear behavior. More specifically, the complex shear modulus quantifies the
steady-state dynamic behavior using. -models based on discrete springs and dampers as
shown in Figure 3.2.1. The definition is presupposed upon the materials time dependent
behavior being modeled according to a linear ordinary differential equation. If the
material does not behave in a linear fashion, the complex modulus is virtually
meaningless. The linear dependence can be expressed in the condition that the
transmitted stress must be proportional to the induced strain within the Laplace domain,
31
'I
111
+...
Figure 3.2.1 Modeling of a Linear Viscoelastic Material with Discrete Springs and Dampers
,'-
32

1:(S) =G(s)y(s) (3.2.1)
where 1: is the transmitted stress, 'Y is the induced strain, and 0 is the shear modulus
defined as some ratio of two polynomials in s.
The complex shear modulus is a steady state property that describes the materials
behavior when ~xposed to a sinusoidal strain input,
./
1:(s)=G(s) 2Y ill 2
s +ill
By performing a partial fraction expansion of equation 3.2.2,
a a b b b1:(S) = . + . +_1_+_2_+_3_+...s+ Jill s- Jill S+SI S+S2 s-tS3
(3.2.2)
(3.2.3)
where a, and aare complex conjugates, and Sl ,S2' and S3 are the poles of 0(8). If the
inverse Laplace transform is performed on equation 3.2.3,
(3.2.4)
The exponential terms drop out as time goes to infinity, and are left with,,.
(3.2.5)
which is defined as steady state stress response. The constants a and a can be evaluated
from equation 3.2.2 where,
33

and
a = G(s) 2ym
2 (s+ jm) 1_ .s +00 S--Jffi
- ym . Ia=G(s) 2 2 (s-jm) _.s +0) S-+Jffi
(3.2.6a)
(3.2.6b)
By performing the substitutions for s, we realize that GUO)) is now a complex
quantity, or what we have been describing as the complex shear modulus. The complex
function can be written in phasor notation,
and
G(- jm) =IG(- jO))le-j~
!,,---,where <j> is the phase angle of the material. Note that
IGUm)1 = IG(- jO))1
and the Laplace transform of the steady state stress is,
a a'tss(s) = . + .
s+ jm s- jm
(3.2.7a)
(3.2.7b)
(3.2.8)
(3.2.9)
Substituting equations 3.2.6a, 3.2.6b, 3.2.7a, 3.2.7b, and 3.2.8 into equation 3.2.9, and
taking the inverse transform,
34

(3.2.10)
This reduces to
(3.2.11)
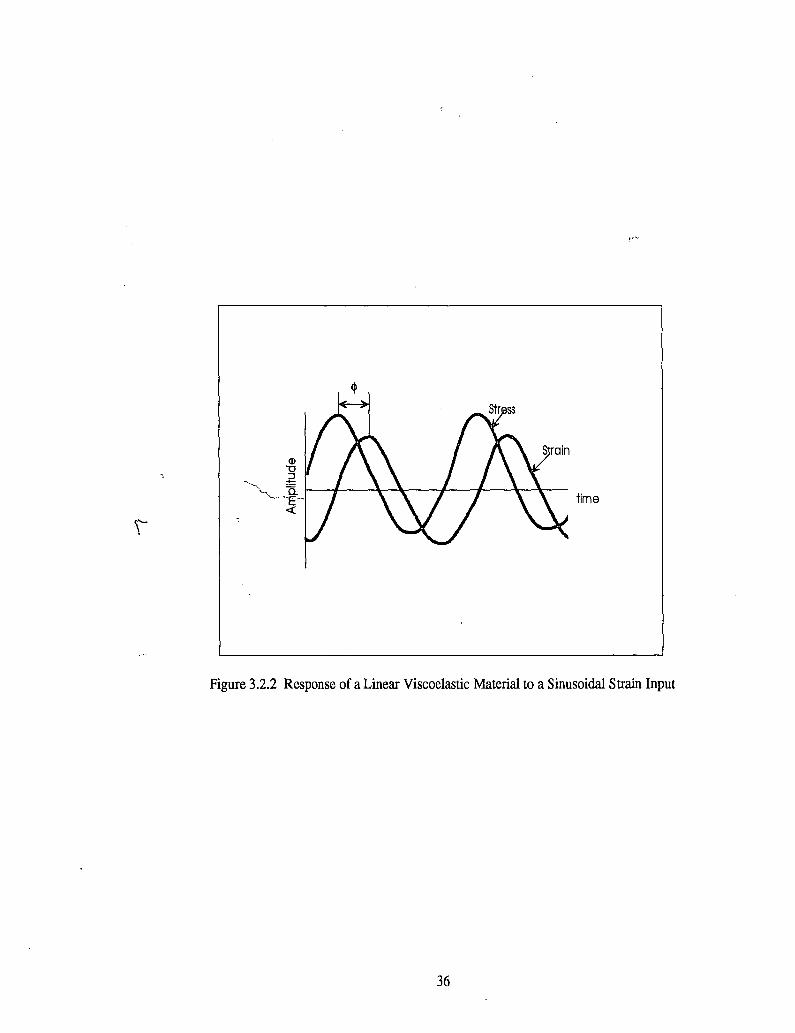
In response to a sinusoidal shearing input,. a material that behaves linear
viscoelastically has a stress output with the same frequency, proportional amplitude, and
a phase shift. Typical linear viscoelastic behavior can be seen in Figure 3.2.2.
A definition of linear behavior can now be proposed. There are two simultaneous
criteria for yield. One, the stress amplitude must be proportional to the strain amplitude,
(3.2.12)
Two, the phase angle must only be a function of frequency and not strain. This is
proposed because of phasor notation in equations 3.2.7a and 3.2.7b. The property G(jm)
is only dependent on frequency.
To completely characterize the material's linear viscoelastic behavior, the
magnitude of G(jm) and phase must be measured over a desired frequency range. A
35
time
Figure 3.2.2 Response of a Linear Viscoelastic Material to a Sinusoidal Strain Input
36
perfectly elastic material will have no phase angle, while a perfectly viscous material will
have a phase angle of 900• All materials do not act perfectly and have in phase and out
/
of phase portion. We can express the complex modulus by
G' = IG(jm)lcos$
and
G" = IG(jm)1 sin $
(3.2.13)
(3.2.14)
where G' represents the in phase portion and Gil represents the out of phase portion. In
rheology terminology these are known as the st~rage and loss modulus respectively.
An experiment was designed to quantify the region of linear behavior in terms of
yield strain, and examine the effects of electric field and frequency on the complex shear
modulus. A description of the experimental apparatus utilized follows.
37

3.3 Experimental Set up
3.3.1 Experimental Apparatus
An axial rheometric device, as shown in Figure 3.3.1.1, measured the rheological
properties of the ER material. The cup had an inner radius of 22.96 mm and the bob had
an outer radius of 21.96 mm resulting in a 1 mm gap between the two. The material was
placed in a gap between the cup and the bob. An electric field was applied across this
gap. Displacement of the cup induced a strain on the material. By comparing the
transmitted stress across the material and induced strain, the IGUm) I and the phase
between the two were obtained.
MTS machine model number 305-02, controlled by an MTS 442 feedback
controller, provided the strain on the material. The feedback sensor was a Lucas
Schflevitz I" LVDT. An Onosokki CF920 Dynamic Analyzer provided the sinusoidal
signal to the MTS machine. An Interface SM-250 load cell with a stiffness of 7300
leN/m and a corresponding natural frequency of approximately 1000 Hz, measured the
load and/or stress transmitted across the material. A Series 230 Bertan High Voltage
Power Supply applied the electric fields. In addition, for more accurate strain signals, a
Bentley-Nevada Series 7200 proximity sensor measured the actual strain. The
transmitted stress from the load cell and the induced strain from the proximity probe
were compared using the Onosokki Dynamic Analyzer. The analyzers FFT hardware
calculated amplitude and phase of the complex modulus. A diagram of the
instrumentation is shown in Figure 3.3.1.2.
38

\\
E.l1ed to this::'evel with ER Ma~eriai
1 rrnn Gap
Cup
Connected toMTS Machine
Figure 3.3.1.1 Concentric cylinder rheometer used in'the investigation.
39

<.
LVDTLoad Cell
DynamicAnalyzer
MTS
f-- M.-,Qcfne
ExternalStrain (Displacement)Input Signal
Figure 3.3.1.2 Instrumentation of Rheometer
40
3.3.2 Instrument Calibration
. Testing of an S-8000 standard viscosity fluid verified the calibration of the load
cell and proximity sensor. The standard kinematic viscosity for this material as rep.orted
by National Bureau of Standards was 41.92 Pa·s at 68 F. Two experimental tests using
the described apparatus yielded 40.27 ± 2.96 Pa·s and 46.91 ± 6.31 Pa·s at room
temperature. The estimated uncertainty of the experimental data was estimated to be 10
20% error.
3.3.3 Material Preparation
The investigation used ER material number 6533-30B obtained from Lord
Corporation. Prior to actual testing of the material, preparation included placing the test
sample on rollers for at least 24 hours, and afterwards, ultrasonically mixing it for 16
seconds. Ultrasonic mixing removed any residual particle flocculation. The ER material\
was then poured into the cup and evacuated by exposure to a vacuum for 30 minutes
before testing. Vacuum desiccation removed air pockets. Testing began immediately
after desiccation.
3.3.4 Experimental Procedure
The first purpose of the rheological investigation was to determine the range of
linear behavior in terms of yield strain and its dependence on electric field and
frequency. This rheological study exposed the ER material sample to strains from 0.001
to 0.1 at frequencies of 10, 30 and 50 Hz. Testing was performed with applied electric
fields of 1.5, 2, 2.5, and 3 kV/mm.
The material was first tested at 10 Hz and 3.0 kV/mm. Strain was swept from
. 0.001 to 0.01 in increments of 0.001, then from 0.01 to 0.1 in increments of 0.01. The
41

I! -
experiment measured the stress amplitude and phase angle at each respective strain
amplitude. The applied field was reduced to 2.5 kV/mm, and the procedure wasI
repeated. At each successive electric field this procedure was performed.
After all the electric fields were tested the frequency was increased to 30 Hz. The
strain at all the electric fields was repeated at this new frequency. After which, the
frequency was increased to 50 Hz and the strain sweep repeated. The entire procedure
was repeated two more times for each frequency.
The experiment produced three strain ,sweeps at each given electric field andJ.
frequency. Stress amplitude and phase angle data were measured for each electric field
and frequency.
The second purpose of the investigation was to gam a more III depth
understanding of the behavior within this defined linear region. The stress and strain
amplitudes were measured within the frequency range from 0 to 50 Hz at electric fields
of 1.5, 2, 2.5, and 3 kV/mm. The complex shear modulus was-calculated.
42

3.3 Results and Discussion
The first objective was to define the strain amplitudes in which the material
behaved linearly with respect to stress. The material behavior was considered linear only
if the shear stress was a linear function of strain per equation 3.2.12, and the phase angle
was independent with respect to strain by the definition of the complex modulus,
equation 3.2.7a and 3.2.7b. Both of these conditions were met simultaneously.
Figure 3.3.1 shows a typical dynamic stress-strain relationship. An ideal linear
relationship between stress and strain existed at small strain amplitudes. It must be noted
that the strain axis was plotted on the log scale to clarify observation of the stress-strain
relationship. When a certain strain was reached, there was a dramatic decrease in the
transmitted stress that signifies a yielding of this linear behavior. As strain increased
further, pseudo linear relationship as described in equation 1.1.1, between stress and
strain appeared signifying typical Bingham plastic behavior. This behavior was similar
to that seen in Yen and Achorn [23].
The investigation observed significant changes in the stress-strain relationship
when electric field was increased as seen in Figure 3.3.2. The slope of the curve within
the linear region, IGUm) I, increased, and the yield stress increased with increases in
electric field. This behavior was seen by Yen and Achorn [23] and Chrzan and Coulter
[48]. The increase in slope and the yield stress when the field was applied was likely due
to the increase in dipole moment of the particles as discussed in Jordan et al. [9]. The
increased moment increased the strength of the particle chains formed between the
electrodes.
The stress-strain behavior dependence on frequency was not as clearly observable
as was seen in Figure 3.3.3. There was little change in the slope of the curve, the yield
stress or the yield strain. Jordan et al. [9] and Shulman et al.
43

1000
900
800
700
Ci1 600e:.~
500
...- 400CI)
300
200
100 Unear Viscoelastic Viscoelastic Plastic Plastic
O+----,---..---...,...---,--.,.....,..........,r-r---....,....-..,....--,--,-...,........,~..._l
0.001 0.01 0.1
StrainFigure 3.3.1 Magnitude of Stress versus Strain at 3 kVjrnm at 30 Hz
0.1o+--_r----,,----,r--T'"""T""T~r----r----,-_r__,_......,-,r_rl
0.001 0.01Strain
Figure 3.3.2 Magnitude of Stress versus Strain at Electric Fields of 1.5, 2.0,2.5, and 3.0 kV/rnm
44

Figure 3.3.3 Magnitude of Stress vs. Strain at Frequencies of 10, 30, and 50 Hz at 3 kVjmm
---0- 10 Hz
-0- 30 Hz
---r- 50 Hz
0.10.01Strain
1200.,.----------=---------, ,------,
1100
1000
900
800-~ 700'-'
~ 600Q)
~ 500CJ)
400
300
200
100
0+-----r--r--r--r"""T"""T-r-r,----r--r-r---r--r-r-"'T""T""'l0.001
45
iC
.ii
"',,'-
'i.'\~'I:I,~,;.:
[42] also reported a relatively flat G' with respect to frequency at low frequencies.
A typical phase-strain relationship is shown in Figure 3.3.4. The phase' angle had
two asymptotic regions. The first region exhibited mostly elastic behavior; phase angles
near zero degrees, while the second region exhibited mostly viscous behavior; phase
angles approaching ninety degrees. T~e region between the two is defined as a transition'.
region where there is a dramatic change in the slope of the phase-strain curve. This
dramatic change in the phase from a constant near the end of the first asymptotic region
signified a yielding of linear behavior - as phase should have been independent of strain
amplitude. Gamota and Filiskp [25] also obser~ed this type of behavior. At small strains
they observed a linear viscoelastic region, followed by a viscoelastic plastic in the
transition region,and then fmally a totally plastic deformation region.
This, investigation also observed a dependence of electric field on the phase-strain
relationship as seen in Figure 3.3.5. The linear viscoelastic region defined by the phase
strain curves, elongated with increases in electric field. Again, this was most likely due
to the increase in the dipole moment of the particles. The transition from linearity due to/
breaking of these particle chains was conjectured.
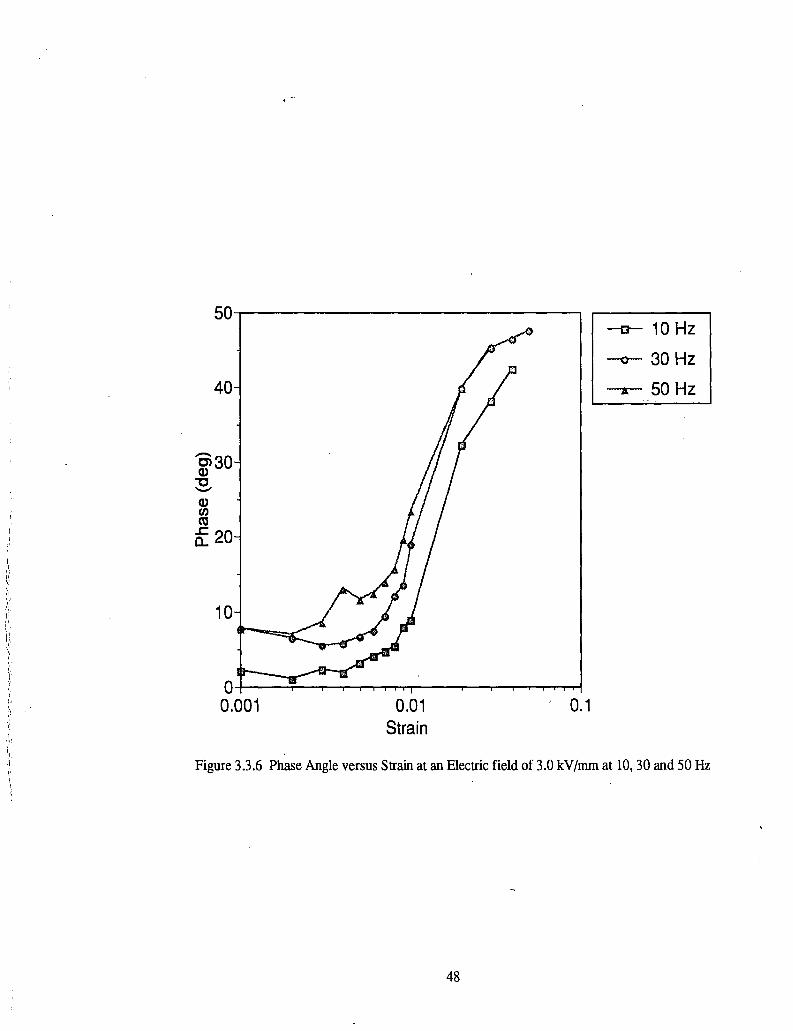
There were also slight increases in the linear viscoelastic region with decreases in
the frequency as was seen in Figure 3.3.6. As frequency was increased the yield strain
decreased. This supports the notion that the material became non-linear "easier" at
higher frequencies. The non-linear behavior could be due to a natural frequency within
the material or some type of non-linear hydrodynamic phenomenon with the liquid
matrix.
In terms of defining a region of linear viscoelastic behavior, both the stress-strain
and phase-strain relationship criteria must be satisfied. It was clearly seen that there was
46

60....--------------,----------,
50
40.......C)Q)
~Q) 30l/)ro..ca..
20
10
Unear VIScoelastic VIScoelastic Plastic Plastic
0.1O;-----.,.....--,--.,.---r---,--,-T"'"'T"".----~-__r____,...____,____,...~..........._i
0.001 0.01Strain
Figure 3.3.4 Phase Angle versus Strain at an Electric Field of 3 kV/mm and 10 Hz
60....---------------------, ,-----,___ 1.5 kV/mm
-0- 2.0 kV/mm
-.:- 2.5 kV/mm
___ 3.0 kV/mm
0.10.01Strain
0;--____,_--T--..,....-r-T'""'T""'T'".,...,....-----,,.....-~__,_"'T""""""T"""'T""'1"_T_t
0.001.~
40
10
50
C)Q)
~Q) 30l/)roL:a..
20
Figure 3.3.5 Phase Angle versus Strain at 10 Hz and Electric Fields of 1.5, 2.0, 2.5, and 3.0 kV/mm
47
-m-- 10 Hz
-0- 30 Hz
-r- 50 Hz
, 0.10.01Strain
0+---:;:..-...----r--r-"'T""'T"'"'T'"'l""1---r--~_r_~__r_r"'T'"i
0.001
10
40
50-r-------------------, ,....------...,
'0)30Q)
~Q)ena:l
it 20
Figure 3.3.6 Phase Angle versus Strain at an Electric field of 3.0 kV/mm at 10,30 and 50 Hz
48

a linear stress-strain relationship. The material was not as "linear" considering the
second criteria - independent phase with respect to strain. Experimental trends for these
yields with respect to electric field and frequency existed.
The stress yield was defined as the yield strain where there was a dramatic
decrease in the transmitted stress. The phase yield limit was quantified to the yield strain
where there was a deviation of five degrees from the asymptotic constant. The observed
relationship between the stress-strain yield, and electric field and frequency is presented
in Figure 3.3.7a. The observed relationship between p~ase-strain yield and electric field
and frequency is shown in Figure 3.3.7b. Generally, for both cases, the yield strain
increased with increases in electric field and decreases in frequency. This was
contradictory to what was found in Gamota and Filisko[25].
Though the apparatus was able to observe these experimental trends in transition
from linearity, it is not believed that the instrumentation was sensitive enough to quantify
these small phase angles. As was observed, in many of the instances the phase angle
approached an asymptotic constant, generally .less than 5 degrees, around .1% strain.
The question then became how to define the phase angle, and more specifically what
were G' and G".
Phase yield was defined at the point where the phase strain relationship
approached an asymptotic constant. The instrumentation of this investigation was not
sensitive enough to measure such small phase angles, and apply such small strains
accurately. The investigation was able to safely conclude that at 1.5 kY/mm or greater,
G' was usually greater than 90% of IGUO)) I due to the small phase angles.
With the present instrumentation, the quantification of material behavior within
the linear viscoelastic region was limited to observation of IGUO)) I or in this case G'.
This is seen in Figure 3.3.8. As electric field was increased, there was significant
49

---g- 1.5 kVImm
-f)- 2.0 kV/mm
-or- 2.5 kV/mm
-.- 3.0 kV/mm
504020 30Frequency (Hz)
10O-l-----,,....---.--....------r---.--....------r---,....---.------l
a
0.2
1.2....--------------------, .--------,
1
0.8;f.c:.~
Ci5 0.6"0Q)
>= 0.4
Figure 3.3.7a Yield Strain as Defmed by the Stress Criteria versus Frequency at Electric Fields of 1.5,2.0,2.5, and 3.0 kV/mm
0.7,..------------------, ,---,-----,
0.6
0.5
'$..S 0.4e!enil 0.3>=
0.2
0.1
___ 1.5kV/mm
-,,- 2.0 kV/mm
-r- 2.5 kVlmm
-- 3.0kVlmm
504020 30Frequency (Hz)
10O+---..-..,-----r--,--.----,--.---,---.----1o
Figure 3.3.7b Yield Strain as Defmed by the Phase Criteria versus Frequency at Electric Fields of 1.5,2.0, 2.5, 3.0 kV/mm.
50

c 1.5 kV/mm
o 2.0 kV/mm
A. 2.5 kV/mm
.. 3.0 kV/mm
504020 30Frequency (Hz)
10
••...... • ...... .. .... ••• .. .. .. •A· .A.
AA+- +-
.AAA••• A ..
• Aj. A....... A .A. i
A AA • a to ••••• A.0 ..... ' ...
""0 • '!.'V' ...o 0A ...• .. 0 o. 4) 0
• II • 3IiIm III_ElIn II
1111I -. -, 11111- 111I11I.11I IIIlII •
I I I
50
oo
250
200
300
.-N<
..E 150z-(9
100
Figure 3.3.8 Magnitude of G versus Frequency at Electric Fields of 1.5, 2.0, 2.5, and 3.0 kV/mm
51

increase in G', while the dependence on frequency was less notable. Since the elastic
portion of the complex modulus dominated the behavior, an approximation based on the
relationship,
G' (jm) = kE 2 (3.3.1)
where k was a constant and E represents the applied field was adopted as seen in Figure
3.3.9. This squared dependence was also observed by Gamota and Filisko [25] and
Jordan et al. [9]. The dependence on frequency was less notable as was again seen in
Figure 3.3.8. Since G' dominated the behavior of IGUm I, this was not unexpected.
Vinogradov [17] and Jordan et al. [9] also observed constant G' with respect to
frequency.
The material utilized during the present study was found to be rather reliable,. as
IGUm) I was observed to be repeatable during three tests performed at different times.
IGUm)'1 was fo~nd to be 36.9 ± 6.4 kPa, 67.3 ± 9.0 kPa, 96.9 ± 14.2 kPa, and 137.5 ±
15.9 kPa for electric fields of 1.5, 2.0, 2.5, and 3.0 kV/mm respectively. These results
confirm that the material behavior did not change dramatically over the extended
experimental testing time period. The error was estimated to. be about 15%.
There were also other notable characteristics of the material which should be
reported. First, there was significant flocculation of the particles after an electric field
was applied and then removed. After removing the electric field it took time for the
material to return to it's original state. This cause of this delay could have been the
flocculation of the particles. The material's behavior was not completely reversible in
that it took longer for it to return to it's original state then it did to react to an electric
field. Second, the material was not able to hold a high electric field for a period of time
52

~,
at strains within the linear viscoelastic region. After yield was reached, high electric
fields were able to be maintained signifying the fracturing of some type of physical
conductive bridge between the electrodes. Third, the magnitude of the complex shear
moduluskept slightly increasing as the electric field was left on for long periods of time.
Thurston and Gaenter [41] also describe a slow response to the formation of final
microstructure.
,;7
53

\
3.531 1.5 2 2.5Electric Field (kV/mm)
0.5
200-r----------------------,
180
160
140
_120co~ 100-b
80
60
40
20
O+-""'-;O=-,--.----r--~___r-_.____r-__r_-_r____r_-....,.___r--l
o
Figure 3.3.9 Magnitude of G' versus Electric Field
54

CHAPTER 4: INVESTIGATION ON THE MODELING OF ER BASED
STRUCTURAL BEAMS
4.1 Introduction
None of the previous investigations has definitively concluded whether or not the
Ross, Kerwin, and Ungar (RKU) and Mead and Markus structural theories are applicable
to ER material based adaptive structures. There were three plausible explanations. One,
their rheology data was not accurate. Two, their experimental beams did not meet the
theoretical models specified geometric criteria. Three, the theories are not applicable.
The modeling phase of the present investigation tested the applicability of the
RKU and Mead and Markus theories to ER based beam structures. Theoretical structural
resonance and damping predictions were derived. The investigation then compared these
theoretical results to experimental data from actual ER beam structures.
4.2 Structural Theory
The purpose of this section is to familiarize the reader with the RKU and Mead
and Markus theories. It will be useful for the reader to know that both theories assume.
simply supported boundary conditions and sinusoidal mode shapes.
An energy method approach, described more thoroughly m Meirovitch's
Analytical Methods in Vibrations [49], provides a methodical and tractable method of
deriving the equations of motion and boundary conditions for systems with more than
one-degree of freedom. The equations of motion and boundary conditions for a simply
supported Bernoulli-Euler beam are derived as an example of this methodology.
55

4.2.1 Derivation of a Bernoulli-Euler Beam
The Lagrangian (L) is the basis for the energy approach. The variational equality
where BL is the variation of the Lagrangian, BT is variation of the kinetic energy, and BV
is the variation of the potential energy, is the governing equation for the derivation. This
equality is bCised on variational principles more adequately described in Meirovitch [49].
The Lagrangian for a Bernoulli-Euler beam is,~.
(a )2 (a2 )2'2 '2 1 L W '2 1 L Wf OLdt= f _f m(x)O - dxdt- f _f EIB -2 dxdtJ'l J, 2Jo at J, 2Jo at
(4.2.1.1)
(4.2.1.2)
where the first term represents the kinetic energy, and the second term represents the
potential energy caused by bending of the beam. The rotary inertia and shear
deformation are ignored. A schematic of the motion is shown in Figure 4.2.1.1.
The relationships,
and
!'B(aw)2 = aw(a(BW))2 at at ·at
56
(4.2.1.3)

l,W
Figure 4.2.1.1 Schematic of a Bernoulli-Euler Beam
57

(4.2.1.4)
can be substituted into the Lagrangian equation 4.2.1.2 yielding, /
(4.2.1.5)
Integrating by parts, equation 4.2.1.5 becomes,
(4.2.1.6)
The first term in equation 4.2.1.6 goes to 0 by definition of the variance; the change in w
from some initial time to some final time is O. By collecting terms on the expression we
find that
(4.2.1. 7)
58

Each of the terms in equation 4.2.1.7 is independent and must go to 0 independently. For
the first term in equation 4.2.1.7, 8w=d IS a trivial solution, hence, the term in parenthesis
must go to zero for a non-trivial solution,
(
j
(4.2.1.8)
Equation 4.2.1.8 represents the equation of motion for the beam. The last two terms in
equation 4.2.1.7 represent the boundary conditions,
EI a2
w 8(aW) L = 0ax 2 ax 0
~(EIa2
w)8WIL
= 0ax ax20
(4.2.1.9)
(4.2.1.10)
where equation 4.2.1.9 reyresents the moment and slope at 0 and L, and equation
4.2.1.10 represents the shear and deflection at 0 and L. The variational terms in
equations 4.2.1.9 and 4.2.1.10 represent the geometric constraints while the derivative
terms are the moment and shear constraints. For example in the simply supported case,
the slopes at locations 0 and L are arbitrary, therefore
a2 L
EI~ =0ax 2o
59
(4.2.1.11)

Since the displacement w at locations 0 and L is 0, the variation is also O. This a
geometric constraint. These four constraints make up the boundary conditions for the
problem.
Using separation of variables a solution to the problem is
w =w(x)T(t) (4.2.1.12)
Substituting equation 4.2.1.12 into the equation of motion equation 4.2.1.8, two
independent ordinary differential equations can be derived,
f(t) +m2T(t) = 0
a4w(x) ~ m(x) m2w(x) = 0ax4 EI
(4.2.1.13)
(4.2.1.14)
where m is the radial natural frequency of the structure. The solution to equation
4.2.1.14 is of the form,
w = Asin (Ax) +BCOS(Ax) +Csinh (Ax) +Dcosh(Ax)
where A. is the root of equation 4.2.1.14,
(4.2.1.15)
(4.2.1.16)
By substituting this into the boundary conditi<;ms, three of the coefficients in equation
4.2.1.15 can be eliminated for the simply supported case leaving,
60

and
w=Asin (Ax) (4.2.1.17)
A = me (4.2.1.18)L
where n is the mode number, and L is the length of the beam. From this the natural
freque~y of the structure can be solved,
CJ) = (A)' ~( EI )m(x)
61
(4.2.1.19)

4.2.2 Derivation of the Ross, Kerwin, Ungar (RKU) Model
The RKU theory is based on this classical Bernoulli-Euler beam. Their
modification of this theory centers around deriving a new, complex flexural rigidity.
Consider Figure 4.2.2.1. Assume that layers 1 and 3 experience a flexural motion
~ ,while' the middle layer assumes the same flexural motion plus a superimposed shear
strain 'Y. The total bending moment about the neutral plane can be expressed as,
a~ 3 3
M = B- = "" M .. +"" FHaax' flit I I
(4.2.2.1)
where B is the effective flexural rigidity, a~ is the slope of the flexural angle, Mii is the. axmoment of the ith layer about it's own neutral plane, Fi is the net extensional force on the
ith layer, and HiO is the distan~e from the mid plane of the ith layer to a new neutral plane
create~ by the addition layers 2 and 3. The old neutral plane, defined as the neutral plane
without any additional layers, is the mid plane of the first layer. Therefore,
(4.2.2.2)
where Hi! is the distance between the mid-plane of the ith layer and the mid-plane of
layer 1, and D is the displacement of the old neutral plane.
The moments about each layer can be expressed in terms of the curvature,
''QI.
(4.2.2.3)\'.
62
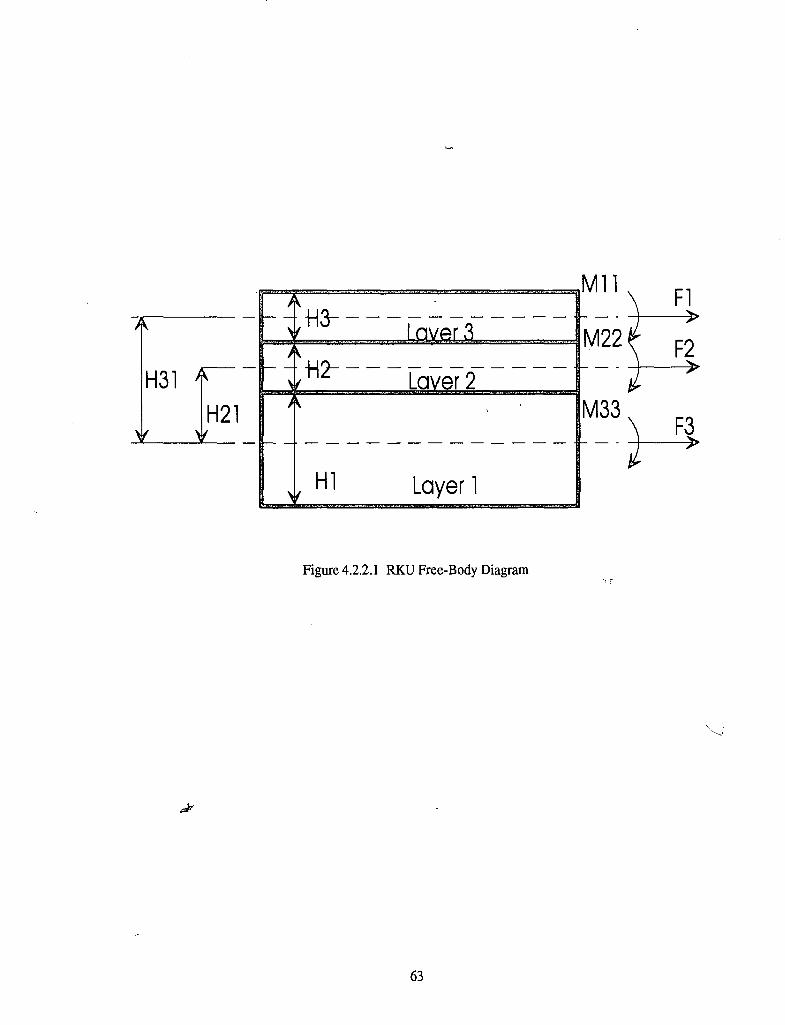
M22
Mll"""'"
r-!J'
-H3- - - - LillLe.LSr- -V
-
:-J
'-H2- - - - Laver2--,~
- - - r- -- - -- - -~- - --
Hl Layer 1"",I,~
H31
. 221 RKU Free-Body DiagramFigure 4.....~ -r
63

M =E I (a~ _ ay)22 2 2 ax ax (4.2.2.4)
(4.2.2.5)
where I is the moment of inertia per unit depth, E is the elastic modulus of each layer, ~
is the flexural angle, and 'Y is the shear strain.
The net extensional force can be assumed to be the extensional force exerted at
the mid plane of each layer. The force is the product of the extensional stiffness and the
strain of the mid-plane which can be derived by geometry. For small strains the force
can be expressed as,
F = E H (H a~ _H2 ar)2 2 2 20 ax 2 ax
(4.2.2.6)
(4.2.2.7)
(4.2.2.8)
The effective flexural rigidity can be solved using these relations. First assume
the following relation,
(4.2.2.9)
64
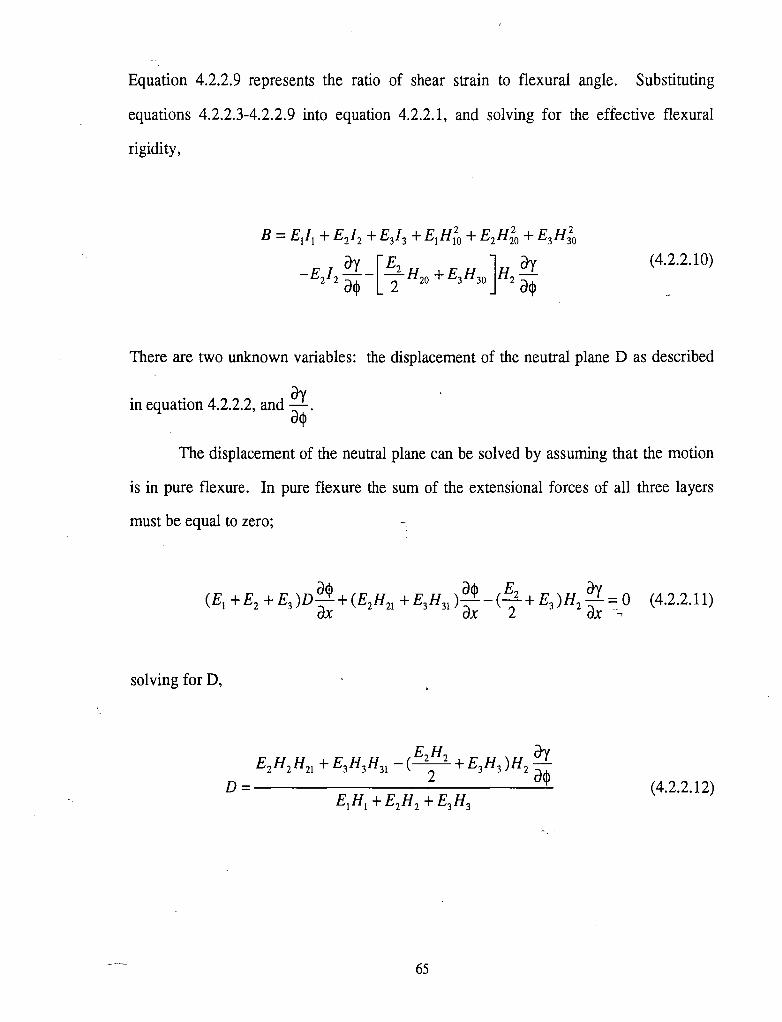
Equation 4.2.2.9 represents the ratio of shear strain to flexural angle. Substituting
equations 4.2.2.3-4.2.2.9 into equation 4.2.2.1, and solving for the -effective flexural
rigidity,
(4.2.2.10)
There are two unknown variables: the displacement of the neutral plane D as described
in equation 4.2.2.2, and d'y.a~
The displacement of the neutral plane can be solved by assuming that the motion
is in pure flexure. In pure flexure the sum of the extensional forces of all three layers
must be equal to zero;
solving for D,
(4.2.2.12)
65

The second variable we must solve for is ay. This is where the RKU theorya~
includes the shear modulus of the middle layer. The effective shear stress is eqltal to the
net force on the top and bottom layer. The shear force is assumed to be. small and
approximately corresponds to the net force on layer 3. The stress-strain relationship can
be expressed as,
t.,,·
(4.2.2.13)
where 02 is the shear modulus of the second layer. Substituting equation 4.2.2.8 into
equation 4.2.2.13,
(4.2.2.14)
If the all the layers experience the same flexure then the shear strain must be proportional
flexural angle. Since we assume simply supported boundary conditions the flexural
angle and the shear strain are both sinusoidal; therefore, the shear strain is proportionally
to it's second derivative,
(4.2.2.15)
where Ais the wave number. For the simply supported case, Ais n1tlL.
66
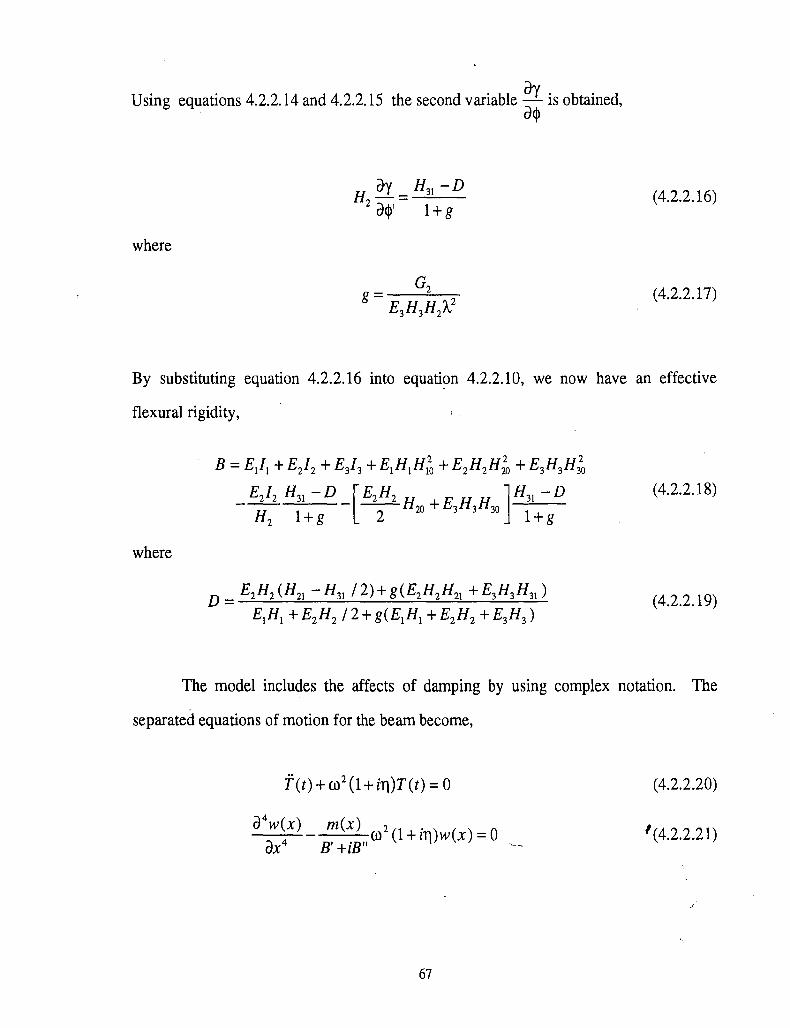
Using equations 4.2.2.14 and 4.2.2.15 the second variable ay is obtained,a~
where
(4.2.2.16)
(4.2.2.17)
By substituting equation 4.2.2.16 into equati~n 4.2.2.10, we now have an effective
flexural rigidity,
where
B = EJI + E2/2+ E3/3+ EIHIHl~ +E2H2H~ + E3H3H~
_ E2/2 H31 -D _[E2H2 H +E H H ]H31 -DH2 1+g 2 20 3 3 30 1+g
D = E2H2(H21 -H31 /2)+g(E2H2H21 +E3H3H31 )
E1H1+ E2H2 /2 + g(E1H1+ E2H2+ E3H3)
(4.2.2.18)
(4.2.2.19)
The model includes the affects of damping by using complex notation. The
separated equations of motion for the beam become,
f (t ) + (J)2 (1 + i11)T (t) =0
a4w(x) m(x) 2(1 .) () 0---- CO +111 w x =ax4 B' +iB" .~~
67
(4.2.2.20)
, (4.2.2.21)
where 11 is the effective structural damping, B' is the real part of the flexural rigidity, B"
is the imaginary part of the flexural rigidity. The flexural rigidity becomes complex due
to the incorporation of the damping in the second layer. This damping is represented by
the complex shear modulus,
G -G '+iG II2 - 2 2 (4.2.2.22)
If equation 4.2.2.21 is separated into it's real and imaginary parts the following equations
are obtained,
m(x) (02 (B' +11B")w(x) = 0EI' 2 +E/"2 (4.2.2.23)
m(x) (02 (TlB' -B")w(x) = 0EI' 2 +E/"2 'I
From equation 4.2.2.24 the effective structural damping 11 can be solved,
(4.2.2.24)
(4.2.2.25)
If we assume simply supported boundary conditions, the damped natural frequency of the
structure can be derived from equation 4.2.2.23,
B,2 +B"2
n1twhere A=-.
L
(0 = ,,}m(x)(B' +11B")
68
(4.2.2.26)

4.2.3 Derivation of the Mead and Markus Model
. The derivation of the Mead and Markus model is examined using the
methodology in Section 4.2.1; an energy approach. The kinetic energy of the beam is
considered only in the w direction as seen in Figure 4.2.3.1,
(4.2.3.1)
The potential energy of the beam is a summation of the energy stored due to bending,
energy stored due to elongation of the constraining layers, and the energy stored within
the shear layer. The deformation can be seen in the free body diagram in Figure 4.2.3.1.
The variation in potential energy can be represented by,
where the first term represents the contribution due to bending, the second and third term
represent the contribution due to elongation of the constraining layers, the fourth term
represents the contribution due to the shear layer, and the last term represents the
potential due to loading.. -
The shear within the middle layer is coupled to the elongation of the constraining
layers and the flexural angle due to bending geometrically. The shear 'strain of an
element is defined as
69

aw auy=-+ax az (4.2.3.3)
which can be seen geometrically in Figure 4.2.3.2. au in equation 4.2.3.3 can beazrepresented as a summation of the shear due to rotation and elongation,
au = Aura/a/ion + !1uelonga/ionaz H2 H2
This can be observed geometrically from Figure 4.2.3.1. From this geometry,
(4.2.3.4)
(4.2.3.5)
The shear strain can now be calculated from equations 4.2.3.3 and 4.2.3.5 to be related to
the elongation of the first and third layers, and the rotation of the entire beam,
(4.2.3.6)
where
The problem now has 3 degrees of freedom - w, ul' and u3• Substituting equation 4.2.3.6
bac~ into equation 4.2.3.2 the variation in the potential becomes,
70

l,W
3
2
x dx
+dx
Figure 4.2.3.1 Schematic of the Strain due to Elongation and Bending
z,w
IX,U
Figure 4.2.3.2 Strain in the Second Layer
71

where E1 = EJI +E212 + E3/ 3 • Using the same methods in Section 4.2.1 the equations
of motion are derived.
The first equation of motion represents the motion in the w direction,- .
(4.2.3.8)
where q(x,t) is a forcing function.
The second two equations of motion represent the elongational forces of the
second and third layers,
(4.2.3.9)
(4.2.3.10)
Notice there are no inertial terms in equations 4:2.3.9 and 4.2.3.10. By combining
equations 4.2.3.9 and 4.2.3.10 we see that the net longitudinal force on the first and third
layers is zero,
72
E A aUl = _ E A aU31 1 ax 3 3 ax
and similarly,
Substituting equation 4.2.3.12 back into equation 4.2.3.8,
where
G(1 1)g = H
2ElHl + E
3H
3
(4.2.3.11)
(4.2.3.12)
(4.2.3.13)
It would be desirable for the equation of motion to only be in terms of the
w-direction which means finding aU3 in terms of w or its derivatives. Equatio~ns 4.2.3.9ax
and 4.2.3.10 can be combined to solve for aU 3 •
ax
(4.2.3.14)
73

By differentiating equation 4.2.3.14, and solving equation 4.4.3.13 for aU3 and a2
u3 , aax ax 2
single equation of motion for forced vibratory motion in the w direction is derived,
This equation can be solved using separation of variables methodology per
equation 4.2.1.12. In addition, the model assumes a harmonic loading proportional to the
displacement and the mass per unit length,
q(X,t) = P1mV(x)e iOlf (4.2.3.16)
Substituting equations 4.2.3.12 and 4.2.3.16 into equation 4.2.3.15 we find that the
equation of motion can be written in a familiar, separable form,
(4.2.3.17)
(4.2.3.18)
The quantity g is a complex quantity by virtue of the complex shear modulus,
(4.2.3.19)
where ~ is the loss factor of the ER material and defined as,
74
Since this is the case, equation 4.2.3.18 can be separated into its real and imaginary parts
respectively,
_g' A(l +Y) a4W(X) 2(m(x»)( a2W(X) I ( A) ( ») - 0
p aX4 co EI 11 aX2 - g 11 + tJ W X -(4.2.3.21)
A solution for w must satisfy both of the real and imaginary equations of motion. For
equation 4.2.3.20 there are six possible solutions, but four of these solutions must also
satisfy equation 4.2.3.21. In that case a possible solution for w is of the form,
W = A sin (Ax) +Bcos(Ax) +C sinh (Ax) +Dcosh(Ax) (4.2.3.22)
There are only four possible solutions to the equation of motion but there are six
bovndary conditions. Those six boundary conditions are,
(4.2.3.23)
(4.2.3.24)
(4.2.3.25)
75
The only possible real solution is that
w =A sin (Ax)
nnwhere 'A=-.
L
(4.2.3.26)
The forced natural frequency and damping for the structure can now be
determined. By substituting equation 4.2.3.26 into equations 4.2.3.20 and 4.2.3.21 we
see that there are two unknowns, ffi and 11 ,and two equations. We find that,
(j):=':K EJ g2~2+'A4+2Kg+A?gY+g2+g2y
m /..4 + 2'A2g+ g2~2 + g2
and
(4.2.3.27)
(4.2.3.28)
These represent the natural frequency and the damping of the structure respectively.
76
..J'
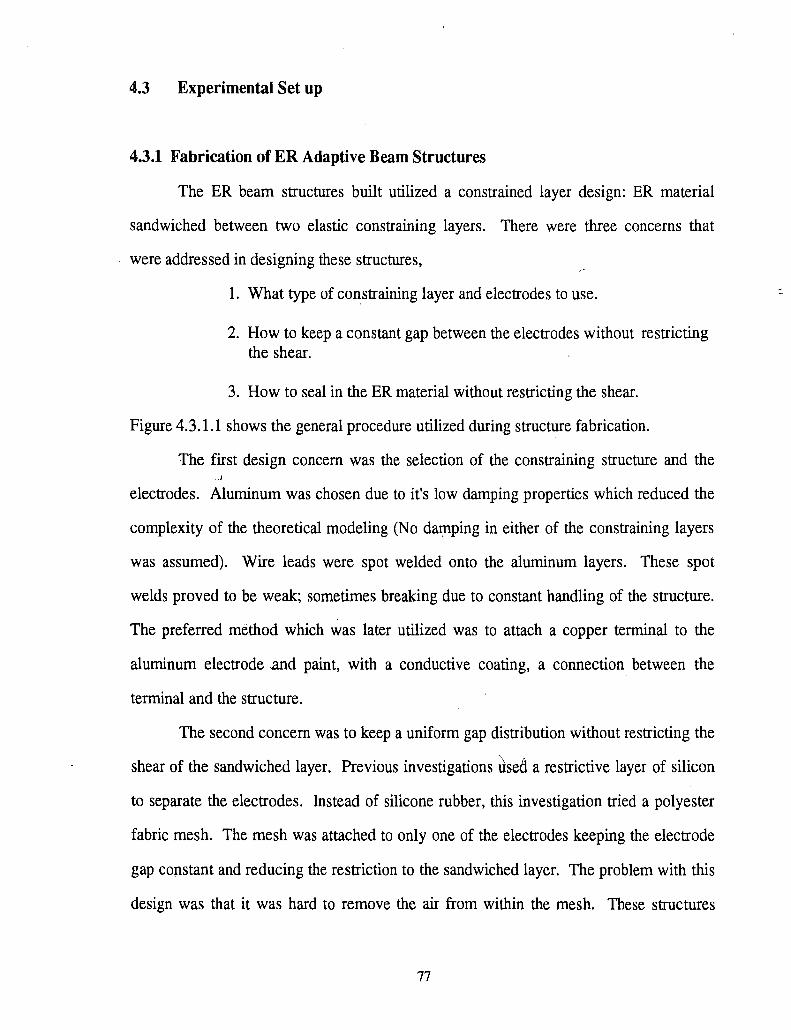
4.3 Experimental Set up
4.3.1 Fabrication of ER Adaptive Beam Structures
The ER beam structures built utilized a constrained layer design: ER material
sandwiched between two elastic constraining layers. There were three concerns that
were addressed in designing these structures,
1. What type of constraining layer and electrodes to use.
2. How to keep a constant gap between the electrodes without restrictingthe shear.
3. How to seal in the ER material without restricting the shear.
Figure 4.3.1.1 shows the general procedure utilized during structure fabrication.
The first design concern was the selection of the constraining structure and the
electrodes. Aluminum was chosen due to it's low damping properties which reduced the
complexity of the theoretical modeling (No datpping in either of the constraining layers
was assumed). Wire leads were spot welded onto the aluminum layers. These spot
welds proved to be weak; sometimes breaking due to constant handling of the structure.
The preferred method which was later lltilized was to attach a copper terminal to the
aluminum electrode .and paint, with a conductive coating, a connection between the
terminal and the structure.
The second concern was to keep a uniform gap distribution without restricting the
shear of the sandwiched layer. Previous investigations rl'Sed a restrictive layer of silicon
to separate the electrodes. Instead of silicone rubber, this investigation tried a polyester
fabric mesh. The mesh was attached to only one of the electrodes keeping the electrode
gap constant and reducing the restriction to the sandwiched layer. The problem with this
design was that it was hard to remove the air from within the mesh. These structures
77
--tended to arc at electric fields close to where air would begin to arc. The preferred
design utilized polycarbonate spacers. The spacers were 5mm x 5mm and attached only
to one of the constraining layers. The polycarbonate spacers kept a uniform gap while.
the reducing the restrictions placed on the middle layer and did not create electric
problems. The polycarbonate was also more elastic and had less damping than silicon
sealant.
The third design concern was to seal the ER material into the structure. The first
ER structures had silicone sealant around outside edges of the beams. These structures
were not responsive to changes in ER material behavior and their behavior deviated
significantly from theoretical models. The silicon impaired the shear strain within the
sandwiched layer reducing net effect of the ER phenomenon. The structural dynamic
models did not include the addition of the restraining silicone.
One purpose of this phase of the investigation was to fabricate structures that
were consistent with the geometric assumptions made in the theories. Coulter et al. [30,
35] attempted to minimize the use of silicone sealant by attaching a thin latex material
loosely around the edge of the structure. This investigation used the same concept. Two
different wraps were investigated, a plastic film and rubber latex. The plastic film was
found to be too conductive at higher electric fields. The tested structures had the loosely
wrapped latex seal.
The latex wrap, .5mm thick, was attached using two materials; a rubber based 3M
tape, and epoxy. ER material tended to-leak through the tape seal so a small amount of
acrylic sealant was used to completely seal the material in around the edges of the wrap.
The leakage was caused by degradation of the rubber based tape in the presence of ER
material. The additional sealant changed the structural stiffness. The use a epoxy not
affected by petroleum based products solved the problem. Finally, in both the tape and
78

epoxy sealed beams, a liquid sealant was put around the corners due to the gaps between
the latex wrap. Care was taken to avoid placing this final sealant onto the structure but to
adhere it only to the wrap, so as to reduce interference of the shear. It was noted that the
corners still leaked. A nitrile sheet was wrapped around both corners of the beam and the
leakage stopped. A summary of the different procedures and materials investigated in
fabrication of the ER material structure beams was shown in Table 4.3.1.1..
Once the beam was sealed a small hole at one end of the beam was made with a
hypodermic needle. Another hypodermic needle injected ER material into the structure.
SEALANT PERFORMANCE· }>} •••• .\.}
Latex Held high electric fields but was degraded whenexposed to ER material
Window insulation film Sealed well but the electrical properties were not sufficient ~ .to hold high electric fields
ADHESIVE "'b-ll'" \i} .i .}} ··...<i} .\(.... )
3M Tape (Rubber base Easy to handle but did effectively seal in the ER materialEpoxy (Seal-All) Sealed in ER material effectively
LlQUAOSEALANT PERFORMANCE··< ..... .....>() .. .....
Acrylic Caulking Sealed the best but was brittle and sometimes crackedRTV Silicon Gel Over an extended time ER material leaked throuQh
Table 4.3.1.1 Summary of materials to make ER sttuctures
79
The beams that were constructed for this investigation were classified S5, S8 and
S9. The dimensions, as shown in Figure 4.3.1.2, for the beams were the same.
SS - Aluminum beam electr2des and constraining layers. Separated by polycarbonate
spacers. Latex was used around the edges to seal the ER material in. 3M double sided
microscopy (#17840) tape was used attach the latex sealant. Acrylic caulking was used
near the edges. and the corners to complete the seal. Significant leaking over the entire
beam was observed.
S.H - Aluminum beam electrodes and constraining layers. Separated by polycarbonate
spacers (The spacing was doubled for this structure). Latex was used around the edges to
seal the ER material in. Epoxy was used to adhere the latex to the structure. Silicone
was used near the edges and the corners to. complete the seal. The seal around the edges
held, but leakage near the corners was observed.
S2 - Aluminum beam electrodes and constraining layers. Separated by polycarbonate
spacers. Latex was used around the edges to seal the ER material in. Epoxy was used to
adhere the latex to the structure. This structure used nitrile wraps at the ends of the beam
to prevent leakage. i'-
80

CompletedBeam
Figure 4.3.1.1 Basic Preparation of an ER Structure
I381.00mm
(;-(---------7) I
I I
~ ER Material
~~.79mm~==.79mm
t·79mm
Figure 4.3.1.2 Structures S5 and S8: Composite beams
81
4.3.2 .Instrumentation
The purpose of experimentation was to measure dynamic characteristics of ER
based beam structures at different electric fields. Specifically, the investigation
accomplished this by measuring the frequency response at various applied electric fields.
The actuating force on the beam was a swept sine wave. This excitation consisted
of a constant amplitude force with an incrementing frequency as shown in Figure 4.3.2.1.
For example, the input force first actuated the beam at some amplitude at 1 Hz, then
would increase the' frequency to 2 Hz, 3 Hz, 4 Hz, and so on while still keeping the
amplitude of this force constant. A proximity sensor measured the displacement at one
location on the beam. FFT (Fast Fourier Transform) algorithms analyzed this response.
A Bently Nevada 3040 HTB electromagnetic probe provided the actuating force.
A Bently Nevada 7200 Probe measured the vertical response, in terms of displacement,
of a point on the beam. The Onosokki Dynamic analyzer created the swept sine signal
which was fed to the actuating probe. The Onosokki analyzer, utilizing it's FFT
Hardware, analyzed the response of the displacement probe. A Bertan High Voltage
power supply applied the electric fields. The. experimental set up is shown in Figure
4.3.2.2.
82
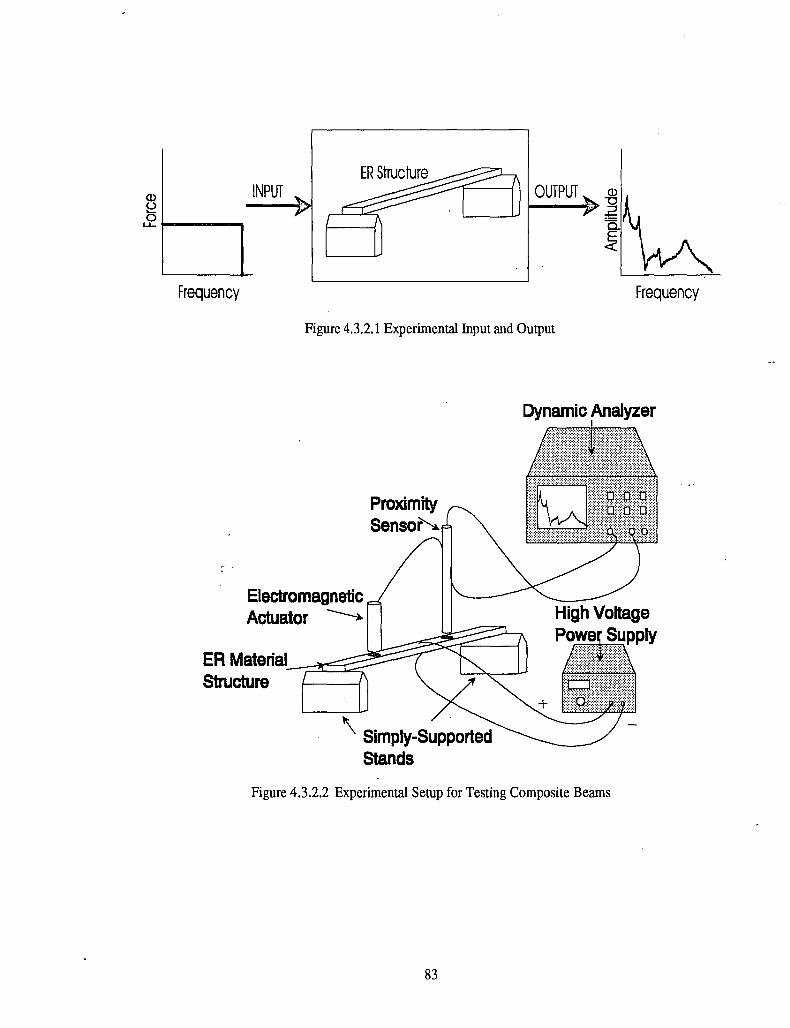
Q)
~
~t----..,
Frequency
INPUT
Frequency
Figure 4.3.2.1 Experimental Input and Output
Dynamic Analyzer
ElectromagneticActuator ~
ER Material-;:::.~~
Structure
\. Simply-Sup~ortedStands
Figure 4.3.2.2 Experimental Setup for Testing Composite Beams
83

4.3.3 .Experimental Procedure
Three beams were fabricated as described in Section 4.3.1. The beams were
tested with simply supported boundary conditions as shown in Figure 4.3.2.2. Swept
sine waves ranging from 0-250 Hz at 1.25 Hz increments were the forcing functions.
The resonant frequencies of the structures were found by determining the corresponding
frequencies of the peaks of the frequency response curves shown in Figure 4.4.1.
Damping\was measured using the 3dB power loss approximation. The approximation is
taken by determining the location of the frequencies corresoponding to a 3db reduction in
response in front of and behind the natural frequency,
(4.3.3.1)
where (0+ and 00_ are the frequencies corresoponding to the 3db losses, and (On is the
natural frequency. The experiment determined resonance and damping for electric fields
varied from 0-4.41 kV/mrn in .631 kV/mrn increments.
During testing flexural vibration was induced by sweeping the 0-250 Hz force
excitation range while the displacement at a single location was simaltaneously
measured. The electric field was increased in .631 kV/mrn intervals and the sweep
repeated until the field reached 4.41 kV/mm. Each structure was tested three times. In
between each of the tests, the beam was moved and stretched. The purpose for this was
to determine a range of deviation caused by the boundary conditions and remove any
possible agglomerations within the ER material layer.
84

4.4 Results and Discussion
The previous rheological investigation, discussed in Chapter 3, measured the
complex modulus of ER material number 6533-30B obtained from Lord Corporation at
various electric fieJds and frequencies. This structural investigation substituted these
rheological results into two models that predict the dynamic response of three-layer
composite structures - the RKU and Mead and Markus theories. A procedure described
in Section 4.3.3 examined the experimental frequency response of three structures: S5,
S8, and S9. The experimental and theoretical results were then compared.
The experimentally observed frequency responses, as seen in Figure 4.4.1,
display the dependence of the ER structural system on electric field. The peaks of the
curves represent the resonant frequencies. As electric field increased, the curves shifted
to the right while the amplitudes simultaneously reduced.
The experiment examined the frequency response of three different structures at
various electric fields. Figures 4.4.2-4.4.5 show the resonance relationship between
electric field for structures S5, S8, S9, and the theoretical predictions for modes 1
through 4. The experimental resonant frequencies obtained for structures S5 and S8
were similar. This was expected since the only difference between the two structures
was the adhesive used to attach the latex sealant. Structure S9, on the other hand, was
found to be different than the other structures. This was reasonable since the
construction of the structure was considerably different resulting in different dynamic
properties.
It was found that the theoretical models generally under predicted the observed
natural frequencies for modes 1 through-j and over predicted the results at the fourth
mode. The theoretical predictions were quantitatively in the area of the experimental
results, but the qualitative behavipr with respect to electric field was visibly different.
I 85
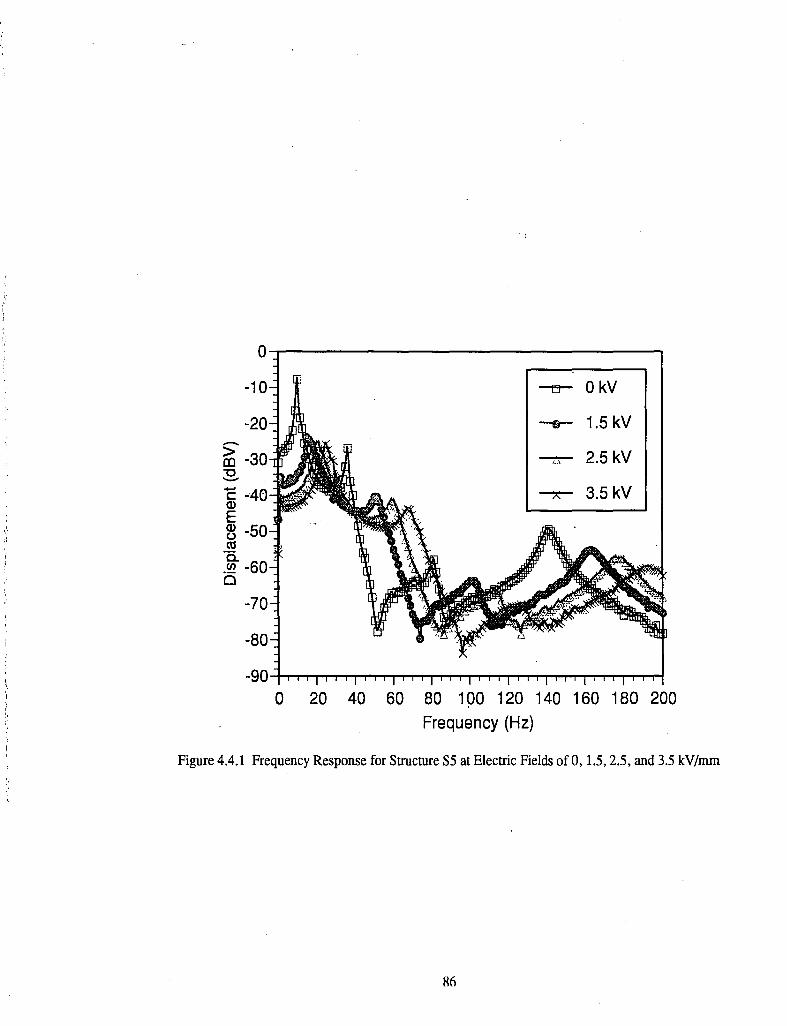
0..,....---------------------,
-r.::- 2.5 kV
3.5 kV
4j- 0 kV
--er- 1.5 kV
-70
-80
-90 -4-T..,..,..'T'"'I"'"",...,...,~..,..,..'T'"'I"'""I"'"'I""'T...,...,.....,._._.,....,..,I"'"'I""'T..,..,..'T'"'I"'"",...,...,I""T'""I""'T""'T"~
o 20 40 60 80 100 120 140 160 180 200
Frequency (Hz)
-10
-20
'E -40Q)
E~ -50Cd . ,a..~ -60o
>m -30"0........
Figure 4.4.1 Frequency Response for Structure S5 at Electric Fields of 0, 1.5,2.5, and 3.5 kV/mrn
86

35-r------------,
'N30J:-~25cQ)
5- 20~
LL. 15.....cro§ 10UJQ)
0::: 5
o....m~r"T"l"M........rTT'T"T'TTT,.,..,.,.,.,..,.,.T'T"I"'T"TTT"I.,..,..,.,."'I"'l"T"I
o 0.5 1 1.5 2 2.5 3 3.5 4 4.5Electric Field (kV/mm)
o S5
(;) S8
A S9
<> RKU (Theory)
M &M (Theory)
Figure 4.4.2 Resonance frequency depel1;dence on electric field for mode 1
80
'N70J:-~60
~I:J
C ,~ 50 Ii •C'"
~ 40LL.
~ 30cro§ 20UJ
~ 10
ED S5
o S8
A S9
<> RKU (Theory)
M & M (Theory)
o-m'TTT'T'TTT'T'TTT'TTTTT'T'TTT'T'TTTTTTT''T'TTT'rT'TT'TTTTm
o 0.5 1 1.5 2 2.5 3 3.5 4 4.5Electric Field (kV/mm)
Figure 4.4.3 Resonance frequency dependence on electric field for mode 2
87

;:.
):"f,
140
-N 120J:'-'
~100c0);:,
800-0)l.-
LL.600)
(,)cm 40c0tJ)0) 20c:::
A A
A mm 0
lZl "
[] 85
o 88
A 89
<) RKU (Theory)
M & M (Theory)
o-+n.,.,.,.,MTT1.,..,..,.,.,..,..,.,'TTT"!'TTT"!"""""'TTT"!'TTT"!'T"T'T"I''T'T'i
o 0.5 1 1.5 2 2.5 3 3.5 4 4.5Electric Field (kV/mm)
Figure 4.4.4 Resonance frequency dependence, on electric field for mode 3
4.5
250-,---------------,
-N;;, 200~ l-~-"'Iir_~,.-.._~r--r~c0)
5- 150 I~
LL.
~ 100cmcg 500)
c:::
04Tl""""rTTT'IrTTT'I'TTT',.,."..TTTrT'TTTTT'T'T'T"T'T"I'TTTT-m-Io 0.5 1 1.5 2 2.5 3 3.5 4
Electric Field (kV/mm)
m 85
" 88
A 89
v RKU (Theory)
M &M (Theory)
Figure 4.4.5 Resonance frequency dependence on electric field for mode
88

The experimental results showed a linear increase in resonance frequency of the structure
with respect to increases in the electric field. Thi~ was also seen in Coulter et al. [35].
The theoretical results displayed a more parabolic relationship.
The average damping of all three structures is shown in Figures 4.4.6-4.4.9 using
the 3dB approximation for linearly damped systems." Figures 4.4.6-4.4.9 show the
relationship between damping of the structures and electric field for the four different
modes. As was seen the damping of the structure was much less predictable than natural
frequency'. This was understandable since the damping of the experimental structures
was more sensitive to experimental deviations. This included the damping of the seal
technique and constraining layers. The frequency resolution of the experimentation was
1.25 Hz. The actual resonance was accurate, but the measurement of the frequencies
corresponding to a -3dB change were less predictable due to the resolution. Therefore,
the determination of experimental damping was generally less precise than the
determination of the resonant frequencies.
It is believed that most of the differences between theory and experiment were
associated with the fabrication of the experimental E~ structures. First, the beams were
overfilled with ER material. Overfilling the beam contributed to the deviation in the
predicted behavior due to the increase in mass and decrease in effective electric field.
The decrease in effective electric field was due to the increase in the spacing of the
sandwiched layer.
Second, after the structure sat for some extended time period the liquid matrix of
the ER material began to seep through the corners of the beam and in between the
adhesive layer attaching the latex material. From previous rheological investigations the
complex modulus was found to very dependent upon particle concentration. Losing the
liquid matrix was the same as increasing the particle concentration and thereby changing
89

I,I',\ ~ '.,;...
"III'
0.25 ...,.....---~----:l:'\--------,
0.2
L-aU 0.15
,.• C\1U.CIJ
~ 0.1-l
0.05
a--f-r-l-'I'T'TW\
a 0.5 1 1.5 2 2.5 3 3.5 4 4.5Electric Field (kV/mm)
--t:r 85
-0- 88
~ 89
-v- RKU (Theory)
~ M & M (Theory)
Figure 4.4.6 Structural Damping dependence on electric field for mode 1
0.18...,.....~t----------..
0.16
0.14
0 0.12t5C\1 0.1u.~ 0.08a-l0.06
0.04
0.02
04M-'TTI"IIll~~n"M"'f"t'l'1't!~~~ilt't'f'll~
a 0.5 1 1.5 2 2.5 3 3.5 4' 4.5Electric Field (kV/mm)
__ 85
-0- 88
-r- 89
-.- RKU (Theory)
~"'Et"'" M& M (Theory)
Figure 4.4.7 Structural Damping dependence on electric field for mode 2
90

0.12-r----------~
0.1
0 0.08t5roLL 0.06eneno
....J 0.04
0.02
o 'rp' rTTl'tilrrrr·'t!frt"'t'l'rf'ff-r-l"f'iiil'll"l"l"MffH
o 0.5 1 1.5 2 2.5 3 3.5 4· 4.5Electric Field (kV/mm)
-m- 85
~ 88
--s:- 89
-.- RKU (Theory)
~ M &M (Theory)
Figure 4.4.8 Structural Damping dependence on electric field for mode 3
0.09-r--------:m----m
0.08
0.07
0 0.06t5ro 0.05LL
~ 0.04o
....J 0.03
0.02
0.01"
o...:n,.~i"'l"'l"rf~WiTh·
o 0.5 1 1.5 2 2.5 3 3.5 4 4.5Electric Field (kV/mm)
---m- 85
--0- 88
-x- 89
-.- RKU (Theory)
~~. M & M (Theory)
Figure 4.4.9 Structural Damping dependence on electric field for mode 4
91

the rheological behavior of the ER material used in the beam. This meant the properties
measured in Chapter 3, substituted into the theoretical models, and the properties of the
actual materials used in the beams were different.
Lastly, though the experimental structures design attempted to reduce the effects
of the sealant on the dynamic behavior, its contribution was most likely included. This
was due to the relatively low bending stiffness. of the first~and third layers and the low
elastic shear modulus of the ER material compared to the material properties of the
sealant materials.
The fabrication and filling of struct).lI'e S9 reduced the overfilling and leaKage
problems. The amount of ER material placed in the structure was more closely
monitored than in structures S5 and- S8 to ensure an even distribution within the
sandwiched layer. In addition, a leak-proof structure was fabricated by attaching the
nitrile flaps on both ends of the beam. In the first test on structure S9, at electric fields
greater than 2 kVfrom, the structures began to arc. A conductive pathway developed and
more ER material was injected to destroy this path. This solved the arcing problem but
created an overfilling of the structure. The results of the first test on S9 were interesting
because they emphasize the effects of overfilling the structure.
These results before the arcing of structure S9 are shown in Figures 4.4.10
4.4.13. The theoretical models under predicted the results greater than in the previous
structures. What was interesting was that the resonance..:electric field relationship was
more "parabolic" than the theoretical predictions. This was contrary to results reported
earlier. By ensuring the uniformity of the ER layer, the theoretical predictions were
more qualitatively similar to experiments. Structure S9 showed that resonance-electric
field relationship was not linear but parabolic. The observed linear increase was related
to the overfilling and construction of the ER beams.
92

[]
35-r---------rn~' -----,
¥30.....,
~25cQ)
5-20~
~ 15(,)c~ 10 .oenQ) 5
0:::
o-mrTTT"rTTT'rTTT'rTTT'T'TTTT'TTTnTTTTT'T'TTT'TTTT'l"'T"T"M
o 0.5 1 1.5 2 2.5 3 3.5 4 4.5Frequency (Hz)
Cl 89
c RKU
6 M&M
Figure 4.4.10 Resonance Frequency Dependence on Electric Field for Structure S9, Mode 1
80
'N70 rnJ:....., II~60
Ellc~ 50 l!iICT ••> ,-~ 40
L1.
~ 30cm§ 20en~-10
o-mrTTT"r'TT"MrTTT'rTTT'l"T'T'T"l"T'T'T"nTTnTT'TTT'TTTT'l"'T"T"M
o 0.5 1 1.5 2 2.5 3 3.5 4 4.5Electric Field (kV/mm)
1!11 89
o RKU
L M&M
Figure 4.4.11 Resonance Frequency Dependence on Electric Field for Structure S9, Mode 2
93

rn89rn
IJ
0~ I
..; RKUc - -
~
••> o•
W....fj M & M
¥120-'-'"
~ 100 -1,,...-m---:---f!~~-r.;----tr'-1cQ)
5- 80~u.~ 60-c~ 40-oenQ) 200::
140-r--------------,
o .'I 1 I 'I I 'I 1 1
o 0.5 1 1.5 2 2.5 3 3.5 4 4.5Electric Field (kV/mm)
Figure 4.4.12 Resonance Frequency Dependence on Electric Field for Structure S9, Mode 3
250-r------------,......N
6200~c~ 150)C'"
~U.
~ 100-croc~ 50-Q)
0::
-
D 89
() RKU
L M&M
o 'I I I I 'I II 1
o 0.5 1 1.5 2 2.5 3 3.5 4 4.5Electric Field (kV/mm)
Figure 4.4.13 Resonance Frequency Dependence on Electric Field for Structure S9, Mode 4
94

CHAPTER 5: INVESTIGATION OF MODE SHAPE CONTROL USING AMULTI-ELECTRODE STRUCTURE
5.1 Introduction
The purpose of this phase of the study was to measure dynamic characteristics of
- an ER structure with multi-electrode panels. Specifically, the resonance characteristics
and the mode shapes were determined with resp.ect to each panel condition. By changing
the stiffness in different areas the change in resonance frequency has potentially more
variability. In addition, the modal shapes of the structure can be altered. The degree to
which a multi-electrode ER based structure could accomplish these goals was evaluated.
5.2 Experimental Set up
5.2.1 Fabrication of a Multi-electrode Panel
Johns Hopkins Applied Physics laboratory fabricated the multi-electrode structure
used in the experimentation. Copper film etched onto kapton, frequently used in building
circuit boards, acted as the electrodes and constraining layers. The investigation chose
etched kapton because it was easy to create multi-electrode panels. The structure had
four independent electrodes. Holes drilled through the kapton attached the 'Yire leads to
the electrodes. Latex wrap adhered to the edges of the structure and acrylic caulking
sealed the ER material in. The dimensions for the structure are shown @Figure 5.2.1.1.
5.2.2 Instrumentation
The actuating force on the beam was a swept sine wave. This excitation consisted
of a constant amplitude. force with an incrementing frequency. A reference proximity
sensor measured the displacement at a fixed location, while another proximity sensor
95

measured the displacement at various locations on the plate as shown in Figure 5.2.2.1.
.;FFT (Fast Fourier Transform) algorithms analyzed the responses.
A Bently Nevada 3040 HTB Probe provided the actuating force. Two Bently
Nevada 7200 Probes measured the displacements. An Onosokki Dynamic analyzer
created the swept sine signal which controlled the actuating probe. The Onosokki
analyzer, utilizing it's FFT Hardware, analyzed the response of the displacement probes.
The analysis produced phase differences between the tw-o probes. A Bertan High
Voltage power supply applied the electric fields
96

Ill( 228.60mm ) II
l04.77mm 11104.77mm I .25mmlI( ) ( ) ~
Copper
~ ER Material
Figure 5.2.1.1 Structure S3: Multi-electrode Panel Structure
97

Figure 5.2.2.1 Ex .penmental Setup for Plate Structure
98

5.2.3 Experimental Procedure
Resonance characteristics were, determined using the same procedure as in
Section 4. Mode shapes were determined by comparing the amplitude of vibration at a
given modal frequency at 16 different locations on the structure as shown in Figure
5.2.2.1. The procedure was to excite the ~~ucture with a swept sine force.
Simultaneously the displacement of 2 locations on the structure· were measured using 2
proximity sensors. One sensor was used as a reference point, while the other measured
the amplitude of displacement. By measuring the amplitude at which the system was in
resonance, the shape of that mode was determined at that specific point.
Though the amplitude of the shape at a specific point can be measured, the
direction each point is moving with respect to each other cannot - a reference must be
used. The displacement of a location on the structure was either moving in the same
direction as the reference or moving in the opposite direction from it. This was
determined by comparing the phase between the two sensors. If it was moving with the
reference then it was 0 degrees phase, while if it was moving against it was 180 degrees.
The amplitude and direction were determined at each of the 16 points by holding
the reference sensor in one position and moving the other proximity sensor to the 16
different locations. Since there were only 2 sensors, the swept sine input had to be
applied every time the sensor was moved. From this data the mode shapes were
determined.
This procedure was repeated for each of the following panel conditions as shown
in Figure 5.2.3.1.
99

•2.8kV/mm
Condition 1
Condition 4
Condition 2
Condition 5
Condition 3
Condition 6
Figure 5.2.3.1 Different Electric Field Conditions of the Multi-electrode Plate
100 .

5.3 Results and Discussion
The observed variability of resonance frequency caused by the variation of
stiffness in different areas of the structure is shown in Figure 5.3.1. The resonant
frequency is found as a function of the different panel conditions. The resonant
frequency clearly increased as the number of panels was turned on. For mode 11 the
resonant frequency changed from 10 to 30 Hz. Mode 22 changed from 20 to 50 Hz.
The variation in modal shape was not as dramatic. Figures 5.3.2a-f show the
relative magnitudes of displacement of the structure as it vibrates at the fIrst modal
frequency for the different panel conditions. There were not significant observable
changes in mode shape 11. Throughout -the experiment the structure maintained the
modal shape of panel condition 1. The modal shapes of the separate panel conditions are
presented in different scales, and should be only qualatatively compared. This was done
to observe the possible changes in modal shape.
The second modal frequency, mode 22, observed more variation in mode shape as
seen in Figures 5.3.3 a-f. Panel conditions 3 and 4, Figures 5.3.3c and 5.3.3d, observed
the greatest changes. These panels activated two electrode panels diagonally across from
each other, and next to each other, respectively. The relative displacement at the
locations near the activated panels were reduced significantly resulting in a visible
alteration of mode shape 2 without any panels activated.
The results of the experiment showed that the use of multi-paneled electrodes did
change the resonant frequency significantly. The change in mode shape was less·
conclusive. One reason for this was the experimental error in the methodology used in '
measuring the mode shapes. The instrumentation did not adequately measure the relative
displacements since the proximity sensor had to be moved during each of the tests.
101

Fabrication of the actual structure was another possible error. A larger, 2mrn, gap may
have caused decoupling of the two plates.
102

Modal Frequency vs. Panel Conditionst;:
60
~ 2.8kV/mm + Mode 2M 50ad +aI 40
Fre 30quen
20cy
Hz 10
0 EB Efj ~ [I ~ ~
Figure 5.3.1 Resonance Frequency for Panel Conditions 1through 6
103
[

MOde Shape 1
a) Panel Condition 1
b) Panel Condition 2
c) Panel Condition 3
Figure 5.3.2 a) Panei ~Olldition I b) Panel cOndition 2 c) Panel COndition 3
104
I
II
I
I
III
I
III
I
III
I
I
II
I
I
II
I
I
III
I
III
I
III
I
I
II
I
I
II
I
I
III
I
III
I
III
I
I
II
I
I
II

105
II
I
I
I
II
II
II
I
II
II
II
I
I
I
II
II
I
I
I
II
II
I
I
I
II
II
II
I
II
II
I
I
I
II
II
I
I
I
II
II
II
I
MOde Shape 1
d) Panel COndition 4
e) Panel Condition 5
f) Panel Condition 6

106 .
I
II
I
II
II
I
III
IIII
III
IIIII
III
III
II
I
II
I
II
I
II
II
I
III
IIII
IIII
IIII
III
III
I
MOde Shape 2
a) Panel Condition 1
b) Panel COndition 2
c) Panel Condition 3
Pigure 5.3.3 a) Faael condiUon I b) Faael condiUon 2 c) Panel condiUon 3

MOde Shape 2
d) Pan~1 Condition 4
e) Panel Condition 5",
f) Panel Condition 6
107
I
II
I
II
I
II
I
II
I
II
III
I
I
II
II
I
I
I
I
II
I
II
I
II
III
I
II
I
II
I
I
I
I
I
II
III
I
II
I
II
I
I
I
II
CHAPTER 6: CONCLUSIONS
6.1 Rheological Behavior of ER Materialsq
An investigation of the linear viscoelastic behavior of an ER material was
performed. It clearly appeared that the ER material behaved linear viscoelastically in the
stress-strain curves, but it was just as obvious that the behavior was not so clearly linear
in the phase-strain curves. The phase appeared to drastically change at strains below the
stress-strain yield definition especially at lower electric fields. An attempt was made to
qualify the trends in transition from linearity in terms of stress and phase yield strain with
respect to electric field and frequency. Increases in electric field resulting in increases in
yield strain were observed for both the stress and phase yield strain. Increases in
frequency resulted in decreases in the stress and phase yield strain. A quantifiable phase
shift within the linear region was not able to be done due to the insensitivity of the
instrumentation. Although it was concluded that since the phase was so close to 0
degrees, that G' dominated the behavior at electric fields of 1.5 kV/mm or more if the
excitation was to be considered in the linear regime. Within this linear regime the
instrumentation was accurate enough to measure the "real component" of the magnitude
of the complex modulus. It was observed that the quantitiy showed a squared
dependence with electric field. In addition, it was observed that the complex shear
modulus showed little dependence upon frequency. The repeatability of these results
over an expanded time frame showed that the material was behaving reliably.
Many of the previous investigations that were done measure G' and G" not taking
into account the non-linearity of the material at all. In addition, the definition of linear
behavior for many of the investigations was based on the deviation of sinusoidal stress as
a function of time. This definition did not take into account the phase criteria. At some
108

electric fields it appeared that material behaved extremely non-linear with respect to
phase. If either of these was the case, then the G' and Gil results were flawed.
The results of this investigation warrant a more accurate study of the linear
behavior of ER materials at small strains. The fqrther efforts of this continuing
investigation will focus on measuring the phase more accurately at smaller strains using
more sensitive instrumentation. The purpose of the continuing effort will be to define a
range of linear behavior for ER materials and examine the behavior in this range with
respect to electric field, frequency, and eventually temperature.
6.2 Modeling of ER based Structural Beams
Both RKU and the Mead and Markus models were valid theories in predicting the
resonance response of ER structures. The prediction of structural damping was not
accurate due to the inaccuracies in both determining rheological properties of the
materials, and the inherent experimental errors.
The accuracy of the models significantly depended upon the construction of the
experimental structures. The most dependent variables to the accuracy were found to be
the effects of the sealant, the accurate determination of material properties in both-
experiment and theory, and the uniformity of the sandwich layer. Previous investigations
showed linear resonant-electric field relationships but it has been shown that the
relationship was more parabolic as predicted by theory. The author attributes this to
fabricated structures that were more consistent with the theoretical assumptions.
From an applications standpoint the use of ER adaptive structures for vibrational
damping was not dependent upon the actual damping of ER materials, but rather the
ability for the structure to change stiffness. The most dramatic reduction in amplitude
observed in Figure 4.4.1 was the result of a change -in resonant frequency.
109
The resonant frequency was modeled using both the RKU and Mead and Markus
models. The models were able to predict the resonant frequencies. In those models it
was observed that the resonance depended very little on the damping effects of the ER
material as was seen in equations 4.2.26 and 4.2.3.27. Hence, for practical applications,
it may be necessary only to consider the effects of G' when the material has a loss factor
of less than 0.1. Control schemes could be developed based on this information.
6.3 Mode Shape ControlUsing Multi-electrode Panels
The' use' of a multi-electrode panel for vibration control was investigated in the
final phase of the study. It was found that the resonance of the plate structure was
significantly altered by varying the different panel conditions. The resonance increased
as the number of panels was turned on as seen in Figure 5.3.1.
The effect of moo~ shape based control using and multi-electrode ER based
structures was less conclusive. The first modal shape did not visibly change for the six
different panel conditions. The second modal shape did visibly change for panel
conditions 3 and 4. Panel conditions 3 and 4 had two activated electrodes; diagonally
across from each other, and next to each other respectively. The displacement of the
various locations on the activated panels was much less than the displacement on the
non-activated panels as shown in Figures 5.3.3c and 5.3.3d. This reduction in amplitude
of the activated panels caused the alteration of the modal shape.
The results of these experiments warrants further investigation into mode shape
based control using ER based adaptive structures. The procedure and instrumentation
used in measuring the mode shapes was not sensitive enough to accurately observe the
variations in modal shape caused by the activation of the different electrode panels. The
110

application shows promise to increase the roQustness of. ER based adaptive structure
applications in vibration damping.
6.4 Future Investigations
The results of this study show that ER based adaptive beam structures are
potentially applicable for semi-active vibration control. The results also show that
further investigation for the eventual physical realization of this application must be
accomplished apriori. The further investigation, as pointed out in the preceding sections,
are related to the understanding of the ER materials rheology, modeling and control, and
the effectiveness of multi-electrode structures
The development of a better rheological testing apparatus for ER materials must
be developed. The device must be able to increase the frequency range to at least 1000
Hz., arid provide a controlled temperature environment similar to many of the real world
applications. The sensitivity of a device specifically for measuring materials with small
phase angle must be improved. More investigations on the reliability, and material
behavior should be done to push this application from a pure R&D environment to
commercialization.
A control scheme for ER based adaptive structures needs to be developed. This
investigation has shown that two prior theories used in modeling the dynamic response of
3 layer c,?mposite structures are useful. The next step is to investigate possible sensors
used in the structure, and a control algorithm. The current research being done at Lehigh
involves the use of fiber optic embedded sensors and neural networks for control. Fiber
optic sensors are being used because of their ability to function in environments with
high electric fields unlike resistance based strain gages. Neural networks are being
111

utilized due to the non-linearities of the structural response and intrinsic robustness of the
methodology.
The first control algorithm for a single location-single frequency system has been
devised. The control scheme developed will minimize the vibration at one location on a
beam structure in simply supported boundary conditions for a single excitation
frequency. Figure 6.4.1 shows what the" electric field should be for optimal response in
the presence of a given forcing frequency between 0 to 250 Hz. The flat part of the
optimal electric field curve on Figure 6.3.1 is the limit of the power supply rather than
the actual optimal electric field. A neural network has been created to simulate these
results and the actual creation of a ER based adaptive structure is in progress.
The research intends to devise control algorithms for multiple location-single
frequency, and multiple location-multiple frequency systems. The complexity of these
algorithms is related to the dynamics of the ER based structures. If a single location
single frequency control scheme is incorporated it is possible that the response of other
locations and at other frequencies will dramatically increase. For example, if a strUCture
exhibits simply supported mode 1 behavior and the amplitude at the midpoint is/'
minimized by pushing the frequency response to simply supported mode 2, then the
quarter point locations will dramatically increase. The structure has minimized the
midpoint while maximized the quarter points. Another example is that if the response at
one frequency is minimized by shifting the frequency response to the right via an electric
field, the response at other frequencies could be enhanced. This is more clearly observed
in Figure 4.4.1.
The investigation also intends to devise algorithms for the application of multi
electrode ER based structures. The use of mult-electrode structures in increasing the
112
-,

50 100 150 200 250 300Frequency (Hz)
5---------------,.........E 4.5E:> 4~
:;;'3.5.~ 3u..
, .~ 2.5L.....~ 2w 1.5coE 1.....8- 0.5
O-+--,-"""""-,---.---.---.---.-""'""r-'I-r--f---r-""""",
o
Figures 6.4.1 Optimal Electric Field to Minimize Vibration at One Location on a Structure
113

robustness of semi-active vibration control has been proven in the present study. There
needs to be more investigation into the applicability of these structures; specifically,i
research in the use of different electrode configurations and geometrys and how they
affect the frequency response and modal shapes. A experimental system that is more
sensitive in measuring mode shapes needs to be developed. Control schemes for multi
electrode structures will follow after a more thorough feasibility analysis.
ER based adaptive structures have been shown to be an potential solution to many
vibration problems. Significant research has been done in the present studyrelated to the
rheology, modeling and control, and feasibility. From this investigation the directions of
further efforts to create real structures have been clearly defined.
114
BmLIOGRAPHY
1. Block, H. and J.P. Kelly, Electro-rheology. 1 Phys. D: Appl. Phys., 1988. 21: p.1661-1677.
2. Gast, A.P. and C.P. Zukoski, Electrorheological Fluids as Colloidal Suspensions.Advances in Colloid and Interfac~ Science, 1989.30: p. 153-202.
3. Jordan, T.C. and M.T. Shaw, Electrorheology. IEEE Transactions on ElectricalInsulation, 1989.24(5): p. 849-878.
4. Weiss, K.D., J.P. Coulter, and lD. Carlson. Electrorheological Materials andTheir Usage in Intelligent Material Systems and Structures, Part I: Mechanisms,Formulations and Properties. in Recent Advances in Adaptive and Sensory Materials andTheir Applications. 1992. Blacksburg, Virginia: Technomic Publishing Co., Inc.
5. Winslow, W.M., Induced Fibration of Suspensions. Journal of Applied Physics,1949.20(12):p.1137-1140.
6. Klingenberg, DJ. and C.F.Z. IV, Studies on the Steady-Shear Behavior ofElectrorheological Suspensions. 1990. : p. 15-24.
7. Hill, J.c. and T.H. Van Steenkiste, Response Times ofElectrorheological Fluids.Journal of Applied' Physics, 1991. 70(3).
8. Stangroom, J.E., Electrorheological Fluids. physics Technology, 1983. 14: p.290-296.
9. Jordan, T.C., Shaw, M.T., McLeish, T.C.B., Viscoelastic Response ofElectrorheological fluids. II. Field Strength and Strain Dependence. Journal ofRheology, 1992.36(3): p. 441-463.
10. Tao, R. and J.M. Sun, Three-Dimensional Structure of InducedElectrorheological Solid. Physical Review Letters, 1991. 67(3): p. 398-401.
11. Halsey, - T.C., The Structure and Dynamics of ElectrorheQLQgical Fluids.Proceeding of the Conference on ER Fluids, 1991. : p. 37-52.
12. Klass, D.L. and T.W. Martinek, Electroviscous Fluids. II. Electrical Properties.Journal of Applied Physics, 1967.38(1): p. 75-80.
115

13. Klass, D.L. and T.W. Martinek, ElectroviscouSFluids. I. Rheological Properties.Journal of Applied Physics, 1966.38(1): p. 67-74.
14. Wong, W. and M.T. Shaw. The Role of Water in Electrorheological Fluids. inElectrorheological Fluids. 1989. Raleigh, North Carolina: Technornic PublishingCompany, Inc.
15. Block, H., et at., Materials and Mechanisms in Electrorheology. Langmuir, 1990.6(1): p. 6-14.
16. Filisko, F.E., Rheological Properties and Models of Dry ER Materials.Proceedings of the International Conference on Electrorheological Fluids, 1991. :p. 116128.
17. Vinogradov, G.V., et ai., Viscoelastic Behavior of ElectrorheologicalSuspensions. Inzhenerno-Fizicheskii Zhurnal, 1986.50(4): p. 605-609.
18. Shulman, Z.P.,E.V. Korobko, and Y. Yangovskii, The Mechinism of theViscoelastic Behaviour of ER Suspensions. Journal of Non-Newtonian Fluid Mechanics,1989. 33: p. 181-196.
19. Block, H., Rattray, P., Watson, T., Semi-Conducting Polymers as ER FluidSubstrates. Proceedings of the International Conference on Electrorheological Fluids,1991. : p. 93-115.
20. Hartsock, D.L., R.f. Novak, and GJ. Chaundy, ER fluid requirements forautomotive devices: The Journal of Rheology, 1991. 35(7): p. 1305-1326.
21. Lingard, S. and W.A. Bullough. Tribological Aspects of Electro-RheologicalFluid Behaviour with Respect to Non-Polar Base Liquids. in Electrorheolagical Fluids.1989. Raleigh, North Carolina: Technomic Publishing Company, Inc.
22. Duclos, T.G., Design of Devices Using Electrorheological Fluids. 1988, Societyof Automotive Engineers:
23. Yen, W.S. and PJ. Achorn, A Study of the Dynamic Behavior of anElectrorheological Fluid. Journal of Rheology, 1991. 35(7): p. 1375-1384.
24. Coulter, J.P., Duclos, T.G., Acker, D.N., Electrorheological Materials inStructural Damping Applications. Accepted for publication Journal of Sound andVibration, .
116
25. Gamota, D.R. and F.E. Filisko, Dynamic mechanical studies of electrorheologicalmaterials: Moderatefrequencies. Journal of Rheology, 1991. 35(3): p. 399-425. ?
26. Gamota, D.R. and F.E. Filisko, High Frequency Dynamic Mechanical Study olanAluminosilicate Electr.orheological Material. Journal of Rheology, 1991. 35(7): p. 14111425.
27. Coulter, J.P., K.D. Weiss, and J.D. Carlson. Electrorheological Materials andTheir Usage in Intelligent Material Systems and Structures, Part II: Applications. inRecent Advances in Adaptive and Sensory Materials and Their Applications. 1992.Blacksburg, Virginia: Technomic Publishing Co., Inc. ~
28. Rogers, C.A. Workshop Summary. in U.S. Army Research Office Workshop onSmart Materials, Structures, and Mathe!!Zatical Issues. 1989. Virginia PolytechnicInstitute and State University: Technomic.
29. Carlson, J.D., J.P. Coulter, and T.G. Dudos, Electrorheological Fluid CompositeStructures, in U.S. Patent #4,923,057. 1990.
30. Coulter, J.P. and T.G. Duclos. Applications of Electrorheological Materials inVibration Control. in Electrorheological Fluids. 1989. Raleigh, North Carolina:Technomic Publishing Company, Inc.
31. Gandhi, M.V., B.S. Thompson, and S.B. Choi, A New Generation of InnovativeUltra-Advanced Intelligent Composite Materials Featuring Electro-Rheological Fluids:An Experimental Investigation. Journal of Composite Materials, 1988. 23-December,1989: p. 1232-1255.
32. Gandhi, M.V. and B.S. Thompson, A New Generation of Revolutionary UltraAdvanced Intelligent Composite Materials Featuring Electro-Rheological Fluids, inSmart Materials, Structures, and Mathematical Issues, c.A. Rogers, Editor. 1989,Technomic Publishing Co., Inc.: Lancaster, Pennsylvania. p. 63-68.
33. Gandhi, M.V. and B.S. Thompson. Dynamically-Tunable Smart CompositesFeaturing Electro-Rheological Fluids. in Fiber Optic Smart Structures and Skins II.1989. Boston, MA: SPIE-The International Society for Optical Engineering.
34. Choi, S.B., M.V. Gandhi, and B.S. Thompson. An active vibration tuningmethodology for smart flexible structures incorporating electro-rheological fluids: Aproof-of-concept investigation. 1989.
117

35. Coulter, J.P., T.G. Duclos, and D.N. Acker. The Usage of ElectrorheologicalMaterials in Viscoelastic Layer Damping Applications. in Damping 89. 1989. PalmBeach, Florida:
36. Cho~, Y., A.F. Sprecher, and H. Conrad, Response of ER Fluid-Filled LaminateComposites to Forced Vibration. ·Journal of Intelligent Material Systems and Structures,1992.3: p. 17-29.
37. Choi, S.B., Thompson, B.S., ~andhi, M.V., Vibration Tuning of SmartCantilevered Beams Featuring Elecrto-Rheological Fluids. 1992 Submitted forpublication..
38. Choi, S.B., B.S. Thompson, and M.V. Gandhi. An Experimental Investigation onthe Active-Damping Characteristics of a Class of Ultra-Advanced Intelligent CompositeMaterials featuring Electro-Rheological Flui.!Js. in Damping 89. 1989. Palm Beach,Florida:
39. Gandhi, M.V., B.S. Thompson, and S.B. Choi, A Proof-of-Concept ExperimentalInvestigation of a Slider-Crank Mechanism Featuring a Smart Dynamic«(ly TunableConnecting Rod Incorporating Embedded Electro-Rheological Fluid Domains. Journalof Sound and Vibration, 1989.135(3): p. 511-515.
40. Spurk, IH., Huang, Z., Electrorheological Material Under Oscillatory Shear.Recent Advances in Adaptive and Sensory Materials and their Applications, 1992. : p.593-604.
41. Thurston, G.B. and E.B. Gaertner, Viscoelasticity of Electrorheological FluidsDuring Oscillatory Flow in a Rectangular Channel. Journal of Rheology, 1991. 35(7): p.1327-1343.
42. Shulman, Z.P. Viscoelastic Behaviour of Electrorheological Fluids. inElectrorheological Fluids. 1989. Raleigh, North Carolina: Technomic PublishingCompany, Inc.
43. Brooks, D., et al., Visco-elastic Studies on an Electro-Rheological Fluid. Colloidsand Surfaces, 1986.18: p. 293-312.
44. Ross, D., E.E. Ungar, and E.M. Kerwin, Damping ofPlate Flexural Vibrationsby means ofViscoelastic Laminate. Structural Damping, 1959. ASME: p. 49-88.
45. Nashif, A.D., D.I. Jones, and J.P. Henderson, Vibrational Damping. 1985, JohnWiley & Sons.
118

46. Mead, DJ. and S. Markus, The Forced Vibration ofa Three-Layer,Damped Sandwhich Beam with ~rbitrary Boundary Conditions. Journal of Sound andVibration, 1969.10(2): p. 163-175.
47. Mahjoob, M.l, H.R. Martin, and F. Ismail. Distributed Vibrational ControlUsing Electrorheological Fluids. in International Modal Analysis Conference. 1993.Florida:
48. Chrzan, MJ., Coulter, J.P., A Numerical Investigation of ElectrorheologicalMaterial Behavior. Proceedings of the International Conference on Electrorheological
. Fluids, 1991.: p. 175-194.
49. Meirovitch, L., Analytic Methods in Vibrations. Macrnillian, New York, 1967.
50. Coulter, J.P., K.D. Weiss, and lD. Carlson, Engineering Applications ofElectrorheological Materials. Journal oflntelligentMaterial Systems and Structures,1993.4: p. 248-259.
119

VITA
David L. Don was born August 2, 1968 in Pasadena, California to parents of Dr.
Sherman Don and Gloria Chang. After graduating from Atholton High School in June
1986, the author began his undergraduate studies at the University oCMary1and at
College Park, Maryland. The author completed his undergraduate studies at Lehigh
University in Bethlehem, Pennsylvania with a Bachelor of Science degree in Mechanical
Engineering. He continued his studies as a National Science Foundation funded research
assistant at Lehigh University under the direction ot Dr. John P. Coulter. In June 1993,
the author received has Master's of Science degree in Mechanical Engineering.
Presently, the author plans to gain practical engineering experience in industry and
eventually continue his studies towards a Doctor of Philosophy degree in Mechanical
Engineering.
120

Related Documents