5 Department of Conservation Technical Series 28A An introduction to using mark-recapture analysis for monitoring threatened species Marieke Lettink 1 and Doug P. Armstrong 2 1 Science & research Unit, Department of Conservation, Private Bag, Christchurch, New Zealand 2 Wildlife Ecology Group, Massey University, Private Bag 11222, Palmerston North, New Zealand ABSTRACT Accurate and reliable monitoring is necessary for effective management of threatened species in New Zealand. Mark-recapture studies are a powerful tool for conservation managers, and can be used in any situation where animals can be marked (or otherwise identified) and detected later by capture or sighting. In addition to estimating population size and survival rates, mark-recapture methods can be used to evaluate impacts of threats on survival, record population trends, collect information for population viability analyses, set performance targets against which responses to management can be measured, and highlight areas where further research is necessary. This report has three main sections. The first section introduces the basic principles of mark- recapture methodology that conservation managers need to understand to design effective mark-recapture studies. In the second section, specific guidelines for estimating abundance, survival and population growth rates are provided. We show which methods are appropriate for different situations, how field studies should be designed to avoid violating assumptions of mark- recapture methods, and how to get started on analysing the data. In the final section, we review a case study involving long-tailed bats (Chalinolobus tuberculatus ), and use this to illustrate some problems that may be encountered in mark-recapture studies. Keywords: abundance, Chalinolobus , closed-population models, long-tailed bat, mark-recapture, open-population models, population monitoring, robust design, survival. ' October 2003, Department of Conservation. This paper may be cited as: Lettink, M.; Armstrong, D.P. 2003: An introduction to using mark-recapture analysis for monitoring threatened species. Department of Conservation Technical Series 28A: 532. or in full as: Lettink, M.; Armstrong, D.P. 2003: An introduction to using mark-recapture analysis for monitoring threatened species. Pp. 532 in: Department of Conservation 2003: Using mark-recapture analysis for monitoring threatened species: introduction and case study. Department of Conservation Technical Series 28, 63 p.

Welcome message from author
This document is posted to help you gain knowledge. Please leave a comment to let me know what you think about it! Share it to your friends and learn new things together.
Transcript
5Department of Conservation Technical Series 28A
An introduction to usingmark-recapture analysis formonitoring threatened species
Marieke Lettink1 and Doug P. Armstrong2
1 Science & research Unit, Department of Conservation, Private Bag,
Christchurch, New Zealand
2 Wildlife Ecology Group, Massey University, Private Bag 11222, Palmerston
North, New Zealand
A B S T R A C T
Accurate and reliable monitoring is necessary for effective management of
threatened species in New Zealand. Mark-recapture studies are a powerful tool
for conservation managers, and can be used in any situation where animals can
be marked (or otherwise identified) and detected later by capture or sighting. In
addition to estimating population size and survival rates, mark-recapture
methods can be used to evaluate impacts of threats on survival, record
population trends, collect information for population viability analyses, set
performance targets against which responses to management can be measured,
and highlight areas where further research is necessary. This report has three
main sections. The first section introduces the basic principles of mark-
recapture methodology that conservation managers need to understand to
design effective mark-recapture studies. In the second section, specific
guidelines for estimating abundance, survival and population growth rates are
provided. We show which methods are appropriate for different situations,
how field studies should be designed to avoid violating assumptions of mark-
recapture methods, and how to get started on analysing the data. In the final
section, we review a case study involving long-tailed bats (Chalinolobus
tuberculatus), and use this to illustrate some problems that may be
encountered in mark-recapture studies.
Keywords: abundance, Chalinolobus, closed-population models, long-tailed
bat, mark-recapture, open-population models, population monitoring, robust
design, survival.
© October 2003, Department of Conservation. This paper may be cited as:
Lettink, M.; Armstrong, D.P. 2003: An introduction to using mark-recapture analysis for monitoring
threatened species. Department of Conservation Technical Series 28A: 5�32.
or in full as:
Lettink, M.; Armstrong, D.P. 2003: An introduction to using mark-recapture analysis for monitoring
threatened species. Pp. 5�32 in: Department of Conservation 2003: Using mark-recapture
analysis for monitoring threatened species: introduction and case study. Department of
Conservation Technical Series 28, 63 p.

6 Lettink & Armstrong�An introduction to using mark-recapture analysis
1. Introduction
1 . 1 U S E S O F M A R K - R E C A P T U R E M E T H O D S
Conservation managers are routinely asked to provide information about the
status of threatened populations1 or species. The most commonly asked
questions include: �how many animals are there in this population?�, and �is the
population decreasing, stable, or increasing?� The answers to these questions
will govern the management regime chosen for the population or species in
question.
The mark-recapture method is a powerful method for estimating abundance as
long as the underlying assumptions are met (Thompson et al. 1998). Mark-
recapture analysis can also be used to estimate other population parameters
such as survival, recruitment, and population growth rate. A well-designed
study will allow the user to assess the importance of various factors that might
affect these parameters, including characteristics of individuals such as age or
sex, changes over time such as seasonal effects, and impacts of management
actions such as predator control. Once this understanding is achieved,
parameter estimates can be combined into a population model that can be
used to assess the viability of the population over time, evaluate the relative
impacts of different threats, and predict how the population will respond to
different management strategies.
This report introduces the general design and analysis procedures that
constitute a mark-recapture analysis, and demonstrates its application using a
case study of long-tailed bats (Chalinolobus tuberculatus) in South Canterbury.
The recent development of easy-to-use software allows mark-recapture studies
to be performed on a greater range of species than formerly possible. The aim of
this report, therefore, is to encourage the use of mark-recapture methods
among conservation managers and within threatened species programs.
1 . 2 E X A M P L E S O F M A R K - R E C A P T U R E S T U D I E S
I N N E W Z E A L A N D
Mark-recapture and/or mark-resight studies have become more prevalent in
New Zealand with the development of easy-to-use software, particularly
program MARK2 (Box 1). The studies described here were conducted to
evaluate the impacts of pest control operations, assess the fate of island
reintroductions, investigate dispersal patterns, estimate abundance in
comparison with other techniques, re-analyse historical data, and obtain
population parameters for a little-known species.
Mark-recapture analysis was used by Armstrong & Ewen (2001), Armstrong et
al. (2002) and Davidson & Armstrong (2002) to estimate the impacts of aerial
poison operations on the survival of non-target species (New Zealand robins
1 Many of the terms used in this report are defined in the glossary of terms, Appendix 1, p. 30.
2 Computer program names in this report are in given in capitals, commands in small caps.

7Department of Conservation Technical Series 28A
Box 1. Program MARKProgram MARK is the state-of-the art software for analysing mark-recapturedata, and largely supersedes a range of previously used programs. MARK wasdeveloped by Gary White at Colorado State University, but incorporatessoftware and theory developed by many people. As advances are made inmark-recapture methods, they are added to MARK. You can see shortdescriptions and links to 14 different programs at Evan Cooch�s website:http://www.phidot.org/software/The other programs still have some uses, especially to people familiar withthem; however, most people will have no need to use anything other thanMARK, and it is definitely the best place to start.
MARK provides a unified approach for analysing several different types ofmark-recapture data, and allows models to be created and run using aWINDOWS interface. MARK is much easier to use than previous programs,making mark-recapture analysis accessible to a wide range of people.MARK can be downloaded free-of-charge from the MARK website:http://www.cnr.colostate.edu/~gwhite/mark/mark.htm
The program should run on any IBM-compatible computer with WINDOWS95 or higher, a Pentium processor, and at least 64 mB RAM. However, if youhave a faster computer with more memory, MARK will run better and be lesslikely to crash.
There is extensive support available for learning MARK. The standardreference is White & Burnham (1999), and a draft version of this publicationis available on the MARK website. Evan Cooch and Gary White have writtena guidebook called �Using MARK�a gentle introduction�, and this can alsobe downloaded from the MARK website. Pryde (2003: this volume) providesa working example for a threatened New Zealand species, the long-tailedbat (Chalinolobus tuberculatus). There is an interactive website devoted toquestions and answers about MARK:http://canuck.dnr.cornell.edu/HyperNews/get/marked/marked.html
Finally, MARK workshops are held periodically all over the world.
While we have stressed how easy and accessible MARK is compared withprevious mark-recapture software, it is by no means trivial to use. It is acomplex program, can be frustrating to use, and has a deceptively longlearning curve. If you are planning to use MARK, seek expert help toavoid making mistakes.
Petroica australis, stitchbirds Notiomystis cincta, and saddlebacks
Philesturnus carunculatus). Birds were individually marked by fitting colour
bands while in the nest, and subsequent �recaptures� done by sighting the birds
in a series of surveys rather than capturing them. By combining mark-recapture
analysis with simulation modelling, the authors were able to estimate the
amount of mortality attributable to the poison drops and predict the long-term
impact of this mortality on population growth. For instance, Davidson &
Armstrong (2002) estimated that about 45% of the saddlebacks died following a
poison drop on Mokoia Island, setting population growth back by one to two
years but having no long-term impact on the population. The authors note that
this methodology is much more effective for estimating mortality than other
techniques such as body counts or 5-minute bird counts, and for many species is
more effective than radio-tracking.

8 Lettink & Armstrong�An introduction to using mark-recapture analysis
The viability of four populations of New Zealand forest birds re-introduced to
predator-free islands was examined by Armstrong et al. (2002) in order to decide
what, if any, management was needed to maintain them. Details of the approach
used were given by Armstrong & Ewen (2001) and Armstrong & Perrott (2000). In
all cases birds were individually marked by colour banding in the nest, and
�recaptured� by sighting them in surveys. Mark-recapture analysis was used to
estimate abundance and model factors affecting mortality rates. This information
was then incorporated into simulation models used to estimate population
viability. While the Tiritiri Matangi Island robin and Mokoia Island saddleback
populations appeared to be viable without management, the stitchbird
populations required on-going management to persist. Stitchbirds on Tiritiri
Matangi appeared to be viable so long as management continued (supplementary
food and nest mite control). In contrast, the Mokoia population was predicted to
have tenuous viability even with management, leading to a decision to remove
the birds after 8 years and translocate them to another island.
Efford (1998) conducted an age-structured mark-recapture analysis to
investigate patterns of dispersal of brushtail possums (Trichosurus vulpecula)
in the Orongorongo Valley, near Wellington. The majority of immigrants were
males, with three in four breeding males and one in five breeding females
leaving their natal areas. The motivations driving immigration remain to be
determined, but did not appear to be related to weather conditions, food
shortages, or high possum densities.
Linklater et al. (2001) used mark-recapture analysis to estimate the size and
growth rate of a feral horse population in the Kaimanawa Ranges, and to evaluate
the accuracy of helicopter counts. Aerial counts have taken place on a regular
basis since the mid-1980s and are an integral part of a management programme
designed to minimise the impacts of feral horses on native plant communities.
Parts of the area surveyed by helicopter were subsequently re-surveyed using
mark-resight methods (where individuals were identified from either natural
markings/colouration or freeze brands), and also by distance sampling using
line transect counts, and dung-density sampling. These three techniques all gave
similar estimates, but the helicopter count over-estimated the number of marked
animals by 15�32%, probably because of double counting or horses fleeing from
the helicopter. Linklater et al. (2001) noted that the mark-recapture methodology
was the most useful because it allowed them to estimate recruitment, survival,
and population growth, as well as population size.
Scofield et al. (2001) used mark-recapture analysis to re-analyse titi (sooty
shearwater, Puffinus griseus) banding data collected between 1940 and 1957.
At the time of the original analysis, mark-recapture programs were not available
and other methods were used. While survival rates from the original analysis
were comparable to those obtained using mark-recapture, the latter approach
revealed that non-breeding birds had lower survival and capture rates than
breeding individuals. The original researcher had made this observation but
could not demonstrate it statistically using the methods available at the time.
Flannagan (2000) estimated abundance and density of a little-known species, the
goldstripe gecko (Hoplodactylus chrysosireticus), on Mana Island in Cook Strait.
Prior to the discovery of this population in 1972, goldstripe geckos had only been
recorded from the Taranaki region in the North Island. Mana Island goldstripe

9Department of Conservation Technical Series 28A
geckos, despite living in apparently ideal habitat, exhibit slow population growth
and may not be stable over the long term. As this is the only population secure
from mammalian predators and habitat destruction, the study raised concern
over the current low conservation priority ranking of the species.
The purpose of these examples is to illustrate the range of application rather
than provide an exhaustive review. Mark-recapture methods have also been
used in New Zealand to study weta, tuatara, frogs, and marine mammals, and we
discuss a case study involving bats at the end of the paper. Collectively, such
studies show that it is now possible to use mark-recapture methods to study
small populations (as few as 20�30 animals) and / or species that are difficult to
study. However, mark-recapture methods are not always possible or approp-
riate, and the intending user needs to understand the principles and
requirements of a mark-recapture analysis before setting up their own study.
1 . 3 B A S I C P R I N C I P L E S O F M A R K - R E C A P T U R EA N A L Y S I S
Mark-recapture analysis can potentially be used whenever animals can be
marked or otherwise identified. Marks are usually individual-specific, and can
consist of metal bands (birds or bats), colour bands (birds), ear tags (mammals),
toe clip combinations (frogs, lizards, small mammals), or pen markings (lizards,
tuatara, invertebrates). Radio tags can also be used. It may be possible to
identify individuals without marking them at all, for example by the individual
markings on fins of cetaceans. As noted in some of the examples above, data can
often be collected by re-sighting rather than actual capture, which has the
advantage of causing less disturbance. Due to recent advances in DNA
technology, it is now possible to individually identify animals from faeces,
meaning that mark-recapture analyses can even be used on animals that are
neither seen nor captured. This technique has been developed for possums and
stoats in New Zealand, and may become available for other species in the future
(D. Gleeson, Landcare Research, Auckland, pers. comm.).
This diversity of techniques can lead to confusing terminology. Throughout this
report, these different techniques (mark-recapture, mark-resight, and
identification from photos or faeces) are collectively referred to as �mark-
recapture�, as sightings can, in fact, be thought of as �visual captures�.
Consequently, capture sessions and re-sighting surveys are both referred to as
�capture sessions�. The methods for analysing data collected by these different
methods are identical.
The design of a mark-recapture study is very important, and will determine what
the results can be used for. An important distinction can be made between open
and closed population mark-recapture studies. A closed population remains
constant in size and composition during the study, while an open population
is subject to animals leaving and entering the population through births, deaths,
emigration and immigration. Although all populations are subject to these
processes, it is possible to have closure by conducting a study over a short time
frame, and this is often desirable. Section 1.3.1 explains closed population
mark-recapture studies, and Section 1.3.2 explains open population mark-
recapture studies.

10 Lettink & Armstrong�An introduction to using mark-recapture analysis
1.3.1 Closed populations
Closed population mark-recapture studies are used to estimate the number of
animals in a population; i.e. to provide an estimate of absolute abundance.
The simplest case involves two capture sessions. In the first capture session, a
group of animals is caught, marked and released. The population is then
re-sampled on one subsequent occasion. This method was developed inde-
pendently by Peterson in the 1890s to estimate the size of fish populations and
by Lincoln in the 1920s to estimate wildlife populations. It is therefore called
the Peterson-Lincoln estimate (Seber 1982).
Consider a mark-recapture study on saddlebacks conducted in September on an
off-shore island. In the first capture session, 100 saddlebacks were caught by
setting mist nets all over the island, marked with colour bands, and released.
A second capture session took place one week later. Sixty saddlebacks were
caught, of which 40 were recaptures from the first session. These results can be
used to estimate abundance if certain assumptions can be made about the
population (Box 2).
15040
60100�2
21 ===x
mnnN ×
3 Notation is defined in the glossary of notation, Appendix 2.
Box 2. Assumptions of the Peterson-Lincoln estimate1. There is no birth, death or emigration during the study
2. All animals have the same probability of being caught
3. Marks are not lost
The first of these assumptions is often referred to as the �assumption of closure�
in the literature and can be relaxed in some cases (Pollock et al. 1990). The
second assumption, often called the �assumption of equal catchability�,
is unlikely to be true for many wild animal populations. This has led to the
development of more appropriate population models that specifically address
this issue, and these will be covered below. The third assumption applies to any
mark-recapture model.
In the saddleback study, trapping sessions were separated by a one-week
period. It is reasonable to assume that no saddlebacks would have died over this
short time period. Secondly, there would be no reproduction since saddlebacks
start breeding later. Thirdly, no saddlebacks would be arriving to or leaving the
island. If it can be assumed that the capture probabilities are the same for all
birds (including marked versus unmarked individuals), the probability of a
saddleback being caught during the second capture session can be estimated as
40%. That is, 40 banded birds were caught from 100 available. To estimate the
size of the population, the following equation3 is used:
where = estimated population size
n1
= number of animals caught in the first capture session
n2 = number of animals caught in the second capture session
m2 = number of animals caught in both sessions (recaptures)
N�

11Department of Conservation Technical Series 28A
Note that the �hat� on the N is used to indicate an estimate of a parameter.
Further examples, including methods for estimating variance and confidence
intervals, are given by Pollock et al. (1990).
Closed population mark-recapture studies can have multiple capture sessions,
and this has advantages over conducting just two sessions. As well as providing
more data, allowing more precise estimates, it also allows us to address the
second assumption above, that all animals have the same probability of being
caught (Box 3). The behaviour of animals may change after initial capture,
causing them to be captured more frequently (�trap happy�) or less frequently
(�trap shy�). Individuals may also be inherently different in their probability of
capture. If ignored, these effects could cause abundance to be biased, i.e.
overestimated or underestimated (Table 1).
Otis et al. (1978) showed how these effects can be detected using mark-
recapture data, and developed theory for estimating abundance with these
effects operating. They also showed how changes in capture probability
between sessions, which can also bias estimates (Table 1), can be accounted
for. They developed Program CAPTURE, which allows the user to compare
alternative models (Box 4) to assess which effects are operating, then estimate
population size using the most appropriate model. Program MARK (White &
Burnham 1999) allows a similar model selection procedure. The difference is
that MARK allows users to consider difference in capture probabilities resulting
from biologically meaningful characteristics of animals (e.g. age and sex) rather
than just random variation. The mathematics of these methods are beyond the
scope of this guide, but interested readers can consult Otis et al. (1978),
Schwarz & Seber (1999) and Borchers et al. (2002).
SOURCE OF BIAS EXAMPLE CONSEQUENCE N
Capture heterogeneity Some animals less likely to be Marked animals have higher Under-estimated
caught (e.g. age-biased capture probabilities
dispersal)
Capture heterogeneity Inappropriate trapping Precludes some individuals Under-estimated
method (e.g. not enough from capture if trap already
traps used) occupied
Capture heterogeneity Inappropriate trap placement Animals less likely to be Under-estimated
(e.g. traps on edge of home captured, hence fewer
range instead of middle) animals marked
Trap response Trap-happiness (e.g. use of Animals caught once are Under-estimated
baited traps) more likely to be caught again
Trap-shyness (e.g. animals Animals caught once are less Over-estimated
learn to avoid nets or traps in likely to be caught again
fixed places)
TABLE 1 . REASONS WHY ANIMALS MAY HAVE UNEQUAL CAPTURE PROBABILITIES , AND CONSEQUENCES
OF IGNORING THESE FACTORS WHEN ESTIMATING ABUNDANCE (N ) .
Box 3. Assumptions of closed population mark-recapture models with multiple (> 2) capture sessions
1. There is no birth, death, immigration or emigration during the study
2. Marks are not lost

12 Lettink & Armstrong�An introduction to using mark-recapture analysis
Box 4. Model selectionAny statistical analysis involves model selection. The aim is to find aparsimonious model�i.e. a model that includes factors useful for explainingthe data but excludes irrelevant factors (Burnham & Anderson 2002).
The traditional way of doing this is the hypothesis testing approach, whereyou compare a null hypothesis with an alternative hypothesis that includesanother factor. If the variance associated with that factor can be due tochance alone, the null hypothesis is accepted. However, if this is unlikely (theP value is typically set at 0.05), the factor is deemed statistically significantand the alternative hypothesis accepted. If multiple factors are considered,there is a separate hypothesis test for each term that could be included. Forexample, a three-way Analysis of Variance involves 7 hypothesis tests (onefor each main effect or interaction) and could result in any of 15 differentmodels being selected.
An alternative is the information-theoretic approach, which came from amerging of information theory and likelihood theory (Burnham & Anderson2002). Under this approach, the most parsimonious model is that with theoptimal compromise between precision and bias. This is usually based onAkaike�s Information Criterion (AIC), which is calculated from the model�slikelihood (the probability of getting the observed data if the model is correct)and the number of parameters in the model. The plausibility of alternativemodels can also be weighed based on their AIC values. This means thatparameters can be estimated either from the best model alone, or by a modelaveraging process taking the AIC values of the models into account.
Both approaches are applicable to mark-recapture analysis, and can be doneeasily in MARK. There is debate on their relative merits, and Cooch & White(2001) recommend that analysts become familiar with approaches. However,Burnham & Anderson (2002) make a strong case for the information-theoreticapproach. They argue that we should think carefully about the relevantfactors before data analysis, and produce a set of 4�20 candidate models.The potential advantages of their approach are: (1) it reduces the number ofcandidate models, giving less chance of selecting an over-fitted model (acomplex model that happens to fit the current data set but has poor predictivecapacity), (2) it uses a theoretically sensible selection criterion, avoidingarbitrary P values, (3) it allows alternative models to be weighed, and (4) itencourages us to think carefully about the biology and management issuesrather than being statistical automatons.
1.3.2 Open populations
If populations are subject to births, death, immigration and emigration during a
study, then open population mark-recapture methods must be used. Analysing
data from mark-recapture studies of open populations is more complicated
theoretically, because births, deaths, immigration or emigration may be
confounded by our ability to detect these processes. For instance, if we fail to
detect an animal at the start of the study, we may mistakenly assume that it
arrived later by birth or immigration, and if we fail to detect an animal
previously detected, we may mistakenly assume that it died or emigrated.
The key to open population theory is estimating survival probability (φ) and
capture probability (p). Once capture probability is known, population sizes for
each capture occasion (denoted as i) can be estimated by the equation:
13Department of Conservation Technical Series 28A
where
= population size for capture occasion i
ni
= number of animals captured on occasion i
= capture probability on occasion i
Recruitment between capture sessions is estimated according to the equation:
where
= recruitment for occasion i
= population size for capture occasion i
iφ = survival probability on occasion i
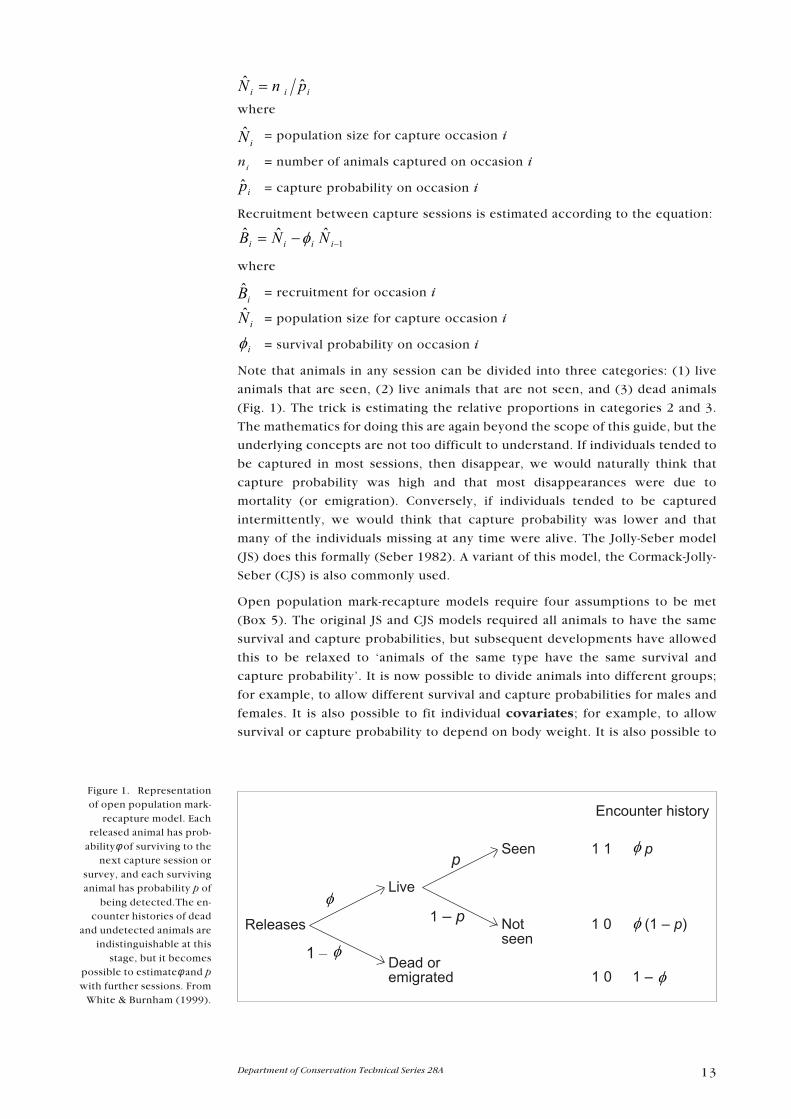
Note that animals in any session can be divided into three categories: (1) live
animals that are seen, (2) live animals that are not seen, and (3) dead animals
(Fig. 1). The trick is estimating the relative proportions in categories 2 and 3.
The mathematics for doing this are again beyond the scope of this guide, but the
underlying concepts are not too difficult to understand. If individuals tended to
be captured in most sessions, then disappear, we would naturally think that
capture probability was high and that most disappearances were due to
mortality (or emigration). Conversely, if individuals tended to be captured
intermittently, we would think that capture probability was lower and that
many of the individuals missing at any time were alive. The Jolly-Seber model
(JS) does this formally (Seber 1982). A variant of this model, the Cormack-Jolly-
Seber (CJS) is also commonly used.
Open population mark-recapture models require four assumptions to be met
(Box 5). The original JS and CJS models required all animals to have the same
survival and capture probabilities, but subsequent developments have allowed
this to be relaxed to �animals of the same type have the same survival and
capture probability�. It is now possible to divide animals into different groups;
for example, to allow different survival and capture probabilities for males and
females. It is also possible to fit individual covariates; for example, to allow
survival or capture probability to depend on body weight. It is also possible to
iii pnN �� =
iN�
iN�
ip�
1���−−= iiii NNB φ
iB�
Figure 1. Representationof open population mark-
recapture model. Eachreleased animal has prob-
abilityφ of surviving to thenext capture session or
survey, and each survivinganimal has probability p of
being detected.The en-counter histories of dead
and undetected animals areindistinguishable at this
stage, but it becomespossible to estimateφ and pwith further sessions. From
White & Burnham (1999).
Releases
φ 1 � p
p
Notseen
Seen
Encounter history
φ 1 �
Live
Dead oremigrated
1 1 pφ
1 0 (1 � p)φ
1 0 1 � φ

14 Lettink & Armstrong�An introduction to using mark-recapture analysis
add age structure to the CJS, so that juveniles and adults can have different
survival or capture probabilities. Those interested in the mathematical theory
underlying open population mark-recapture models should consult Pollock et
al. (1990).
2. Guidelines formark-recapture studies
The most important reason for understanding the basic principles of mark-
recapture is to ensure that monitoring is done efficiently. It is important to
ensure that a mark-recapture study is the most sensible approach for addressing
the issue, that the design does not violate basic assumptions, and that the data
collection is sufficient but not excessive. Other considerations include
potential impacts of capture and marking methods, the size and location of the
study area, and factors that influence capture rates. For instance, capture rates
obtained in lizard pitfall trapping studies are strongly affected by temperature.
In such cases, relevant variables and covariates should be measured and, where
possible, attempts made to minimise their influence.
As with any type of research, the first step is to define the aim of the study (e.g.
is abundance or survival estimation of primary interest?). Sections 2.1 and 2.2
provide guidelines for using mark-recapture to estimate abundance and
survival, respectively. We will briefly discuss a method that maximises power
for estimating abundance and survival simultaneously (Section 2.3), and then
consider a method for estimating population growth rate (Section 2.4).
2 . 1 E S T I M A T I N G A B U N D A N C E
Mark-recapture methods are impractical in some situations. They are also
usually more costly than other methods of estimating abundance, so it is
important to ensure they are appropriate. We will therefore consider
alternative methods of estimating abundance (Fig. 2) before discussing
guidelines for mark-recapture studies.
Box 5. Assumptions of open population mark-recapturemodels
1. All animals (of the same type) have the same survival probability
2. All animals (of the same type) have the same capture probability
3. Marks are not lost or overlooked
4. The duration of each capture occasion is instantaneous in relation to theintervals between sessions

15Department of Conservation Technical Series 28A
2.2.2. Methods for assessing abundance
Mark-recapture requires animals to be marked, so it is unlikely to be used, say,
for estimating abundance of springtails in soil samples. However, people are
generally prepared to fix springtails in alcohol, making them immobile, and it is
possible to simply count all the springtails in small samples. Standard statistical
techniques can then be used to analyse those counts. Mark-recapture methods
are unnecessary in any situation where it is possible to count all the individuals
in a sample area. This will be the case whenever detection probability is 100%
and animals are immobile with respect to the observer. Most plants fall into this
category, as well as sessile marine animals, and some large animals that can be
surveyed by aircraft. If the whole population cannot be counted, then counts
are made in sample areas such as quadrats.
If such techniques cannot be used, then distance sampling may be the best
approach. Distance sampling gives an absolute estimate of abundance, and can
be used for animals that are mobile and / or do not have 100% detection. It does
not require marking, so is cheaper and easier than mark-recapture. Distance
sampling involves recording distances of animals from transects or points, and
using the distance data to estimate detection probability. The basic theory is
relatively simple and the program DISTANCE is easy to use. The program and
extensive documentation can be downloaded at:
http://www.ruwpa.st-and.ac.uk/distance/
100% detection,animals do not move?
Y
Y
N
N
N
Y
Y
Y
Complete count orcounts from sample areas
(e.g. quadrats)
Index ofrelative abundance
OK?
5-minute bird counts,call counts, tracking tunnels,
etc.
Assumptions ofdistance sampling
OK?
Mark-recapture methods
Distance sampling
Closed population models
Open population models
Figure 2. A simple schemefor determining a suitable
method for assessingabundance. If mark-
recapture is used, a closedpopulation model should be
used when the aim is toobtain a single estimate of
abundance, whereas anopen population model is
needed if the population isstudied over time. The two
approaches can becombined using the robustdesign (Section 2.3). Data
from closed, open, androbust designs can all beanalysed using Program
MARK (Box 1).

16 Lettink & Armstrong�An introduction to using mark-recapture analysis
Unfortunately, program DISTANCE produces highly inaccurate estimates if the
underlying assumptions are violated (Box 6). The third assumption is
particularly problematic for New Zealand birds because many species tend to
move toward or away from observers. Cassey (1999) and Barraclough (2000)
have already discussed the applications of distance sampling techniques in New
Zealand.
Box 6. Assumptions of distance sampling1. Points and transects are placed randomly with repect to the distribution of
animals
2. Detection probability is 100% at the point or on the transect line
3. Animals do not move toward or away from observers before detection
If neither direct counts nor distance sampling can be used, methods that
provide an index of relative abundance should be considered. An index of
relative abundance measures changes in animal populations over time without
actually estimating how many animals there are, i.e. abundance is relative to
that obtained during previous sampling periods. Indices of relative abundance
commonly used in New Zealand include 5-minute bird counts, call counts, and
tracking tunnel lines for rodents and mustelids.
Data for such indices can be obtained quickly in comparison with other
methods. However, indices can also be problematic. While it is often assumed
that the index is directly proportional to population density, this may not be the
case (Thompson et al. 1998). In some cases, an index may show changes in
conspicuousness that are completely unrelated to abundance. This problem can
potentially be addressed by calibrating indices against absolute estimates of
abundance (e.g. mark-recapture estimates), but not without considerable
additional costs and effort.
A second problem with indices is that they typically have high sampling
variance, which means that large sample sizes and / or frequent sampling
sessions are necessary to detect population trends. The use of indices may
also require more powerful analysis methods than those used traditionally in
order to separate unwanted sources of variation (e.g. weather and observer
effects) from real variation in the data.
If none of these alternative methods are suitable, then mark-recapture should be
considered. To summarise, mark-recapture may be the best method of assessing
abundance if: (1) simple counts are impossible, (2) the assumptions of distance
sampling are violated, or (3) an index of relative abundance is insufficient.
Mark-recapture may also be the best method simply because capturing animals
is the best way to detect them, as is the case for many cryptic or nocturnal
species.
2.1.3 Mark-recapture abundance estimation
In theory, the simplest way to measure abundance with mark-recapture is to do
one thorough search where all individuals are detected. This is called a census.
The best known census involves a door-to-door survey of people, who are
individually identified by their names, dates and places of birth. Some surveys of

17Department of Conservation Technical Series 28A
animals may also involve fully-marked populations with detection probabilities
close to 100%. This has been demonstrated, for example, in the pre-breeding
surveys of stitchbirds on Mokoia and Tiritiri Matangi Islands (Armstrong et al.
2002). In most cases, however, it is unreasonable to assume 100% detection and
the term census should not be used.
Another simple mark-recapture method is to calculate the minimum number
alive (MNA) at the time of a survey�i.e. the number of individuals detected
during that survey plus any detected in subsequent surveys. The relationship of
the MNA to the actual population size is unclear, so it is difficult to interpret in
most circumstances. For example, the fact that MNA is higher at Site A than Site
B does not necessary mean the population is larger at Site A. The only reason
people have used MNA in the past is because it is easy. Recent developments in
software (Box 1) and computing have made mark-recapture analysis much more
accessible, meaning there is no reason to use MNA in most instances.
If the reason for using mark-recapture is to obtain a single estimate of
abundance, then a closed population model should be used. If multiple
estimates of abundance and survival over time are wanted, the ideal method is
the robust model (Section 2.3), which combines features from open and closed
population models. Alternatively, it may be reasonable to use open models
(Section 1.3.2) as long as capture probabilities are fairly high (Thompson et al.
1998), and the assumptions of the models are met. Most important are the
assumptions that all animals of the same type have equal survival and capture
probabilities. Generally speaking, the robust model produces more precise
abundance estimates than an open model, but requires more sampling periods.
2.1.4 Designing closed population studies
The key issues to consider when designing a closed population mark-recapture
study are the number of capture sessions, their timing, and the number and
arrangement of traps or other capturing devices. Otis et al. (1978) recommend
that a minimum of 5 sampling sessions be used, and that average capture
probabilities of at least 0.1 per session (i.e. on average, every animal has a 10%
chance of being captured each session) are necessary for reasonable results.
Thompson et al. (1998) suggest a study area should contain at least 100 animals
with capture probabilities of at least 0.3 but preferably above 0.5. If a popul-
ation size exceeds 100 individuals, lower capture probabilities will suffice.
Alternatively, more sampling periods could be used. Studies with smaller
populations (< 100) will need more sampling periods and / or high capture
probabilities.
The timing of the capture sessions is critical to meet the assumption of closure.
Most importantly, the intervals between surveys should be short enough that
birth, death, immigration and emigration are unlikely. However, some times of
year will also be better than others. The start of the breeding season is often a
good time, for several reasons. First, abundance estimates are most meaningful
at this time because they give the size of the breeding population. Second, you
avoid having newly-produced young and nesting adults present, both of which
are obvious sources of heterogeneity. Third, no births are occurring yet, and
death rates are expected to be low in many species due to good conditions.
Fourth, animals of many species are quite settled at this time, resulting in less
potential for immigration and emigration.
18 Lettink & Armstrong�An introduction to using mark-recapture analysis
The number and arrangement of the traps depends on the species and the
location. The traps need to be distributed in such a way that it is reasonable to
assume that individuals do not differ in probability of capture due to the
placement of the traps. For example, with territorial species the traps must be
close enough together to ensure there is at least one trap in each territory.
There then need to be enough traps in the sampling area to ensure that a
reasonable number of animals are captured (see above). Fewer traps may be
needed if animals are highly mobile and less site-attached. However, this
mobility usually introduces another problem. In the ideal case, the traps will
completely cover a geographically closed area. In most cases, however, the
trapping area will be a sample of a larger area. This means that animals will
inevitably be moving in and out of the area, especially near the edges. This
makes it difficult to say what area is actually being trapped, and makes the
estimated abundance for that area difficult to interpret. One solution is to use
trapping webs (see Buckland et al. 1993), which allow estimation of population
density, taking into account the movements of animals on and off the web.
However, trapping webs are not widely used. The most common arrangement
of traps is a grid, which is more practical because it is easier to place out and
locate the traps. Consequently, Murray Efford has recently developed a
simulation-based method that allows population density to be estimated from
grids, taking movement on and off the grid into account. The method is
unpublished as yet, but the software is available at:
www.landcareresearch.co.nz/services/software/density/index.asp
2.1.5 Analysing closed population data
Until recently, the standard program for analysing closed population mark-
recapture data was CAPTURE (Otis et al. 1978). However, it is now easier to do
similar analyses in program MARK. To do this, start up MARK, select CLOSED
CAPTURES where it says SELECT DATA TYPE, and proceed from there. MARK allows the
user to divide animals into different groups (e.g. different sexes and ages).
By grouping animals, obvious sources of heterogeneity among individuals can
be removed. For instance, juveniles may be easier to catch than adults. There
may also be seasonal effects whereby animals are easier to catch at certain times
of the year than others. And finally, animals may become trap-happy or trap-shy,
resulting in different capture and recapture probabilities. All these effects
(capture heterogeneity, trap-happiness / shyness, and time effects) can be
accounted for in closed population models. From there on, alternative simpler
models can be constructed and compared by model selection (Box 4; Cooch &
White 2001; Pryde 2003).
2 . 2 E S T I M A T I N G S U R V I V A L
Unlike the situation for abundance, there is usually no alternative to mark-
recapture for estimating survival. It would be possible to measure survival from
counts of unmarked animals if they were immobile, detection was 100% and
there was no possibility of recruitment. However, this would be an unusual
scenario. The normal methods all involve using captures (or other detection
methods) to assess the fate of marked (or otherwise identifiable) animals, so can
be classified as mark-recapture methods. The method used depends on the
number of capture sessions or surveys, the probability of detection, and
whether animals are captured live or found dead (Fig. 3).

19Department of Conservation Technical Series 28A
2.2.1 Methods for different types of data
Consider the simplest possible study where a set of animals is marked, surveyed
once at a later date, and detection is 100%. In this scenario the fate of each
animal is a simple Boolean trial�i.e. it can be in two states: live or dead. The
factors affecting survival can then be analysed with standard statistical methods
for Boolean data, such as logistic regression or log-linear modelling.
If there are multiple surveys, but detection probability is still 100%, then the
data can be analysed using the known FATES OPTION in MARK�i.e. select KNOWN
FATES where it says SELECT DATA TYPE. This is similar to the CJS model, but simpler
because it is unnecessary to estimate recapture probability. The data can also
be analysed using the Kaplan-Meier method available in many statistical
packages. Radio-tracking is a common method of obtaining known fate data.
If detection probability is less than 100%, and animals are captured (or
otherwise detected) when alive, then the CJS model is used. To use the CJS
model, select LIVE RECAPTURES as the data type in MARK. Most mark-recapture
studies of endangered species fall into this category, so the CJS is the most
important method to learn for estimating survival. Where animals are recovered
dead, as is usually the case for fish and game management, a recoveries model is
used. MARK supports two models for analysing recoveries, and several other
models for analysing a combination of live and dead recoveries.
As noted above, if you want to combine survival estimates with precise
estimates of population size, the best option is the robust model (Section 2.3).
100% detection,one capture session orsurvey after release?
N
N
N
Y
Y
Methods for Boolean datae.g. logistic regression,
log-linear modelling
100% detection,multiple capture sessions
or surveys?
5-minute bird counts,call counts, tracking tunnels,
etc.
Marked animalscaptured or detected
while alive?
Marked animalskilled or found dead?
CJS modelJS model
Pradel models
Y
YRecovery models
Figure 3. A simple schemefor determining a suitable
method for estimatingsurvival. All involve capture
or survey of markedanimals. Boolean (+/-) data
can be analysed usingstandard statistical
packages, and the otheranalyses can all be done
using Program MARK(Box 1).
20 Lettink & Armstrong�An introduction to using mark-recapture analysis
2.2.2 Designing open population studies
These recommendations are written with the CJS model in mind, but they apply
to any open population mark-recapture method including the known fate and
dead recoveries models. As for closed population mark-recapture, the key issues
to consider when designing a study are the number of capture sessions or
surveys, their timing, and the trapping or survey strategy.
Lebreton et al. (1992) recommend a minimum of 5 capture sessions. The
number required for obtaining precise estimation depends on the number of
animals in the data set, the average capture probability, and the number of
factors that need to be taken into account. That is, more capture sessions are
needed if there are few animals, low capture probabilities, or if complex models
are needed.
Sample size is likely to be problematic for studies of threatened species, and
will limit the complexity of the models that can be constructed, and therefore
what can be learned about detailed processes occurring at the population level.
For small populations with low capture probabilities, a mark-recapture study
will need a large number of capture sessions. If animals are difficult to recapture
in addition to being few in number, a mark-recapture study may not be feasible.
It is best to seek statistical advice if this situation applies.
If capture or detection probabilities are high (e.g. detection probabilities
greater than 90% are often obtained for robins and stitchbirds), few surveys may
be needed. If the object of the exercise is to estimate annual survival
probability, there is probably little point in doing more than 1�2 surveys per
year in such circumstances. The best investment of effort will be to do good
surveys rather than frequent surveys. However, in some cases you may want to
model seasonal changes in survival, effects of short-term events, or fine-grained
age effects, necessitating several surveys per year (e.g. Armstrong & Perrott
2000).
Surveys should be done at consistent times of year to get meaningful
information. For example, your data will be difficult to interpret if you do a
survey in September one year, February the following year, and July the year
after that. If you are only doing one survey a year, the best time may be the start
of the breeding season as noted in Section 2.1.4. If doing multiple surveys per
year, it is best if they are evenly spaced. This facilitates modelling of seasonal
effects. While variable intervals can be specified in MARK, and these are
corrected for in survival estimates, the program performs better when
consistent intervals are used. In some cases, survival or detection probability
may change over time with factors such as weather rather than following the
seasons. It may therefore be useful to record data on such factors, because they
can potentially be used as covariates when analysing the mark-recapture data.
The design of the trapping sessions or surveys is critical. In particular, they
must be designed to meet the assumptions that capture probability is similar for
individuals of a given type, and that capture sessions are effectively
instantaneous in comparison with the intervals between sessions. This means
that each trapping occasion or survey must cover the entire study area (or at
least the habitat suitable for the species), and that search effort should be
consistent over this area. It also means that surveys need to take place over a
discrete time period�as a rule of thumb, the duration of each survey should be

21Department of Conservation Technical Series 28A
< 10% of the interval length between surveys (Lebreton et al. 1992). Monitoring
programs for New Zealand birds do not usually follow these rules, with one
portion of the population searched one time, another portion searched another
time, and no discrete surveys. Unfortunately, this means that considerable
effort may be expended without producing data that can be used to estimate
survival properly.
2.2.3 Analysing open population data
MARK is now the standard program for doing all survival analyses, except for
simple Boolean data as discussed above. We have already noted that MARK can
handle different data types such as live recaptures, dead recoveries, and known
fate data. The default is �live recaptures�, which are analysed using the CJS
model.
The first step is to consider what the most complicated model needed to
explain the data might be. This will become the global model, and all other
models considered will be simplifications of this. Models can be modified by
adding groups (e.g. males v. females), individual covariates (e.g. weights), and /
or age structure. It may be tempting to produce an extremely complicated
model, but such models tend to be confusing and require huge data sets. It is
best to keep it as simple as possible.
The next step is to use goodness-of-fit testing to assess whether the global
model gives a reasonable fit to the data. This is done using a bootstrapping
procedure or program RELEASE, both of which are available in MARK. If the
data violate the assumptions of open population mark-recapture, then the
results will indicate a poor fit. It is possible to correct for mild heterogeneity
among individuals (i.e. heterogeneity that is not accounted for by your groups,
individual covariates, or age structure). However, a much better approach,
if possible, is to find a global model with a good fit to the data.
As for closed population mark-recapture analyses (Section 2.1.5), simpler
models are then created and compared using model selection procedures, and
survival estimates with 95% confidence intervals obtained from the best model
(Box 4; Cooch & White 2001; Pryde 2003).
2 . 3 C O M B I N I N G A B U N D A N C E A N D S U R V I V A LE S T I M A T I O N
The robust design combines the population estimation feature of closed
population models with the survival rate estimation feature of open population
models. This is made possible by structuring capture sessions into primary and
secondary periods. For example, a trapping study might involve trapping
animals for 5 consecutive nights every year for 10 years, where the year interval
is the primary period and the five consecutive nights the secondary periods.
From this study it will be possible to estimate population size for each of the
annual 5-night trapping sessions, and survival rates for the nine intervals
between the 10 years.

22 Lettink & Armstrong�An introduction to using mark-recapture analysis
The assumptions of open population models also apply to use of the robust
design, but the robust design is more effective at dealing with capture
heterogeneity and / or trap response (Pollock 1982). Other advantages of using
the robust design are increased precision for population estimation compared
with using an open population model alone, and the ability to estimate births or
immigration separately. The disadvantage of the robust design is that it requires
more capture sessions and may therefore increase the cost, effort and duration
of the study. The smallest practical design suggested by Pollock (1982) was
3 primary periods each containing 5 secondary capture sessions.
2 . 4 E S T I M A T I N G P O P U L A T I O N G R O W T H R A T E
In recent years, there has been progressively less emphasis on estimating
abundance and progressively more emphasis on estimating population growth
rate. The estimated growth rate is usually denoted by the symbol λ (Lambda).
A λ value of 1.0 indicates a stable population, while a λ value significantly
different from 1 shows that the population is increasing (λ > 1.0) or decreasing
(λ < 1.0). This has obvious relevance for management of threatened species,
and estimating λ can be a simple substitute for population viability analysis.
Separate estimates of survival and recruitment can be combined to estimate λ.
However, λ can be also estimated directly from mark-recapture data.
λ can be estimated directly from the Jolly Seber model or, alternatively, using
Pradel�s (1996) model which is also available in MARK (select PRADEL SURVIVAL AND
LAMBDA as the data type). Unlike the Jolly Seber model, Pradel�s model does not
estimate abundance and does not estimate separate capture and recapture
probabilities. Its assumptions are otherwise similar to those of the Jolly Seber
model.
3. A case study usinglong-tailed bats
3 . 1 I N T R O D U C T I O N
New Zealand long-tailed bats (Chalinolobus tuberculatus) are currently classed
as nationally threatened. Long-tailed bats have declined since European
settlement due to forest clearance, habitat disturbance, and predation by
introduced mammals (O�Donnell 2000a). Scattered populations persist
throughout New Zealand. Four such populations (Grand Canyon Cave and
Ruakuri Reserve, North Island; Hanging Rock and the Eglinton Valley, South
Island) are currently being studied with the aim of developing improved
monitoring techniques for long-tailed bats nation-wide.

23Department of Conservation Technical Series 28A
Hanging Rock in South Canterbury has a small population of long-tailed bats.
This is the only known bat population from the East Coast of the South Island,
and one of few places where bats persist in a highly modified agricultural
landscape. It is unlikely that the Hanging Rock population is viable for several
reasons: (1) bats do not have access to cavities in large native trees that provide
suitable micro-climates for raising young (Sedgeley 2001); (2) roost trees are
frequently removed for firewood; (3) cats, possums, rodents and mustelids prey
on long-tailed bats; and (4) there is on-going habitat loss and degradation
(O�Donnell 2000a).
3 . 2 O B J E C T I V E S
The aim of this case study is to illustrate the type of information that can be
gained from a mark-recapture study of a threatened species that is difficult to
study and requires a large effort to obtain reasonable recapture probabilities.
Similar situations occur with many other threatened species (e.g. birds in tall
forest on the mainland, forest lizards, some galaxids and invertebrates, other bat
species). The case study is not intended as an ideal example of how a mark-
recapture study should be done; better examples are listed in Section 1.2.
Rather, the bat data provide a good illustration of problems that can arise and
the limitations on the level of inference that can be drawn from mark-recapture
studies of threatened species. Specifically, we were interested in addressing the
following questions:
� How large was the population?
� Was the population stable, increasing or decreasing?
� What proportion of the population survived each year?
� What factors influenced survival (e.g. sex and age of bats)?
3 . 3 M A R K - R E C A P T U R E A N A L Y S I S
A simple mark-recapture analysis was performed using four years of trapping
data (1998�2002). Bats were trapped by placing harp traps across flyways, or by
radio-tracking bats (usually reproductive females or juveniles) to communal
roosts and trapping them as they emerged on dusk. Each bat caught was fitted
with an individually numbered aluminium forearm band. Trapping was carried
out in several in one- to three-week trips between late October and early April
each year (the summer season). The data collected from each season were
subsequently pooled, giving one capture session for each of the four years.
A total of 512 captures of 201 individual bats were made, with some individuals
caught up to nine times over the study.
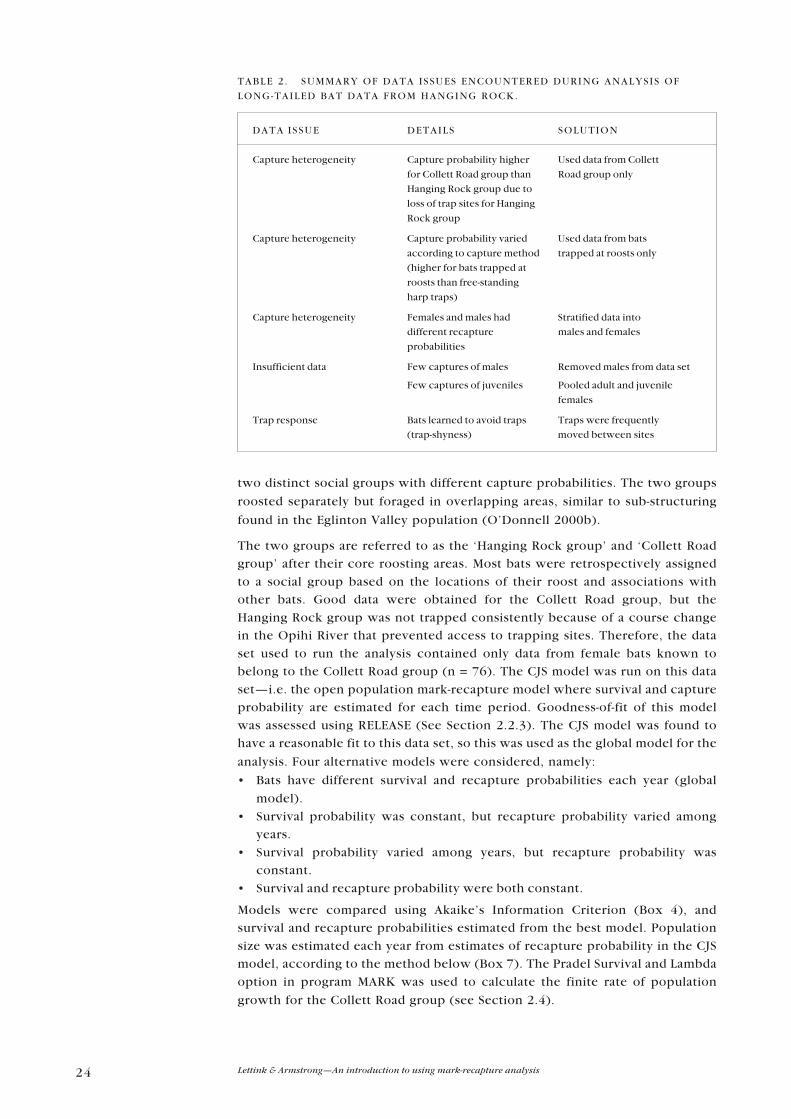
There were several problems with this data set, namely capture heterogeneity,
insufficient data and trap-shyness (Table 2). In addition, trapping was done
when time and resources permitted, and not at a standard time of year for a
discrete time period. Capture heterogeneity was the result of different capture
probabilities for the sexes, the different trapping methods used (free-standing
harp traps versus trapping at roosts), and sub-structuring of the population into
24 Lettink & Armstrong�An introduction to using mark-recapture analysis
two distinct social groups with different capture probabilities. The two groups
roosted separately but foraged in overlapping areas, similar to sub-structuring
found in the Eglinton Valley population (O�Donnell 2000b).
The two groups are referred to as the �Hanging Rock group� and �Collett Road
group� after their core roosting areas. Most bats were retrospectively assigned
to a social group based on the locations of their roost and associations with
other bats. Good data were obtained for the Collett Road group, but the
Hanging Rock group was not trapped consistently because of a course change
in the Opihi River that prevented access to trapping sites. Therefore, the data
set used to run the analysis contained only data from female bats known to
belong to the Collett Road group (n = 76). The CJS model was run on this data
set�i.e. the open population mark-recapture model where survival and capture
probability are estimated for each time period. Goodness-of-fit of this model
was assessed using RELEASE (See Section 2.2.3). The CJS model was found to
have a reasonable fit to this data set, so this was used as the global model for the
analysis. Four alternative models were considered, namely:
� Bats have different survival and recapture probabilities each year (global
model).
� Survival probability was constant, but recapture probability varied among
years.
� Survival probability varied among years, but recapture probability was
constant.
� Survival and recapture probability were both constant.
Models were compared using Akaike�s Information Criterion (Box 4), and
survival and recapture probabilities estimated from the best model. Population
size was estimated each year from estimates of recapture probability in the CJS
model, according to the method below (Box 7). The Pradel Survival and Lambda
option in program MARK was used to calculate the finite rate of population
growth for the Collett Road group (see Section 2.4).
TABLE 2 . SUMMARY OF DATA ISSUES ENCOUNTERED DURING ANALYSIS OF
LONG-TAILED BAT DATA FROM HANGING ROCK.
DATA ISSUE DETAILS SOLUTION
Capture heterogeneity Capture probability higher Used data from Collett
for Collett Road group than Road group only
Hanging Rock group due to
loss of trap sites for Hanging
Rock group
Capture heterogeneity Capture probability varied Used data from bats
according to capture method trapped at roosts only
(higher for bats trapped at
roosts than free-standing
harp traps)
Capture heterogeneity Females and males had Stratified data into
different recapture males and females
probabilities
Insufficient data Few captures of males Removed males from data set
Few captures of juveniles Pooled adult and juvenile
females
Trap response Bats learned to avoid traps Traps were frequently
(trap-shyness) moved between sites
25Department of Conservation Technical Series 28A
3 . 4 R E S U L T S
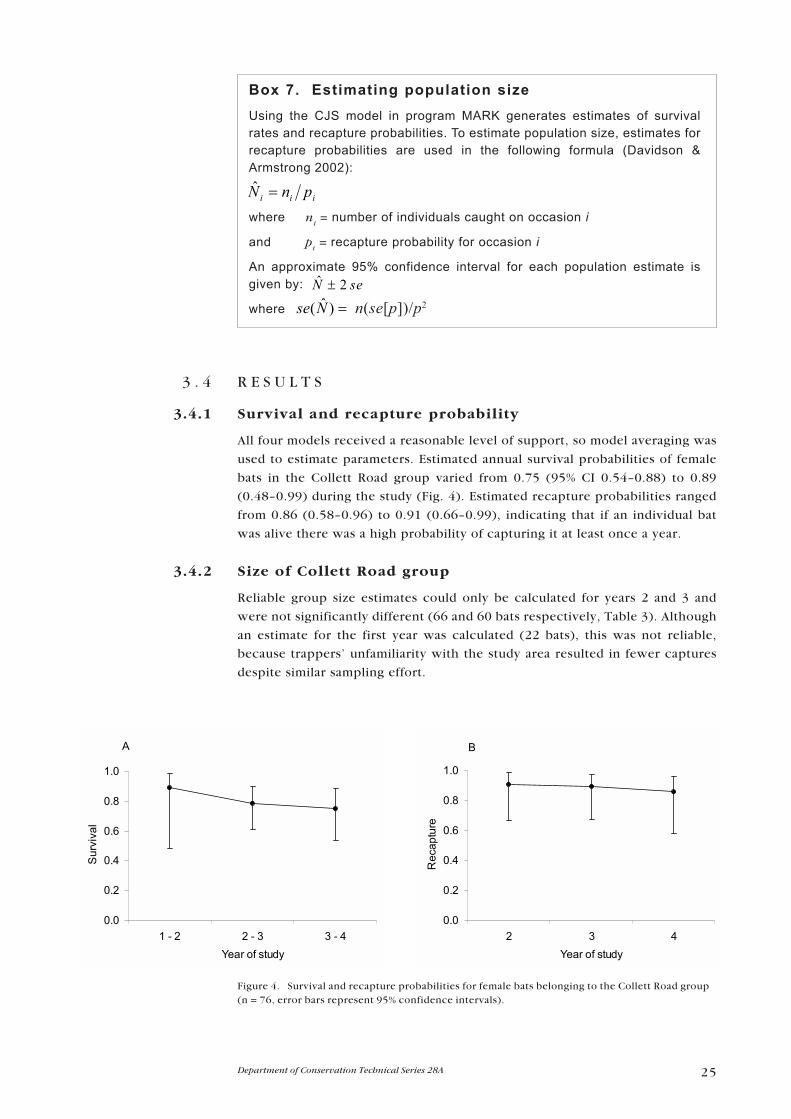
3.4.1 Survival and recapture probability
All four models received a reasonable level of support, so model averaging was
used to estimate parameters. Estimated annual survival probabilities of female
bats in the Collett Road group varied from 0.75 (95% CI 0.54�0.88) to 0.89
(0.48�0.99) during the study (Fig. 4). Estimated recapture probabilities ranged
from 0.86 (0.58�0.96) to 0.91 (0.66�0.99), indicating that if an individual bat
was alive there was a high probability of capturing it at least once a year.
3.4.2 Size of Collett Road group
Reliable group size estimates could only be calculated for years 2 and 3 and
were not significantly different (66 and 60 bats respectively, Table 3). Although
an estimate for the first year was calculated (22 bats), this was not reliable,
because trappers� unfamiliarity with the study area resulted in fewer captures
despite similar sampling effort.
Figure 4. Survival and recapture probabilities for female bats belonging to the Collett Road group(n = 76, error bars represent 95% confidence intervals).
B
0.0
0.2
0.4
0.6
0.8
1.0
2 3 4Year of study
Rec
aptu
re
A
0.0
0.2
0.4
0.6
0.8
1.0
1 - 2 2 - 3 3 - 4Year of study
Sur
viva
lBox 7. Estimating population sizeUsing the CJS model in program MARK generates estimates of survivalrates and recapture probabilities. To estimate population size, estimates forrecapture probabilities are used in the following formula (Davidson &Armstrong 2002):
where ni = number of individuals caught on occasion i
and pi = recapture probability for occasion i
An approximate 95% confidence interval for each population estimate isgiven by:
where n(se[p])/p2
iii pnN =�
seN 2� ±
=)�(Nse

26 Lettink & Armstrong�An introduction to using mark-recapture analysis
3.4.3 Rate of population decline
The Collett Road group declined in size by approximately 9% over each of the
two years for which λ was calculated (0.914 and 0.881 for years 2�3 and years
3�4 respectively, Table 3).
3 . 5 D I S C U S S I O N
3.5.1 Implications for long-tailed bats at Hanging Rock
� The Collett Road group is small and declined during the study period
Analysis of the Collett Road data show that this population consists of a small
group of bats (approximately 50�75 females) that appears to have declined by
approximately 9% per year over the two years where this could be estimated.
There was reason to expect to find a decline, because bats in this area are known
to have been killed by cats (and possibly possums). There is also ongoing felling
of roost trees. The mark-recapture results confirmed and quantified the decline of
the population of long-tailed bats in the Hanging Rock area.
� More data are needed
The analysis was limited by small sample sizes and few sampling periods. The
relatively small number of females in the Collett Road group was probably not a
major problem given the high capture probabilities estimated. However, there
were insufficient data for the Hanging Rock group, and for all juveniles and
males, limiting the scope of the analysis. The study spanned four years, but it
was only possible to estimate abundance and rate of increase for the two middle
years of the study. Data for additional years will improve the reliability of the
data and the conclusions based on them.
� Mark-recapture analysis can provide performance targets for
management
The estimates of survival and population decline provide baselines that the bats�
response to management can be measured against. Management could include
possum control combined with protection of known and potential roost trees.
Estimated survival could be incorporated into a population viability model to
predict how this population might change over longer time periods and under
different management regimes. This would include recruitment rate, which
could also be estimated from the mark-recapture data.
Year 2 Year 3
Group size 66.07 59.58
(95% CI) (56.16 � 75.98) (50.81 � 68.35)
Year 2�3 Year 3�4
Finite rate of increase (λ) 0.914 0.881
(95% CI) (0.396 � 0.994) (0.425 � 0.987)
TABLE 3 . ESTIMATED POPULATION SIZE AND GROWTH (FINITE RATE OF
INCREASE, (λ ) FOR FEMALE BATS BELONGING TO THE COLLETT ROAD GROUP
FOR YEARS 2 (1999�2000 FIELD SEASON) AND 3 (2000�01 F IELD SEASON) OF
A FOUR-YEAR STUDY (λ ESTIMATES ARE CALCULATED ACROSS YEARS) .
27Department of Conservation Technical Series 28A
4. Recommendations
4 . 1 D E S I G N A N D A N A L Y S I S
A mark-recapture study should:
� Be done with clear questions in mind. These questions will determine
whether mark-recapture should be used at all, or whether another method is
more appropriate (e.g. whether to estimate or index abundance). This will
also affect the type of mark-recapture method used, and the number and
timing of capture sessions.
� Be well designed. Capture sessions must be designed to avoid violating the
assumptions of mark-recapture analysis. In particular, there must be discrete
sessions (i.e. the duration of the session is short in comparison to the intervals
between sessions), and the sessions must be designed to equalise capture
probabilities among animals as much as possible. Failure to follow these rules
will not save any time in the field, and may result in data that require complex
analyses, give biased estimation, have low precision, or that cannot be
analysed at all.
� Have sufficient capture sessions, taking into account that it may not be
possible to use data from all sessions, e.g. for the first sampling session,
capture rates may be poor due to researchers� unfamiliarity with the system
under investigation.
� Use the appropriate mark-recapture method for the question and data type.
� Be analysed sensibly. The best analysts put a lot of thought into the biological
and management issues involved before doing their analyses, and construct
their models to address those issues. This requires having knowledge of the
basic principles of mark-recapture, as well as the biology of the species
involved and management options for that species.
4 . 2 U S I N G M A R K - R E C A P T U R E A N A L Y S I S F O R
M A N A G E M E N T
Mark-recapture analysis is a powerful tool that can be used for:
� Generating estimates of abundance, survival and recruitment for population
viability analysis
� Evaluating the impacts of threats and management actions on survival
� Estimating population trends (i.e. increasing, stable, or decreasing)
� Identifying gaps in data
� Setting performance targets against which response to management can be
measured

28 Lettink & Armstrong�An introduction to using mark-recapture analysis
5. Acknowledgments
This project was supported by the New Zealand Department of Conservation as
part of Science Investigation No. 2504.
We thank Colin O�Donnell and Moira Pryde (DOC) for their valuable
contributions and Terry Greene (DOC) for reviewing the manuscript and
providing valuable comments. Parts of this guide were derived from teaching
materials developed for Applied Ecology & Resource Management (196.315)
and Wildlife Management (199.715) at Massey University.
6. References
Armstrong, D.P.; Ewen, J.G. 2001: Estimating impacts of poison operations using mark-recapture
analysis and population viability analysis: an example with New Zealand robins (Petroica
australis). New Zealand Journal of Ecology 25: 29�38.
Armstrong, D.P.; Davidson, R.S.; Dimond, W.J.; Perott, J.K.; Castro, I.; Ewen, J.G.; Griffiths, R.;
Taylor, J. 2002: Population dynamics of reintroduced forest birds on New Zealand islands.
Journal of Biogeography 29: 609�621.
Armstrong, D.P.; Perrott, J,K. 2000. An experiment testing whether condition and survival are
limited by food supply in a reintroduced hihi population. Conservation Biology 14: 1171�
1181.
Barraclough, R.K. 2000: Distance sampling: a discussion document produced for the Department of
Conservation. Science & Research Internal Report 175. Department of Conservation,
Wellington, New Zealand.
Borchers, D.L.; Buckland, S.T.; Zucchini, W. 2002: Estimating animal abundance: closed
populations. Springer-Verlag London Ltd., London.
Buckland, S.T.; Anderson, D.R.; Burnham, K.P.; Laake, J.L. 1993: Distance sampling: estimating
abundance of biological populations. Chapman and Hall, London.
Burnham, K.P.; Anderson, D.R. 2002: Model selection and multimodel inference: a practical
information-theoretic approach (2nd ed.). Springer-Verlag, New York.
Cassey, P. 1999: Estimating animal abundance by distance sampling techniques. Conservation
Advisory Science Notes 237, Department of Conservation, Wellington.
Cooch, E.; White, G. 2001: Program MARK: analysis of data from marked individuals: �A gentle
introduction� (2nd ed.). http://www.cnr.colostate.edu/~gwhite/mark/mark.html (May
2002).
Davidson, R.S.; Armstrong, D.P. 2002: Estimating impacts of poison control operations on non-target
species using mark-recapture analysis and simulation modelling: an example with
saddlebacks. Biological Conservation 105: 375�381.
Efford, M. 1998: Demographic consequences of sex-biased dispersal in a population of brushtail
possums. Journal of Animal Ecology 67: 503�517.
Flannagan, H.J. 2000: Conservation biology of the Goldstripe Gecko (Hoplodactylus
chrysosireticus) and interactions with Duvaucel�s Gecko (Hoplodactylus duvaucelli) on
Mana Island, Cook Strait, New Zealand. Unpublished MSc. thesis, Massey University,
Palmerston North, New Zealand.
29Department of Conservation Technical Series 28A
Lebreton, J.; Burnham, K.P.; Clobert, J.; Anderson, D.R. 1992: Modelling survival and testing
biological hypotheses using marked animals: a unified approach with case studies.
Ecological Monographs 62(1): 67�118.
Linklater, W.L.; Cameron, E.Z.; Stafford, K.J.; Minot, E.O. 2001: Estimating Kaimanawa feral horse
population size and growth. Science & Research Internal Report 185. Department of
Conservation, Wellington, New Zealand.
O�Donnell, C.F.J. 2000a: Conservation status and causes of decline of the threatened New Zealand
long-tailed bat Chalinolobus tuberculatus (Chiroptera: Vespertilionidae). Mammal Review
30: 89�106.
O�Donnell, C.F.J. 2000b: Cryptic local populations in a temperate rainforest bat Chalinolobus
tuberculatus in New Zealand. Animal Conservation 3: 287�297.
Otis, D.L.; Burnham, K.P.; White, G.C.; Anderson, D.R. 1978: Statistical inference from capture data
on closed animal populations. Wildlife Monographs 62.
Pollock, K.H. 1982: A capture-recapture design robust to unequal probability of capture. Journal of
Wildlife Management 46: 752�757.
Pollock, K.H.; Nicholls, J.D.; Brownie, C.; Hines, J.E. 1990: Statistical inference for capture-recapture
experiments. Wildlife Monographs 107.
Pradel, R. 1996: Utilization of capture-mark-recapture for the study of recruitment and population
growth rates. Biometrics 52: 703�709.
Pryde, M. 2003: Using program MARK for assessing survival in cryptic threatened species: a case
study using long-tailed bats (Chalinolobus tuberculatus). Pp. 33�63 in Department of
Conservation 2003: Mark-recapture analysis for monitoring threatened species:
introduction and case study. Department of Conservation Technical series 28, 63 p.
Schwarz, C.J.; Seber, G.A.F. 1999: Estimating animal abundance: review III. Statistical Science 14:
427�456.
Scofield, R.P.; Fletcher, D.J.; Robertson, C.J.R. 2001: Titi (sooty shearwaters) on Whero Island:
analysis of historic data using modern techniques. Journal of Agricultural, Biological, and
Environmental Statistics 6: 268�280.
Seber, G.A.F. 1982: The estimation of animal abundance and related parameters (2nd ed.). McMillan,
New York.
Sedgeley, J.A. 2001: Quality of cavity microclimate as a factor influencing selection of maternity
roosts by a tree-dwelling bat, Chalinolobus tuberculatus, in New Zealand. Journal of
Applied Ecology 38: 425�438.
Thompson, W.L.; White, G.C.; Gowan, C. 1998: Monitoring vertebrate populations. Academic Press,
Inc., San Diego.
White, G.C.; Burnham, K.P. 1999: Program MARK: survival estimation from populations of marked
animals. Bird Study 46(suppl.): S120�S139.
30 Lettink & Armstrong�An introduction to using mark-recapture analysis
Appendix 1
G L O S S A R Y O F T E R M S
Alternative hypothesis Used in traditional hypothesis testing to represent the
option that there is some difference or change (see also �Null hypothesis�).
Abundance Number of individuals within a defined area.
relative abundance A measure of change in animal populations over time based
on changes in an index.
absolute abundance A measure of change in animal populations over time
based on changes in the number of animals present.
Bias A persistent statistical error caused by something other than random
chance. Mathematically, bias is the difference between the expected value of a
parameter estimate and the true value of the parameter (modified from
Thompson et al. 1998).
Capture heterogeneity Differences in capture probability or detection
probability among individual animals.
Capture probability The probability that an animal will be captured during a
session. It can also be used when animals are not literally �captured��i.e. may
refer to the probability of detection during a resighting survey. In closed-
population models, capture probability refers only unmarked animals and is
distinguished from recapture probability.
Census A complete count of marked (or otherwise individually identified)
animals in a defined area.
Closed population A group of individuals in a particular area studied over a
defined time period when there is no birth, death, immigration, and
emigration (modified from Thompson et al. 1998).
Confidence interval An interval around a parameter estimate that provides a
measure of confidence regarding how close the parameter estimate calculated
from the sample is to the true parameter. For example, a 95% confidence
interval will contain, on average, the true parameter 95 out of 100 times if 100
such intervals were calculated (modified from Thompson et al. 1998).
Covariate An environmental or biological factor explaining some proportion of
variation in data.
Density Number of individuals per unit area.
Distance sampling A method used to estimate population density. Typically,
the observer travels along a transect placed across the sampling area and
records any animals detected. By recording the distance to each individual
sighted, a correction for detectability can be made.
Estimate A numerical value calculated from data to represent the parameter of
interest (modified from Thompson et al. 1998).
Goodness of fit A measure of how well a model fits a data set. A poor fit shows
that one or more assumptions or the model are invalid, and that it is not an
appropriate global model.
Global model A model containing all the factors thought to be important. Other
models in a set of candidate models will be simplified cases of this global
model. The global model is often the basis for goodness-of-fit evaluation.

31Department of Conservation Technical Series 28A
Hypothesis testing approach A statistical approach that involves selecting
models using null and alternative hypotheses.
Index A relative measure thought to be proportional to a parameter of interest
such as abundance or density.
Information-theoretic approach A statistical approach that involves selecting
models based on information and likelihood theory instead of hypothesis
testing.
Minimum Number Alive (MNA) The number of individuals that are known to
have been alive at a defined time.
Model A (usually mathematical) simplification of reality that represents our
understanding of how a system operates.
Model selection Using statistical methods to decide what model best explains
the data. The aim is to find a model that includes the important factors, and
excludes the irrelevant ones.
Null hypothesis Used with the hypothesis testing approach to represent the
option that there is no difference or change. This hypothesis is tested, and if
rejected, an alternative hypothesis is accepted.
Open population A group of individuals studied over a time period when births,
deaths, immigration or emigration will have occurred (modified from
Thompson et al. 1998).
Parameter An unknown quantity characterising a population�e.g. abundance
or annual survival.
Parsimonious A desired characteristic of a model. It is a balance between bias
and precision.
Population A group of individuals in a defined area.
Population trend A change in the magnitude and direction of some population
parameter (e.g. population size) over time.
Population viability analysis Simulation modelling used to estimate a
population�s probability of extinction over a defined time frame.
Power The probability of detecting a statistically significant difference in a test
of the null hypothesis if such a difference is present.
Recapture probability The probability that a previously marked (or otherwise
individually identified) animal will be captured during a session. It can also be
used to refer to the probability of detection during a survey, which may be
called �resighting probability�.
Recruitment The number of new animals added to a population in a defined
time period due to births and/or immigration.
Simulation modelling A computer model constructed to approximate the
dynamics of a real system. Such models can be used to predict population
trends under different scenarios.
Variance A measure of precision, where high and low variance indicates high
and low precision respectively. Statistically, this is the average of squared
differences between a set of values and the mean of the distribution of those
values (modified from Thompson et al. 1998).

32 Lettink & Armstrong�An introduction to using mark-recapture analysis
Appendix 2
G L O S S A R Y O F N O T A T I O N
B Recruitment (number of new animals arriving in an area over some time
interval, through birth or immigration)
CI Confidence interval
φ Probability of surviving some time interval
λ Finite rate of population growth, lambda
m2
Number of marked animals caught at t2
n A general symbol for sample size, but typically used in mark-recapture
analysis to indicate the number of animals captured (or detected) in a session
n1
Number of animals captured during first capture session
n2
Number of animals captured during second capture session
N Abundance (number of animals in a defined area)
p A general symbol for probability, but typically used in mark-recapture
analysis to indicate the probability of capturing (or otherwise detecting) a
live animal during a session
se Standard error (the square root of the variance in estimate)
t1
First capture session or survey
t2
Second capture session or survey
Estimated population sizeN�

33Department of Conservation Technical Series 28A
Related Documents