An Introduction to SPSS Source: Johan Smits Saxion Market Research

Welcome message from author
This document is posted to help you gain knowledge. Please leave a comment to let me know what you think about it! Share it to your friends and learn new things together.
Transcript

An Introduction to SPSS
Source: Johan SmitsSaxion Market Research

What is SPSS?
“Statistical Package for the Social Sciences”
It is a software used for data analysis in business research. Can be used for:Processing QuestionnairesReporting in Tables and GraphsAnalyzing: Means, Chi-square, Regression, …and
much more..
About SPSS Incorporated
SPSS Inc. is a leading worldwide provider of predictive analytics software and solutions.
Founded in 1968, today SPSS has more than 250,000 customers worldwide, served by more than 1,200 employees in 60 countries.
SPSS is now owned byIBM
It is also known by the name PASW (Predictive Analytics Software)
Ownership history
Between 2009 and 2010, the premier vendor for SPSS was called PASW (Predictive Analytics SoftWare) Statistics. The company announced on July 28, 2009 that it was being acquired by IBM for US$1.2 billion.[3]
IBM SPSS is now fully integrated into the IBM Corporation, and is one of the brands under IBM Software Group's Business Analytics Portfolio, together with IBM Cognos.

We already know that a Research Process consists of:Problem definitionResearch objectivesDesk ResearchField Research
QualitativeQuantitative: constructing a questionnaire
Collecting and Analyzing dataWriting and Presenting the final research report

Translate the Questionnaire into codes and enter data in SPSS
Questions in the questionnaire are mapped into Variables in SPSS
SPSS comes into picture after data has been collected by lets say: questionnaires

Important factors to consider before data entry into SPSS
Question response formatsScale characteristicsLevels of measurement

Question-response formats can be of the following types:
Closed-EndedOpen-Ended with numerical responseOpen-Ended with text responseMultiple response questions

Convert all these formats into numeric or string (alphabet) data for entering into SPSS..

ExamplesResponse-format :: Closed-Ended
How is your satisfaction with the customer service of the staff of Suxes? O ExcellentO GoodO BadO Very bad
Coding the answers
1 = Excellent 2 = Good3 = Bad4 = Very bad

Response-format :: Closed-Ended
11. Please indicate your gender.O FemaleO Male
Codes:1 = Female2 = Male

Open-ended with numerical response
What is your average expenditure in the restaurant on a weekly basis?……… euro per week
For how many years have you been registered as a student at Pandion University?……… year(s)
Enter these types of data As it is….
Open-ended with text response
I would like to have the assortment extended with the following products:…………………………………………
Processed by Coding manually afterwards or Typing the answers literally (text
variable)

Scale characteristics are of three types in SPSS:
(Description)(Order)(Distance)
NominalOrdinalScale (also called as
interval or ratio)
Levels of Measurement

Coding data into the SPSS
Convert Questions VariablesName of the variableVariable labelValue labels (data codes)Level of measurement (Measure)

Some snapshots of the SPSS window:

The SPSS Data Editor
Data View

The SPSS Data Editor
Variable View
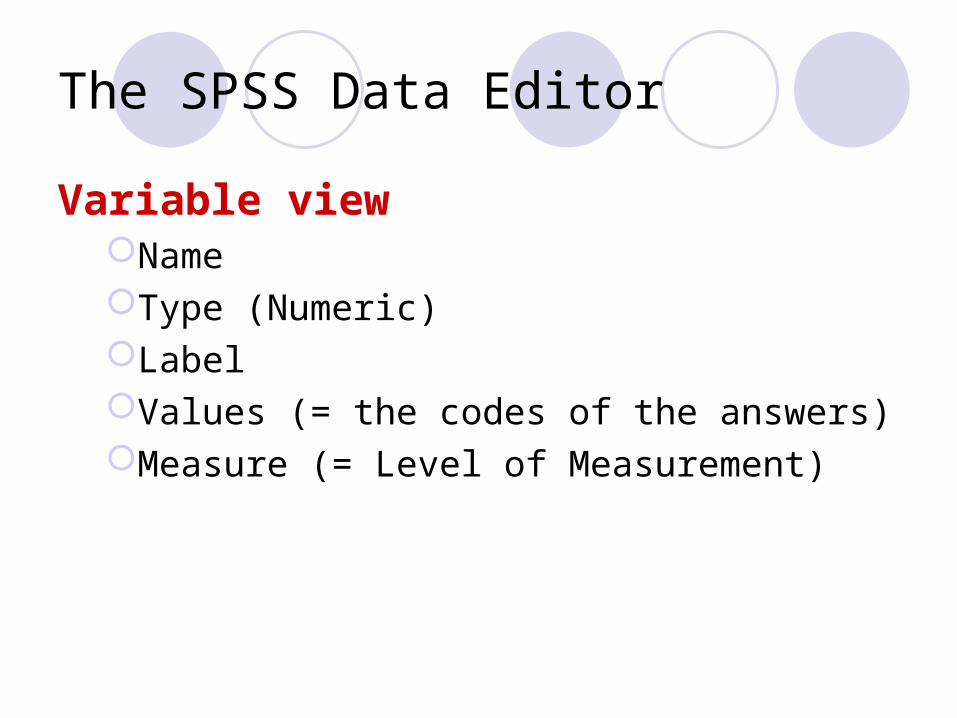
The SPSS Data Editor
Variable viewNameType (Numeric)LabelValues (= the codes of the answers)Measure (= Level of Measurement)
SPSS Menu’s
AnalyzeFrequenciesCross tabsTables

SPSS Menu’s
GraphsBarPieHistogramLineBoxplot

SPSS Output
Separate file in Output ViewerInline Editing of TablesChart Editor for Graphs
Don’t forget to saveData fileOutput file

Part 1: Descriptive Statistics
PASW Statistics 17 (SPSS 17)
ITS Training Programwww.youtube.com/mycsula
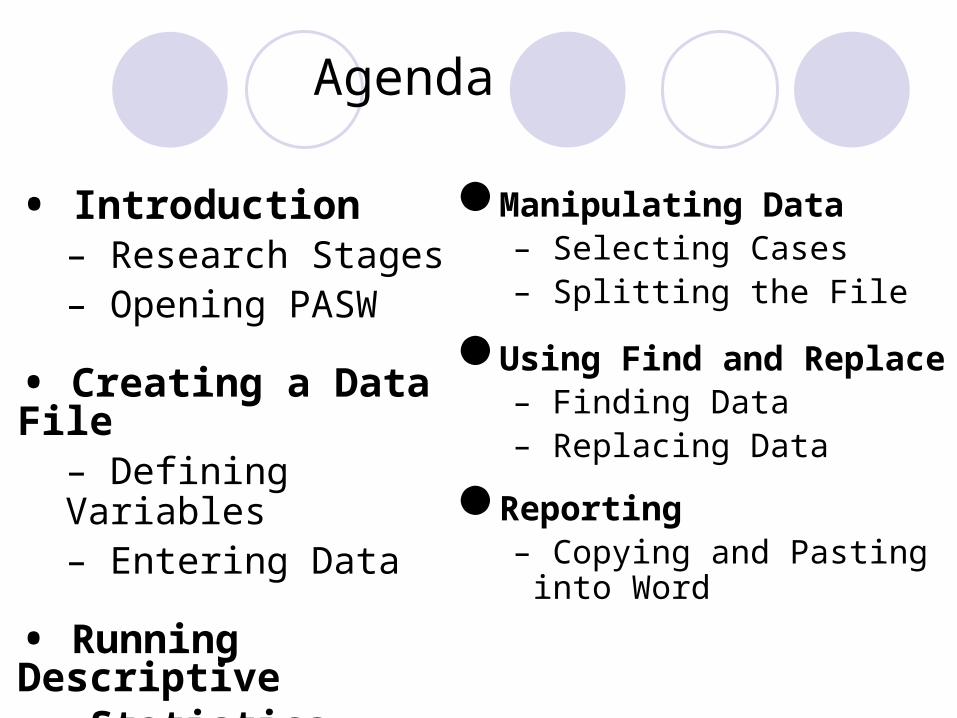
Agenda
Manipulating Data– Selecting Cases– Splitting the File
Using Find and Replace– Finding Data – Replacing Data
Reporting– Copying and Pasting into
Word
• Introduction– Research Stages– Opening PASW
• Creating a Data File– Defining Variables– Entering Data
• Running Descriptive Statistics
– Frequency Analysis– Crosstabs

What is PASW?
Predictive
Analytics
Software

What is Statistics?
Statistics is a set of mathematical techniques used to:
• Summarize research data. • Determine whether the data supports the
researcher’s hypothesis.

Research Stages
1. Planning and Designing
2. Data Collecting
3. Data Analyzing
4. Data Reporting

Format of Questions
Fixed Response Open-Ended Response
e.g.
PROs
CONs
Easy to enter Easy to construct
Difficult to constructDifficult to enter
Invalid responses
What is your gender?a. Female b. Male
What is your gender?( _____________ )
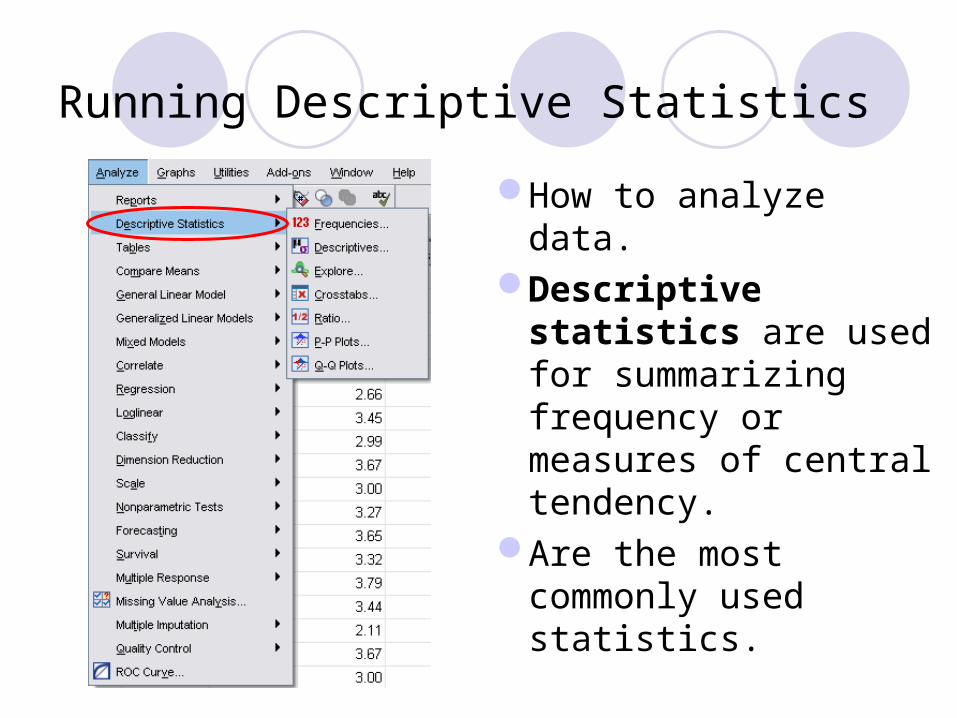
Running Descriptive Statistics
How to analyze data.Descriptive
statistics are used for summarizing frequency or measures of central tendency.
Are the most commonly used statistics.

Frequency Analysis
Frequency shows the number of occurrences.Also calculates measures of central tendency,
such as the mean, median, mode, and others.

Research Question #1
What kind of computer do people prefer to own?

Crosstabs
Crosstabs are used to examine the relationship between two variables.
It shows the intersection between two variables and reveals how the two interact with each other.
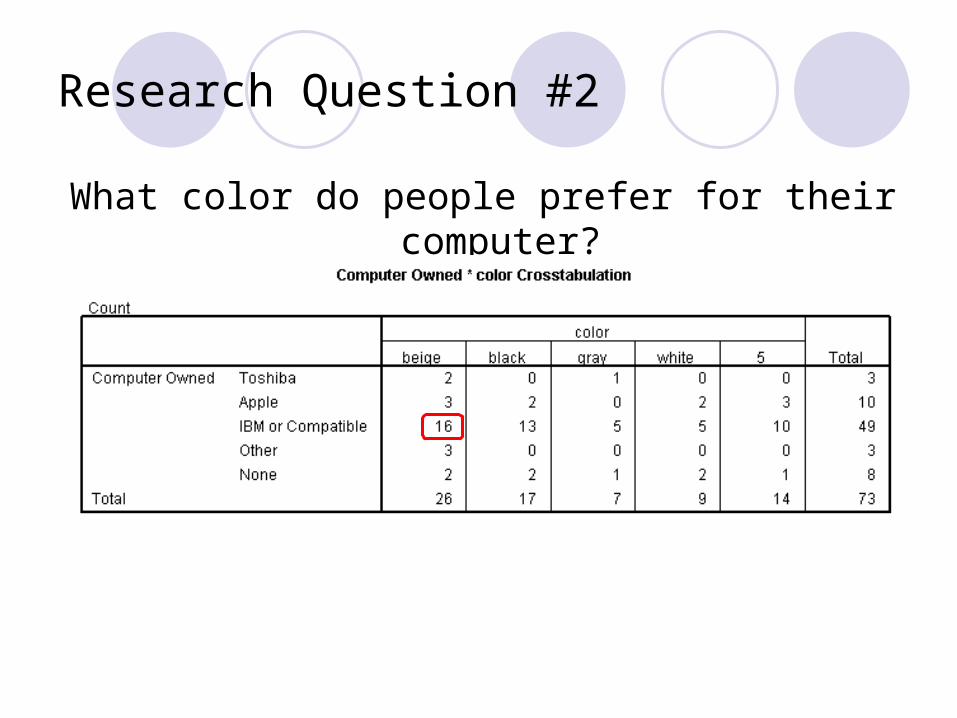
Research Question #2
What color do people prefer for their computer?

Improving Your Survey
What color do you like to have for your computer?1. Beige 2. Black 3. Gray 4. White 5. Other _______

Selecting Cases
Filter out and specify which variable to use for analysis with the select cases function.

Splitting the File
The split file function is used to compare the responses or performance differences by groups within one variable.
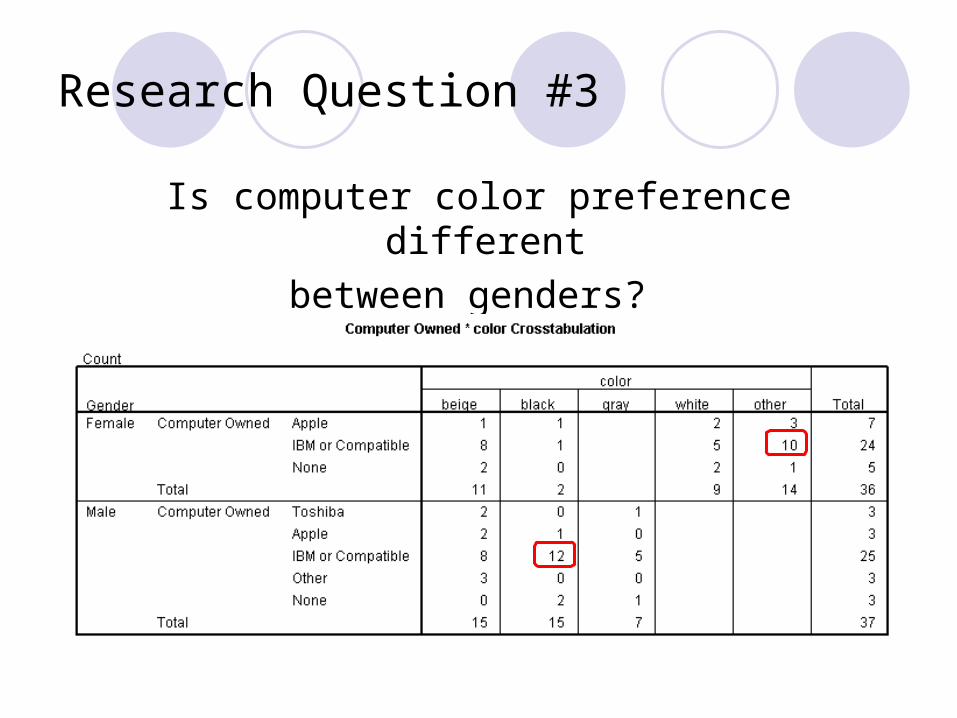
Research Question #3
Is computer color preference different between genders?
Part 2: Test of Significance
PASW Statistics 17 (SPSS 17)
ITS Training Programwww.youtube.com/mycsula
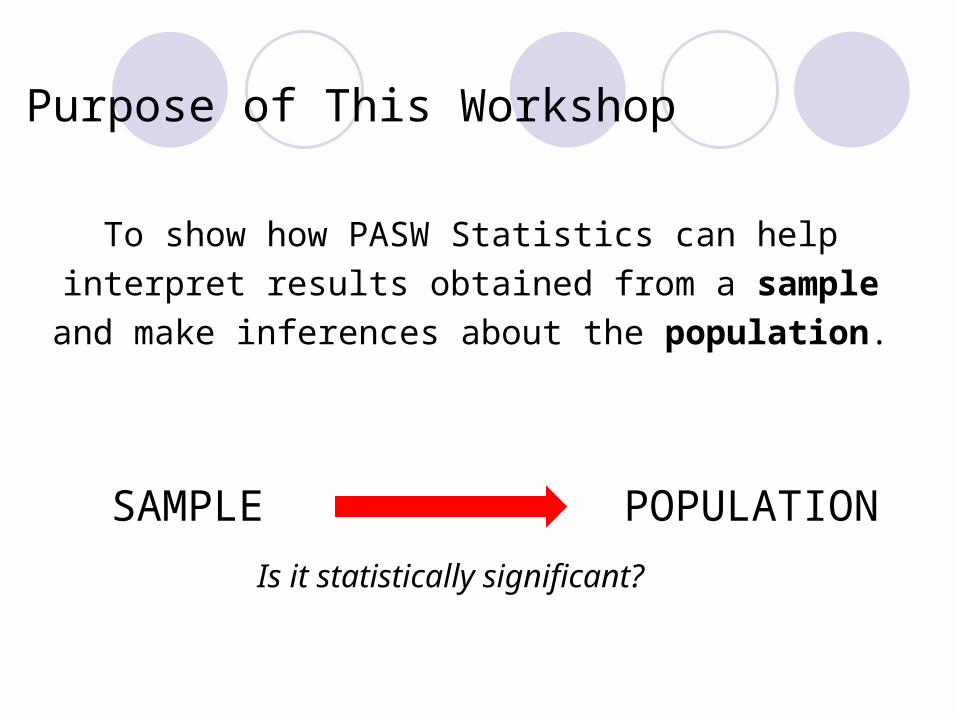
Purpose of This Workshop
To show how PASW Statistics can help interpret results obtained from a sample and
make inferences about the population.
SAMPLE POPULATIONIs it statistically significant?

Agenda
Using Null HypothesisRunning Tests of Significance
Correlations Paired-Samples T Test Independent-Samples T Test
Running Multiple Response SetsFrequencyCrosstabs
Merging Data Files

• A null hypothesis (H0) is a statistical hypothesis that is tested for possible rejection under the assumption that it is true.
• The purpose of most statistical tests is to determine if the obtained results provide a reason to conclude whether or not the differences are the result of random chance.
• Rejection of H0 leads to the alternative hypothesis H1.
Null Hypothesis

Null Hypothesis
The significance level (α) sets the standard for how extreme data must be before rejecting the H0.
To reject H0, data must meet a significance level (α) of 0.05.
α = 0.05 means data would have occurred by chance at most 5% of the time.

• If p-value (sig.) ≤ α, then reject H0.– Statistically significant
• If p-value (sig.) > α, then fail to reject H0.– Statistically non-significant
Hypothesis Testing
Take note that the result is always stated in relation to the null hypothesis, not the alternate.
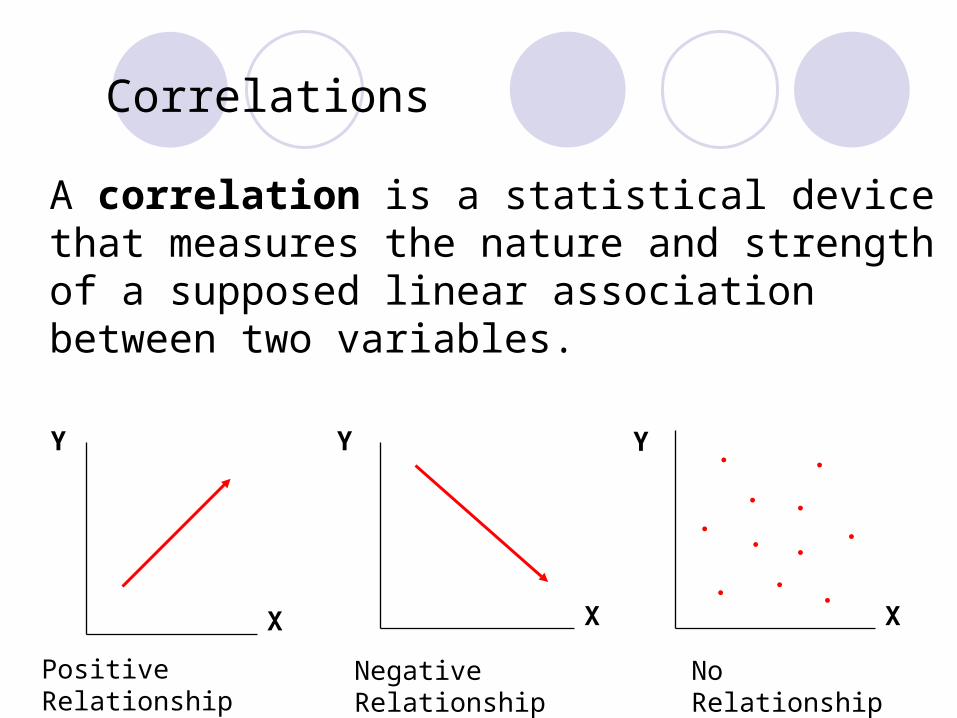
Correlations
No Relationship
Y
X
Negative Relationship
Y
X
Y
X
Positive Relationship
A correlation is a statistical device that measures the nature and strength of a supposed linear association between two variables.

Correlation Coefficient
r = + 0.0 to 1.0
Direction
Magnitude
The strength of the linear relationship is determined by the distance of the correlation
coefficient (r) from zero.
Research Question #1
Is there a relationship between academic performance and Internet access?
H0 = Internet access made no difference
H1 = Internet access made a different
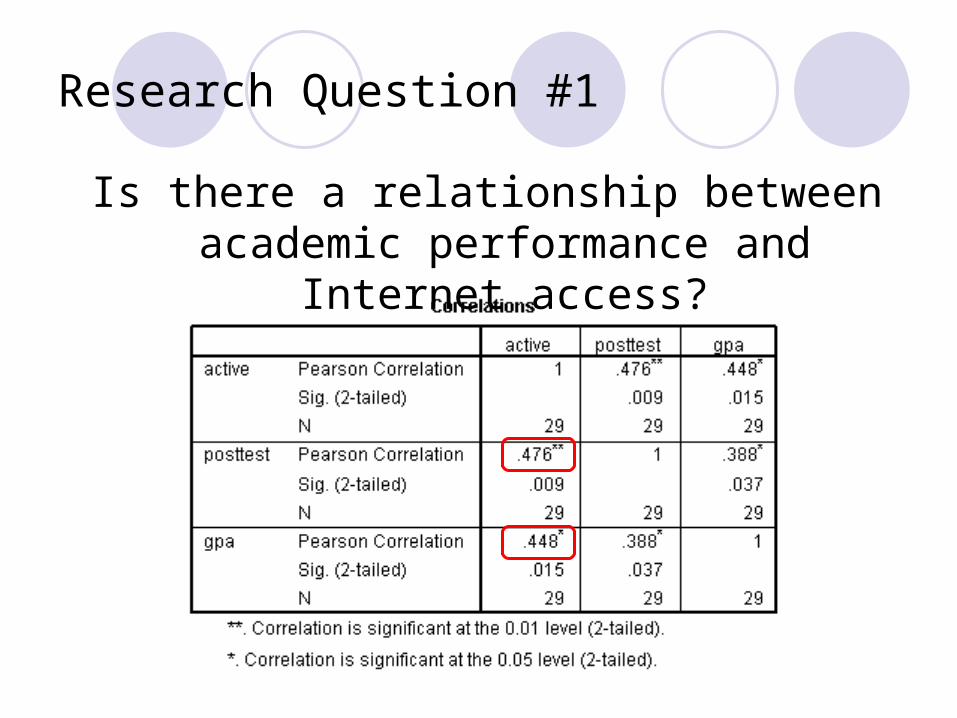
Research Question #1
Is there a relationship between academic performance and Internet access?

T test
A T test may be used to compare two group means using either one of the following:
• Within-participants design (a Paired-Samples T Test)
• Between-participants design (an Independent-Samples T Test)
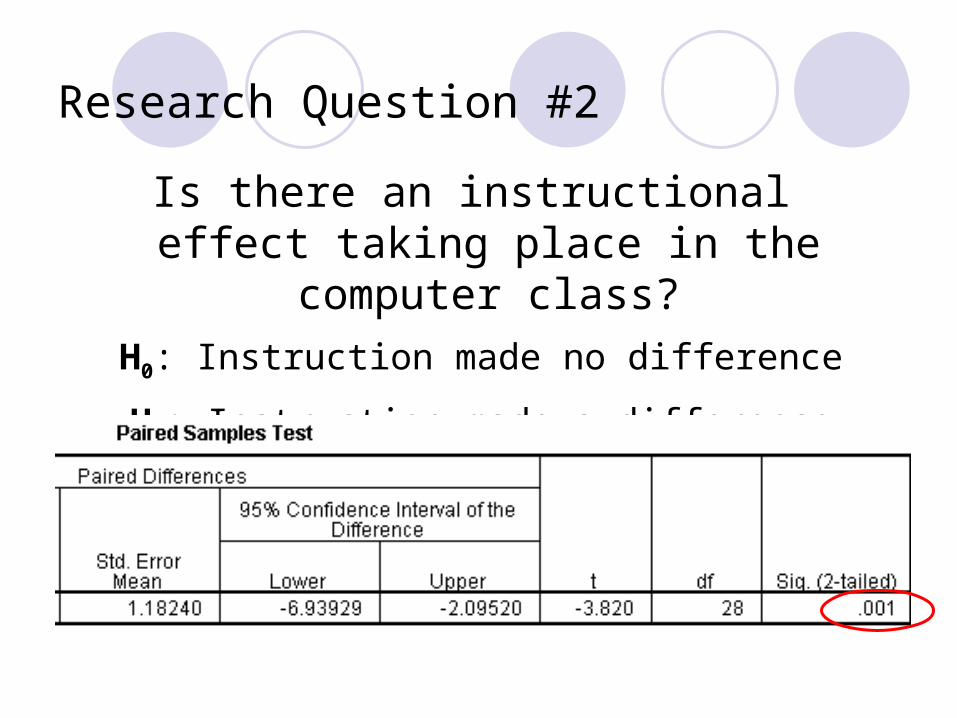
Research Question #2
Is there an instructional effect taking place in the computer class?
H0: Instruction made no difference
H1: Instruction made a difference

Research Question #3
Is there a difference in the average number of seedlings grown in the light and those grown in the dark?

Independent-Samples T Test
The first set of hypotheses is testing the variance, while the proceeding set is testing for the mean.
The variances have to be equal before we can determine if the means are equal.
H0: (µ (light) ≠ µ (dark) H1: (µ (light) ≠ µ (dark)
H0: Variance (light) = variance (dark)H1: Variance (light) ≠ variance (dark)

Research Question #3
Is there a difference in the average number of seedlings grown in the light and those grown in the dark?
H0: No difference whether grown in the light or dark
H1: A difference when grown in the light versus dark
Running Multiple Response Sets
Multiple response sets are used when respondents are allowed to select more than one answer in a single question.
By running a frequency analysis, the result provides an overall raw frequency for each answer.
Crosstabs can also be used to examine the relationship between the sets and other variables.

Merging Data Files

Merging Data Files
Useful for users who store each of their topics in separate files, and eventually need or want to combine them together.
This allows users to import data from one file into another.
Both sets of data (from each file) must contain a common identifier for each of the cases that the user wishes to combine.
An identifier identifies the correlating cases from the additional data files.
Part 3: Regression Analysis
PASW Statistics 17 (SPSS 17)
ITS Training Programwww.youtube.com/mycsula

Purpose of This Workshop
To show users how PASW Statistics can help in answering research questions or testing hypotheses by using regression.
To provide users with step-by-step instructions on how to perform regression analyses with PASW Statistics.

AgendaUsing Simple
RegressionScatter PlotPredicting Values of
Dependent VariablesPredicting This Year’s
SalesUsing Multiple
RegressionPredicting Values of
Dependent VariablesPredicting This Year’s
Sales
Transforming DataComputing
Using Polynomial RegressionRegression Analysis
Editing ChartsAdding a LineManipulating X & Y ScalesAdding a TitleAdding ColorsBackground Color
What Is Linear Regression?
Linear: Straight line.
Regression: Finds the model that minimizes the total variation in the data (i.e., the best fit).
Linear Regression: Can be divided into two categories:Simple regressionMultiple regression

What Is PolynomialRegression?
Polynomial: A finite length expression constructed from variables and constants.
Polynomial Regression: A special type of multiple regression used to determine the relationship between data (e.g., growth rate, progression rate).
Dependent and Independent Variables
Variables can be classified into two categories: independent and dependent variables.
An independent variable is a variable that influences the value of another variable.
A dependent variable is a variable whose values are influenced by another variable.
This is influence, not cause and effect.
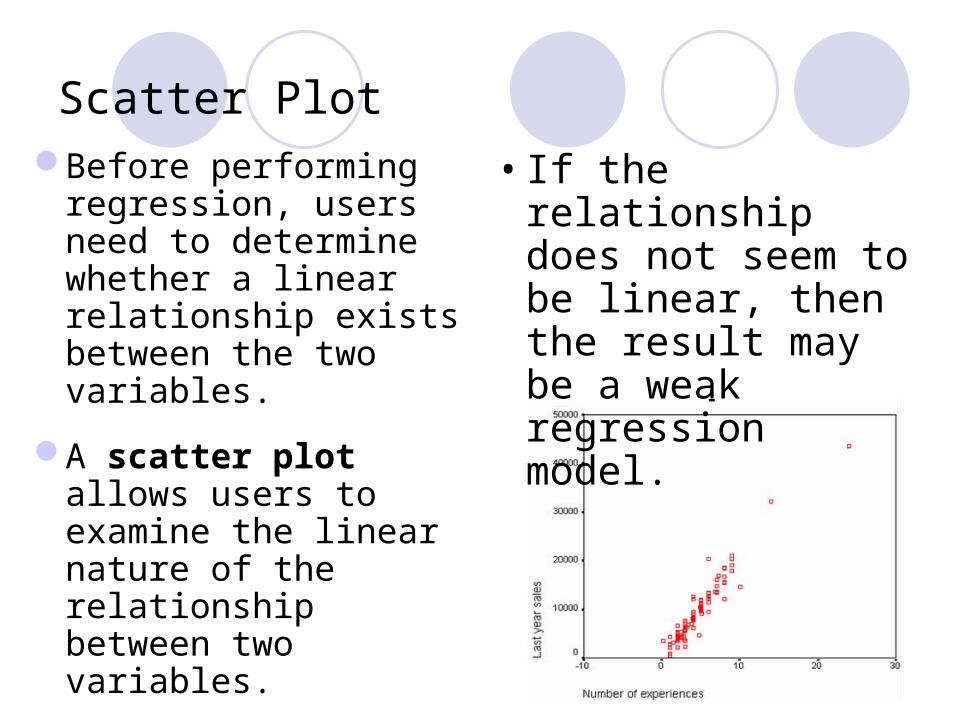
Scatter PlotBefore performing
regression, users need to determine whether a linear relationship exists between the two variables.
A scatter plot allows users to examine the linear nature of the relationship between two variables.
• If the relationship does not seem to be linear, then the result may be a weak regression model.

Scatter Plot
Create a scatter plot to determine if a linear relationship exists between variables.
Using Simple Regression
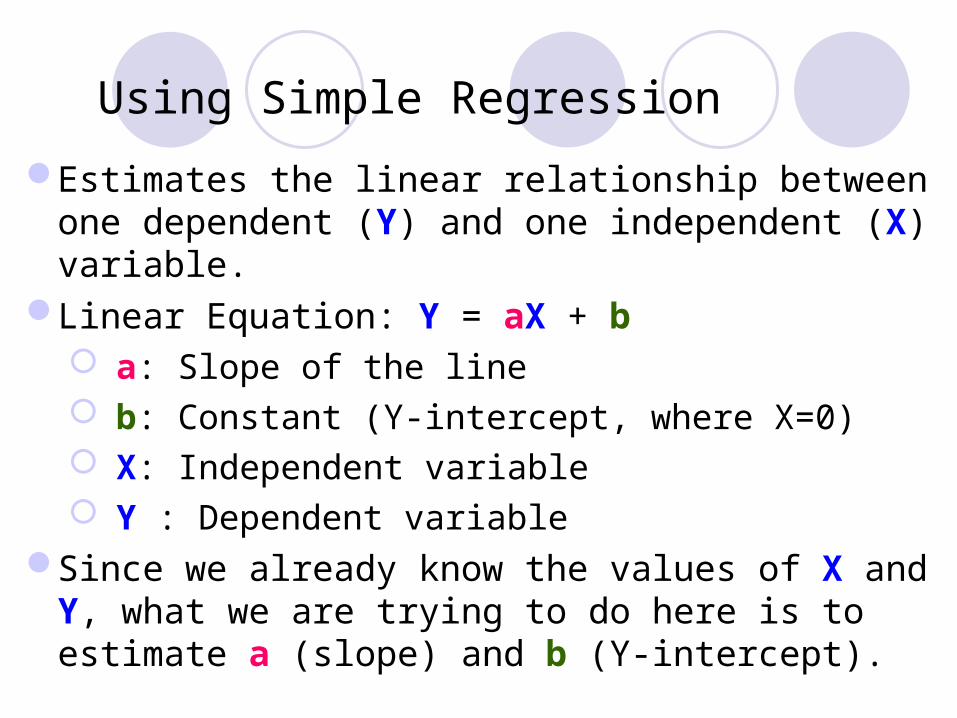
Estimates the linear relationship between one dependent (Y) and one independent (X) variable.
Linear Equation: Y = aX + b a: Slope of the line b: Constant (Y-intercept, where X=0) X: Independent variable Y : Dependent variable
Since we already know the values of X and Y, what we are trying to do here is to estimate a (slope) and b (Y-intercept).

Using Multiple Regression
Estimates the coefficients of the linear equation, involving more than one independent variable.
For example, users can predict a salesperson’s total annual sales (the dependent variable) based on independent variables, such as age, education, and years of experience.

Using Multiple Regression
Linear Equation: Z = aX + bY + c a & b: Slope coefficients c: Constant (Y-intercept) X & Y: Independent variables Z: Dependent variable

Computing
Most data transformations can be done with the Compute command.
Using this command, the data file can be manipulated to fit various statistical performances.
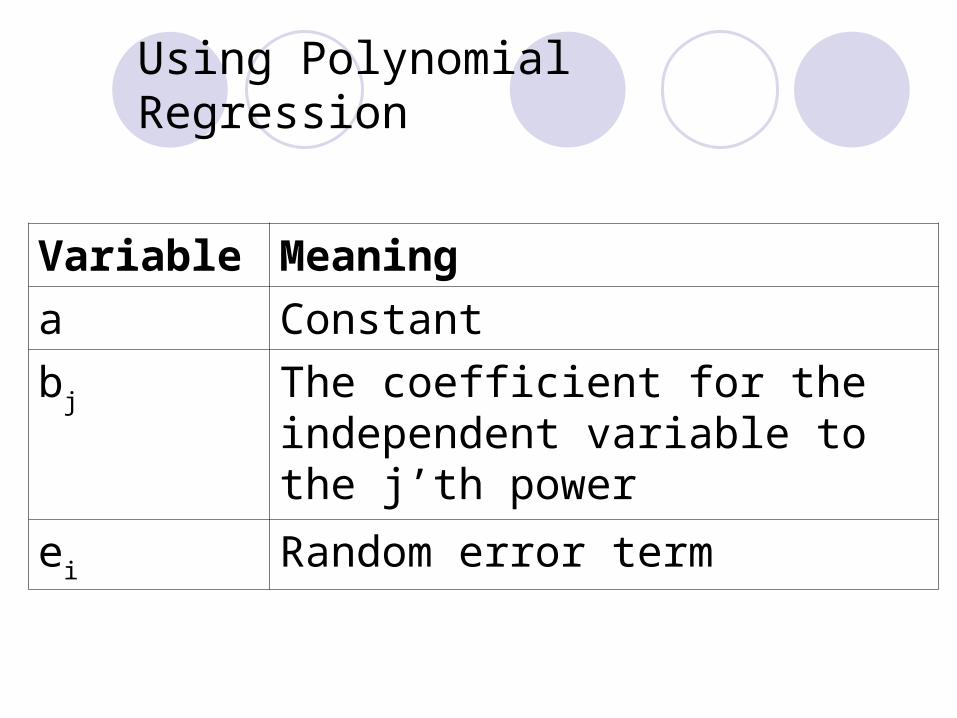
Using Polynomial Regression
Variable Meaninga Constantbj The coefficient for the
independent variable to the j’th power
ei Random error term

Editing ChartsAdding a Best Fit Line at Total

Editing Charts – Manipulating Scales

Editing Charts – Title and Gridlines
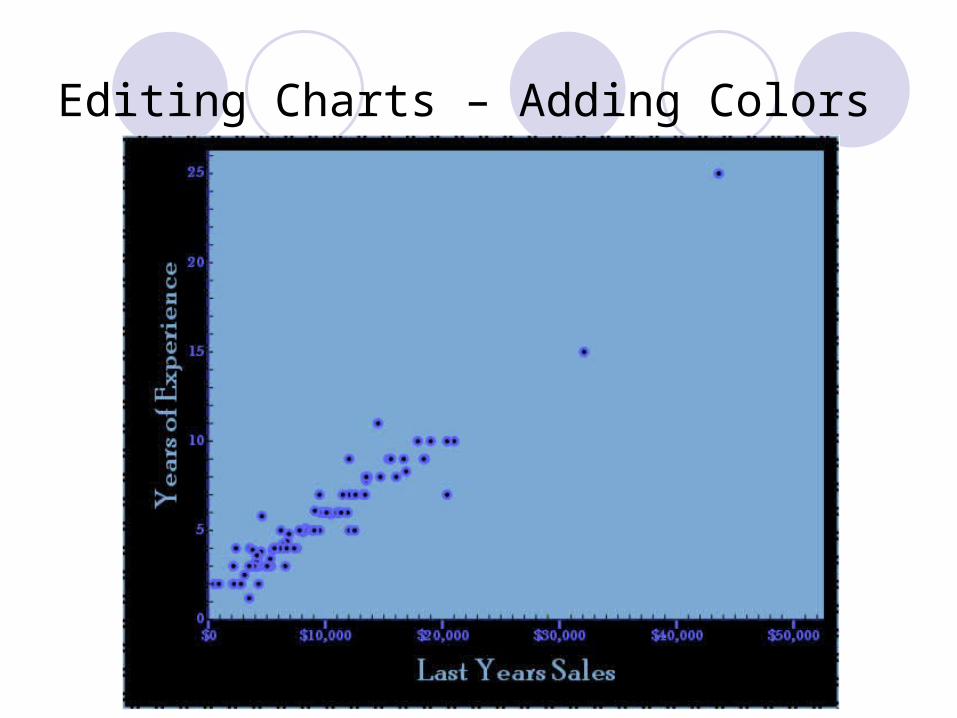
Editing Charts – Adding Colors

Part 4: Chi-Square and ANOVA
PASW Statistics 17 (SPSS 17)
ITS Training Programwww.youtube.com/mycsula

Purpose of This WorkshopTo show how PASW Statistics can help
answer research questions or test hypotheses by using the Chi-Square test and ANOVA.
To provide step-by-step instructions on how to perform the Chi-Square test and ANOVA with PASW Statistics.
To show how to import and export data using Microsoft Excel and PowerPoint.
To show how to use scripting in PASW Statistics.

AgendaUsing Chi-Square Test
Testing for Goodness-of-FitUsing One-Way ANOVAUsing Post Hoc TestsUsing Two-Way ANOVAImporting/Exporting Excel SpreadsheetsUsing Scripting in PASW Statistics

It analyzes data in order to examine if a frequency distribution for a given variable is consistent with expectations.
Chi-Square test for Goodness-of-Fit test: estimates how closely an observed distribution matches an expected distribution.
Using Chi-Square Test with Fixed Expected Values

Weight Cases
Before a Chi-Square test is run, weight cases should be used to identify and let PASW Statistics know what the observed values are.

Using Chi-Square Test with a Contiguous Subset

Using One-Way ANOVA
ANOVA: Analysis Of Variance.One-Way ANOVA can be thought of as a
generalization of the pooled t test.Produces an analysis for a quantitative
dependent variable affected by a single factor (independent variable).
Instead of dealing with two populations, we have more than two populations or treatments.

Using One-Way ANOVA

Using Post Hoc Tests
The null hypothesis in ANOVA is rejected when there are some differences in μ1, μ2, …, μx.
But to know where specifically these differences are, the post hoc test is used.
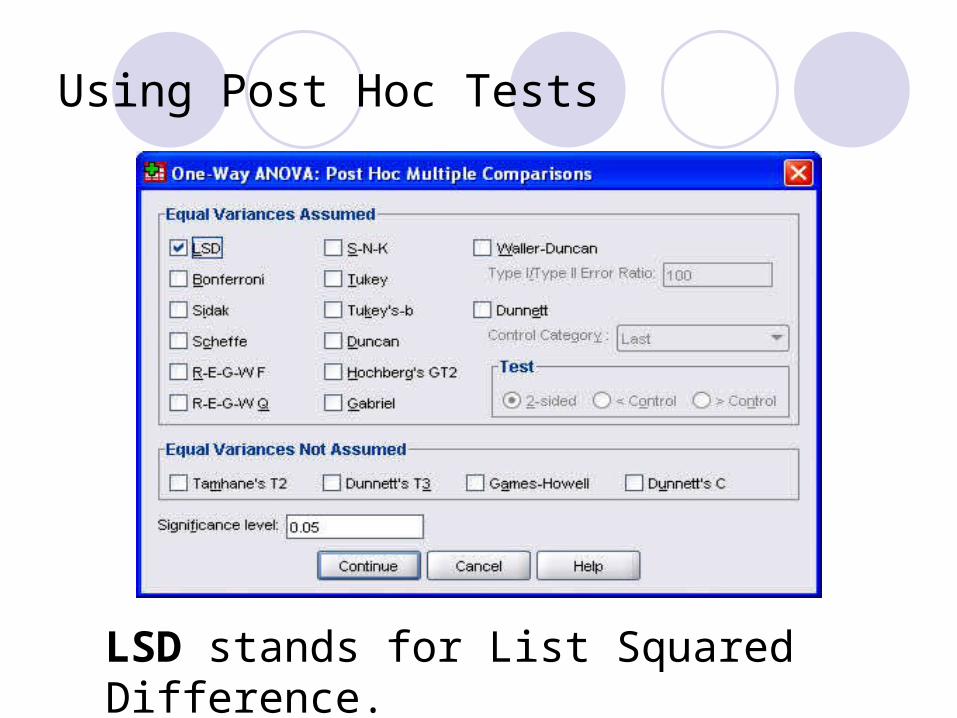
Using Post Hoc Tests
LSD stands for List Squared Difference.
Using Two-Way ANOVA
A Two-Way Analysis of Variance procedure produces an analysis for a quantitative dependent variable affected by more than one factor.
It also provides information about how variables interact or combine in the effect.
Advantages:More efficientHelps increase statistical power of the result

Importing/Exporting Data
Data can be imported into PASW Statistics from an Excel spreadsheet.
Data can be exported from PASW Statistics into an Excel spreadsheet, PowerPoint slides, etc.

Using Scripting in PASW Statistics
Used to capture commands that are used repeatedly.
This function simplifies working with multiple analyses on a consistent basis.
Can use different data files as long as the variables in the commands always have the same name.
Related Documents