An Introduction to An Introduction to Social Inequality Social Inequality Please take notes! Please take notes!

An Introduction to Social Inequality Please take notes!
Jan 01, 2016
Welcome message from author
This document is posted to help you gain knowledge. Please leave a comment to let me know what you think about it! Share it to your friends and learn new things together.
Transcript

An Introduction to Social An Introduction to Social InequalityInequality
Please take notes!Please take notes!

Social Stratification and Social Social Stratification and Social ClassesClasses
There are many types of inequality in our society• Social stratification = ranking of people or
groups according to their unequal access to scarce resources– Income, wealth = most important resources
• Social class = segment of society whose members hold similar amounts of resources and share values, norms, and an identifiable lifestyle

Breakdown of Social ClassesBreakdown of Social Classes
– Upper class (only 1% of the American population!)
– Middle class (40 to 50% of American population)
– Working class (lower-middle class) (~33% of population)
– Working poor (~13%)– Underclass (poverty stricken) (~12%)

Poverty in AmericaPoverty in America
• Approximately 13% of Americans are poverty-stricken
• Absolute poverty = the absences of enough money to secure life’s necessities
• Relative poverty* = a measure of poverty based on economic disparity between those at the bottom of a society and the rest of society
• In the U.S. the poverty level is set at $22,300 total annual income for a family of 4 (as of 2008)

Relative Poverty*Relative Poverty*
Better definition?
“When a person’s income does not meet the needs of society”.

Poverty RatesPoverty Rates
• ~27% African-Americans
• ~26% Hispanic/Latino
• ~9% Whites
• ~12% Asians

Racial and Ethnic InequalityRacial and Ethnic InequalityRace and ethnic relations can manifest themselves in two
ways:
1. Assimilation= blending in or fusing together• Does this happen at Yorktown, more or less?
or…2. Conflict
• Genocide (extreme!)• Subjugation (minority group denied equal access to
society) Examples: “Jim Crow” era, hate crimes
• Population transfer (relocation) Example: “Trail of Tears”

Other types of inequality?Other types of inequality?
• Gender inequality
• Sex (or sex/gender identity) inequality
• Ageism
0%
10%
20%
30%
40%
50%
60%
70%
80%
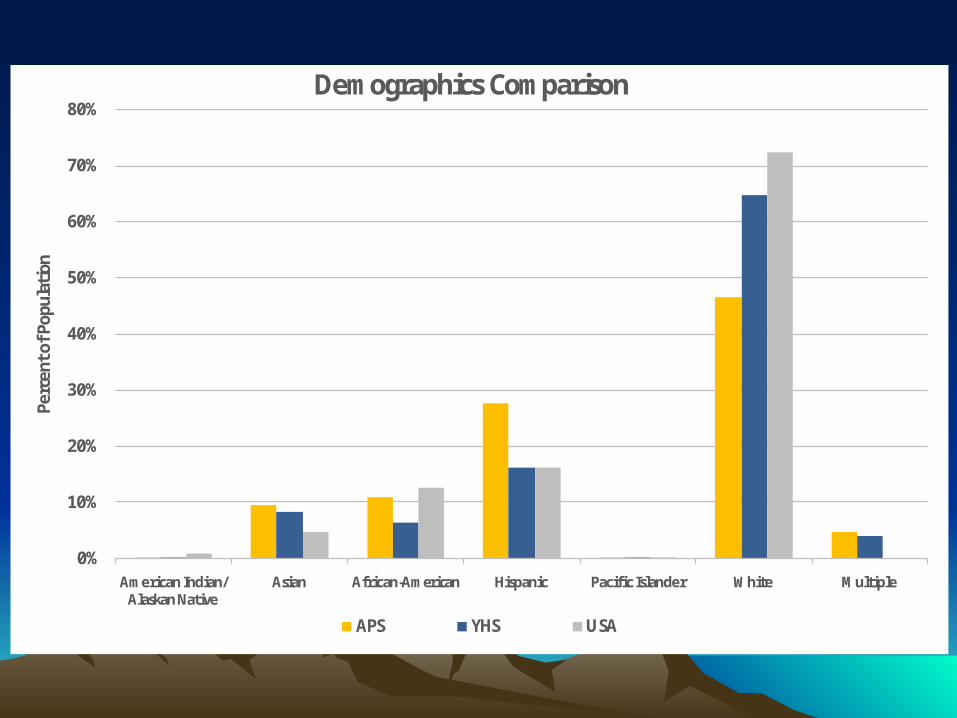
American Indian/Alaskan Native
Asian African-American Hispanic Pacific Islander White Multiple
Perc
ent o
f Pop
ulati
on
Demographics Comparison
APS YHS USA

0%
5%
10%
15%
20%
25%
30%
35%
40%
45%
50%
American Indian/Alaskan Native
Asian African-American Hispanic Pacific Islander White Multiple
Perc
ent o
f Pop
ulati
on
Demographics: Arlington Public Schools
APS

0%
10%
20%
30%
40%
50%
60%
70%
American Indian/Alaskan Native
Asian African-American Hispanic Pacific Islander White Multiple
Perc
ent o
f Pop
ulati
on
Demographics: Yorktown High School
YHS

0%
10%
20%
30%
40%
50%
60%
70%
80%
American Indian/Alaskan Native
Asian African-American Hispanic Pacific Islander White Multiple
Perc
ent o
f Pop
ulati
on
Demographics: United States of America
USA
Related Documents