1 An Introduction to Data Mining Kurt Thearling, Ph.D. www. thearling .com

An Introduction to Data Mining by Kurt Thearling
Jan 21, 2015
Welcome message from author
This document is posted to help you gain knowledge. Please leave a comment to let me know what you think about it! Share it to your friends and learn new things together.
Transcript
1
An Introduction to Data Mining
Kurt Thearling, Ph.D.www.thearling.com
2
Outline
— Overview of data mining— What is data mining?
— Predictive models and data scoring
— Real-world issues
— Gentle discussion of the core algorithms and processes
— Commercial data mining software applications— Who are the players?
— Review the leading data mining applications
— Presentation & Understanding— Data visualization: More than eye candy
— Build trust in analytic results

3
— A PDF version of this presentation: click here
—Good overview book:—Data Mining Techniques
by Michael Berry and Gordon Linoff
— Web:— My web site (recommended books, links, white papers, …)
> http://www.thearling.com
— Knowledge Discovery Nuggets
> http://www.kdnuggets.com
— DataMine Mailing List— [email protected]
— send message “subscribe datamine-l”
Resources

4
A Problem...
— You are a marketing manager for a brokerage company
— Problem: Churn is too high
> Turnover (after six month introductory period ends) is 40%
— Customers receive incentives (average cost: $160)
when account is opened
— Giving new incentives to everyone who might leave is very
expensive (as well as wasteful)
— Bringing back a customer after they leave is both difficult and costly

5
— One month before the end of the introductory period is
over, predict which customers will leave
— If you want to keep a customer that is predicted to churn, offer
them something based on their predicted value
> The ones that are not predicted to churn need no attention
— If you don’t want to keep the customer, do nothing
— How can you predict future behavior?
— Tarot Cards
— Magic 8 Ball
… A Solution

6
The Big Picture
— Lots of hype & misinformation about data mining out there
— Data mining is part of a much larger process
— 10% of 10% of 10% of 10%
— Accuracy not always the most important measure of data mining
— The data itself is critical
— Algorithms aren’t as important as some people think
— If you can’t understand the patterns discovered with data mining, you are unlikely to act on them (or convince others to act)

7
— The automated extraction of hidden predictive information from
(large) databases
— Three key words:
Automated
Hidden
Predictive
— Implicit is a statistical methodology
— Data mining lets you be proactive
—Prospective rather than Retrospective
Defining Data Mining
8
Goal of Data Mining
— Simplification and automation of the overall statistical
process, from data source(s) to model application
— Changed over the years
— Replace statistician Better models, less grunge work
— 1 + 1 = 0
— Many different data mining algorithms / tools available
— Statistical expertise required to compare different techniques
— Build intelligence into the software

9
Data Mining Is…
• Decision Trees
• Nearest Neighbor Classification
• Neural Networks
• Rule Induction
• K-means Clustering
10
Data Mining is Not ...
— Data warehousing
— SQL / Ad Hoc Queries / Reporting
— Software Agents
— Online Analytical Processing (OLAP)
— Data Visualization

11
Convergence of Three Technologies

12
1. Increasing Computing Power
— Moore’s law doubles computing power every 18 months
— Powerful workstations became common
— Cost effective servers (SMPs) provide parallel processing to
the mass market
— Interesting tradeoff:
— Small number of large analyses vs. large number of small analyses
13
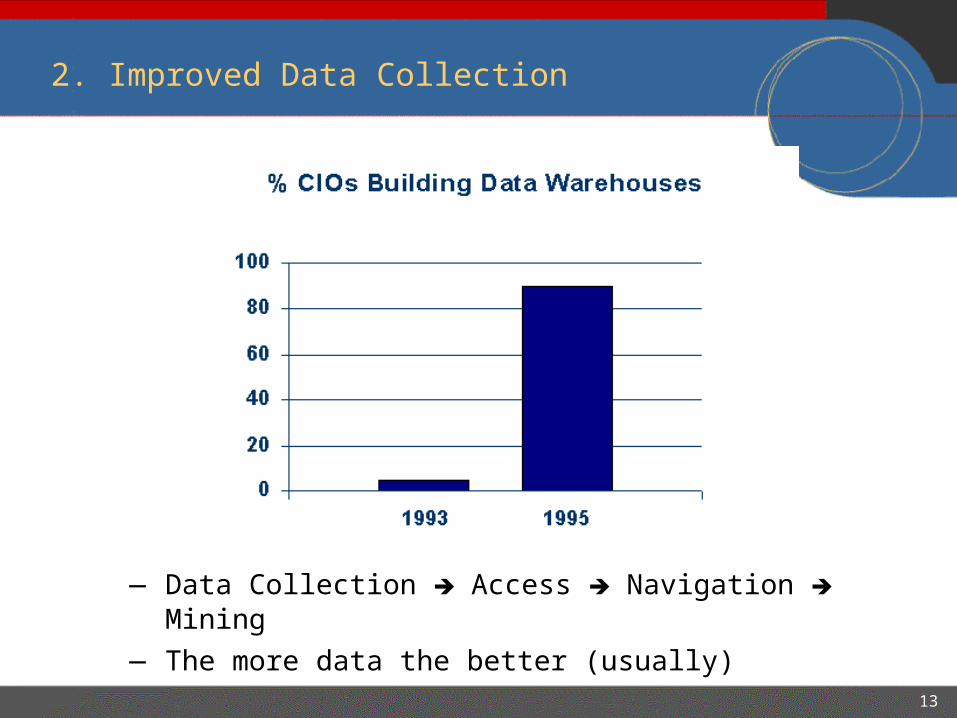
— Data Collection Access Navigation Mining
— The more data the better (usually)
2. Improved Data Collection
14
— Techniques have often been waiting for computing
technology to catch up
— Statisticians already doing “manual data mining”
— Good machine learning is just the intelligent application of
statistical processes
— A lot of data mining research focused on tweaking existing
techniques to get small percentage gains
3. Improved Algorithms
15
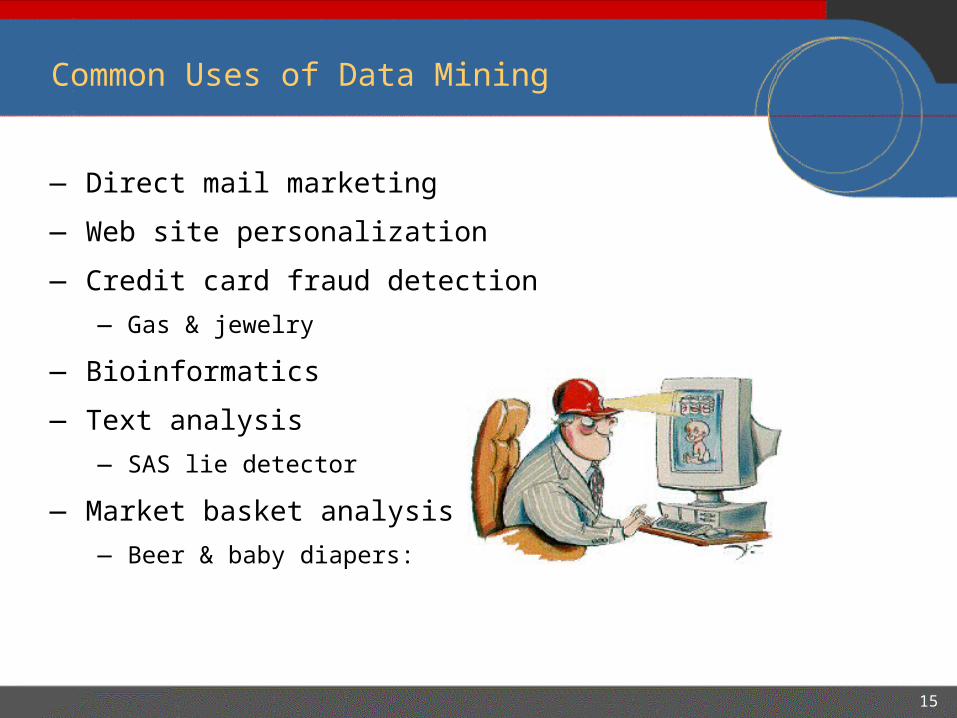
Common Uses of Data Mining
— Direct mail marketing
— Web site personalization
— Credit card fraud detection
— Gas & jewelry
— Bioinformatics
— Text analysis
— SAS lie detector
— Market basket analysis
— Beer & baby diapers:
16
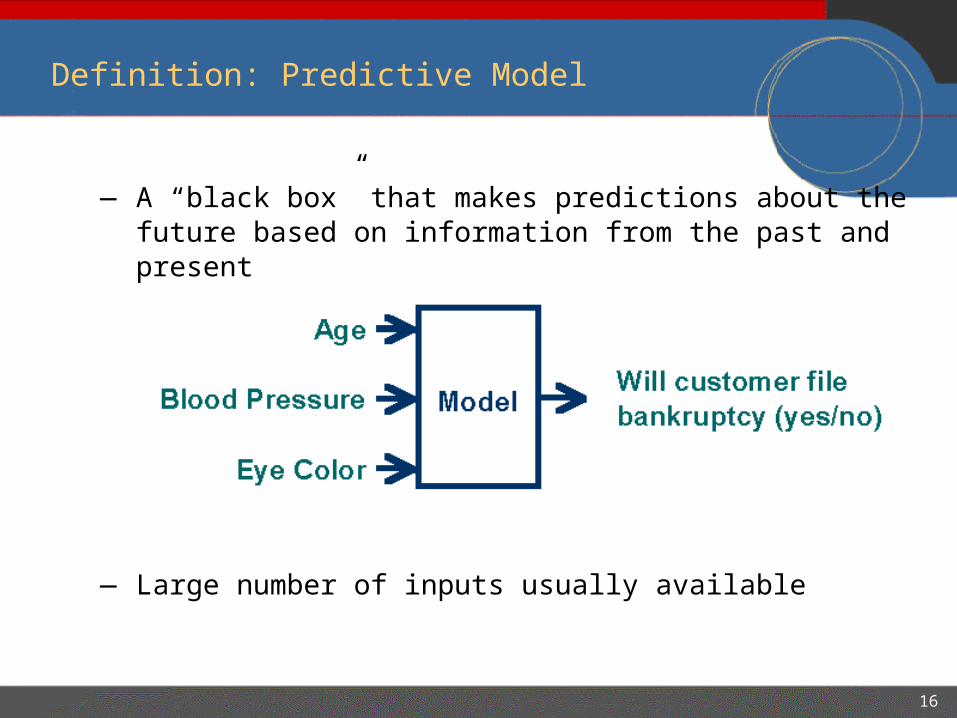
Definition: Predictive Model
— A “black box” that makes predictions about the future based on information from the past and present
— Large number of inputs usually available

17
— Some models are better than others
— Accuracy
— Understandability
— Models range from “easy to understand” to incomprehensible
— Decision trees
— Rule induction
— Regression models
— Neural Networks
Easier
Harder
Models
18
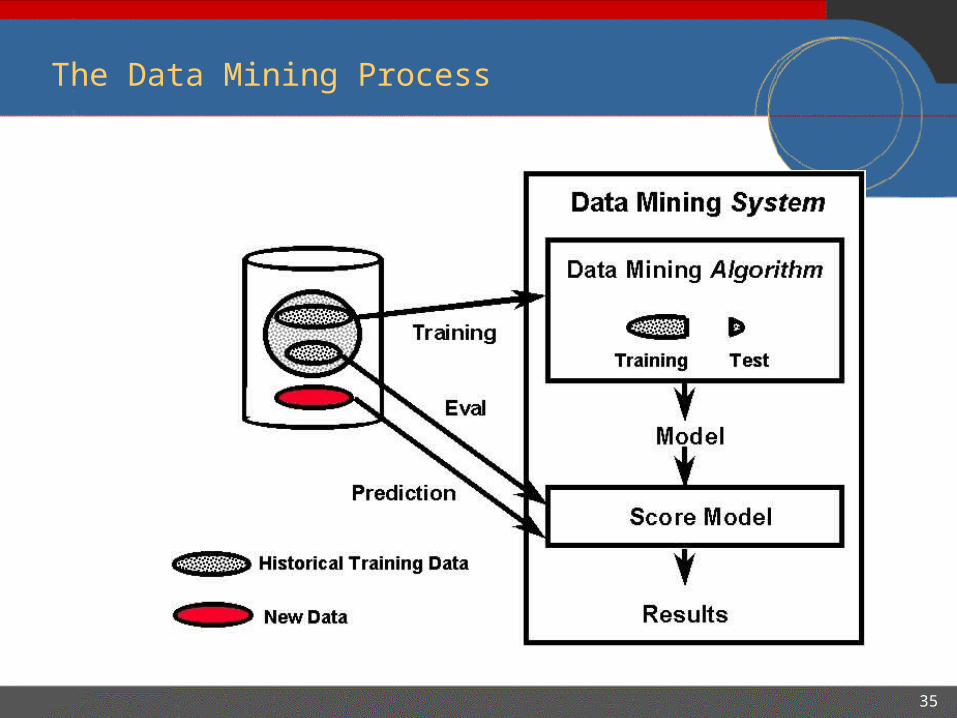
Scoring
— The workhorse of data mining
— A model needs only to be built once but it can be used over and over
— The people that use data mining results are often different from the systems people that build data mining models
— How do you get a model into the hands of the person who will be using it?
— Issue: Coordinating data used to build model and the data scored by that model
— Is the data the same?
— Is consistency automatically enforced?

19
— Qualitative— Provide insight into the data you are working with
> If city = New York and 30 < age < 35 …
> Important age demographic was previously 20 to 25
> Change print campaign from Village Voice to New Yorker
— Requires interaction capabilities and good visualization
— Quantitative— Automated process
— Score new gene chip datasets with error model every night at midnight
— Bottom-line orientation
Two Ways to Use a Model
20
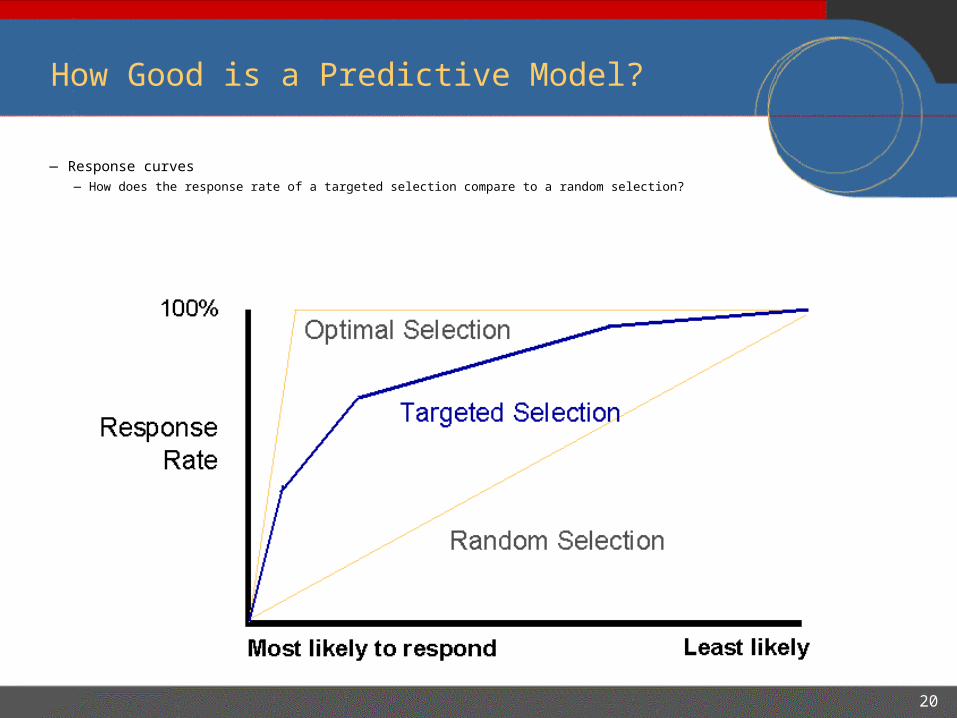
How Good is a Predictive Model?
— Response curves— How does the response rate of a targeted selection compare to a random selection?

21
Lift Curves
— Lift
— Ratio of the targeted response rate and the
random response rate (cumulative slope of response line)
— Lift > 1 means better than random

22
Receiver Operating Characteristic Curves
23
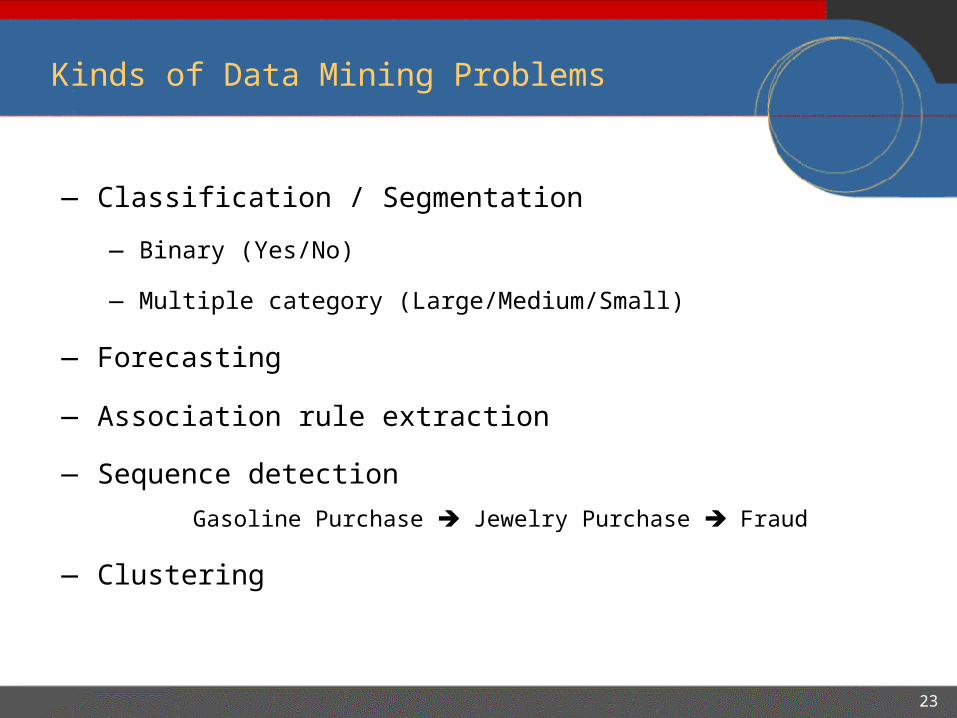
Kinds of Data Mining Problems
— Classification / Segmentation
— Binary (Yes/No)
— Multiple category (Large/Medium/Small)
— Forecasting
— Association rule extraction
— Sequence detection
Gasoline Purchase Jewelry Purchase Fraud
— Clustering
24
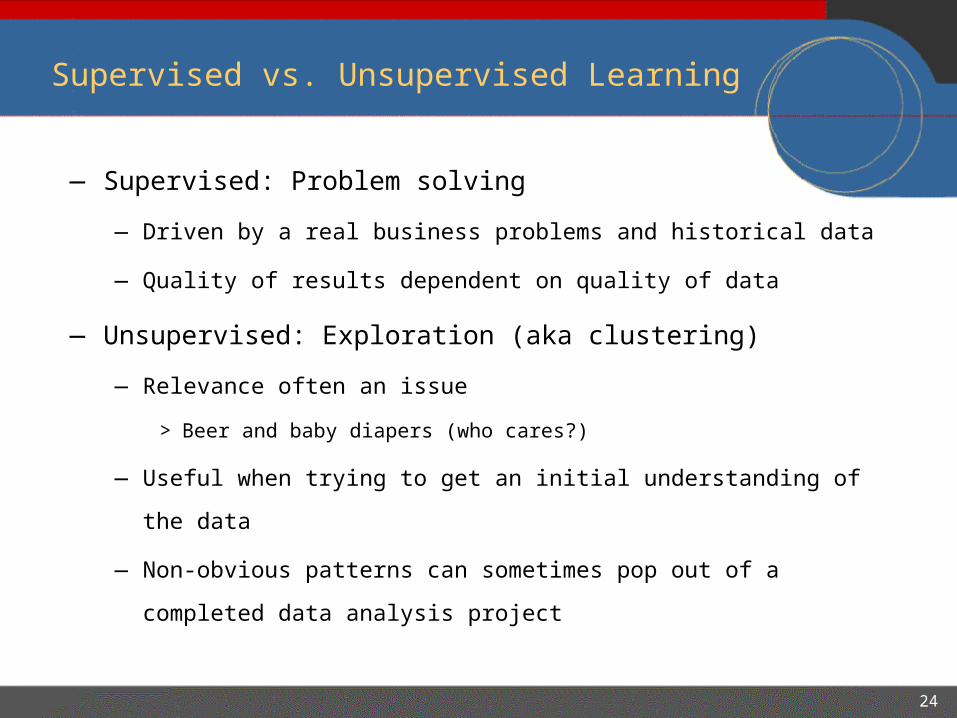
Supervised vs. Unsupervised Learning
— Supervised: Problem solving
— Driven by a real business problems and historical data
— Quality of results dependent on quality of data
— Unsupervised: Exploration (aka clustering)
— Relevance often an issue
> Beer and baby diapers (who cares?)
— Useful when trying to get an initial understanding of the data
— Non-obvious patterns can sometimes pop out of a completed data
analysis project

25
Clustering of Gene Markers
— Patients clustered based on survival
26
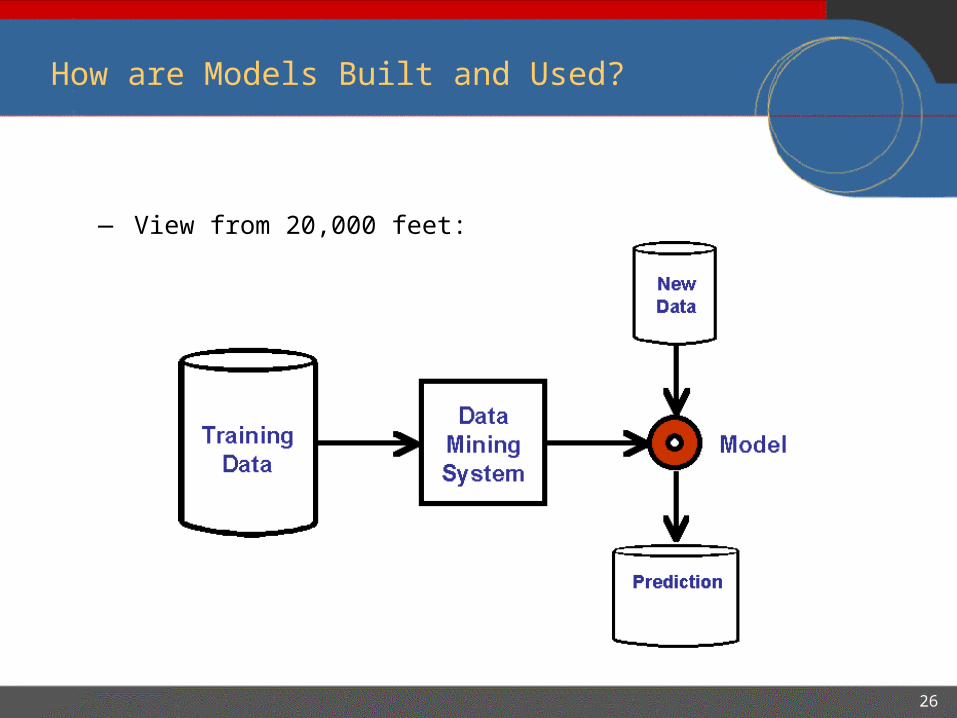
How are Models Built and Used?
— View from 20,000 feet:

27
What the Real World Looks Like
28
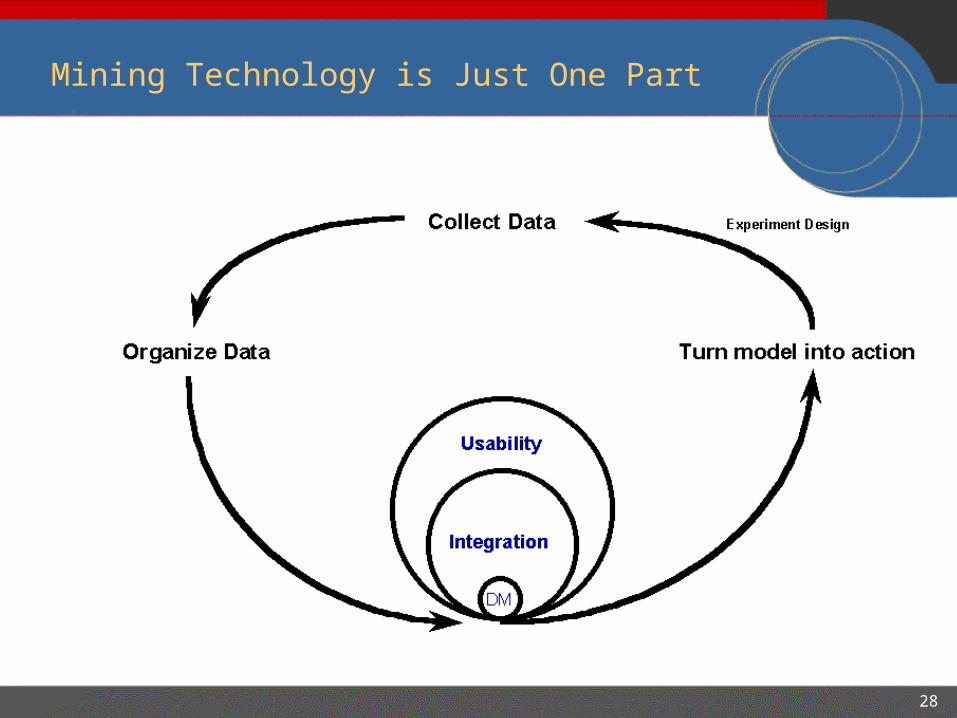
Mining Technology is Just One Part
29
Data Mining Fits into a Larger Process
— Easy in a ten person company, harder in a 50,000 person organization with offices around the world
— Run-of-the-mill office politics— Control of budget, personnel
— Data ownership
— Legal issues
— Application specific issues— Goals need to be identified
— Data sources & segments need to be defined
— Workflow management is one option to deal with complexity— Compare this to newspaper publishing systems, or more recently,
web content management
> Editorial & advertising process flow
30
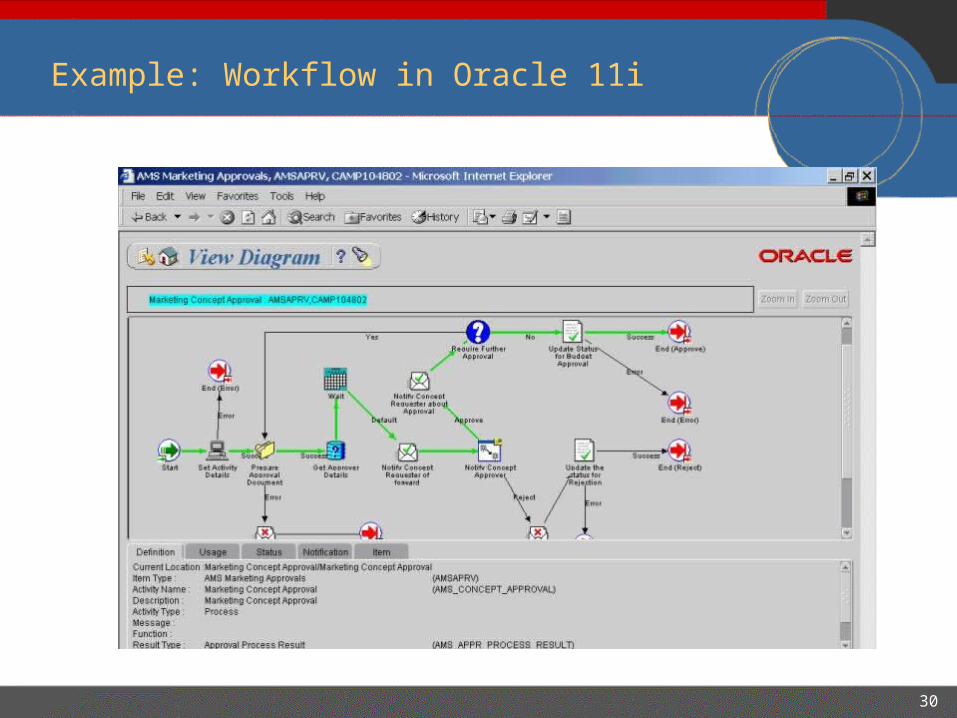
Example: Workflow in Oracle 11i
31
What Caused this Complexity?
— Volume— Much more data
> More detailed data
> External data sources (e.g., Acxiom, …)
— Many more data segments
— Speed— Data flowing much faster (both in and out)
— Errors can be easily introduced into the system
> “I thought a 1 represented patients who didn’t respond to treatment”
> “Are you sure it was table X23Jqqiud3843, not X23Jqguid3483?”
— Desire to include business inputs to the process— Financial constraints
32
Legal and Ethical Issues
— Privacy Concerns
— Becoming more important
— Will impact the way that data can be used and analyzed
— Ownership issues
— European data laws will have implications on US
— Government regulation of particular industry segments
— FDA rules on data integrity and traceability
— Often data included in a data warehouse cannot legally be
used in decision making process
— Race, Gender, Age
— Data contamination will be critical
33
Data is the Foundation for Analytics
— If you don’t have good data, your analysis will suffer
— Rich vs. Poor
— Good vs. Bad (quality)
— Missing data
— Sampling
— Random vs. stratified
— Data types
— Binary vs. Categorical vs. Continuous
— High cardinality categorical (e.g., zip codes)
— Transformations
34
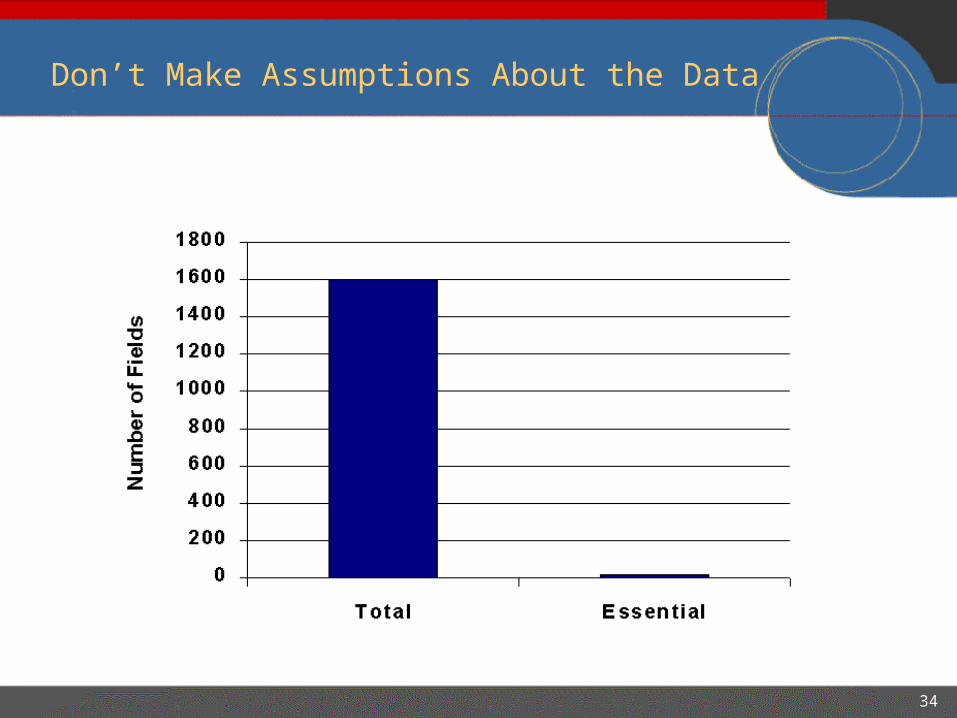
Don’t Make Assumptions About the Data
35
The Data Mining Process
36
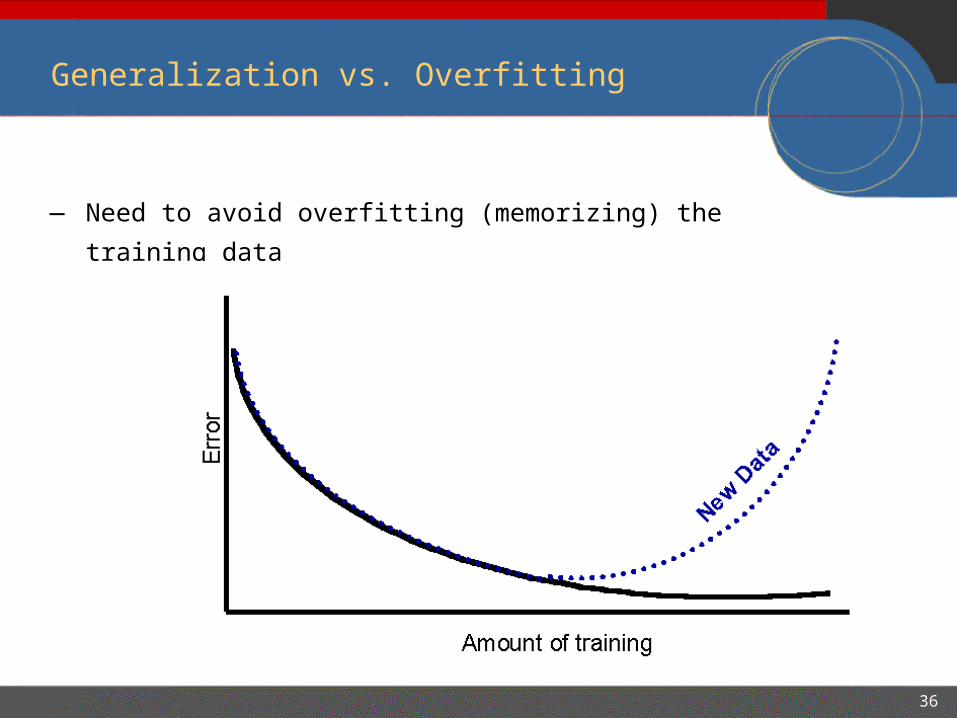
Generalization vs. Overfitting
— Need to avoid overfitting (memorizing) the training data

37
Cross Validation
— Break up data into groups of the same size
— Hold aside one group for testing and use the rest to build
model
— Repeat
38
Some Popular Data Mining Algorithms
— Supervised
— Regression models
— k-Nearest-Neighbor
— Neural networks
— Rule induction
— Decision trees
— Unsupervised
— K-means clustering
— Self organized maps
39
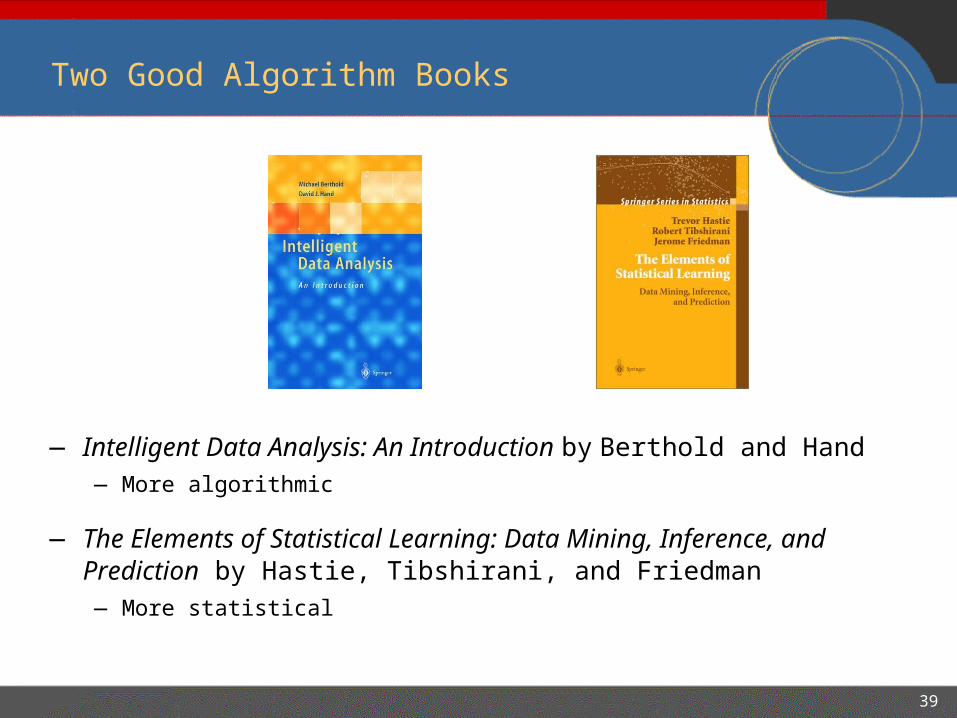
— Intelligent Data Analysis: An Introduction by Berthold and Hand— More algorithmic
— The Elements of Statistical Learning: Data Mining, Inference, and Prediction by Hastie, Tibshirani, and Friedman— More statistical
Two Good Algorithm Books
40
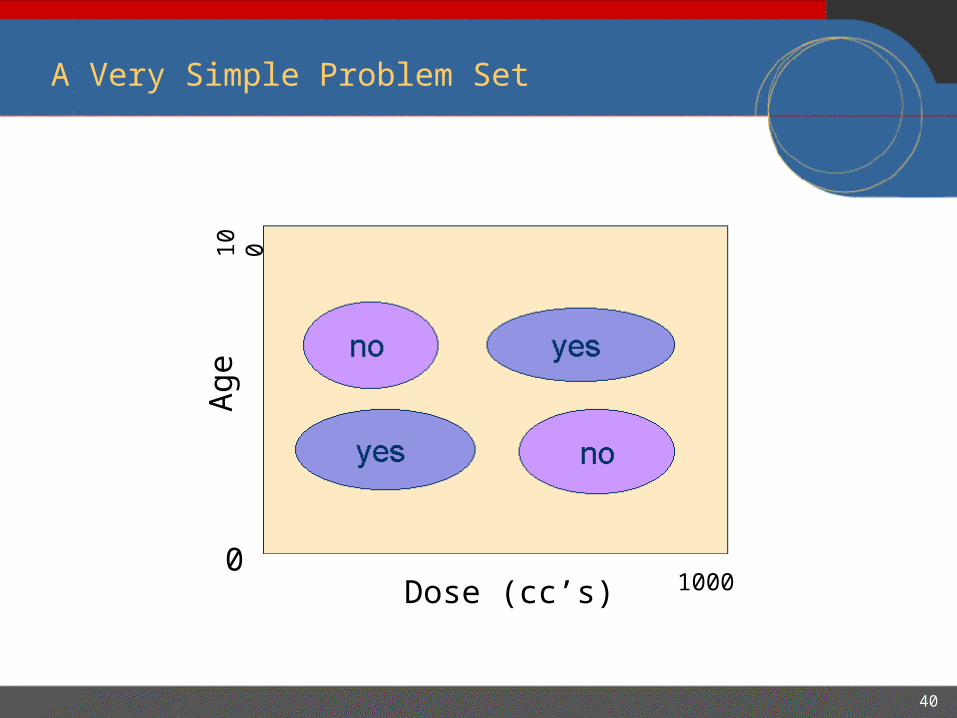
A Very Simple Problem Set
Age
Dose (cc’s)
100
10000
41
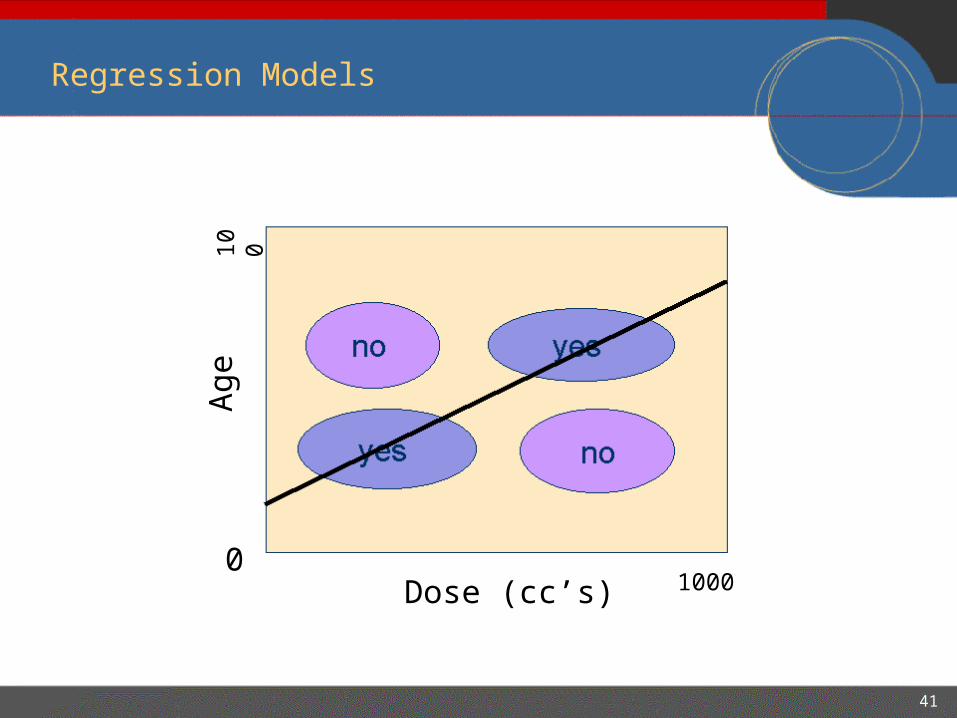
Regression Models
Age
Dose (cc’s)
100
10000

42
Regression Models
Age
Dose (cc’s)
100
10000
43
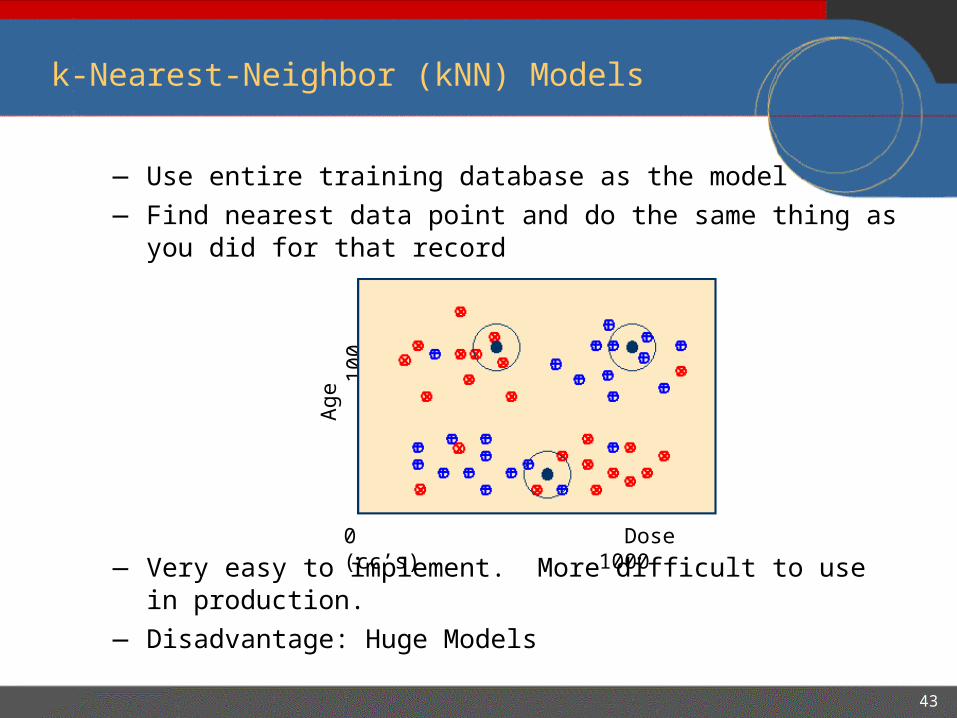
k-Nearest-Neighbor (kNN) Models
— Use entire training database as the model
— Find nearest data point and do the same thing as you did for that record
— Very easy to implement. More difficult to use in production.
— Disadvantage: Huge Models
Age
100
0 Dose (cc’s) 1000

44
Time Savings with kNN
45
— Model generation:
— What does “near” mean computationally?
— Need to scale variables for effect
— How is voting handled?
— Confidence Function
— Conditional probabilities used to calculate weights
— Optimization of this process can be mechanized
Developing a Nearest Neighbor Model

46
— Weights:
— Age: 1.0
— Dose: 0.2
— Distance =
— Voting: 3 out of 5 Nearest Neighbors (k = 5)
— Confidence = 1.0 - D(v) / D(v’)
Age + Dose22
Example of a Nearest Neighbor Model
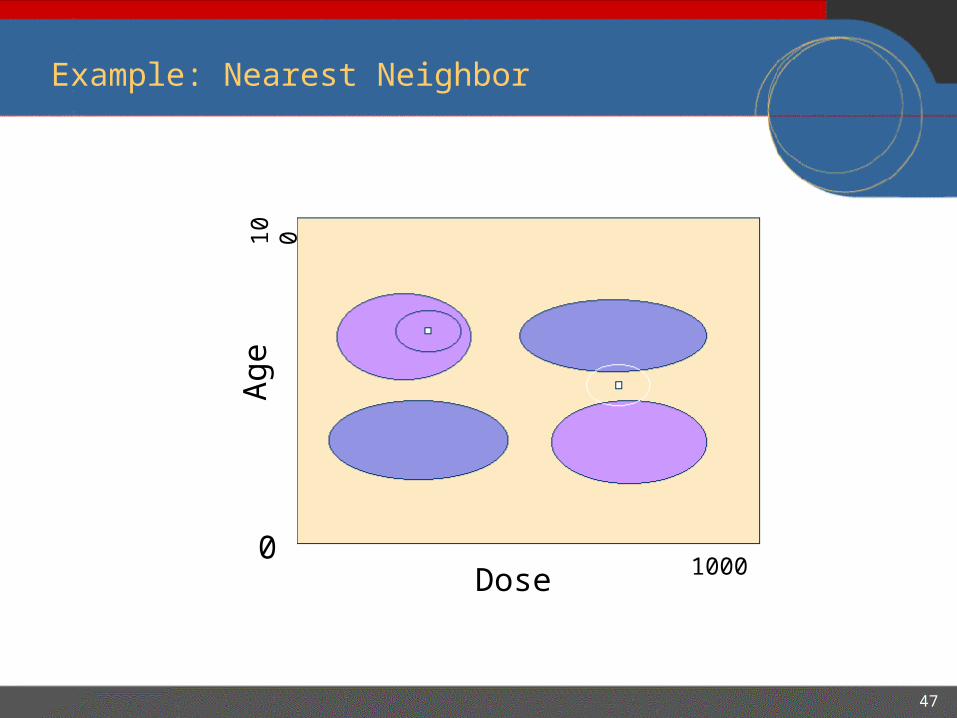
47
Example: Nearest Neighbor
Age
Dose
100
10000
48
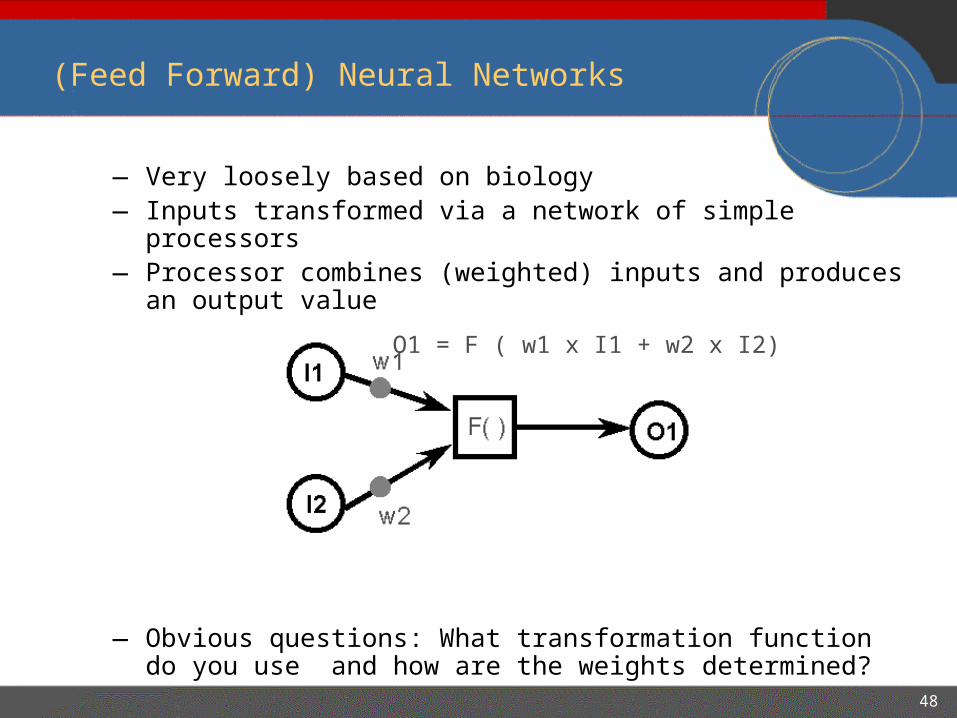
(Feed Forward) Neural Networks
— Very loosely based on biology— Inputs transformed via a network of simple processors— Processor combines (weighted) inputs and produces an
output value
— Obvious questions: What transformation function do you use and how are the weights determined?
O1 = F ( w1 x I1 + w2 x I2)
49
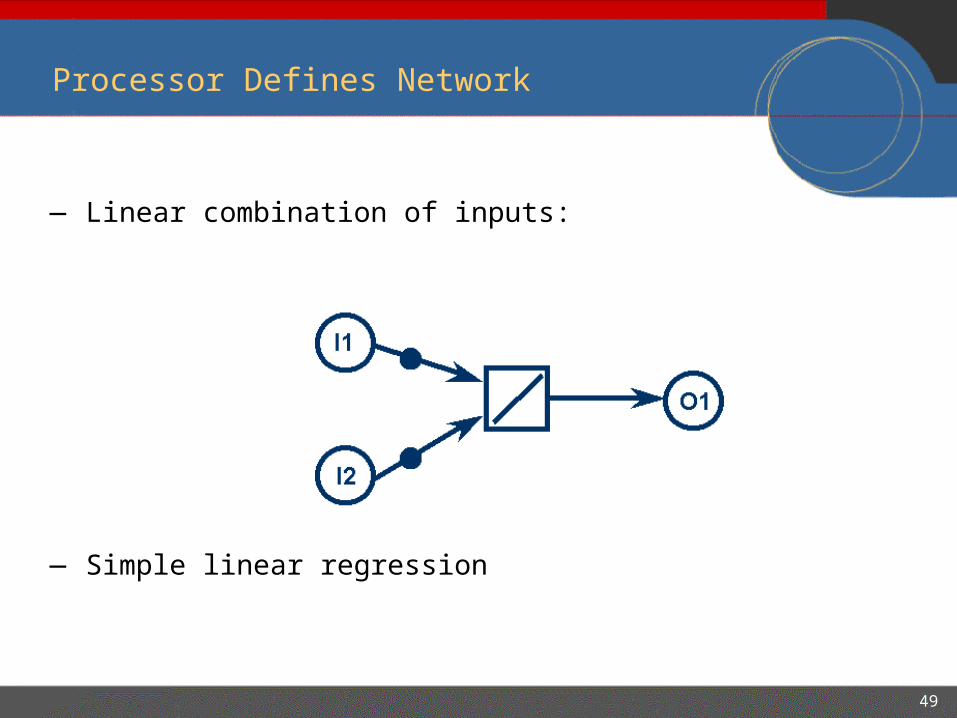
Processor Defines Network
— Linear combination of inputs:
— Simple linear regression

50
Processor Defines Network
— Logistic function of a linear combination of inputs
— Logistic regression
— Classic “perceptron”

51
Multilayer Neural Networks
— Nonlinear regression
Hidden Layer
Output Layer
“FullyConnected”

52
Adjusting the Weights
— Backpropagation: Weights are adjusted by observing errors on output and propagating adjustments back through the network
53
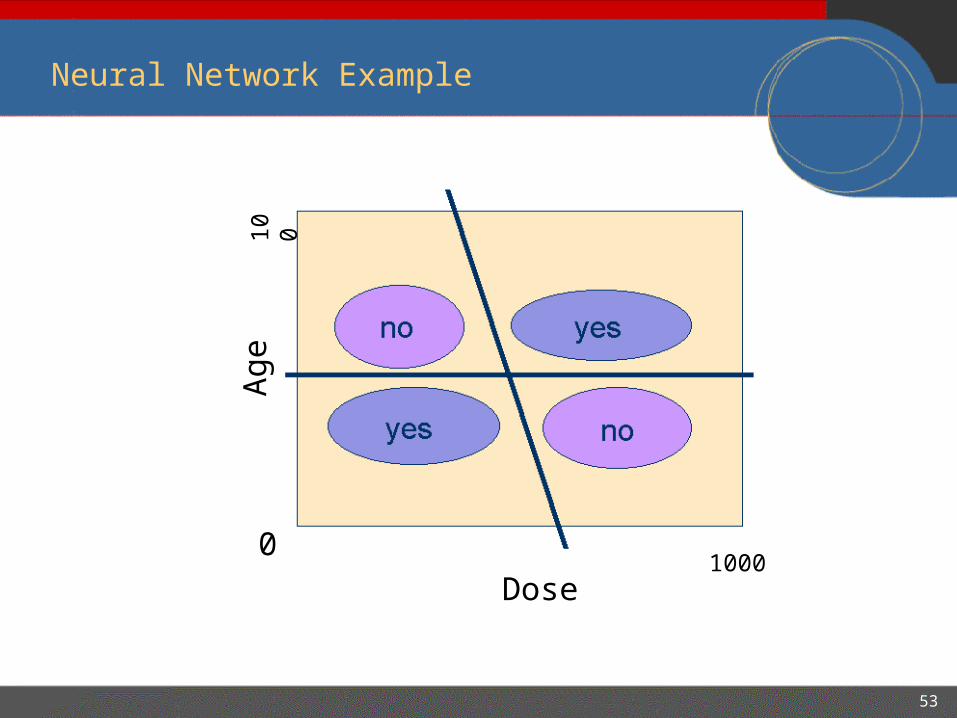
Neural Network Example
Age
Dose
100
10000
54
Neural Network Issues
— Key problem: Difficult to understand
— The neural network model is difficult to understand
— Relationship between weights and variables is complicated
> Graphical interaction with input variables (sliders)
— No intuitive understanding of results
— Training time
— Error decreases as a power of the training size
— Significant pre-processing of data often required
— Good FAQ: ftp.sas.com/pub/neural/FAQ.html
55
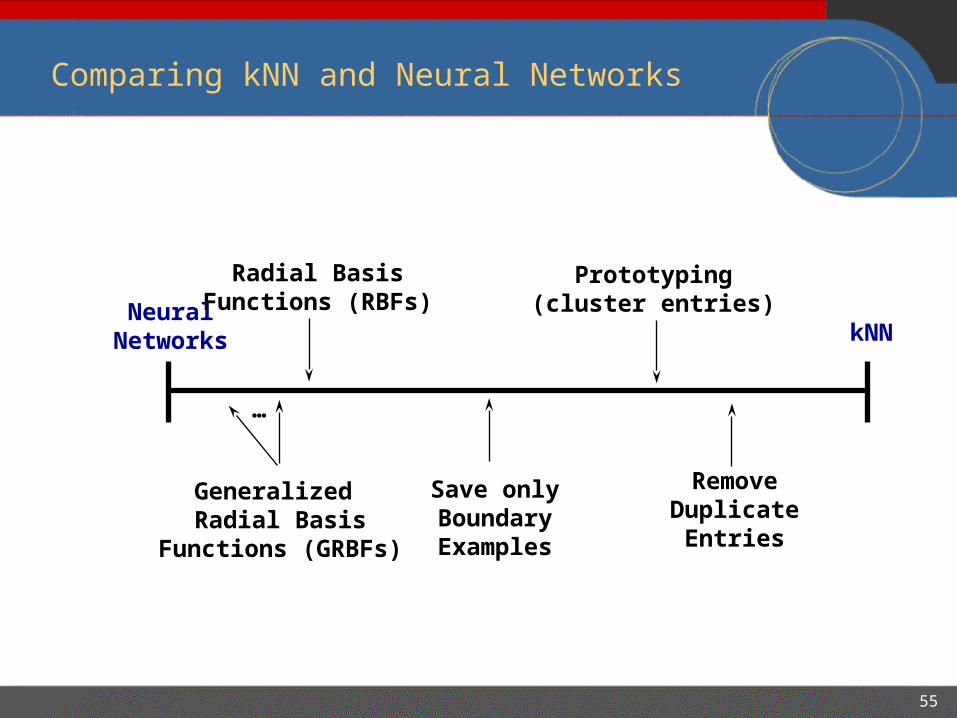
NeuralNetworks kNN
Generalized Radial Basis
Functions (GRBFs)
Save onlyBoundaryExamples
RemoveDuplicate
Entries
Prototyping(cluster entries)
…
Radial BasisFunctions (RBFs)
Comparing kNN and Neural Networks

56
Rule Induction
— Not necessarily exclusive (overlap)
— Start by considering single item rules — If A then B
> A = Missed Payment, B = Defaults on Credit Card
— Is observed probability of A & B combination greater than expected (assuming independence)?
> If It is, rule describes a predictable pattern
If Car = Ford and Age = 30…40Then Defaults = Yes
If Age = 25…35 and Prior_purchase = NoThen Defaults = No
Weight = 3.7
Weight = 1.2
57
Rule Induction (cont.)
— Look at all possible variable combinations— Compute probabilities of combinations
— Expensive!
— Look only at rules that predict relevant behavior
— Limit calculations to those with sufficient support
— Move onto larger combinations of variables
— n3, n4, n5, ...
— Support decreases dramatically, limiting calculations

58
— A series of nested if/then rules.
Decision Trees

59
Types of Decision Trees
— CHAID: Chi-Square Automatic Interaction Detection
— Kass (1980)
— n-way splits
— Categorical Variables
— CART: Classification and Regression Trees
— Breimam, Friedman, Olshen, and Stone (1984)
— Binary splits
— Continuous Variables
— C4.5
— Quinlan (1993)
— Also used for rule induction

60
Decision Tree Model
Age
Dose
100
10000

61
Decision Trees & Understandability
Age < 35 Age 35
Dose < 100 Dose 100 Dose < 160 Dose 160
62
Supervised Algorithm Summary
— kNN— Quick and easy
— Models tend to be very large
— Neural Networks— Difficult to interpret
— Can require significant amounts of time to train
— Rule Induction— Understandable
— Need to limit calculations
— Decision Trees— Understandable
— Relatively fast
— Easy to translate into SQL queries
63
Other Data Mining Techniques
— Support vector machines
— Bayesian networks
— Naïve Bayes
— Genetic algorithms
— More of a search technique than a data mining algorithm
— Many more ...
64
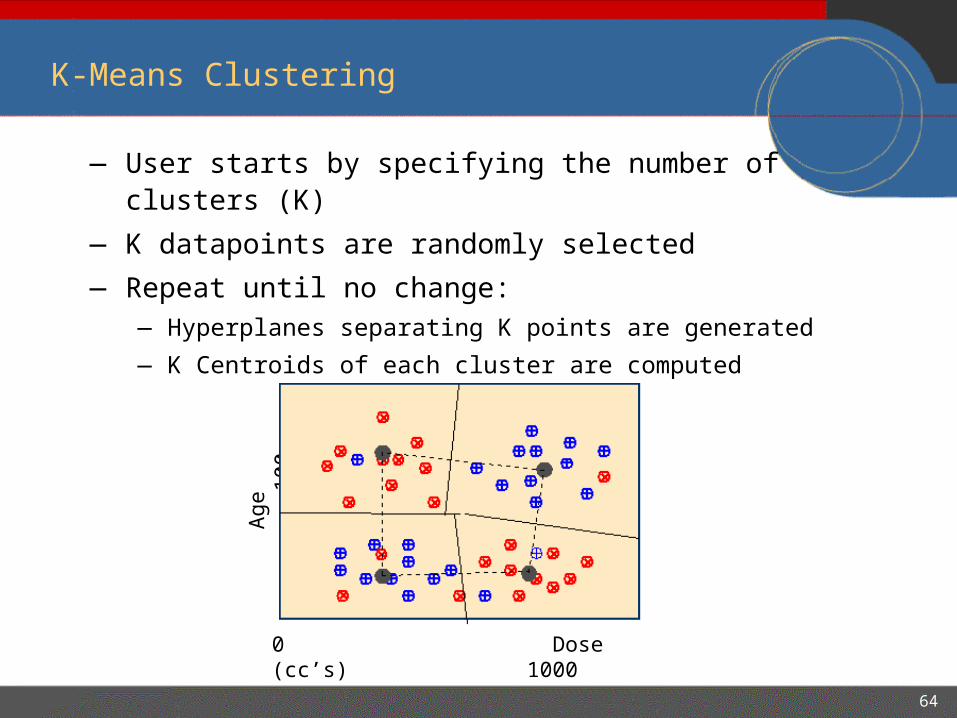
K-Means Clustering
— User starts by specifying the number of clusters (K)
— K datapoints are randomly selected
— Repeat until no change:— Hyperplanes separating K points are generated
— K Centroids of each cluster are computed
Age
100
0 Dose (cc’s) 1000
65
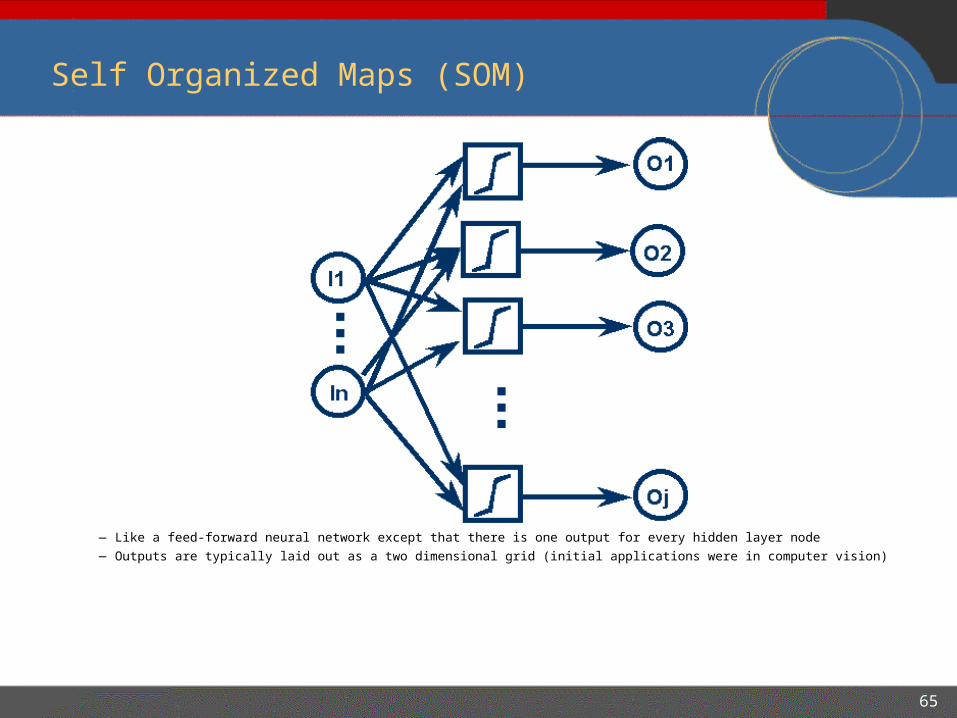
— Like a feed-forward neural network except that there is one output for every hidden layer node
— Outputs are typically laid out as a two dimensional grid (initial applications were in computer vision)
Self Organized Maps (SOM)
66
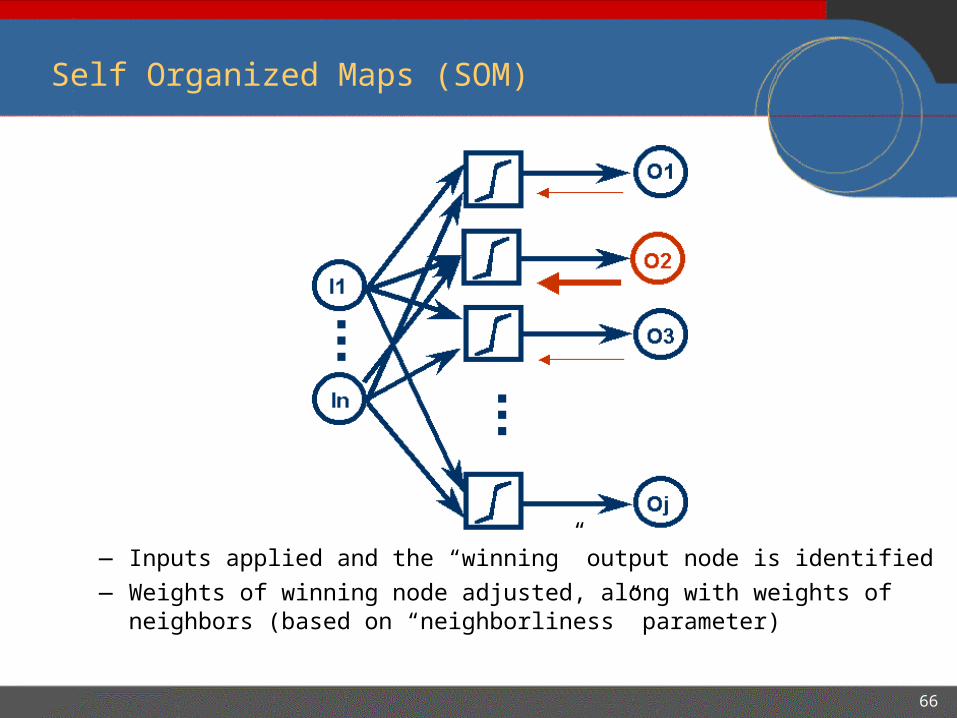
— Inputs applied and the “winning” output node is identified
— Weights of winning node adjusted, along with weights of neighbors (based on “neighborliness” parameter)
Self Organized Maps (SOM)
67
Text Mining
— Unstructured data (free-form text) is a challenge for
data mining techniques
— Usual solution is to impose structure on the data and
then process using standard techniques
— Simple heuristics (e.g., unusual words)
— Domain expertise
— Linguistic analysis
— Presentation is critical

68
Text Can Be Combined with Other Data
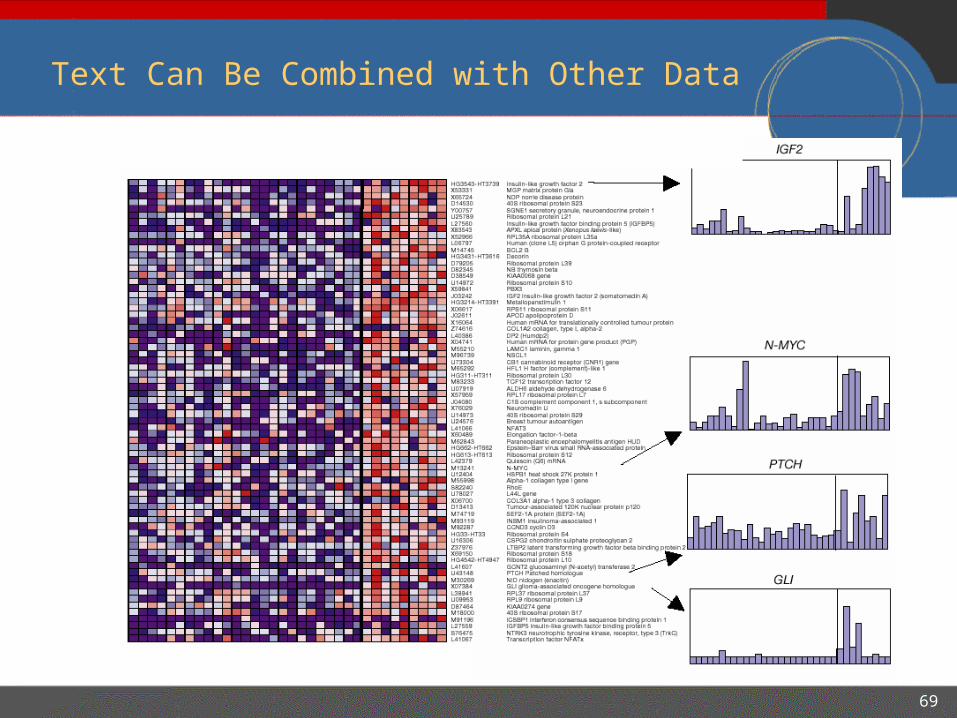
69
Text Can Be Combined with Other Data
70
Commercial Data Mining Software
— It has come a long way in the past seven or eight years
— According to IDC, data mining market size of $540M in 2002, $1.5B in 2005— Depends on what you call “data mining”
— Less of a focus towards applications as initially thought— Instead, tool vendors slowly expanding capabilities
— Standardization— XML
> CWM, PMML, GEML, Clinical Trial Data Model, …
— Web services?
— Integration— Between applications
— Between database & application
71
What is Currently Happening?
— Consolidation
— Analytic companies rounding out existing product lines
> SPSS buys ISL, NetGenesis
— Analytic companies expanding beyond their niche
> SAS buys Intrinsic
— Enterprise software vendors buying analytic software companies
> Oracle buys Thinking Machines
> NCR buys Ceres
— Niche players are having a difficult time
— A lot of consulting
— Limited amount of outsourcing
— Digimine

72
Top Data Mining Vendors Today
— SAS— 800 Pound Gorilla in the data analysis space
— SPSS— Insightful (formerly Mathsoft/S-Plus)
— Well respected statistical tools, now moving into mining
— Oracle— Integrated data mining into the database
— Angoss— One of the first data mining applications (as opposed to tools)
— HNC— Very specific analytic solutions
— Unica— Great mining technology, focusing less on analytics these days
73
Standards in Data Mining
— Predictive Model Markup Language (PMML)— The Data Mining Group (www.dmg.org)
— XML based (DTD)
— Java Data Mining API spec request (JSR-000073)— Oracle, Sun, IBM, …
— Support for data mining APIs on J2EE platforms
— Build, manage, and score models programmatically
— OLE DB for Data Mining— Microsoft
— Table based
— Incorporates PMML
— It takes more than an XML standard to get two applications to work together and make users more productive
74
Data Mining Moving into the Database
— Oracle 9i— Darwin team works for the DB group, not applications
— Microsoft SQL Server
— IBM Intelligent Miner V7R1
— NCR Teraminer
— Benefits:— Minimize data movement
— One stop shopping
— Negatives:— Limited to analytics provided by vendor
— Other applications might not be able to access mining functionality
— Data transformations still an issue
> ETL a major part of data management

75
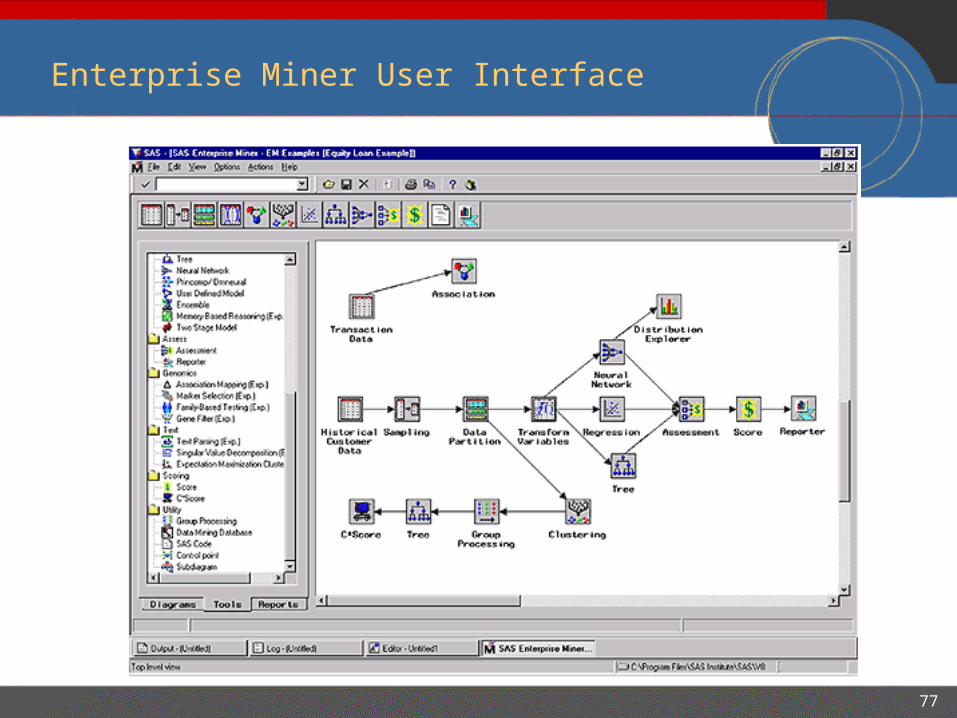
SAS Enterprise Miner
— Market Leader for analytical software
— Large market share (70% of statistical software market)
> 30,000 customers
> 25 years of experience
— GUI support for the SEMMA process
— Workflow management
— Full suite of data mining techniques
76
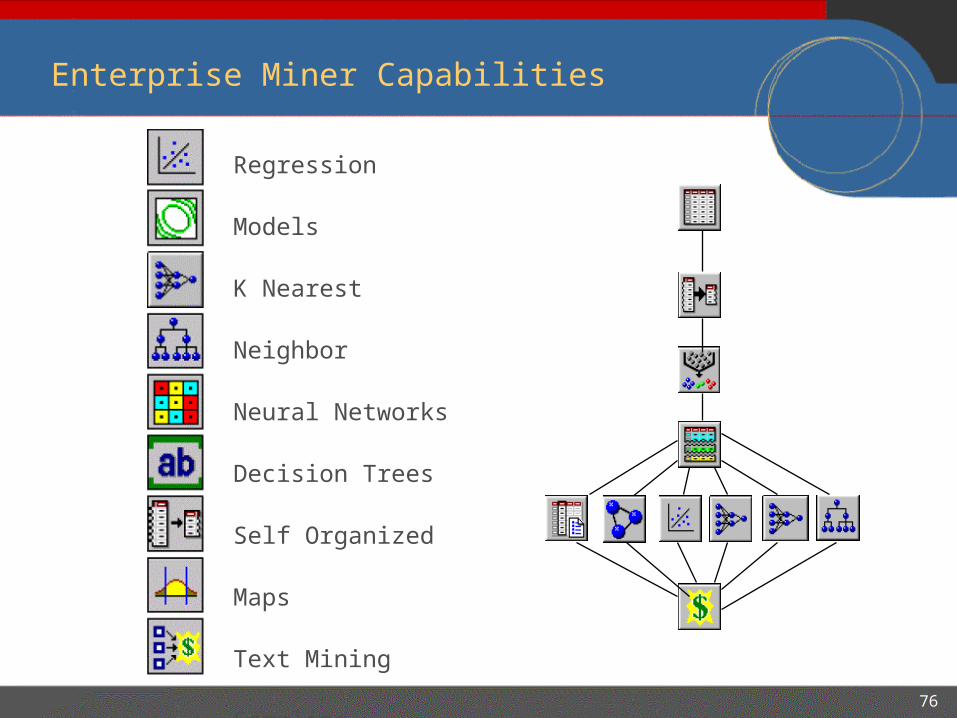
Enterprise Miner Capabilities
Regression Models
K Nearest Neighbor
Neural Networks
Decision Trees
Self Organized Maps
Text Mining
Sampling
Outlier Filtering
Assessment
77
Enterprise Miner User Interface
78
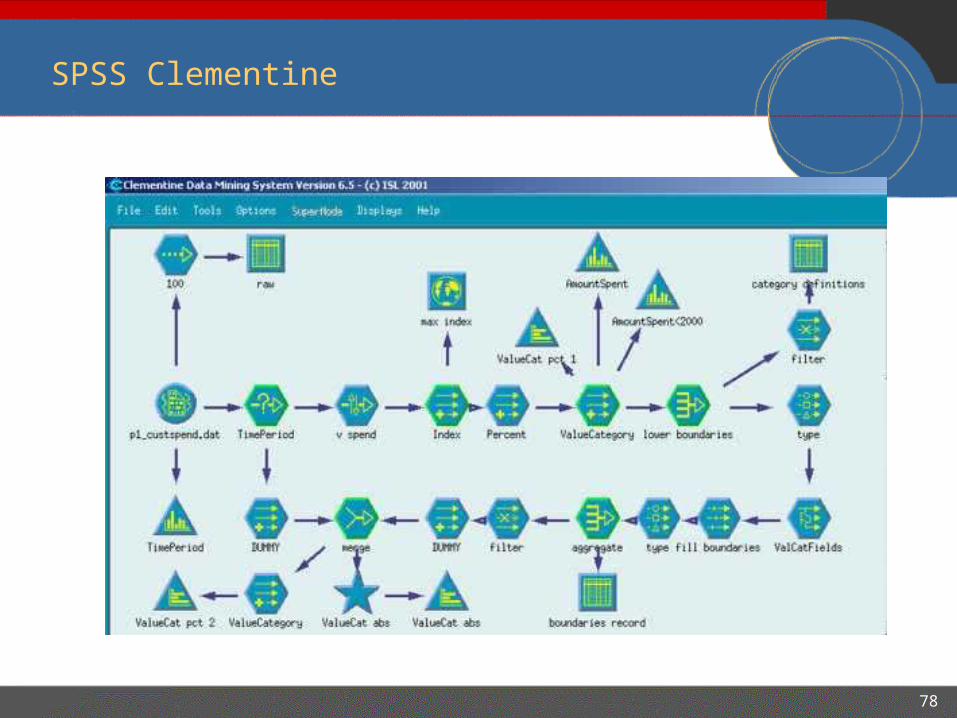
SPSS Clementine

79
Insightful Miner

80
Oracle Darwin
81
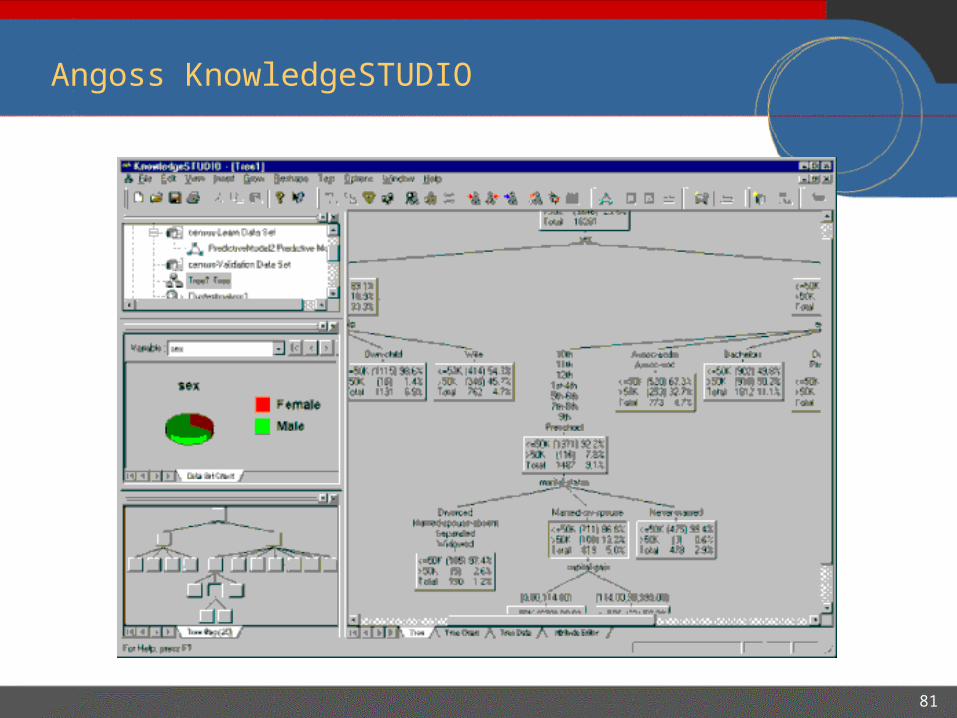
Angoss KnowledgeSTUDIO
82
Usability and Understandability
— Results of the data mining process are often difficult to
understand
— Graphically interact with data and results
— Let user ask questions (poke and prod)
— Let user move through the data
— Reveal the data at several levels of detail, from a broad overview
to the fine structure
— Build trust in the results
83
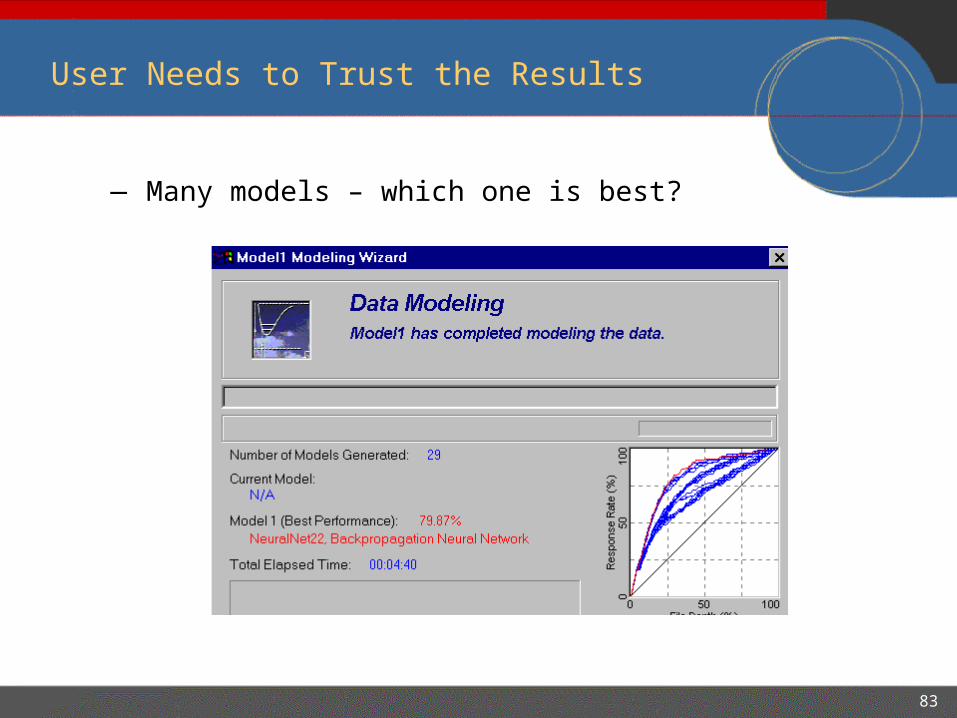
User Needs to Trust the Results
— Many models – which one is best?
84
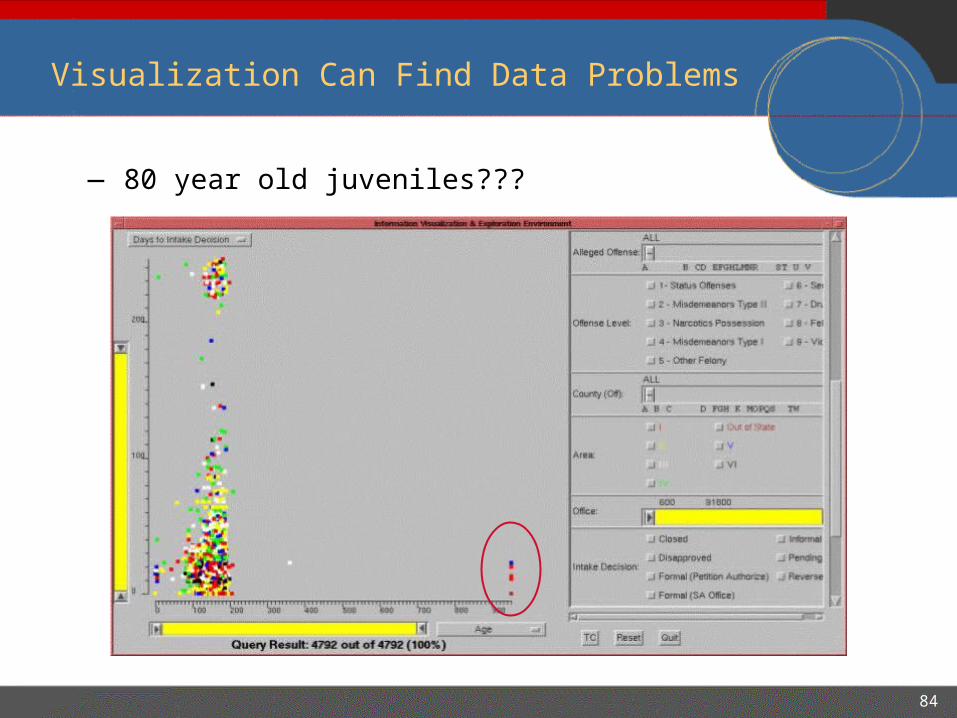
Visualization Can Find Data Problems
— 80 year old juveniles???

85
Visualization Can Provide Insight

86
Visualization Can Show Relationships
— NetMap— Correlations between items represented by links
— Width of link indicated correlation weight
— Originally used to fight organized crime
87
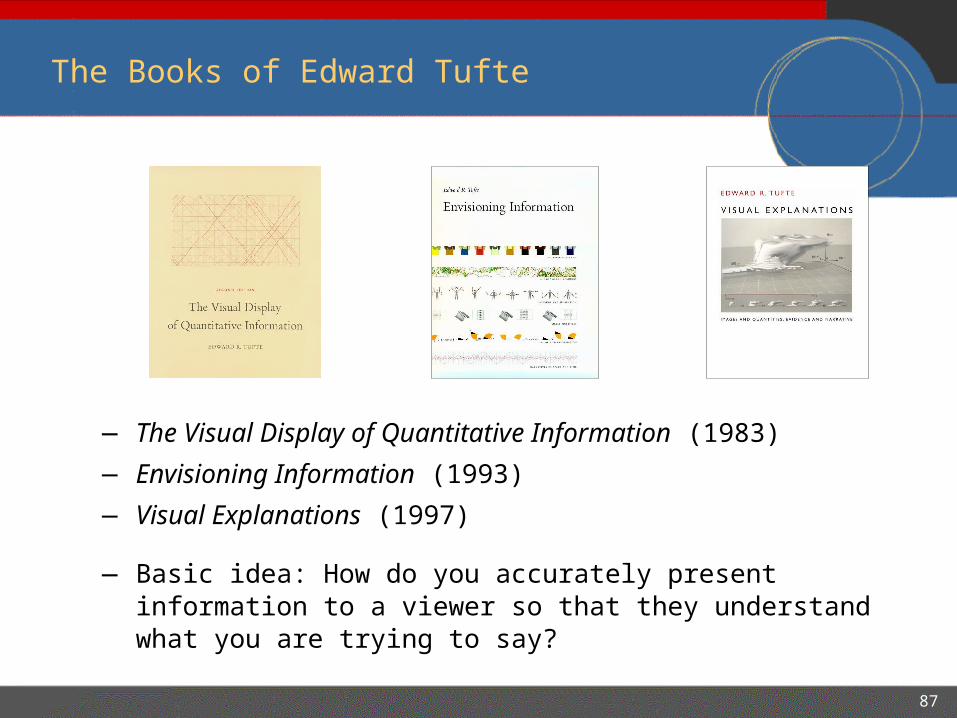
The Books of Edward Tufte
— The Visual Display of Quantitative Information (1983)
— Envisioning Information (1993)
— Visual Explanations (1997)
— Basic idea: How do you accurately present information to a viewer so that they understand what you are trying to say?
88
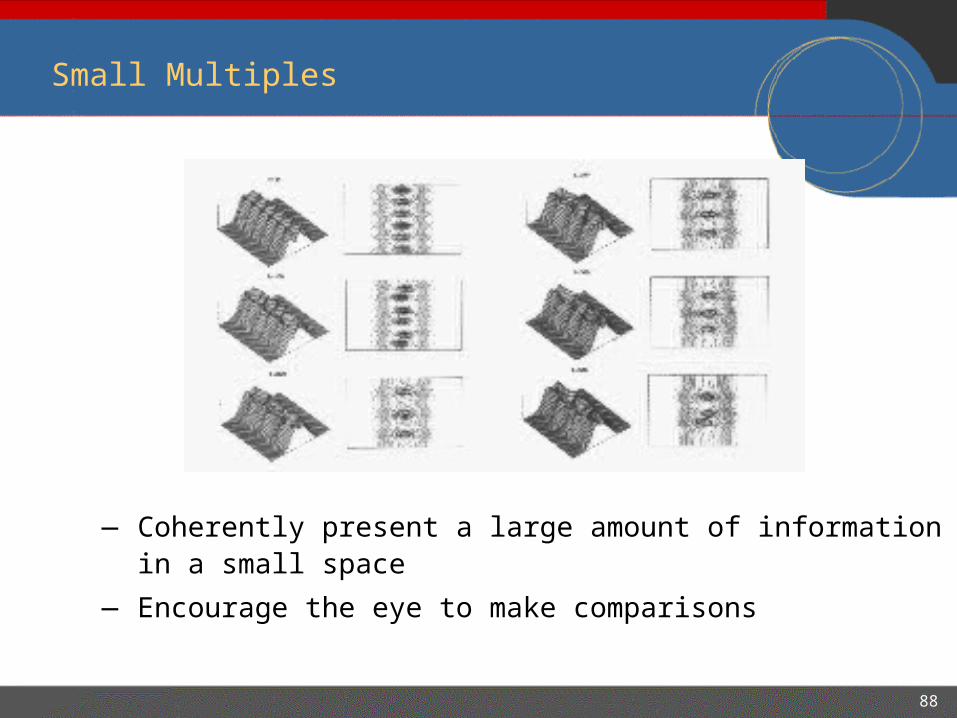
Small Multiples
— Coherently present a large amount of information in a small space
— Encourage the eye to make comparisons
89
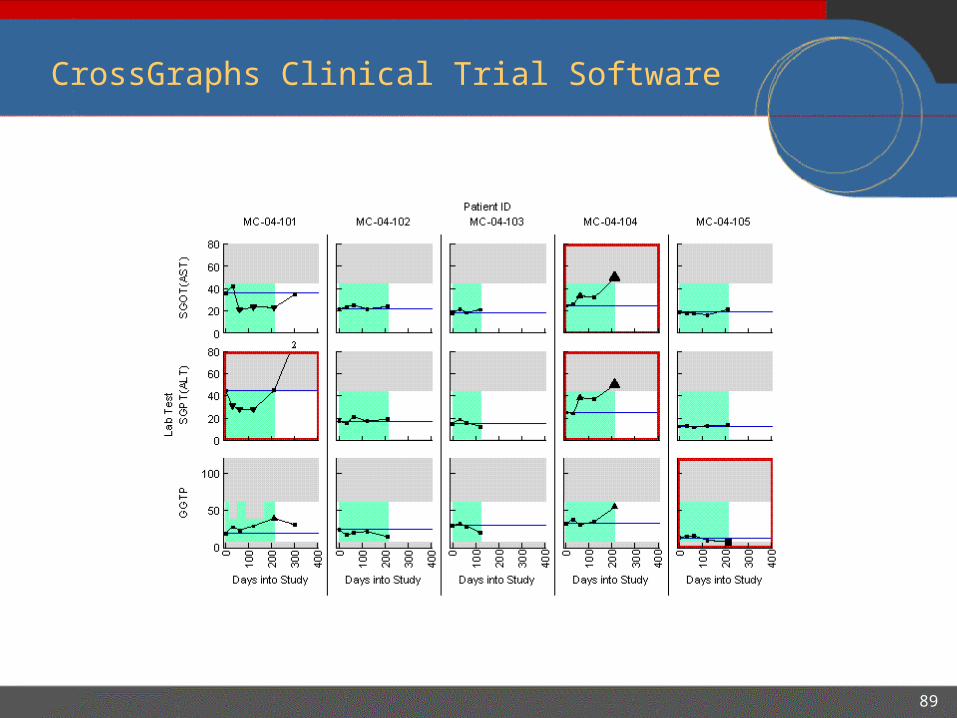
CrossGraphs Clinical Trial Software

90
OLAP Analysis
91
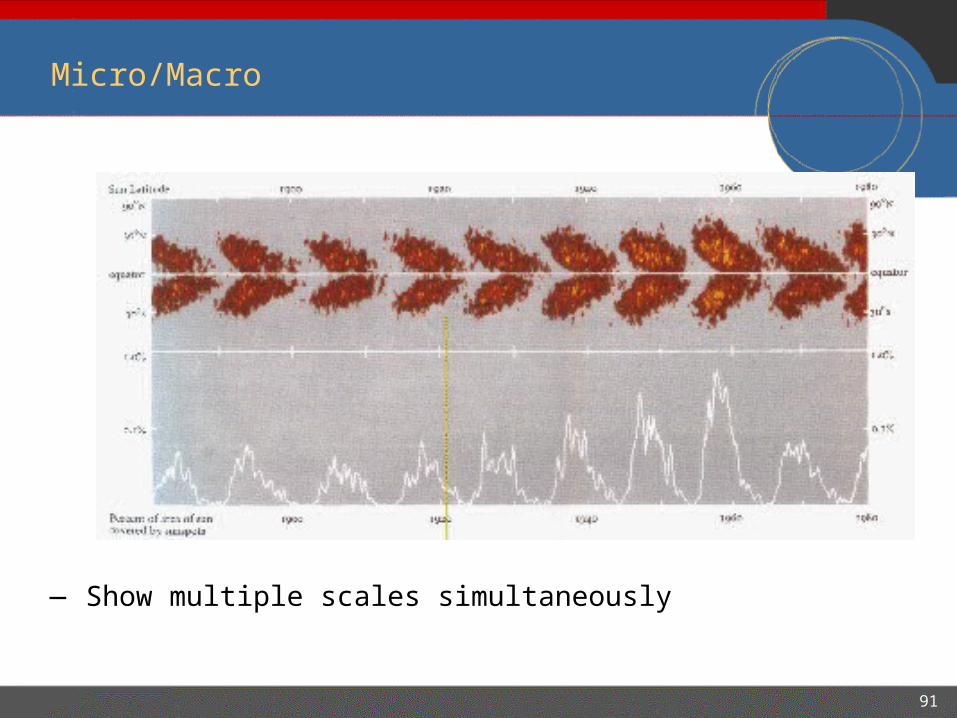
Micro/Macro
— Show multiple scales simultaneously
92
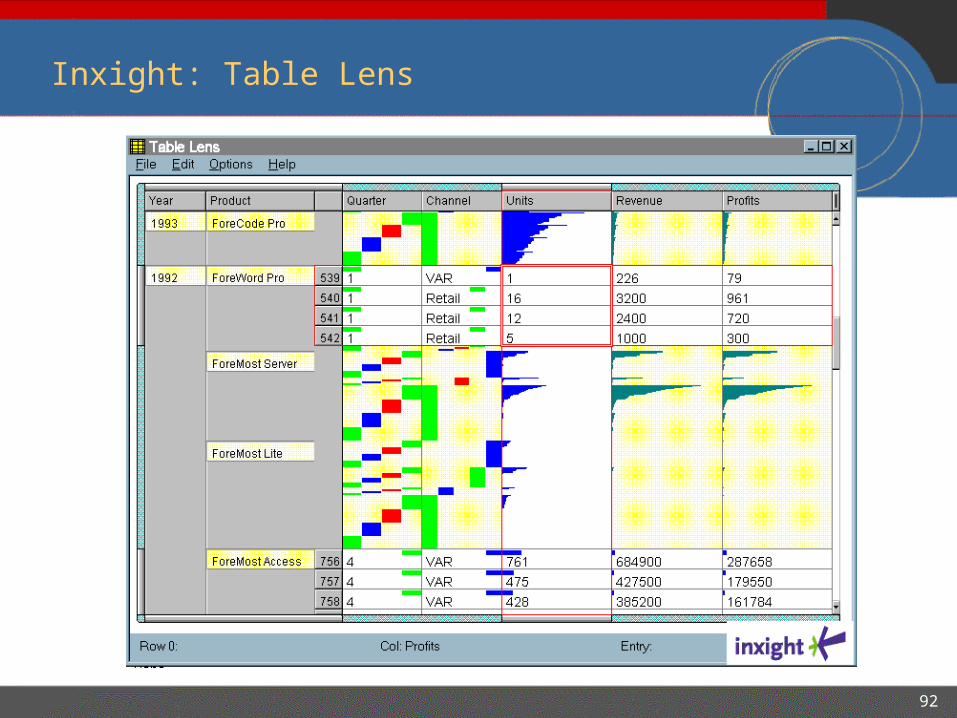
Inxight: Table Lens

93
Thank You
If you have any questions, I can be contacted at
or
www.thearling.com
Related Documents


