1 An Integrated View of the Influence of Temperature, Pressure, and Humidity on the Stability of Trimorphic Cysteamine Hydrochloride Inès Gana a,b , Maria Barrio c , Carine Ghaddar d , Béatrice Nicolaï a , Bernard Do d , Josep-Lluís Tamarit c , Fathi Safta b , Ivo B. Rietveld a,* a Caractérisation des Matériaux Moléculaires à Activité Thérapeutique (CAMMAT), Faculté de Pharmacie, Université Paris Descartes, 4, Avenue de l’Observatoire, 75006 Paris, France b Laboratoire de chimie analytique, Faculté de Pharmacie, Université de Monastir, rue Ibn Sina, 5000 Monastir, Tunisie c Grup de Caracterització de Materials (GCM), Departament de Física i Enginyeria Nuclear, Universitat Politècnica de Catalunya, ETSEIB, Diagonal 647, 08028 Barcelona, Spain d Etablissement Pharmaceutique de l'Assistance Publique-Hôpitaux de Paris, Agence Générale des Equipements et Produits de Santé, 7, rue du Fer à Moulin, 75005 Paris, France * Corresponding author: [email protected], tel.: +33 1 53739675

Welcome message from author
This document is posted to help you gain knowledge. Please leave a comment to let me know what you think about it! Share it to your friends and learn new things together.
Transcript

1
An Integrated View of the Influence of Temperature, Pressure, and Humidity on the Stability of Trimorphic Cysteamine Hydrochloride Inès Ganaa,b, Maria Barrioc, Carine Ghaddard, Béatrice Nicolaïa, Bernard Dod, Josep-Lluís Tamaritc,
Fathi Saftab, Ivo B. Rietvelda,*
a Caractérisation des Matériaux Moléculaires à Activité Thérapeutique (CAMMAT), Faculté de
Pharmacie, Université Paris Descartes, 4, Avenue de l’Observatoire, 75006 Paris, France
b Laboratoire de chimie analytique, Faculté de Pharmacie, Université de Monastir, rue Ibn Sina,
5000 Monastir, Tunisie
c Grup de Caracterització de Materials (GCM), Departament de Física i Enginyeria Nuclear,
Universitat Politècnica de Catalunya, ETSEIB, Diagonal 647, 08028 Barcelona, Spain
d Etablissement Pharmaceutique de l'Assistance Publique-Hôpitaux de Paris, Agence Générale
des Equipements et Produits de Santé, 7, rue du Fer à Moulin, 75005 Paris, France
* Corresponding author: [email protected], tel.: +33 1 53739675

2
Abstract
Understanding the phase behavior of pharmaceuticals is important for dosage form
development and regulatory requirements, in particular after the incident with ritonavir. In the
present paper, a comprehensive study of the solid-state phase behavior of cysteamine
hydrochloride used in the treatment of radiation sickness, sickle cell anemia and nephropathic
cystinosis, is presented employing (high-pressure) calorimetry, water vapor sorption, and X-ray
diffraction as a function of temperature. A new crystal form (I2/a, form III) has been discovered
and its structure has been solved by X-ray powder diffraction, while two other crystalline forms
are already known. The relative thermodynamic stabilities of the commercial form I and of the
newly discovered form III have been established; they possess an overall enantiotropic phase
relationship, with form I stable at room temperature and form III stable above 37 °C. Its melting
temperature was found at 67.3 ± 0.5 °C. Cysteamine hydrochloride is hygroscopic and
immediately forms a concentrated saturated solution in water with a surprisingly high
concentration of 47.5 mole% above a relative humidity of 35 %. No hydrate has been observed.
A temperature – composition phase diagram is presented that has been obtained with the unary
pressure – temperature phase diagram, measurements, and calculations. For development, form
I would be the best form to use in any solid dosage form, which should be thoroughly protected
against humidity.
Keywords: cysteamine hydrochloride, crystalline trimorphism, phase diagram, phase stability,
enantiotropic phase relationship, thermal expansion, intermolecular interactions, hygroscopic,
eutectic.

3
1 Introduction
Cysteamine hydrochloride, 2-aminoethanethiol hydrochloride (C2H7NS⋅HCl, M = 113.61 g
mol-1) (Figure 1), is the salt formulation of the decarboxylated form of the amino acid cysteine
and it is an important intermediate in the alternative pathway of taurine biosynthesis.1, 2
Figure 1. Chemical structure of cysteamine hydrochloride
Besides its various pharmacological effects involving the immune-reactive somatostatin
levels, the secretion of several pituitary hormones, the duodenal ulcer, and also protection
against oxidizing radiation, it is known to be a post-toxicant therapeutic agent for hepatic
necrosis.1, 2 Clinically, cysteamine hydrochloride is used in the treatment nephropathic
cystinosis, a rare autosomal recessive disease characterized by an excessive intra-lysosomal
cystine accumulation due to a defect of the transport system in the lysosomal membrane.3, 4
Cysteamine cleaves the disulfide bond with cystine to produce molecules that can be carried out
of the lysosome by a lysine carrier and thus avoid the metabolic defect in cystinosis and
cystinuria.5 Recently, the European Commission has granted orphan designation to Lucane
Pharma SA, France, for cysteamine hydrochloride for the treatment of cystinosis
(EU/3/14/1314). Other treatments under study are against Huntington’s disease, nonalcoholic
fatty liver disease, malaria, and cancer.3
Two crystal structures have been published in the literature;6, 7 details can be found in Table
1. A triclinic form was observed by single crystal X-ray diffraction at 145 K with crystals
obtained from 1-butanol after two weeks of crystallization at 4°C (277 K).6 According to the
authors isopropanol and n-propanol could be employed too.6 A monoclinic form was reported in
2010.7 The crystal had been found in the commercial sample and measured as such by single

4
crystal X-ray diffraction at 173 K.7 No information on the phase relationships between these two
solid forms has been provided. Lahiani-Skiba et al. mention a melting point for cysteamine
hydrochloride of 70.2-70.7 °C (343.6 K) for a sample obtained from the Parisian hospitals
without mentioning the crystal structure.8 The melting data gathered by Scifinder® (30 April
2014) leads to an average melting point of 69.7 °C (342.8 K) ranging from 64 up to 72 °C. No
phases have been specified. To facilitate the discussion below, the following nomenclature is
proposed: form I, monoclinic structure, and form II, triclinic structure (Table 1).
Table 1. Crystal structure data for cysteamine hydrochloride in the literaturea
Space group T (K) Vunit cell (Å3) Z vspecific (cm3g-1) Ref
Triclinic P-1, form II 145 558.6 4 0.7402 6
Monoclinic P21/c, form I 173 560.60 4 0.7429 7
a The CIF files of the structures of cysteamine hydrochloride can be found in the Cambridge
Structural Database (CSD) by the reference code XIJKIK
To prepare a suitable dosage form, the physical properties of the active pharmaceutical
ingredient are important information. As is clear from the foregoing, at least two phases exist for
cysteamine hydrochloride; however, no information on their phase relationships has been
reported, i.e. it is not known which of the two forms is the stable one at room temperature,
because both structure determinations by X-ray have been carried out far below room
temperature. In addition, little is known about the effect of humidity on cysteamine and whether
this should be taken into account in the dosage form design. Therefore, in the present paper, a
number of experimental approaches have been used to study the solid-state behavior of
cysteamine hydrochloride and to report on its phase behavior as a function of pressure,
temperature and humidity.

5
2 Experimental
2.1 Materials
Cysteamine hydrochloride was purchased from Sigma Aldrich (>98%) and used as such.
Because of its hygroscopicity, samples have been prepared in a glove box with a controlled
humidity of less than 10%.
2.2 Thermogravimetry
Thermogravimetry (TGA) was carried out at various rates with a TGA50 thermobalance
from TA-Instruments. No weight loss was observed in the range of 25 up to 100°C.
2.3 Differential scanning calorimetry
Differential scanning calorimetry (DSC) experiments were performed on a Q100 analyzer
from TA Instruments (New Castle, DE, USA). Different quantities (2 to 10 mg) of cysteamine
hydrochloride and different heating rates from 0.1 up to 10 K min-1 were used. The
measurements were carried out on samples sealed in aluminum pans.
2.4 High-resolution X-ray powder diffraction
High-resolution X-ray powder diffraction patterns were obtained as a function of
temperature from 120 K up to the liquid state with a CPS120 diffractometer from INEL (France)
equipped with a liquid nitrogen 700 series Cryostream Cooler from Oxford Cryosystems (Oxford,
UK). Data were collected for at least 1 hour per diffraction pattern. The heating rate between the
measurements was 1.3 K min-1 and before data collection the sample temperature was left to
stabilize for at least 15 min. The lattice parameters as a function of temperature have been
determined with Pawley fits to the known unit cells using TOPAS Academic.9
2.5 Crystal structure solution

6
For structure solution, the program DASH10 and TOPAS-Academic9 were employed and the
powder pattern was truncated to 48.80° in 2ϑ (Cu Kα1), corresponding to a real-space resolution
of 1.86 Å. The background was subtracted with a Bayesian high-pass filter.11 Peak positions for
indexing were obtained by fitting with an asymmetry-corrected pseudo-Voigt function.12, 13 22
peaks were indexed with the indexing program DICVOL04.14-16 A monoclinic unit cell was
obtained with figures of merit M(22) = 20.4 and F(22) = 39.9 (0.0069, 80). Pawley refinement
was used to extract integrated intensities and their correlations, from which the space group
was determined using Bayesian statistical analysis.17 The space group I2/a was returned as the
most probable option, which was the space group with the highest symmetry. It resulted in a
Pawley χ2 of 5.23. Simulated annealing was used to solve the crystal structure from the powder
pattern in direct space. The starting molecular geometry was taken from the published
monoclinic structure (form I) from the CSD (reference code XIJKIK01).18 In all 30 simulated
annealing runs, the same crystal structure was found. The profile χ2 of the best solution was
19.37, which is about four times the Pawley χ2; these are good indications that the correct
solution has been found.
2.6 Rietveld refinement
For the Rietveld refinement, data out to 71° 2θ were used, which corresponds to 1.33 Å real-
space resolution. The Rietveld refinement was carried out with TOPAS-Academic.9 Bond lengths,
bond angles and planar groups were subjected to suitable restraints, including bonds to H
atoms, based on the distances found in the structure XIJKIK01. A global Biso was refined for all
non-hydrogen atoms, with the Biso of the hydrogen atoms constrained at 1.2 times the value of
the global Biso. The inclusion of a preferred-orientation correction with the March-Dollase
formula19 was tried for several directions, leading to an improved Rwp (4.581 versus 5.0) for the
direction (3 1 0). The molecular geometry was checked with Mogul,20 which compares each bond
length and bond angle to corresponding distributions from single-crystal data. Supplementary
crystallographic data can be found in the CCDC, deposit number 1027495 and obtained free of

7
charge from the Cambridge Crystallographic Data Centre via
www.ccdc.cam.ac.uk/data_request/cif/.
2.7 High-pressure thermal analysis
The transitions observed by DSC have been studied with high-pressure differential thermal
analysis (HP-DTA). An in-house constructed HP-DTA, similar to the apparatus previously built
by Würflinger21 with temperature and pressure ranges from 203 to 473 K and 0 to 300 MPa,
respectively, was used. Samples were sealed in cylindrical tin pans and to ensure that in-pan
volumes were free from residual air, specimens were mixed with an inert perfluorinated liquid
(Galden® from Bioblock Scientifics, Illkirch, France) before sealing. HP-DTA scans were carried
out with a heating rate of 2 K min-1. In addition, DSC runs at ordinary pressure (i.e., in standard
aluminum pans) with mixtures of cysteamine hydrochloride and perfluorinated liquid were
carried out to verify that the latter was inert.
2.8 Differential vapor sorption
Differential vapor sorption (DVS) experiments have been carried out on a DVS-1000 of
Surface Measurement Systems (SMS) London, UK. About 10 mg of cysteamine hydrochloride has
been used in each experiment and relative humidities ranged from 0 to 90 %. The sample was
considered stable with respect to the imposed water vapor once the fluctuation of its mass was
below 0.001 mg.
2.9 Thermal expansion of the crystals
To investigate the thermal expansion of the crystal structures, all diffraction patterns
belonging to a single series of measurements have been refined together in TOPAS-Academic9
using Rietveld refinement of the known monoclinic structure with globally defined atom
coordinates. In addition, the diffraction parameters such as the zero error and the slid width
have each been refined with single variables for all patterns together. The unit cell parameters
and peak shape parameters were allowed to refine freely.

8
The anisotropy of the intermolecular interactions can be investigated with the isobaric
thermal expansion tensor, which is a measure of how the interactions change with
temperature.22 A small value for a tensor eigenvalue is commonly referred to as a “hard”
direction and a large value as a “soft” direction.23 The tensor has been calculated with the
program PASCAL24 and drawn with the program Wintensor.25
3 Results
3.1 Thermal behavior
Two endothermic thermal events have been observed for the commercial sample of
cysteamine hydrochloride. The melting peak has an onset at 340.4 ± 0.5 K (67.3 °C) with a
melting enthalpy of 141.6 ± 6.7 J g-1 (Figure 2). Below the melting peak, another thermal event
can be observed at around 322 K (49°C). The enthalpy change associated with this thermal event
equals 9.9 ± 1.8 J g-1. Cooling down directly after the appearance of the small peak does not lead
to any exothermic events and on reheating the small peak does not reappear (Figure 2). After
melting and recrystallization at ambient temperature, only the melting peak is observed on
reheating with comparable onset temperature and melting enthalpy (Figure 2). The small peak
depends on the heating rate of the DSC as can be observed in the inset of Figure 2. At low
scanning rates, 0.1 K min-1, it tends to a minimum value of 310 K (37 °C). As thermogravimetric
measurements demonstrated that the compound exhibits no weight loss on heating, the small
peak is not related to any solvent or water loss. In the next section, it will be shown that this
thermal event is linked to a solid-solid phase transition.

9
Figure 2. Thermal behavior of commercial cysteamine hydrochloride. The commercial form
melts after a small thermal event (curve a2). The small peak does not reoccur after cooling the
molten sample and reheating (curve a1). Neither does it reappear after cooling just after the
small peak (curve b1 and b2). The inset shows the onset temperature of the small peak (open
circles) and the peak of fusion (open diamonds) as a function of the heating rate. The onset
temperature of the small peak levels off at 310 ± 1 K (37 °C).
3.2 Structure resolution and thermal expansion
3.2.1 Comparison of X-ray powder diffraction patterns obtained at different
temperatures
At room temperature, the X-ray diffraction pattern of the commercial form clearly coincides
with that of the known monoclinic form (Figure 3), called form I in the introduction. On passing
310 K, a change in the diffraction pattern can be observed, indicating that the crystal structure
has changed (Figure 3a). A small change can already be observed in the pattern obtained at 310

10
K just below 25° 2θ. The new crystal structure is neither the known monoclinic form nor the
triclinic form as can be seen in figure 3b for a pattern of the new form obtained at 200 K. This
new crystalline form will be called form III from here on. The transition temperature observed
by X-ray diffraction is in accordance with the temperature observed for the small peak by DSC,
for which the minimum was found to be 310 K.
Figure 3. (a) Change in diffraction pattern between the commercial form (form I) at RT
(bottom), at 310 (center) and after transition at 315 K (top). (b) Calculated diffraction patterns
of the published triclinic (bottom) and monoclinic (center) forms with the diffraction pattern
obtained by heating up to 318 K and subsequently cooling to 200 K (the peak at 22° 2θ is due to
ice formation during the acquisition (top)
During the X-ray diffraction study of form III as a function of temperature, form III turned
into the known triclinic form, form II, below 200K, which reverted back to form III above 200K,
after which form III persisted up to the melting point. Nonetheless, a precise transition
temperature for II-III has not been obtained.

11
3.2.2 Crystal structure resolution of the new form III
The Rietveld refinement produced a fit with χ2 = 2.604, R'p = 18.072, R'wp = 16.711 (values
after background correction), Rp = 3.195 and Rwp = 4.581 (values before background
subtraction). Biso refined to 2.98(14) Å2. The high value of the R values is probably due to some
disorder, as the new phase forms fairly close to its melting point. The structure is monoclinic,
space group I2/a and a unit-cell volume of 1143.00(6) Å3. The cell parameters can be found in
Table 2. A graph of the Rietveld refinement is presented in Figure 4a and the crystal packing is
presented in Figure 4b.
a
b
Figure 4. (a) Rietveld refinement (line) of the X-ray scattering data (open circles) of form III
with residuals and diffraction lines and (b) The crystal packing of form III.

12
Table 2. Crystal Data and Structure Refinement of Cysteamine Hydrochloride Form III
Crystal data
C2H8NS+, Cl−
Mr = 113.61 g mol-1
CCDC nr. 1027495
Monoclinic, I2/a
a = 15.5222(5) Å
b = 8.6384(3) Å
c = 8.7007(3) Å
β = 101.556(2)°
V = 1143.00(6) Å3
Z = 8
Dx = 1.32 g cm-3
Cu Kα1 radiation
µ = 1.3 mm-1
T = 293 K
Specimen shape: cylinder 10×0.5 mm
Data collection
Diffractometer INEL CPS 120
Specimen mounting: Lindemann glass capillary 0.5 mm
Specimen mounted in transmission mode
Scan method: curved detector
Absorption correction: none
2θmin = 5.0°, 2θmax = 71.0°
Increment in 2θ = 0.029°
Refinement
Refinement on Inet
Rp = 3.195
Rwp = 4.581
Rexp = 1.760
χ2 = 2.604
Profile function: modified Thompson-Cox-Hastings pseudo-Voigt
259 reflections
90 parameters
30 restraints
H-atom parameters restrained
Weighting scheme based on measured s.u.’s w = 1/σ(Yobs)2
(Δ/σ)max = 0.001
Preferred orientation correction: March-Dollase with direction (310) and a March-Dollase parameter of 1.11

13
3.2.3 Temperature dependence of the unit cell volumes of the different solid
phases
The powder diffraction patterns of the commercial cysteamine hydrochloride sample have
been fitted to the known monoclinic unit cell, form I, from 120 to 310 K. From the data in Table
SI.1 (Supporting Information) and the fact that Z = 4,7 it follows that the specific volume of form
I, vI(T) in cm3g-1, as a function of the temperature in K can be written as:
vI (T)= 0.7320(17) + 3.1(1.6) ×10-5 T + 1.9(4) ×10-7 T2 (1)
This expression has an overall standard deviation of 4.2 ×10⁻⁴ cm-3g-1 for the temperature
interval considered and a correlation coefficient of 0.997. In the diffraction patterns of form I as
a function of temperature, no other forms have been observed.
From the data in Table SI.2 and the fact that Z = 8, it follows that the specific volume of form
III, vIII(T) in cm3g-1, as a function of the temperature in K can be written as:
vIII (T)= 0.735(2) − 1.5(1.4) ×10-5 T + 3.1(3) ×10-7 T2 (2)
The expression has an overall standard deviation of 5.6×10⁻⁴ cm3g−1 within the temperature
range of the data points and a correlation coefficient of 0.996. The relationship was obtained
with data ranging from 120 K up to 335 K; however, the diffraction patterns below 200 K were
mixed patterns of forms II and III. Thus, form II is the stable form below 200 K with respect to
form III, otherwise it would not have formed.
Although there is much less data on the volume of the unit cell of the triclinic structure, for
the sake of comparison, the following expression can be obtained from the unit cell volume valid
within the range of 120 K up to 220 K (Table SI.3, Z = 4):
vII (T)= 0.737(3) – 4.3(3.4) ×10-5 T + 4.3(1.0) ×10-7 T2 (3)

14
with an overall standard deviation within the temperature range considered of 2.4×10⁻⁴ cm3g-1
and a correlation coefficient of 0.999. Form II was still observed together with form III in a
diffraction pattern obtained at 220 K in a heating run; this indicates that the transformation
from II into III is slow, but that III must be the stable form at 220 K in respect to form II,
otherwise it would not have appeared.
3.3 High-pressure differential thermal analysis of the I-III and melting
transitions
By high-pressure differential thermal analysis, the I-III transition and melting temperatures
have been measured as a function of pressure. The data is plotted in Figure 5.
Figure 5. Transition temperature I→III (circles) and melting temperature of cysteamine
hydrochloride form III (squares) as a function of the applied hydrostatic pressure.
At higher pressure, the onset temperatures of the solid-solid transition were difficult to
determine in the DTA curves due to a flattened peak and low intensity and have been omitted.
The data has lead to the following expressions for the equilibrium curves as a function of
pressure (MPa) and temperature (K):
I-III: P(T) = −19(2)×103 + 59(5) T (4)

15
with an overall standard deviation of 7.4 MPa and a correlation coefficient of 0.980.
III-L: P(T) = −3.93(16)×103 + 11.5(5) T (5)
with an overall standard deviation of 10 MPa and a correlation coefficient of 0.984.
3.4 Differential vapor sorption and solubility
Figure 6. Example of a differential water vapor sorption diagram of cysteamine hydrochloride.
On the vertical axis, the relative mass is given, with 100 the initial mass of dry cysteamine
hydrochloride. Open circles: sorption data, open squares: desorption data. The numbers in the
graph are related to Figure 14 and will be explained, when Figure 14 is discussed.
Sensitivity of cysteamine hydrochloride to water is studied by means of differential vapor
sorption (DVS). As a function of the relative humidity in the system maintained at a constant
temperature of 25°C, the weight of cysteamine hydrochloride has been monitored. It can be seen
in Figure 6 that there is no weight change of the drug sample up to 35% relative humidity, at
which it abruptly starts to take up water. Thus, cysteamine hydrochloride is not hygroscopic up
to 35 % relative humidity.

16
Vapor pressure can be expressed by the Antoine equation, which for water in the
temperature range of 273 – 303 K leads to following expression calculated by the NIST from data
in the literature:26
(6)
With T in kelvin and P in bar, one finds 0.03167 bar or 3167 Pa for the vapor pressure of
water at 25 °C. The water take-up of cysteamine hydrochloride starts at a relative humidity of
35%, which equals a (partial) water vapor pressure of 1108 Pa at 25°C.
Water absorption will inevitably lead to changes in the sample. It can be observed in Figure
6 that after an initial strong weight increase the curve (open circles) levels off to subsequently
slowly increase the rate of absorption again. Obviously two processes are taking place in the
sample, reflected by the two different trends in the same curve (open circles). The initial water
uptake is either a dissolution step or the formation of a hydrate. X-ray diffraction has been used
to investigate samples (form I) with different mixtures of water and cysteamine hydrochloride,
however no change in the initial crystal lattice of cysteamine hydrochloride has been observed
and thus the formation of a hydrate can be excluded. It implies that the initial weight gain under
the presence of 1108 Pa of water pressure is a dissolution step of the solid followed by a dilution
step (open circles in Figure 6; on the other hand the desorption data, open squares, represents
only the dissolution behavior exhibiting hysteresis before reaching a completely dry system at 0
% RH). As dilution can only happen after saturation has been reached the crossing points of the
two behaviors reflected by the open circles in Figure 6 occurs at the saturation concentration. By
extrapolation, the point of intersection of the two processes occurs at a relative total mass of
117.6% and at a relative humidity of 38.3 % (or 1213 Pa partial water pressure). This leads to a
saturation concentration of 0.8506 mass fraction in cysteamine hydrochloride, which is again
equal to 0.4745 mol fraction in cysteamine hydrochloride, the rest being water. Clearly just a bit
over 50 mole% of water molecules renders a mixture with cysteamine hydrochloride completely

17
liquid. This water quantity is extremely low. The proximity to the 1:1 ratio gave rise to the initial
suspicion that a transitory hydrate was formed, but as stated above, X-ray diffraction did not
provide any evidence for this hypothesis.
As no hydrates have been observed in the water – cysteamine hydrochloride system, its
binary phase diagram must consist of a simple eutectic system. The composition of such a
system as a function of temperature can be determined relatively easily by differential scanning
calorimetry. Mixtures of different composition in water and cysteamine hydrochloride give in
most cases rise to two peaks as a function of temperature. The lowest peak is the formation of
the mixed liquid or eutectic liquid and a higher, generally shallower peak is caused by the
dissolution of the remainder of the solid phase into the liquid; the highest temperature, at which
the last part of the solid dissolves, is called the liquidus. A single peak is found in the binary
system when its composition is exactly that of the eutectic liquid. Examples of DSC traces can be
found in Figure 7 and the resulting binary phase diagram in Figure 8, in which it can be seen that
the eutectic temperature is found at 240 K. In addition to the liquidus temperatures obtained by
DSC, also the liquidus coordinates obtained by the DVS (the concentration of the saturated
solution 0.4745 mole fraction at 298 K) have been included in Figure 8.
18
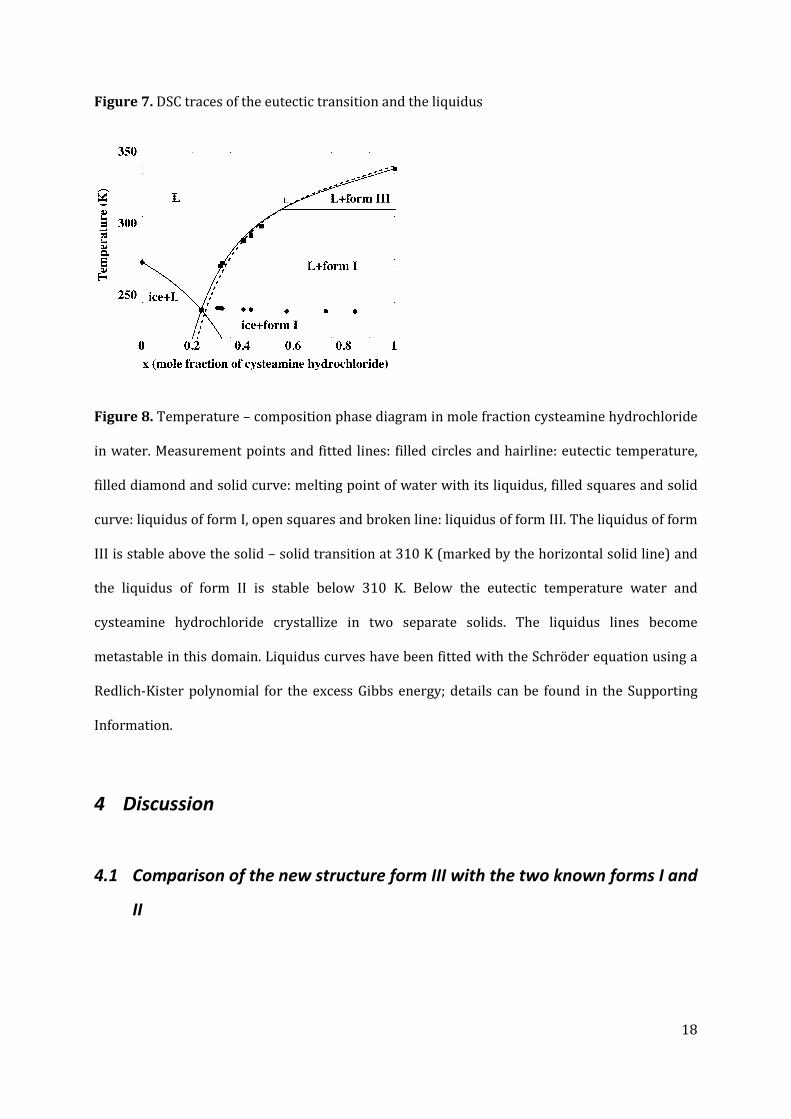
Figure 7. DSC traces of the eutectic transition and the liquidus
Figure 8. Temperature – composition phase diagram in mole fraction cysteamine hydrochloride
in water. Measurement points and fitted lines: filled circles and hairline: eutectic temperature,
filled diamond and solid curve: melting point of water with its liquidus, filled squares and solid
curve: liquidus of form I, open squares and broken line: liquidus of form III. The liquidus of form
III is stable above the solid – solid transition at 310 K (marked by the horizontal solid line) and
the liquidus of form II is stable below 310 K. Below the eutectic temperature water and
cysteamine hydrochloride crystallize in two separate solids. The liquidus lines become
metastable in this domain. Liquidus curves have been fitted with the Schröder equation using a
Redlich-Kister polynomial for the excess Gibbs energy; details can be found in the Supporting
Information.
4 Discussion
4.1 Comparison of the new structure form III with the two known forms I and
II

19
Figure 9. The different conformations of cysteamine in the three structures form I, the triclinic
form II (two conformations A and B), and form III. In each case the carbon-sulfur bond is parallel
to the paper.
In the results section the crystal structure of the new form III has been solved. Its structure
will be compared in this section with the reported structures of forms I and II, which have been
mentioned in the introduction (Table 1).6, 7 Cysteamine has only a single torsion angle
disregarding the hydrogen atoms (Figure 9). In all the 3 solid forms, the conformation of the
torsion angle involving the nitrogen and the sulfur atoms is gauche. Whereas the torsion angle in
form I is +61.49(15)°, in form III it is −65.2(4)°, and interestingly both torsion angles are present
in form II exhibiting two separate molecules: molecule A with −60.3(6)° and molecule B with
+60.7(6)° (Figure 9).
Ab initio calculations on an isolated neutral molecule of cysteamine have demonstrated the
existence of 14 possible rotamers defined by the torsion angles around the C-N, C-C, and C-S
bonds, the most stable having a gauche conformation around the N-C-C-S torsion, which is
stabilized by an intramolecular hydrogen bond between the thiol and the amino group.27
Although this hydrogen bond will not form with the ammonium group in cysteamine
hydrochloride, in all three crystal structures the conformation around the N-C-C-S torsion angle
remains gauche. That gauche is also the preferred conformation of charged cysteamine in
solution is confirmed by a study of cysteamine by Raman spectroscopy.28
In solid form III, the asymmetric unit contains one protonated cysteamine moiety and a
chloride ion, like in form I, whereas in form II Z’ equals 2. The molecular packing of form III is
presented in Figure 4b above. It consists of layers with alternating protonated cysteamine and
chloride ions parallel to the bc plane of the unit cell. Similar layers are observed in form I and
form II. Within the layers the amino groups are facing each other forming a strong square
shaped hydrogen-bond motif with two chloride ions (see Figure 10). This square or slightly
diamond shaped hydrogen-bond motif (graph set R24(8)) clearly containing a strong ionic

20
component is approximately parallel to the diagonal of the ab plane of the unit cell in form III.
The thiol group faces in the same direction as the amino group, thus it is the ethane backbone
that interconnects the layers of molecules joined by the square-shaped hydrogen bond
interaction (Figure 10) mainly by interactions between hydrogen atoms and the chloride ion.
This pattern is similar in all three forms; the principal difference is the conformation of the
cysteamine molecule (Figure 9).
Figure 10. Square-shaped interaction pattern formed by the hydrogen bonds interconnecting
the chloride ions and the NH3+ groups in form III.
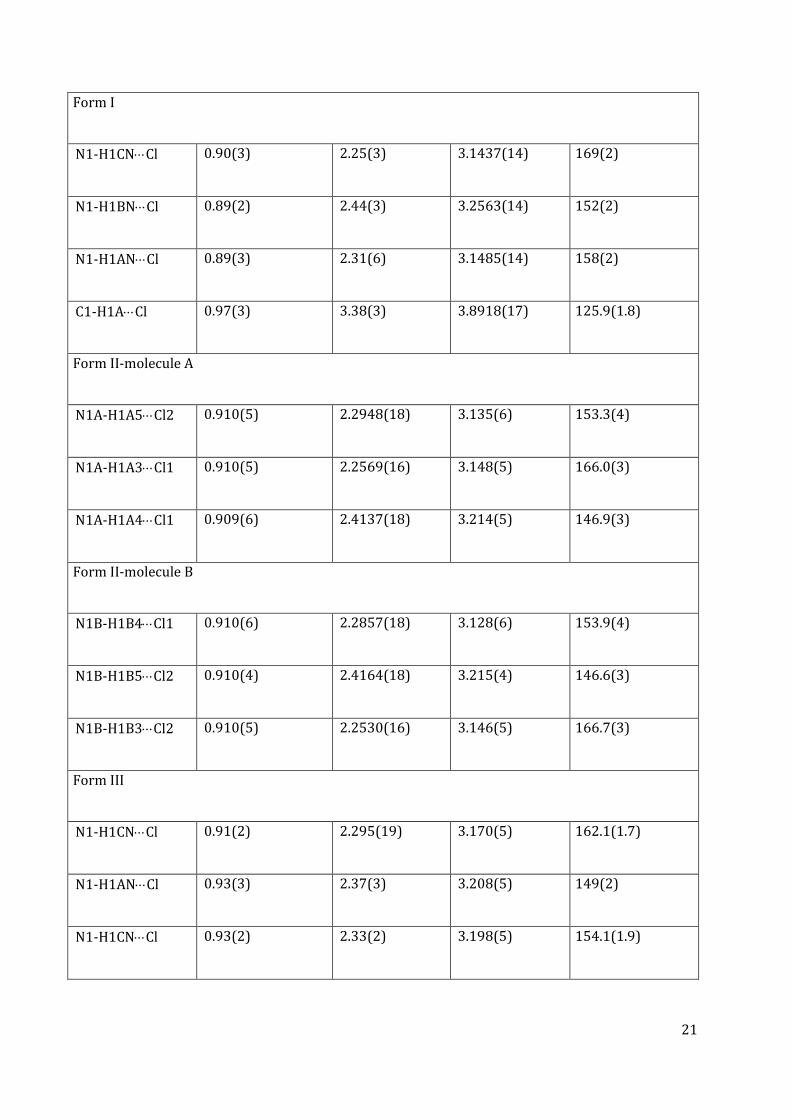
In all three forms, the three protons of the terminal ammonium group are involved in
hydrogen bonds with different chloride ions (Table 3). In addition, the chloride ions are also
involved in weaker hydrogen-bond type interactions with CH2 groups. This feature exists in all
three structures as can be seen in Figure 11.
Figure 11. The coordination sphere of the chloride ion is relatively similar in the three
structures. Three hydrogen bonds with the ammonium groups and one weak hydrogen bond
type interaction with a C-H in the backbone of cysteamine.
Table 3. Hydrogen bonds in cysteamine hydrochloride forms I, II, and III
D-H⋅⋅⋅A H-A H..D A…D D-H…A
21
Form I
N1-H1CN⋅⋅⋅Cl 0.90(3) 2.25(3) 3.1437(14) 169(2)
N1-H1BN⋅⋅⋅Cl 0.89(2) 2.44(3) 3.2563(14) 152(2)
N1-H1AN⋅⋅⋅Cl 0.89(3) 2.31(6) 3.1485(14) 158(2)
C1-H1A⋅⋅⋅Cl 0.97(3) 3.38(3) 3.8918(17) 125.9(1.8)
Form II-molecule A
N1A-H1A5⋅⋅⋅Cl2 0.910(5) 2.2948(18) 3.135(6) 153.3(4)
N1A-H1A3⋅⋅⋅Cl1 0.910(5) 2.2569(16) 3.148(5) 166.0(3)
N1A-H1A4⋅⋅⋅Cl1 0.909(6) 2.4137(18) 3.214(5) 146.9(3)
Form II-molecule B
N1B-H1B4⋅⋅⋅Cl1 0.910(6) 2.2857(18) 3.128(6) 153.9(4)
N1B-H1B5⋅⋅⋅Cl2 0.910(4) 2.4164(18) 3.215(4) 146.6(3)
N1B-H1B3⋅⋅⋅Cl2 0.910(5) 2.2530(16) 3.146(5) 166.7(3)
Form III
N1-H1CN⋅⋅⋅Cl 0.91(2) 2.295(19) 3.170(5) 162.1(1.7)
N1-H1AN⋅⋅⋅Cl 0.93(3) 2.37(3) 3.208(5) 149(2)
N1-H1CN⋅⋅⋅Cl 0.93(2) 2.33(2) 3.198(5) 154.1(1.9)

22
C2-H2A⋅⋅⋅Cl 1.11(3) 2.81(3) 3.581(5) 126.8(1.7)
C2-H2B⋅⋅⋅S1 1.14(2) 2.90(3) 3.811(6) 136.8(1.5)
For all three forms, their thermal expansion tensors are constant over the entire
temperature range. They are anisotropic exhibiting some uniaxial contraction (negative thermal
expansion). The coefficients range from −13 up to 120 ×10-6 K-1 in forms I and III, which is in the
same range as the thermal expansions of ternidazole, triethylenetetramine dihydrochloride and
diaminopyridine phosphate.29-31 The thermal expansion tensor for form II has been obtained
with only four measurement points, as the form only appears below 200 K, hence the numerical
results of the expansion tensor are most likely not accurate, however a similar picture as for the
other two forms can be observed (see supporting Information Table SI.4).
In forms I and III, a small uniaxial negative thermal expansion is observed along e1 (Table 4).
This direction coincides in both crystal forms with the alignment of the ammonium groups
involved in the square-shaped hydrogen-bond motif (graph set R24(8)) with strong ionic
character. The two chloride ions in this motif are more or less aligned along e2. Considering the
fact that the tensor in the e2 direction is very similar between form I and form III (Table 4), the
interactions in this direction are comparable if not similar. Projections of the thermal expansion
tensor in relation to the projection of the structure have been provided in the Supporting
Information (Figures SI.1-3 for forms I – III respectively).

23
Table 4. Coefficients of the thermal expansion tensors of forms I and IIa
Coefficients (×10-6 K-1)
Form I
α11 -4.3(1.9)
α22 69(3)
α33 90(3)
Form III
α11 -13(4)
α22 69(10)
α33 123(3)
aSee the supporting Information for an estimate of the thermal expansion tensor of form II
and the orientations of the tensors (Table SI.4).

24
4.2 The slope of the I-III equilibrium and their volume inequality
Figure 12. Specific volume of the three solid forms of cysteamine hydrochloride. Even though
the measurements have been obtained by high-resolution X-ray diffraction, the volumes are so
close that it is not possible to determine the sign of the volume inequalities between the three
solid phases. Blue circles: form I, red squares: form II, green triangles: form III. Filled symbols
are values form the literature. Lines are fits to the data.
Although the unit-cell volumes of the three solid phases have been determined as a function
of the temperature with high-resolution X-ray diffraction, it has not been possible to determine
the volume inequalities between the three phases (Figure 12). The volume differences are
smaller than the resolution of the measurements, as is clear from the overall standard deviations
provided with the fits of the specific volumes (eqs. 1-3). However, using the experimental high-
pressure thermal analysis data, one can see that the slope of the I-III equilibrium is 59 ±5 MPa K-
1 (equation (4) and Figure 5). It is also known from the DSC results that the enthalpy difference
between the two solid phases equals 9.9 ± 1.8 J g-1. In addition, the transition temperature has
been found at 310 ± 1 K (37 °C). These values can be inserted into the Clapeyron equation to
evaluate the volume difference between form I and form III:

25
(7)
with dP/dT the slope of a two-phase equilibrium in the pressure – temperature phase diagram
in MPa K-1, ΔS the entropy difference between the two phases in equilibrium, ΔV the volume
inequality between the two phases in equilibrium. At equilibrium, ΔS can be replaced by ΔH/T,
the enthalpy difference divided by the transition temperature obtained by calorimetry.
Using expression 7, the volume difference between forms I and III can be calculated and it
follows that ΔI→IIIv = 5.4(1.1)×10−4 cm-3g-1. This implies that the volume difference going from
form I to form III is positive, thus form III would have a slightly larger volume than form I.
However, it is also clear that the volume inequality is of the same order of magnitude as the
global fitting errors of the expressions for the specific volumes of forms I and III (4.2 ×10⁻⁴ cm-3g-
1 and 5.6×10⁻⁴ cm3g−1 respectively for eqs. 1 and 2). Thus, it can merely be stated that the volume
change is very small and most likely positive going from form I to form III. The steep slope of the
equilibrium line (Figure 5) implies that the transition is mainly heat or entropy driven, as its
dependence on the pressure is very weak, which is equivalent to the observation that the
volume change between the two solid phases is very small.
4.3 Pressure-temperature curve of the solid – liquid equilibrium III-L
The slope of the HP-DTA measurements equals 11.5 ±0.5 MPa K-1 (eq. 5). At the transition
temperature 340.4 ±0.5 K (67.3 °C), the enthalpy change associated with the transition equals
141.6 ±6.7 J g-1. The volume of form III is known at the melt and equals 0.766 cm3g-1 using
equation eq. 2. As in the previous section, the experimental slope of the solid – liquid equilibrium
allows the calculation of the volume inequality between the liquid phase and form III, which
leads to ΔIII→Lv = 0.0361 ±0.0026 cm3g-1, which in turn leads to the specific volume of the liquid
at the melting point, 0.802 ±0.005 cm3g-1. This is an increase of 4.7 % in volume on melting,
which is fairly small in comparison with most pharmaceutical systems, where the average
difference is in the order of 11%.32, 33

26
4.4 The topological pressure-temperature phase diagram involving form I,
form III and the liquid
4.4.1 What is a topological phase diagram
A topological phase diagram is a schematic representation of the domains of the stable
phases and their phase relationships. It can be extended to the metastable and supermetastable
phase domains because from a thermodynamic point of view these are simply states with a
higher Gibbs energy that eventually may lose their excess Gibbs energy to turn into the most
stable state spontaneously. There is no rule stating in which timeframe this will occur. A well-
known example is the allotropic forms diamond and graphite of which graphite is the most
stable phase under ambient conditions. This has not stopped anyone from spending lots of
money on the less stable diamond and neither are we concerned that diamond will convert into
graphite in our lifetime.
The topological phase diagram will be constructed with as much available experimental data
possible; however, in the case that data is lacking e.g. a melting point of a metastable phase or
triple points under very high or negative pressure, use will be made of extrapolations and
calculations, which are thermodynamically sound, even if they may be approximate. It should be
kept in mind that the main goal of this topological phase diagram is to demonstrate the relative
positions of the different phase domains towards each other as a function of pressure and
temperature and those of the two-phase equilibria, which represent the boundaries between the
domains. The more experimental data available, the more accurate will be the phase diagram;
however, certain parts of it may remain approximate.
To construct the topological pressure-temperature phase diagram in the present case, the
expressions of the phase equilibria between the condensed phases I-III, III-L, and the metastable
I-L are needed, triple points I-III-L, I-III-V, I-L-V, and III-L-V need to be located (with L the liquid
phase and V the vapor phase) and for the sake of completeness the curves representing the
saturating vapor pressure of the condensed phases, the equilibrium lines I-V, III-V, and L-V. In

27
the present section, the necessary data will be assembled and where necessary processed with
accepted thermodynamic equations to construct the topological phase diagram.
4.4.2 Phase equilibria I-III, III-L and I-L
In section 3.3, the expressions for the phase equilibria I-III (eq. 4) and III-L (eq. 5) have been
determined. The expression for the metastable phase equilibrium I-L is not known however
because the melting of phase I has not been observed and it will be obtained by calculation and
extrapolation below.
As can be seen in Figure 5, phase equilibria of condensed phases on the pressure-
temperature plane can be represented over a reasonable pressure-temperature interval as
straight lines. In any case, phase equilibria are monotonously increasing functions due to the fact
that the Gibbs energies involved are monotonous surfaces as a function of pressure and
temperature.34, 35 The simplest approximation of a monotonously rising function is a straight
line. To obtain a linear expression for the phase equilibrium I-L, the metastable melting of form I,
two points in the pressure-temperature domain need to be found on the I-L equilibrium line. The
two points that will be used are I-L-V and I-III-L, two triple points containing the I-L equilibrium.
Even though the melting point of form I is not observed by DSC as it converts into form III
before melting, thermodynamically the equilibrium between form I and the liquid exists as a
metastable equilibrium for which the temperature can be determined using an expression
obtained from thermodynamics and neglecting heat capacities36-38:
(8)
Here TI→L is the melting point of form I in kelvin, ∆III→LH is the melting enthalpy of form III
and TI→III is the temperature at which forms I and III are in equilibrium. The other two variables
follow the same nomenclature. Using the calorimetric data presented in the results section, one

28
finds 338.3 K (65.1 °C), thus just below the observed melting point. Because form I is metastable
at its melting point it cannot melt at a higher temperature than form III. The close proximity of
the two melting points justifies neglecting the heat capacities.37
The pressure at the melting temperature will depend on the vapor pressure of the
condensed phases of the I-L equilibrium in the DSC pan. Because the available volume in sealed
DSC pans is small, the saturated vapor pressure will be quickly reached; thus, the melting
transition, implying the equilibrium between solid I and the liquid occurs in equilibrium with the
vapor phase and this is therefore a triple point, in the present case I-L-V. The vapor pressure of
solid or liquid cysteamine hydrochloride has not been measured to our knowledge, but because
it is a salt, it must be very low, not higher than a few pascal and most likely lower. Thus the
coordinates of the triple point I-L-V can be considered to be approximately 338 K, 1 Pa.
The second triple point that will be used to determine the position of the I-L equilibrium line
is I-III-L. It can be seen that equilibria I-III and III-L must intersect at this triple point too.
Because the expressions for the latter two equilibria are known (eqs. 4 and 5), setting those
expressions equal to each other allows to find the temperature of the triple point and the
pressure follows from either eqs. 4 or 5. This leads to the coordinates 314 K, −309 MPa.
Obviously, these coordinates are obtained by approximation using straight lines and their values
are not accurate, however, they suffice to obtain an expression for the two-phase equilibrium I-
L. It can be observed that the pressure of the triple point is negative. One should be aware that in
these calculations negative pressure is mainly used as a mathematical approach; however
negative pressure is a physical reality as can be judged from the following references.34, 39, 40
With the forgoing coordinates obtained for the triple points I-III-L and I-L-V a straight line
can be fitted and the following approximate expression for the I-L equilibrium in the pressure –
temperature phase diagram can be obtained:
I-L: P(T) = −4.3×10³ + 12.8 T (9)

29
Assuming that the specific volume of the melt does not change much within the two degrees
difference between the two melting points (I-L 338 K, III-L 340 K), the volume inequality
between form I and the liquid can be obtained, ∆I→Lv = 0.0376 cm3g-1 (the melting point of form I
together with eq 1 results in the specific volume of form I, 0.7641 cm3g-1. The specific volume of
the melt was obtained in section 4.3). With the slope of the I-L equilibrium (eq. 9), the volume
inequality and the transition temperature, the enthalpy of transition for the melt of form I can be
obtained, which leads to ΔI→LH of 162 J g-1. This compares to an enthalpy of 151 J g-1, if a
thermodynamic cycle (Hess’ cycle) is used; the enthalpy, a state function, must fulfill ΔI→LH =
ΔI→IIIH + ΔIII→LH, because on both sides of the equality sign the initial state and the final state are
the same (form I and the liquid, respectively). The difference between the melting enthalpies
obtained via the two approaches (topological or Hess’ cycle) is 7%; this demonstrates that even
though some of the calculations above are based on extrapolations and approximations, the
obtained topological results are consistent with the results of the Hess’ cycle.
Using eqs. 4, 5, and 9 a topological phase diagram has been constructed (Figure 13). The
triple point I-III-L is the point where the three equations intersect. The triple points I-III-V, I-L-V,
and III-L-V are the solid-solid transition, the metastable melting point of form I and the stable
melting point of form III under saturating vapor pressure of cysteamine hydrochloride. These
three triple points reflect the conditions in DSC measurements as stated above when discussing
the I-L-V triple point. Their coordinates are therefore respectively 310 K, 338 K and 340 K, with
a vapor pressure that will slowly rise with temperature, but remain low (in the order of a few
Pa) due to the fact that cysteamine hydrochloride is a salt. To reflect the increase of the vapor
pressure, and also the fact that each condensed phase has its own vapor equilibrium, a
schematic representation of the I-V, III-V, and L-V equilibrium curves have been added to Figure
13. The exact vapor pressure they represent is not known, but their relative position in the
pressure-temperature phase diagram follows a well-established order.37, 41

30
One of the questions a topological phase diagram helps to answer is what is stable and under
which conditions for the phases present in the phase diagram. This analysis is purely based on
thermodynamics. First of all the III-L equilibrium line and the triple point III-L-V are stable,
because they represent the highest melting solid and order disorder transitions are not
kinetically restricted. Around triple points equilibrium lines must obey the alternation rule. It
signifies that an equilibrium crossing a triple point becomes metastable in relation to another
phase, which becomes more stable and it means that around a triple point one will find
alternatingly stable and metastable equilibrium lines. Thus around III-L-V, III-L is stable (black
solid line) with increasing pressure and metastable (gray broken line) below the triple point
where the vapor phase is more stable. On the left hand side of the triple point the stable III-V
equilibrium is found, which, passing through III-L-V, becomes metastable, where the liquid
phase is the more stable phase. Inversely, a stable L-V equilibrium is found on the right-hand
side, which becomes metastable on the left-hand side (difficult to see due to the presence of
triple point I-L-V), where form III is the most stable phase.
From this point on the alternation rule can be used to define the entire stability hierarchy in
the topological phase diagram. As can be seen, the metastable extension of the III-L equilibrium
crosses the extensions of the I-L and I-III equilibria at negative pressure. The alternation rule
implies that I-L must have a different ranking from III-L and I-III, which must both have the same
ranking (metastable). Triple points of condensed phases under negative pressure must be
metastable;39 therefore, the only option for the stability ranking of equilibrium I-L is even less
stable than III-L and I-III, so-called supermetastable (dotted line). The metastable extension of
equilibrium I-III meets the stable equilibrium III-V in the triple point I-III-V, and thus this triple
point is stable and the equilibrium I-III becomes stable on crossing the triple point I-III-V
increasing in pressure. Triple point I-L-V on the other hand is met by the supermetastable
equilibrium I-L and the metastable equilibrium L-V (through III-L-V), thus this triple point I-L-V
must be metastable. The resulting topological phase diagram is presented in Figure 13 with all
equilibrium lines and triple points obeying the alternation rule.

31
As the transition I-III is stable, both form I and form III must have a stable domain too.
Because the I-III equilibrium and the III-L equilibrium are positive and diverge with increasing
pressure (Figures 5 and 13) the two phases have an overall enantiotropic phase relationship.42,
43 As for the triclinic form II (absent in this phase diagram), only the specific volume is known as
a function of temperature between 100 and 200 K. The fact that II appeared at low temperature
during the measurements indicates that it is more stable than form III at low temperature, but
the transition temperature is not known. It is therefore not yet possible to incorporate form II in
the present phase diagram. Nonetheless, the stability hierarchy between forms I and III
determined in this paper will not be affected once form II is added to the phase diagram.
Figure 13. Topological phase diagram of cysteamine hydrochloride involving solid forms I and
III. Lines: schematic representation of two-phase equilibria, solid line: stable, broken line:
metastable, dotted line: supermetastable, Circles: triple points, filled circle: stable, gray circle:
metastable. The stability domains of the solid forms I and III, the liquid and the vapor phase have

32
been marked by respectively I, III, L, and V. Their stable domains are defined by the black solid
lines, which represent the stable two-phase equilibria involving the stable phases on both sides
of those lines. Pressure and temperature are not to scale; the vapor pressures of all condensed
phases are on this scale effectively 0 MPa. However, from a thermodynamic point of view vapor
is present; therefore, the part of the pressure scale close to 0 MPa has been exaggerated to
demonstrate the interchanging stability hierarchy of the different equilibria involving the vapor
phase. The temperature coordinates of triple points I-III-V, I-L-V, and III-L-V are respectively
310 K, 338.3 K, and 340.4 K with an approximate but positive pressure of 0 MPa. Triple point I-
III-L has the approximate coordinates of 314 K and -309 MPa.
4.5 Stability with respect to water
In the results section, it has been found that cysteamine hydrochloride forms a eutectic
equilibrium with water. In principle, it is possible to calculate the entire eutectic phase diagram
once the eutectic temperature and a few temperature points on the liquidus line have been
obtained. However, the present system has the complication of the phase change with increasing
temperature. Considering the DVS curve in Figure 6, the presence of a small amount of water
vapor, does not appear to affect the state of cysteamine hydrochloride, as the water does not get
absorbed (its mass remains virtually constant up to 35 %RH). Therefore solid solutions –i.e. the
incorporation of water molecules in the crystal structure of cysteamine hydrochloride- probably
do not exist for the present system. In that case, the liquid in the binary system saturated in
cysteamine hydrochloride is in equilibrium with the pure solid state of the drug. This allows to
use the Schröder equation with a Redlich-Kister polynomial to calculate the Gibbs excess energy
in the liquid phase. Details of the calculations can be found in the Supporting Information.
The delicate part for this system is the phase transition between form I and form III that
occurs at approximately 310 K. The eutectic temperature occurs clearly far below this
temperature, which implies that it is the eutectic formed between water and form I, the
commercial form, which is stable below 310 K. The Schröder equation needs the temperature of

33
fusion and the enthalpy of fusion of cysteamine hydrochloride as input, however, these should
be the values of form I for the liquidus crossing the eutectic with water. The values have been
obtained in the section on the topological pressure – temperature phase diagram and equal
338.3 K for the melting point of form I and 151 J g-1 for its melting enthalpy. Using the measured
liquidus points at and below 310 K and using the requirement that both liquidi (those of water
and of form I) have to meet at the eutectic temperature of 240 K, the liquidus curves can be
fitted. They are represented by the solid black curves in Figure 8. The eutectic composition
found in this way is 0.235 mole%.
The same Redlich-Kister excess values can be used for the liquidus of form III, because the
excess is defined by the liquid mixture. As can be seen, the broken line representing the liquidus
of form III starts at a melting point above that of form I, and it intersects, as expected, the
liquidus curve of form I at approximately 310 K (the shallow difference in slopes does not allow
a precise determination by this method, but it clearly demonstrates that the result is consistent
with the transition temperature found by DSC). Finally, it can be seen that form III produces its
own metastable eutectic with water, indicated by the intersection between the liquidus curve of
form III (broken line) and the one of water, at a slightly lower temperature (237 K) and a slightly
higher concentration in cysteamine hydrochloride (24.7 mole%) in comparison to the eutectic
found for form I.
The eutectic T-x diagram, the unary pressure temperature diagram and the DVS result in
Figure 6 (representing in fact a concentration as a function of the partial pressure of water or x-
P diagram, cf. Figure 14b) are all different cross sections of the pressure – temperature behavior
of the binary system cysteamine hydrochloride and water. Even though a T-x diagram is
generally considered isobaric, the fact that the point obtained from the DVS measurement at
25°C and 0.475 mole fraction lies on the liquidus curve obtained by DSC, proves that the
obtained T-x diagram in Figure 8 is actually not isobaric, because the vapor pressure of water in
the system (= in the DVS and = in the DSC pan) depends on the temperature. At the cysteamine-

34
rich side the pressure of the system equals that of the vapor pressure of cysteamine
hydrochloride (Figure 14a). At the water-rich side, the pressure of the system is determined by
the vapor pressure of pure water, which is higher than that of cysteamine hydrochloride as a
function of temperature. Thus, taking the pressure coordinate into account, the projected T-x
diagram in Figure 8 is actually shifted in relation to the vapor pressure of the system as
schematically indicated in Figure 14a. Moreover, in P-T-x coordinates the T-x slice projected on
the T-x plane in Figure 8 exhibits a curvature with increasing temperature due to the increase of
the combined vapor pressure of the binary system (Figure 14a).
In Figure 14a the pressure component is simplified, because a full representation cannot be
clearly presented in 3 dimensions; the present P-T-x diagram is a depiction of the condensed
phases neglecting the vapor phase. The related P-x behavior during the DVS measurement at 25
°C has been provided in Figure 14b. The trace of the DVS measurement has also been indicated
in Figure 14a by a dotted line. In Figure 14b, it can be seen that while the water vapor pressure
is increased (black-red curve from 0 - 3) there is no immediate take up of water by cysteamine
hydrochloride (black-yellow trace marked 0 – 1 in the Figure 14b). This only happens when the
water vapor in the DVS reaches the vapor pressure (point 3) that is in equilibrium with the
saturated solution of cysteamine hydrochloride in water (point 2: 47.5 mol% cysteamine
hydrochloride at 25 °C). As can be seen in the DVS curve, Figure 6, water take-up occurs very
rapidly, as the system continues to form saturated solution from the water vapor. Once all solid
cysteamine hydrochloride has been converted into saturated solution with water, the solution
begins to dilute (trace 2 – 4), following the water vapor pressure imposed by the DVS (trace 3 –
5) in equilibrium with the solution. As the maximum relative humidity in the DVS experiment
was about 90 %RH, it is obvious from the curves that the maximum ‘dilute’ solution (point 4, 9.3
mol%) is still rather concentrated, as the vapor pressure is much richer in water than the
solution with which the vapor is in equilibrium. The concentration in the vapor phase cannot be
calculated, because the vapor pressure of cysteamine hydrochloride is not known; however, it
will most likely be very rich in water.

35
a
b
Figure 14. (a) Simplified pressure (P) – temperature (T) – composition (x) phase diagram
for a sample under saturated vapor pressure. On the left-hand side the T-P diagram of water
(broken lines), on the right-hand side the T-P diagram of cysteamine hydrochloride, marked c.h.
(broken lines). The solid lines in the T-x diagram originate from the respective equivalent
transitions in the unary P-T diagrams, hence also the pressure changes with the composition, as
has been schematically indicated as a function of the pressure coordinate. (b) The real pressure
– composition behavior is more complicated as is shown by the schematic P-x diagram for the
DVS measurement at 25 °C (dotted line in Figure a). At point 0, bottom, right-hand side, dry
cysteamine hydrochloride is subjected to water vapor. In first instance, with the increase of the
water vapor pressure (red-black curve), no water is taken up by cysteamine hydrochloride
(yellow-black curve) up to point 1. At point one, the water vapor pressure (3) is in equilibrium
with the solid 1 and the saturated solution 2 (2 is also marked in Figure (a) and represents a

36
point on the liquidus curve). Increasing the water pressure leads to a dilution of the solution as
indicated by the line 2-4 (cf. Figure 6, the numbers have also been provided on the DVS curve).
Solution 4 is in equilibrium with vapor mixture 5 very rich in water.
5 Conclusions
A new solid form of cysteamine hydrochloride has been discovered and its crystal structure, the
monoclinic spacegroup I2/a, has been determined by X-ray powder diffraction. All three known
crystal structures of cysteamine hydrochloride have a very similar interaction make-up.
The new solid form III is stable above 310 K, but persists at lower temperatures as can be
judged from the crystallographic measurements as a function of temperature down to about 200
K, as below 200 K form II appears in the diffraction patterns. The commercial form, form I, has
not been observed to transform into form II at low temperature by X-ray diffraction as a function
of temperature. Although this may be an indication that form I is more stable than form II at low
temperature, it can simply mean that the transformation of form I into form II is slow. Forms I
and III have an overall enantiotropic phase relationship or in other words, they both have a
stability domain with increasing pressure. The I-III equilibrium and the III-L equilibrium diverge
with increasing pressure, which implies that form I does not possess a stable melting
equilibrium in the pressure – temperature phase diagram. The transition between forms I and III
is mainly entropy driven, as the pressure has virtually no effect on the position of the
equilibrium. Considering the reversible transition between forms III and II observed by X-ray
diffraction and described in the results section, these two phases may have an enantiotropic
phase relationship, although a precise transition temperature (200 ± 20 K) between the two
solid phases has not been obtained. It is not clear whether form II possesses any stable domain
in the P-T phase diagram, because form I, stable at room temperature, has not been observed to
transform into form II at low temperatures.

37
It is clear that cysteamine hydrochloride is hygroscopic and water increase is substantial
when the relative humidity rises above 35%. In fact above this water vapor pressure, cysteamine
hydrochloride liquefies immediately to form a very concentrated saturated solution of 47.5
mole% in water. Also considering the low eutectic temperature of 240 K, it is clear that any
presence of water, will basically cause cysteamine hydrochloride to dissolve. There is no
evidence for the existence of a hydrate with cysteamine hydrochloride.
The present paper combines the results of measurements on the unary system with those on
cysteamine hydrochloride with water. It has been shown how these different elements can be
combined to improve the understanding of the system, for example for the calculation of the
liquidus in the temperature – composition phase diagram.
From a pharmaceutical point of view, the findings imply that form I would be the best form
to develop, as it appears to be the most stable form under ambient conditions. However, if
cysteamine hydrochloride is subjected to temperatures above 40°C for a sufficient amount of
time, which would only be a couple of hours, the compound may transform into form III and
persist in that form when the temperature comes down to room temperature (It is not known
for how long form III persists at room temperature). For formulations, this will probably have
very little effect, as the volume of both phases is virtually the same. The persistence of form III
under ambient conditions may however slightly increase solubilization, as form III is less stable
than form I under ambient conditions.
The samples should be strictly protected against water, as a saturated solution of water and
cysteamine hydrochloride forms under low water-vapor pressures. In the concentrated solution,
degradation may occur among others by formation of cystamine dihydrochloride. The
susceptibility to water implies that cysteamine hydrochloride should be stored in a dry
environment and also that refrigeration should be avoided; cold samples will attract water by
condensation and immediately form saturated solution.
38
Acknowledgement
The authors thank R. Céolin (U. Paris Descartes) for discussion, scientific insight, and
dedication to scientific rigor. This work has been partially supported by the Spanish Ministry of
Science and Innovation (grant FIS2008-00837) and the Catalan Government (grant 2014 SGR-
581).
Supporting Information Available
Tabulated unit cell parameters of cysteamine hydrochloride forms I, II, and III.
Tabulated coefficients and orientations of the thermal expansion tensor (forms I, III, and
II). Figures of the thermal expansion tensor for forms I, II, and III in relation to their
respective structures. This information is available free of charge via the internet at
http://pubs.acs.org/
References
1. Kataoka, H.; Imamura, Y.; Tanaka, H.; Makita, M. Determination of cysteamine and cystamine by gas chromatography with flame photometric detection. J. Pharm. Biomed. Anal. 1993, 11, (10), 963-969. 2. Kataoka, H.; Tanaka, H.; Makita, M. Determination of total cysteamine in urine and plasma samples by gas chromatography with flame photometric detection. J. Chromatogr. 1994, B 657, 9-13. 3. Besouw, M.; Masereeuw, R.; van den Heuvel, L.; Levtchenko, E. Cysteamine: an old drug with new potential. Drug Discovery Today 2013, 18, (15/16), 785-792. 4. Labbé, A.; Baudouin, C.; Deschênes, G.; Loirat, C.; Charbit, M.; Guest, G.; Niaudet, P. A new gel formulation of topical cysteamine for the treatment of corneal cystine crystals in cystinosis: The Cystadrops OCT-1 study. Molecular Genetics and Metabolism 2014, 111, 314-320. 5. Stachowicz, M.; Lehmann, B.; Tibi, A.; Prognon, P.; Daurat, V.; Pradeau, D. Determination of total cysteamine in human serum by a high-performance liquid chromatography with fluorescence detection. J. Pharm. Biomed. Anal. 1998, 17, 767-773. 6. Kim, C.-H.; Parkin, S.; Bharara, M.; Atwood, D. Linear coordination of Hg(II) by cysteamine. Polyhedron 2002, 21, 225-228. 7. Ahmad, S.; Shaheen, M. A.; Stoeckli-Evans, H. A monoclinic polymorph of cysteamine hydrochloride. Acta Crystallogr. 2010, E66, o134. 8. Lahiani-Skiba, M.; Boulet, Y.; Youm, I.; Bounoure, F.; Verite, P.; Arnaud, P.; Skiba, M. Interaction between hydrophilic drug and α-cyclodextrins: physico-chemical aspects. Journal of Inclusion Phenomena and Macrocycle Chemistry 2007, 57, 211-217. 9. Coelho, A. A. TOPAS Academic version 4.1 (Computer Software), Coelho Software: Brisbane, 2007. 10. David, W. I. F.; Shankland, K.; van de Streek, J.; Pidcock, E.; Motherwell, W. D. S.; Cole, J. C. DASH: a program for crystal structure determination from powder diffraction data. J. Appl. Crystallogr. 2006, 39, 910-915.

39
11. David, W. I. F.; Sivia, D. S. Background estimation using a robust Bayesian analysis. J. Appl. Crystallogr. 2001, 34, 318-324. 12. Finger, L. W.; Cox, D. E.; Jephcoat, A. P. A correction for powder diffraction peak asymmetry due to axial divergence. J. Appl. Crystallogr. 1994, 27, 892-900. 13. Thompson, P.; Cox, D. E.; Hastings, J. B. Rietveld refinement of Debye-Scherrer synchrotron X-ray data from Al2O3. J. Appl. Crystallogr. 1987, 20, 79-83. 14. Boultif, A.; Louer, D. Indexing of Powder Diffraction Patterns for Low-Symmetry Lattices by the Successive Dichotomy Method. J. Appl. Crystallogr. 1991, 24, 987-993. 15. Boultif, A.; Louer, D. Powder pattern indexing with the dichotomy method. J. Appl. Crystallogr. 2004, 37, 724-731. 16. Louer, D.; Louer, M. Trial-and-Error Method for Automatic Indexing of Powder Diagrams. J. Appl. Crystallogr. 1972, 5, (Jul1), 271-275. 17. Markvardsen, A. J.; David, W. I. F.; Johnson, J. C.; Shankland, K. A probabilistic approach to space-group determination from powder diffraction data. Acta Crystallogr. A 2001, 57, 47-54. 18. Ilioudis, C. A.; Hancock, K. S. B.; Georganopoulou, D. G.; Steed, J. W. Insights into supramolecular design from analysis of halide coordination geometry in a protonated polyamine matrix. New J. Chem. 2000, 24, (10), 787-798. 19. Dollase, W. A. Correction of Intensities for Preferred Orientation in Powder Diffractometry - Application of the March Model. J. Appl. Crystallogr. 1986, 19, 267-272. 20. Bruno, I. J.; Cole, J. C.; Kessler, M.; Jie, L.; Motherwell, W. D. S.; Purkis, L. H.; Smith, B. R.; Taylor, R.; Cooper, R. I.; Harris, S. E.; Orpen, A. G. Retrieval of crystallographically-derived molecular geometry information. J. Chem. Inf. Comput. Sci. 2004, 44, 2133-2144. 21. Würflinger, A. Differential thermal-analysis under high-pressure IV. Low-temperature DTA of solid-solid and solid-liquid transitions of several hydrocarbons up to 3 kbar. Ber. Bunsen-Ges. Phys. Chem. 1975, 79, (12), 1195-1201. 22. Weigel, D.; Beguemsi, T.; Garnier, P.; Berar, J. F. Evolution of thermal-expansion tensor as function of temperature .1. General law of evolution of tensor symmetry. J. Solid State Chem. 1978, 23, (3-4), 241-251. 23. Salud, J.; Barrio, M.; Lopez, D. O.; Tamarit, J. L.; Alcobe, X. Anisotropy of intermolecular interactions from the study of the thermal-expansion tensor. J. Appl. Crystallogr. 1998, 31, 748-757. 24. Cliffe, M. J.; Goodwin, A. L. PASCal: a principal axis strain calculator for thermal expansion and compressibility determination. J. Appl. Crystallogr. 2012, 45, 1321-1329. 25. Kaminski, W. WinTensor (http://www.wintensor.com), 1.1; 2004. 26. Bridgeman, O. C.; Aldrich, E. W. Vapor pressure table for water. J. Heat Transfer 1964, 86, 279-286. 27. Buemi, G. Conformational analysis and rotation barriers of 2-aminoethanethiol and 2-aminoethanol: An ab initio study. Int. J. Quantum Chem 1996, 59, (3), 227-237. 28. Riauba, L.; Niaura, G.; Eicher-Lorka, O.; Butkus, E. A study of cysteamine ionization in solution by Raman spectroscopy and theoretical modeling. J. Phys. Chem. A 2006, 110, (50), 13394-13404. 29. Mahe, N.; Perrin, M.; Barrio, M.; Nicolai, B.; Rietveld, I.; Tamarit, J.; Ceolin, R. Solid-State Studies of the Triclinic (Z '=2) Antiprotozoal Drug Ternidazole. J. Pharm. Sci. 2011, 100, (6), 2258-2266. 30. Mahe, N.; Nicolai, B.; Allouchi, H.; Barrio, M.; Do, B.; Ceolin, R.; Tamarit, J.-L.; Rietveld, I. B. Crystal Structure and Solid-State Properties of 3,4-Diaminopyridine Dihydrogen Phosphate and Their Comparison with Other Diaminopyridine Salts. Cryst Growth Des 2013, 13, (2), 708-715.

40
31. Henriet, T. TETA. 2015. 32. Ceolin, R.; Rietveld, I. B. Phenomenology of polymorphism and topological pressure-temperature diagrams. J. Therm. Anal. Calorim. 2010, 102, (1), 357-360. 33. Barrio, M.; Maccaroni, E.; Rietveld, I. B.; Malpezzi, L.; Masciocchi, N.; Ceolin, R.; Tamarit, J.-L. Pressure-temperature state diagram for the phase relationships between benfluorex hydrochloride forms I and II: A case of enantiotropic behavior. J. Pharm. Sci. 2012, 101, (3), 1073-1078. 34. Bridgman, P. W., The physics of high pressure. Dover Publications: New York, 1970. 35. Oonk, H. A. J., Phase theory, The thermodynamics of heterogeneous equilibria. Elsevier Scientific Publishing Company: Amsterdam, 1981. 36. Yu, L. Inferring Thermodynamic Stability Relationship of Polymorphs from Melting Data. J. Pharm. Sci. 1995, 84, (8), 966-974. 37. Gana, I.; Barrio, M.; Do, B.; Tamarit, J.-L.; Ceolin, R.; Rietveld, I. B. Benzocaine polymorphism: Pressure-temperature phase diagram involving forms II and III. Int. J. Pharm. 2013, 456, (2), 480-488. 38. Bennema, P.; van Eupen, J.; van der Wolf, B. M. A.; Los, J. H.; Meekes, H. Solubility of molecular crystals: Polymorphism in the light of solubility theory. Int. J. Pharm. 2008, 351, (1-2), 74-91. 39. Landau, L. D.; Lifshitz, E. M., Statistical physics - Course of theoretical physics. 3rd edition ed.; Butterworth-Heinemann: Oxford, 1984; Vol. 5. 40. Zheng, Q.; Durben, D. J.; Wolf, G. H.; Angell, C. A. Liquids at large negative pressures: water at the homogeneous nucleation limit. Science 1991, 254, 829-832. 41. Gana, I.; Ceolin, R.; Rietveld, I. B. Bicalutamide polymorphs I and II: a monotropic phase relationship under ordinary conditions turning enantiotropic at high pressure. J. Therm. Anal. Calorim. 2013, 112, (1), 223-228. 42. Bakhuis Roozeboom, H. W., Die heterogenen Gleichgewichte vom Standpunkte der Phasenlehre. Erstes Heft: Die Phasenlehre - Systeme aus einer Komponente. Friedrich Vieweg und Sohn: Braunschweig, 1901; Vol. 1. 43. Ceolin, R.; Tamarit, J. L.; Barrio, M.; Lopez, D. O.; Nicolaï, B.; Veglio, N.; Perrin, M. A.; Espeau, P. Overall monotropic behavior of a metastable phase of biclotymol, 2,2'-methylenebis(4-chloro-3-methyl-isopropylphenol), inferred from experimental and topological construction of the related P-T state diagram. J. Pharm. Sci. 2008, 97, (9), 3927-3941.

41
TOC
Related Documents