sustainability Article An Integrated Model of Park-And-Ride Facilities for Sustainable Urban Mobility Jairo Ortega 1, * ,János Tóth 1 , TamásPéter 2 and Sarbast Moslem 1 1 Department of Transport Technology and Economics, Faculty of Transportation Engineering and Vehicle Engineering, Budapest University of Technology and Economics, M˝ uegyetem rkp. 3, 1111 Budapest, Hungary; [email protected] (J.T.); [email protected] (S.M.) 2 Department of Control for Transportation and Vehicle Systems, Faculty of Transportation Engineering and Vehicle Engineering, Budapest University of Technology and Economics, M˝ uegyetem rkp. 3, 1111 Budapest, Hungary; [email protected] * Correspondence: [email protected] Received: 1 May 2020; Accepted: 3 June 2020; Published: 5 June 2020 Abstract: The Park and Ride (P&R) System is part of a set of parking policies provided by Sustainable Urban Mobility Plans (SUMPs) that have been used in developing efficient, safe and environmentally friendly solutions to reduce the undesirable effects of private vehicles in Central Business District (CBD). In fact, the P&Rs are allocated near public transportation stations to ease transfer from a private vehicle to a public transportation mode. Therefore, the P&R system is considered as an alternative transport mode in which the location and potential demand of each facility are fundamental components to be evaluated within sustainable urban planning. The paper proposes an integrated model of P&R facilities based on estimate the potential demand through a mathematical model of the seven park-and-ride (P&R) facilities (designated A to G) in Cuenca city, Ecuador. The developed integrated model includes two cost functions: one is the P&R mode, and the second is the private car mode. Additionally, a SUMP is integrated into the model as a data collection source in order to find the required parameters for the cost functions and origin–destination (O-D) matrix of private vehicles. The results showed that three out of the seven P&R facilities (P&R C, P&R G, and P&R A) had the highest demand (70% of the overall demand). Consequently, these three P&R facilities were studied separately using the same developed model, and the demand proved to be the highest for P&R facility “C” (39% out of 70%). In conclusion, SUMPs, as a methodology for data collection and a mathematical model, proved to be an effective integrated method for evaluating the most attractive P&R location based on the potential demand. Keywords: Park and Ride; Sustainable Urban Mobility Plan; mathematical model; Logit Choice Model; public transport 1. Introduction The Sustainable Urban Mobility Plan (SUMP) is one of the most essential methods that has been used as a tool by government authorities and transport planners for urban strategic development. In addition, it is considered a guide to promote a shift towards more sustainable modes of transport, supporting the integration of all modes of transport and providing efficient, safe and environmentally friendly solutions [1]. SUMPs can be used as a data collection method whereby information regarding transport modes, policies, and origin–destination (O–D) trips can be gathered to develop transport planning [2,3]. One of the most widely used parking policies to solve the undesirable effects of private vehicles on urban centers is the P&R system. This system allows private vehicle users travelling to a Central Business District (CBD) to leave their vehicles there and transfer to public transport modes Sustainability 2020, 12, 4631; doi:10.3390/su12114631 www.mdpi.com/journal/sustainability

Welcome message from author
This document is posted to help you gain knowledge. Please leave a comment to let me know what you think about it! Share it to your friends and learn new things together.
Transcript

sustainability
Article
An Integrated Model of Park-And-Ride Facilities forSustainable Urban Mobility
Jairo Ortega 1,* , János Tóth 1, Tamás Péter 2 and Sarbast Moslem 1
1 Department of Transport Technology and Economics, Faculty of Transportation Engineering and VehicleEngineering, Budapest University of Technology and Economics, Muegyetem rkp. 3, 1111 Budapest,Hungary; [email protected] (J.T.); [email protected] (S.M.)
2 Department of Control for Transportation and Vehicle Systems, Faculty of Transportation Engineering andVehicle Engineering, Budapest University of Technology and Economics, Muegyetem rkp. 3, 1111 Budapest,Hungary; [email protected]
* Correspondence: [email protected]
Received: 1 May 2020; Accepted: 3 June 2020; Published: 5 June 2020�����������������
Abstract: The Park and Ride (P&R) System is part of a set of parking policies provided by SustainableUrban Mobility Plans (SUMPs) that have been used in developing efficient, safe and environmentallyfriendly solutions to reduce the undesirable effects of private vehicles in Central Business District(CBD). In fact, the P&Rs are allocated near public transportation stations to ease transfer from aprivate vehicle to a public transportation mode. Therefore, the P&R system is considered as analternative transport mode in which the location and potential demand of each facility are fundamentalcomponents to be evaluated within sustainable urban planning. The paper proposes an integratedmodel of P&R facilities based on estimate the potential demand through a mathematical model of theseven park-and-ride (P&R) facilities (designated A to G) in Cuenca city, Ecuador. The developedintegrated model includes two cost functions: one is the P&R mode, and the second is the privatecar mode. Additionally, a SUMP is integrated into the model as a data collection source in order tofind the required parameters for the cost functions and origin–destination (O-D) matrix of privatevehicles. The results showed that three out of the seven P&R facilities (P&R C, P&R G, and P&R A)had the highest demand (70% of the overall demand). Consequently, these three P&R facilities werestudied separately using the same developed model, and the demand proved to be the highest forP&R facility “C” (39% out of 70%). In conclusion, SUMPs, as a methodology for data collection and amathematical model, proved to be an effective integrated method for evaluating the most attractiveP&R location based on the potential demand.
Keywords: Park and Ride; Sustainable Urban Mobility Plan; mathematical model; Logit ChoiceModel; public transport
1. Introduction
The Sustainable Urban Mobility Plan (SUMP) is one of the most essential methods that has beenused as a tool by government authorities and transport planners for urban strategic development.In addition, it is considered a guide to promote a shift towards more sustainable modes of transport,supporting the integration of all modes of transport and providing efficient, safe and environmentallyfriendly solutions [1]. SUMPs can be used as a data collection method whereby information regardingtransport modes, policies, and origin–destination (O–D) trips can be gathered to develop transportplanning [2,3]. One of the most widely used parking policies to solve the undesirable effects of privatevehicles on urban centers is the P&R system. This system allows private vehicle users travelling to aCentral Business District (CBD) to leave their vehicles there and transfer to public transport modes
Sustainability 2020, 12, 4631; doi:10.3390/su12114631 www.mdpi.com/journal/sustainability

Sustainability 2020, 12, 4631 2 of 15
to complete their journeys [4]. In addition, the P&R system is considered as a transport mode thatpromotes the intermodal shift towards a more sustainable transport mode inside of the urban area [5].
The location of each facility is a variable that determines how attractive the P&R system is topotential users. Thus, one of the most widely used approaches to determine the location of a P&Rfacility is placing them near public transportation stations to facilitate the transfer between a privatevehicle and public transportation (e.g., light rail transit (LRT), metro, urban bus), potentially leadingthe P&R system to have a facility at every station. In addition, a novel method has emerged in recentyears regarding the facilities’ location, where the parking policies established in the SUMPs provide theallocation and other metrics for the P&R system. Using the methods mentioned above for the problemof location of the facilities, can lead to understanding which facility could be more attractive; in orderto solve this doubt, the potential demand is estimated. Further analysis to estimate the potentialdemand may permit the allocation to be determined based on the users’ preferences. To determinethe potential demand and to define the most attractive facility, a set of equations is used, which isdenominated as a mathematical model. This model is developed based on variables, constraintsand an objective function [6]. The purpose is to maximize user preference when selecting the P&Rmode. To achieve this goal, the data provided by the SUMP are entered into the mathematical model.Therefore, the combination of a SUMP as a data collection method and the use of a mathematicalmodel results in an Integrated Model of Park-and-Ride Facilities for Sustainable Urban Mobility.This Integrated Model is solved by using an open-source programming language with extensivesupport modules.
The case study is Cuenca in Ecuador, where local authorities developed a mobility plan in 2014 thatestablished a set of policies to make the city more sustainable for the environment. In accordance with thetransport policies, a P&R system was established. In addition, data are provided about the componentsof the transport modes that have been established, and factors such as the origin–destination matrix,and modal split.
In order to develop such an analysis, in this article, the necessary data are gathered from theSUMP to formulate a mathematical model that calculates the potential demand for each P&R facility.Thus, the result is the development of an Integrated Model of Park-and-Ride Facilities for SustainableUrban Mobility. In addition, two scenarios are applied. Scenario I is based on the location given inthe SUMP, and Scenario II is based on the location of the three facilities with the highest demandidentified in Scenario I. Hence, we will be able to determine which facility or set of facilities are themost attractive according to the potential demand.
To the best of the author’s knowledge, there are no articles in the literature that develop anIntegrated Model of Park-and-Ride Facilities for Sustainable Urban Mobility that uses the SUMP as adata collection method and consequently applies it in a mathematical model to find the potential demandfor the P&R system and determine which facility or facilities are the most attractive. The contributionsof this study are summarized in the following points: (1) We use SUMP to collect data regardingtransport modes, policies, and origin-destination (O–D). SUMPs provide useful static data whendeveloping transport studies and transport planning. (2) A mathematical model is applied and furtherverified through a numerical example that allows the evaluation of the P&R location proposed in theSUMP and determination of the most attractive facility according to the potential demand. (3) Finally,the combination of a SUMP as a data collection method and the use of a mathematical model results inan Integrated Model of Park-and-Ride Facilities for Sustainable Urban Mobility.
The rest of the study is organized as follows: Section 2 describes the most relevant literature reviewconcerning the P&R system and the SUMPs. Section 3 explains the methodology for the IntegratedModel of Park-and-Ride Facilities for Sustainable Urban Mobility. Section 4 provides a numericalexample that uses a hypothetical city’s data and verifies that the methodology works. In Section 5,the methodology is applied in a real case study (Cuenca-Ecuador). Section 6 contains the results of thecase study, and Section 7 discusses the results obtained. Finally, in the conclusions section, the authorsdescribe the contribution of this study, the limitations, and recommendations for future research.

Sustainability 2020, 12, 4631 3 of 15
2. Literature Review
Traffic congestion and pollution in urban areas that are generated by private vehicles havebecome an undesirable problem. To alleviate these problems, a set of studies have suggested transportalternatives (e.g., bicycle, pedestrian, public transport, P&R) [7–13]. The P&R system as a transportalternative provides the possibility for private vehicle users to use a facility to change to a morefriendly transport mode such as the public transport system. A parameter to determine whetherthe change intermodal has been made to a more friendly transport mode is to use efficiency in thetravel time. An interesting study has been carried out in which several nodes have been identified,and these correspond to the transport modes in an urban area, in order to determine the travel timeand accessibility between these nodes [14,15]. Thus, the main attribute of the P&R system to be studiedis its location and how this may affect the potential demand. Therefore, the following literature reviewcovers location and mathematical models to calculate the potential demand of the P&R system.
Regarding the mathematical models to determine the location of P&R facilities close to publictransport stops, Song et al. [16] proposed an integrated planning framework to locate Park andRide (P&R) facilities and optimize their capacities; the author formulated a mathematical programthat is solved by an algorithm which calculates the shift of the private vehicle users to the P&Rsystem. In addition, one of the most interesting investigations proposed a combined modelincluding public transport associated with P&R services and autonomous vehicle systems [17,18].Thus, Chen and Kim [19] worked on creating a scheme for P&R system called rail-based Park-And-Ride(RPR), which consists of promoting the use of public transport through developing an environmentalconstrained that combined modal split and traffic assignment, the result is to evaluate the effectivenessof P&R system in the environmental. Moreover, an analytical model was integrated to support thedecision-making for the selection of a public transport service provision between a P&R service andon-demand public bus [20,21].
The research developed to estimate the demand for the P&R system has been carried out byseveral authors, for instance, Ortega et al. [22] suggested a linear regression model to calculate thecapacity at each P&R facility of determining the most suitable location. Honer and Grubesic [23]designed a Geographic Information System (GIS) project to determine a catchment area for each P&Rfacility where the potential demand is calculated. However, one of the limitations of the model isthat the demand outside the catchment area is not accounted for. Farhan and Murray [24] proposeda mathematical optimization model that determines the set of optimal facilities in an existing P&Rsystem. The authors recommended the development of a mathematical optimization model to estimatethe potential number of users for each P&R facility considering the following aspects:
• Covering as many potential users as possible;• Establishing new P&R facilities to an existing system; and• Locating P&R facilities near major public transport stations.
Concerning the optimization of potential-user-coverage and placing P&R facilities near publictransport stations, Wang et al. [8] investigated an optimal P&R facility in a linear city through twoobjective functions—the profit-maximizing and social cost-minimizing of P&R locations—proposing aset of Deterministic Mode Choice Equilibrium equations that were based on the potential demand ofusers of each facility.
For the establishment of new P&R facilities into an existing system, Du [25], and Ni [26]investigated the optimization of existing P&R locations through Modal Choice formulation to estimatethe user-equilibrium based on three types of transport mode. The results of their analysis included theP&R facilities’ optimal number, location, and capacity according to a lower-cost route. Farhan andMurray [27] contributed significantly to the development of a mathematical optimization model byconsidering the aspects mentioned above to find the optimal location for P&R facilities. The authorsproposed a Multi-Objective Spatial Optimization model to maximize the demand for P&R facilities,taking into account the existing P&R facilities. As a result, the potential demand was determined and

Sustainability 2020, 12, 4631 4 of 15
used to allocate the new P&R facilities. Additionally, Cavadas and Antunes [28] extended Farhan andAros-Veras’s study, introducing a Discrete-Choice Model to consider transport alternatives such as aprivate vehicle, P&R, and buses. For future research, the authors recommended their model to be used,which includes a Light Railway Transit (LRT) transport system.
One of the equations that determine whether users leave their vehicle in a P&R facility to completetheir journey is the Logit Discrete Choice Model [29]. The Logit Discrete Choice Model and its extendedapplication in transport research was promoted by Sillano and Ortúzar [30]. This model establishedthe probability of selecting alternative transport modes based on socioeconomic characteristics andtransport parameters [31,32]. However, the Logit Discrete Choice Model is a non-linear model withinthe mathematical model. The Non-Linear Logit Discrete Choice Model was linearized by Aros-Veraset al. [6], and the author Cavadas [28] confirmed that the linearization of the Logit Choice Modelwas efficient.
In the context of the literature review, a novel approach involves the development of an IntegratedModel of Park-and-Ride Facilities for Sustainable Urban Mobility, in which the P&R informationgiven for the SUMP is used as data to be further applied in a mathematical model that maximizes thepotential demand. Finally, it determines which facility or set of facilities is the most attractive to users.
3. Methodology
This section explains the development of the Integrated Model of Park-and-Ride Facilities forSustainable Urban Mobility and also explains sequentially the process made in this research. In thefollowing sections, the SUMP is described as a method for data collection, followed by a detailedexplanation of the mathematical model (Figure 1).
For the first part of the Integrated Model of Park-and-Ride Facilities for Sustainable Urban Mobility,the SUMPs method is introduced to gather the necessary data (e.g., origin–destination (O-D) trips,existing P&R facilities, city zones, parking policies, transport parameters).
For the second part of the Integrated Model of Park-and-Ride Facilities for Sustainable UrbanMobility, the mathematical model is explained. For this purpose, the following steps are taken:
1. Firstly, a spatial distribution model by Campbell [33], Gao [34], Aros-Vera [6] and Sadeghiet al. [35] was used for p-hub networks, where each origin/destination point is allocated to asingle hub;
2. Secondly, the addition of cost functions with transport parameters (e.g., travel time and cost fees)was used in the Logit Choice Model developed by Ortúzar [36,37]. In addition, the linearizationof the discrete choice model by Aros-Vera and Cavadas [6,38] was conducted.
An open-source programming language is used with extensive support modules to solve themathematical model and input the data that is provided by the SUMP. In our case: Python with thefollowing modules numpy, matplotlib, docplex, math, and Cplex.
Sustainability 2020, 12, x FOR PEER REVIEW 4 of 15
One of the equations that determine whether users leave their vehicle in a P&R facility to complete their journey is the Logit Discrete Choice Model [29]. The Logit Discrete Choice Model and its extended application in transport research was promoted by Sillano and Ortúzar [30]. This model established the probability of selecting alternative transport modes based on socioeconomic characteristics and transport parameters [31,32]. However, the Logit Discrete Choice Model is a non-linear model within the mathematical model. The Non-Linear Logit Discrete Choice Model was linearized by Aros-Veras et al. [6], and the author Cavadas [28]confirmed that the linearization of the Logit Choice Model was efficient.
In the context of the literature review, a novel approach involves the development of an Integrated Model of Park-and-Ride Facilities for Sustainable Urban Mobility, in which the P&R information given for the SUMP is used as data to be further applied in a mathematical model that maximizes the potential demand. Finally, it determines which facility or set of facilities is the most attractive to users.
3. Methodology
This section explains the development of the Integrated Model of Park-and-Ride Facilities for Sustainable Urban Mobility and also explains sequentially the process made in this research. In the following sections, the SUMP is described as a method for data collection, followed by a detailed explanation of the mathematical model (Figure 1).
For the first part of the Integrated Model of Park-and-Ride Facilities for Sustainable Urban Mobility, the SUMPs method is introduced to gather the necessary data (e.g., origin–destination (O-D) trips, existing P&R facilities, city zones, parking policies, transport parameters).
For the second part of the Integrated Model of Park-and-Ride Facilities for Sustainable Urban Mobility, the mathematical model is explained. For this purpose, the following steps are taken:
1. Firstly, a spatial distribution model by Campbell [33], Gao [34], Aros-Vera [6] and Sadeghi et al. [35] was used for p-hub networks, where each origin/destination point is allocated to a single hub;
2. Secondly, the addition of cost functions with transport parameters (e.g., travel time and cost fees) was used in the Logit Choice Model developed by Ortúzar [36,37]. In addition, the linearization of the discrete choice model by Aros-Vera and Cavadas [6,38] was conducted.
An open-source programming language is used with extensive support modules to solve the mathematical model and input the data that is provided by the SUMP. In our case: Python with the following modules numpy, matplotlib, docplex, math, and Cplex.
Figure 1. The main steps for the Integrated Model of the Park and Ride (P&R) (Source: own).
3.1. SUMP Method
The policies and regulations defined in SUMP cover transport modes such as public transport, private transport (motorized and non-motorized), and freight transport. SUMPs address transports issues in urban zones efficiently. Additionally, within the SUMPs, there are a number of transport policies regarding the reduction of air pollution and traffic congestion caused by private vehicle
Figure 1. The main steps for the Integrated Model of the Park and Ride (P&R) (Source: own).

Sustainability 2020, 12, 4631 5 of 15
3.1. SUMP Method
The policies and regulations defined in SUMP cover transport modes such as public transport,private transport (motorized and non-motorized), and freight transport. SUMPs address transportsissues in urban zones efficiently. Additionally, within the SUMPs, there are a number of transportpolicies regarding the reduction of air pollution and traffic congestion caused by private vehicle traffic.One of them is the Park and Ride (P&R) system. P&R systems within the SUMPs have short-term andlong-term goals: to reduce the number of private vehicles in a CBD and increase the number of publictransport users. SUMPs act as guides for planners, authorities, and researchers. In addition, it is usedas a method to collect information in order to develop transport planning studies.
The SUMP methodology is used in the first part of the case study as a data collection methodand will be further discussed in this study. The following data were gathered to develop themathematical model:
• Matrix origin–destination trips between the outskirt areas and central business district;• Cost functions;• Park and Ride system; and• Public transport parameters.
3.2. Mathematical Formulation
In this section, the development of the mathematical model and the linearization process to obtainthe desired results is explained. For this purpose, a spatial distribution model by Campbell [33], Gao [34],Aros-Vera [6], and Sadeghi et al. [35] was used for p-hub networks, where each origin/destination pointis allocated to a single hub. In addition, the cost functions are developed (e.g., private car and P&Rmode), and a sensitive parameter is used, which has been studied in the research by Aros-Vera andCavadas [6,38]; this parameter assumes a value close to zero and one. The value close to one representsthat potential users choose the lower-cost route. Subsequently, the Logit choice model developed byOrtúzar [36,37] is used, and its linearization [6,38] is carried out. Finally, the result is that the modelmaximizes the number of potential users for each facility.
The theoretical trip of the model is considered to be from the outskirt areas of the city, O, to theCentral Business District (CBD), D. All possible trips, i, belong to the outskirt areas, O; therefore, i ∈ O.For all trips completed, j, their destination, D, belongs to the area CBD; therefore, j ∈ D. Each P&Rfacility k belongs to the set of all possible facilities of a P&R system K that can be determined; therefore,k ∈ K, as shown in Figure 2.
Sustainability 2020, 12, x FOR PEER REVIEW 5 of 15
traffic. One of them is the Park and Ride (P&R) system. P&R systems within the SUMPs have short-term and long-term goals: to reduce the number of private vehicles in a CBD and increase the number of public transport users. SUMPs act as guides for planners, authorities, and researchers. In addition, it is used as a method to collect information in order to develop transport planning studies.
The SUMP methodology is used in the first part of the case study as a data collection method and will be further discussed in this study. The following data were gathered to develop the mathematical model:
• Matrix origin–destination trips between the outskirt areas and central business district; • Cost functions; • Park and Ride system; and • Public transport parameters.
3.2. Mathematical Formulation
In this section, the development of the mathematical model and the linearization process to obtain the desired results is explained. For this purpose, a spatial distribution model by Campbell [33], Gao [34], Aros-Vera [6], and Sadeghi et al. [35] was used for p-hub networks, where each origin/destination point is allocated to a single hub. In addition, the cost functions are developed (e.g., private car and P&R mode), and a sensitive parameter is used, which has been studied in the research by Aros-Vera and Cavadas [6,38]; this parameter assumes a value close to zero and one. The value close to one represents that potential users choose the lower-cost route. Subsequently, the Logit choice model developed by Ortúzar [36,37] is used, and its linearization [6,38] is carried out. Finally, the result is that the model maximizes the number of potential users for each facility.
The theoretical trip of the model is considered to be from the outskirt areas of the city, , to the Central Business District (CBD), . All possible trips, , belong to the outskirt areas, ; therefore, ∈ . For all trips completed, , their destination, , belongs to the area CBD; therefore, ∈ . Each P&R facility belongs to the set of all possible facilities of a P&R system that can be determined; therefore, ∈ , as shown in Figure 2.
Figure 2. Theoretical trip model.
The number of trips by a private vehicle within the defined origin and CBD is noted in a matrix, ( ).
The trips of private vehicles, ( ), are divided into two routes to analyze the number of trips performed through P&R:
Figure 2. Theoretical trip model.

Sustainability 2020, 12, 4631 6 of 15
The number of trips by a private vehicle within the defined origin O and CBD D is noted in amatrix, m(i j).
The trips of private vehicles, m(i j), are divided into two routes to analyze the number of tripsperformed through P&R:
1. Route (i j) represents trips made by private vehicles from the outskirt of the city, O, to thedestination, D without using the P&R system (See Figure 2);
2. Route (ik j) represent trips made by private vehicles from the outskirt of the city, O, to thedestination D using the facility k from the P&R system, K. (See Figure 2).
The Logit Choice Model LCMC is introduced to determine whether the potential users wantto reach their destination by changing their transport mode to complete the remaining part of thejourney. This means that of all trips made in a private vehicle, a percentage of potential users wouldtake the P&R mode. The aim is to determine which percentage of the P&R trips are attributedto each facility. The LCMC estimates the distribution of trips using cost functions as constraints,and the implementation of a parameter commonly identified as sensitive, θ, is able to regulate thepercentage of users who are willing to pay the route’s cost. This means that the users would prefer thelower-cost route.
The trip-choice depends mainly on 1. travel time, 2. travel distance, and 3. travel costs,where any of these elements, or a combination of them, are usually referred to as cost functions,where C(i j) (1), C(ik j) (2) are the constraints expressed as cost functions that represent the use of privatevehicles route and P&R mode, respectively
C(i j) = β1T1 + β2T2 + β3T3 + β4T4 (1)
C(ik j) = γ1T1 + γ2T2 + γ3T3 + γ4T4 (2)
where:
T1—travel cost;T2—waiting time;T3—parking time;T4—transfer time;β(1,2,3,4)—represents the positive constant of the cost functions; and
γ(1,2,3,4)—represents the positive constant of the cost functions.
User sensitivity is designated by, θ, this metric refers to the users’ sensitivity who choose a routefrom an origin to a destination according to its cost. In fact, it is the user’s willingness to use privatevehicle or P&R route. As mentioned previously, the P&R route is the lower-cost because a part of thisroute is made by public transportation. Therefore, this reduces the traveling cost by private vehicle:C(ik j) ≤ C(i j). Making a more efficient analysis, is one whether the users select the lower-cost route,and the value is closest to zero otherwise. A similar approach has been used in various studies todetermine a sensitive value between close to zero and one. For this reason, two sensitive values aretested in the mathematical model for the hypothetical city: a sensitive value close to zero and a sensitivevalue of one. The sensitive value, which is the most accurate at estimating the potential demand in theP&R system, is used in a real case study.
The LCMC x(ik j) considers the elements mentioned above and further expressed in Equation(3), where C(i j) (1), C(ik j) (2) are the constraints expressed as cost functions that represent the use ofprivate vehicles route and P&R mode, respectively, and the sensitive value θ. Equation (3) additionallyincludes location variables: lk represents a binary value, which is one whether the facility k is partof the P&R system K, otherwise zero. xa is a binary value that represents the use of private vehicle,

Sustainability 2020, 12, 4631 7 of 15
therefore, one if users use private vehicle or zero otherwise. In other words, when the value is zero, thepercentage of users that would use P&R x(ik j) is zero as well.
x(ik j) =lke−θC(ik j)∑
k∈K xae−θC(i j), k ∈ K (3)
The literature review of the Logit Choice Model describes the LCMC as a non-linear model due toits variable, xa, that represents a binary value; when this value is zero, the model is non-linear.
Having a non-linear model increases the degree of difficulty of finding an optimal solution.Therefore, the transformation to a linear model is recommended. The linearization approach utilizedfor this study is the proposed method by Aros-Vera and Cavadas [6], where Equation (3) is substitutedby the equivalent of three constraints, (4) to (6), that transform it into a linear model.
x(ik j) ≤ lk, ∀i ∈ O, j ∈ D, k ∈ K (4)∑k∈K
x(ik j) = 1, ∀i ∈ O, j ∈ D (5)
x(ik j) ≤e−θC(ik j)
e−θC(i j)x(i j) + (1− xa), ∀i ∈ O, j ∈ D, k ∈ K (6)
Equation (4) describes if the P&R facility is not located in the P&R system, the value is zero,and hence there is no demand for P&R. Thus, Equation (5) estimates the proportion of using P&Rbeing the equivalent of 1. Hence, Equation (8) provides the percentage of the trips by the P&R mode.In order to develop the trip-choice analysis, the binary variable, lk, is introduced to represent the user’schoice of a P&R facility from the set of all facilities, as shown by Equation (7).
lk ∈ {0, 1}, ∀ k ∈ K (7)
Each location of the facilities or the number of facilities, z, is within the set of all possible facilities,k. This means that the number of facilities is represented by z. Equation (8)∑
k∈K
lk = z (8)
therefore, the maximization of the potential trip-users, D(k), who would use a facility k of the P&RK system K, is given by the number of trips by private vehicle m(i j), that choose P&R (ik j) routeEquation (9)
Finally, the set of variables, constraints, and the objective function are integrated inEquations (9)–(14). The equations described above and the set of variables, constraints and thegoal of maximization of the users who choose P&R and ride are grouped for a better understanding.
Mathematical model
The objective function isMax D(k) =
∑i ∈ Oj ∈ D
m(i j)·x(ik j) (9)
subject tox(ik j) ≤ lk, ∀i ∈ O, j ∈ D, k ∈ K (10)∑
k∈K
x(ik j) = 1, ∀i ∈ O, j ∈ D (11)

Sustainability 2020, 12, 4631 8 of 15
x(ik j) ≤e−θC(ik j)
e−θC(i j)x(i j) + (1− xa), ∀i ∈ O, j ∈ D, k ∈ K (12)∑
k∈K
lk = z (13)
The decision variablelk ∈ {0, 1}, ∀ k ∈ K (14)
The mathematical model maximizes the number of potential users that choose the P&R system tocomplete their journey. The demand is distributed through the P&R facilities, allowing us to identifythe most attractive facilities of the system. The number of trips by private vehicles can choose tworoutes: the first route is by private vehicle, and the second route is through the P&R system. The LCMCgives the percentage of users who choose a route, and a binary variable determines the decision. Hence,the potential users choose the lower-route based on cost functions, and a sensitive value modifies thosecost functions.
4. Numerical Example
The Integrated Model of Park-and-Ride Facilities for Sustainable Urban Mobility is applied in ahypothetical city.
4.1. Explanation of Hypothetical City
In this section, we provide a hypothetical example of a hypothetical city to support the mathematicalmodel according to applicated Equations (9)–(14).
Figure 3 shows 10 origin locations, 10 P&R facilities, 10 destinations, and 10 daily trips between eachO–D pair. We use the spatial distribution model developed by Campbell [33], Gao [34], Aros-Vera [6]and Sadeghi et al. [35]
Sustainability 2020, 12, x FOR PEER REVIEW 8 of 15
two routes: the first route is by private vehicle, and the second route is through the P&R system. The LCMC gives the percentage of users who choose a route, and a binary variable determines the decision. Hence, the potential users choose the lower-route based on cost functions, and a sensitive value modifies those cost functions.
4. Numerical Example
The Integrated Model of Park-and-Ride Facilities for Sustainable Urban Mobility is applied in a hypothetical city.
4.1. Explanation of Hypothetical City
In this section, we provide a hypothetical example of a hypothetical city to support the mathematical model according to applicated Equations (10)–(15).
Figure 3 shows 10 origin locations, 10 P&R facilities, 10 destinations, and 10 daily trips between each O–D pair. We use the spatial distribution model developed by Campbell [33], Gao [34], Aros-Vera [6] and Sadeghi et al. [35]
Figure 3. P-hub networks, where each origin/destination point is allocated to a single hub.
In the hypothetical scenario, the value of the cost functions is based on the SUMPs of Cuenca, Ecuador and previous studies. The distance is determined using the Euclidean Distance Command to calculate the shortest distance between two points. Additionally, the command Random Uniform Point Distribution, is utilized to generate the coordinates of the origin, destination and P&R facilities.
The sensitivity, , of the trip-user that selects the P&R system is one whether they select the lower-cost route, making a more efficient analysis, and the value is closest to zero otherwise. In this analysis, two sensitivity values are tested in order to identify which value to use accordingly in a real case study.
1. = 0.1 2. = 1.0
4.2. Results of Hypothetical City
Figure 3. P-hub networks, where each origin/destination point is allocated to a single hub.

Sustainability 2020, 12, 4631 9 of 15
In the hypothetical scenario, the value of the cost functions is based on the SUMPs of Cuenca,Ecuador and previous studies. The distance is determined using the Euclidean Distance Commandto calculate the shortest distance between two points. Additionally, the command Random UniformPoint Distribution, is utilized to generate the coordinates of the origin, destination and P&R facilities.
The sensitivity, θ, of the trip-user that selects the P&R system is one whether they select thelower-cost route, making a more efficient analysis, and the value is closest to zero otherwise. In thisanalysis, two sensitivity values are tested in order to identify which value to use accordingly in a realcase study.
1. θ = 0.12. θ = 1.0
4.2. Results of Hypothetical City
4.2.1. Sensitive θ = 0.1
The result is that 12% of trips include a private car changing to the P&R system. Table 1 showsthe distribution from the highest to the lowest demand in a P&R facility, using θ = 0.1 as thesensitivity value.
Table 1. Percentage of potential users of Park and Ride (P&R) facilities θ = 0.1.
P&R A 20% P&R F 5.6%P&R B 4% P&R G 4.6%P&R C 32% P&R H 11%P&R D 10.1% P&R I 1%P&R E 7% P&R J 4.7%
P&R C and P&R I facilities obtained the highest and lowest demand, respectively. Table 2 showsthe distribution of the number of trips performed per route from the outskirt areas of the city to theCentral Business District (CBD) using a P&R facility.
Table 2. Percentage of trips using P&R C.
0-P&R C-1 0.02% 6-P&R C-5 5.18%0-P&R C-2 0.02% 6-P&R C-6 5%0-P&R C-6 0.02% 6-P&R C-7 5.78%0-P&R C-7 0.03% 6-P&R C-8 5.96%3-P&R C-1 0.01% 6-P&R C-9 5.48%4-P&R C-2 4.67% 8-P&R C-1 0.01%
The trips through route P&R C that start their trip from point 6 to endpoint 8 have the highestdemand. On the contrary, users that start the trip from points 8 and 3 to endpoint 1 represent thelowest demand.
4.2.2. Sensitivity θ = 1.0
Table 3 shows the distribution of demand, using θ = 1.0 as the sensitivity value. The results arethat 16% of trips include a private car changing to the P&R system
Sustainability 2020, 12, 4631 10 of 15
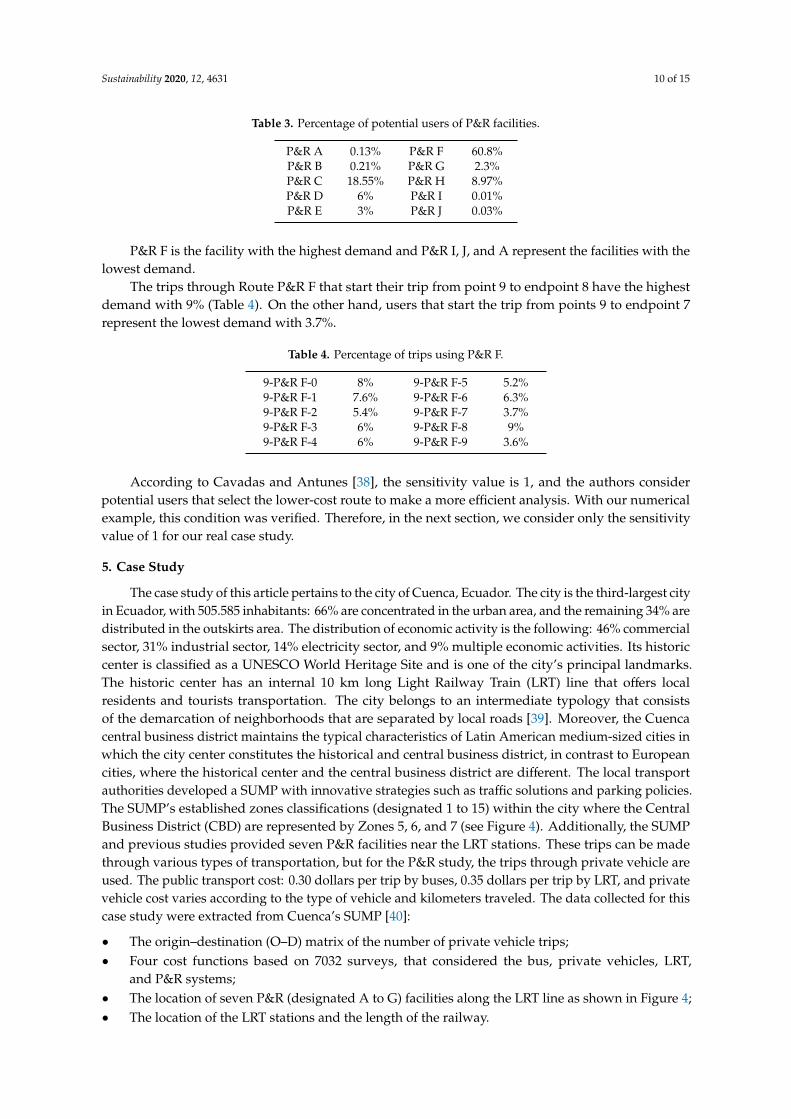
Table 3. Percentage of potential users of P&R facilities.
P&R A 0.13% P&R F 60.8%P&R B 0.21% P&R G 2.3%P&R C 18.55% P&R H 8.97%P&R D 6% P&R I 0.01%P&R E 3% P&R J 0.03%
P&R F is the facility with the highest demand and P&R I, J, and A represent the facilities with thelowest demand.
The trips through Route P&R F that start their trip from point 9 to endpoint 8 have the highestdemand with 9% (Table 4). On the other hand, users that start the trip from points 9 to endpoint 7represent the lowest demand with 3.7%.
Table 4. Percentage of trips using P&R F.
9-P&R F-0 8% 9-P&R F-5 5.2%9-P&R F-1 7.6% 9-P&R F-6 6.3%9-P&R F-2 5.4% 9-P&R F-7 3.7%9-P&R F-3 6% 9-P&R F-8 9%9-P&R F-4 6% 9-P&R F-9 3.6%
According to Cavadas and Antunes [38], the sensitivity value is 1, and the authors considerpotential users that select the lower-cost route to make a more efficient analysis. With our numericalexample, this condition was verified. Therefore, in the next section, we consider only the sensitivityvalue of 1 for our real case study.
5. Case Study
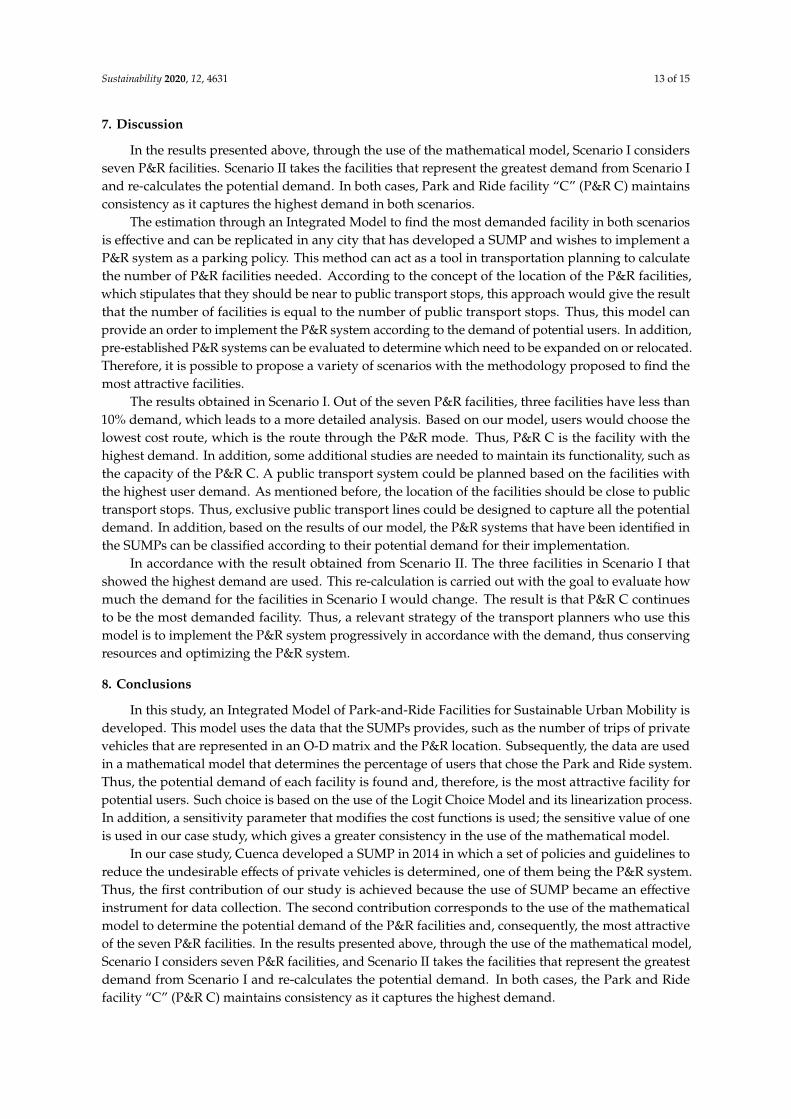
The case study of this article pertains to the city of Cuenca, Ecuador. The city is the third-largest cityin Ecuador, with 505.585 inhabitants: 66% are concentrated in the urban area, and the remaining 34% aredistributed in the outskirts area. The distribution of economic activity is the following: 46% commercialsector, 31% industrial sector, 14% electricity sector, and 9% multiple economic activities. Its historiccenter is classified as a UNESCO World Heritage Site and is one of the city’s principal landmarks.The historic center has an internal 10 km long Light Railway Train (LRT) line that offers localresidents and tourists transportation. The city belongs to an intermediate typology that consistsof the demarcation of neighborhoods that are separated by local roads [39]. Moreover, the Cuencacentral business district maintains the typical characteristics of Latin American medium-sized cities inwhich the city center constitutes the historical and central business district, in contrast to Europeancities, where the historical center and the central business district are different. The local transportauthorities developed a SUMP with innovative strategies such as traffic solutions and parking policies.The SUMP’s established zones classifications (designated 1 to 15) within the city where the CentralBusiness District (CBD) are represented by Zones 5, 6, and 7 (see Figure 4). Additionally, the SUMPand previous studies provided seven P&R facilities near the LRT stations. These trips can be madethrough various types of transportation, but for the P&R study, the trips through private vehicle areused. The public transport cost: 0.30 dollars per trip by buses, 0.35 dollars per trip by LRT, and privatevehicle cost varies according to the type of vehicle and kilometers traveled. The data collected for thiscase study were extracted from Cuenca’s SUMP [40]:
• The origin–destination (O–D) matrix of the number of private vehicle trips;• Four cost functions based on 7032 surveys, that considered the bus, private vehicles, LRT,
and P&R systems;• The location of seven P&R (designated A to G) facilities along the LRT line as shown in Figure 4;• The location of the LRT stations and the length of the railway.

Sustainability 2020, 12, 4631 11 of 15
Sustainability 2020, 12, x FOR PEER REVIEW 10 of 15
Table 4. Percentage of trips using P&R F.
9-P&R F-0 8% 9-P&R F-5 5.2% 9-P&R F-1 7.6% 9-P&R F-6 6.3% 9-P&R F-2 5.4% 9-P&R F-7 3.7% 9-P&R F-3 6% 9-P&R F-8 9% 9-P&R F-4 6% 9-P&R F-9 3.6%
5. Case Study
The case study of this article pertains to the city of Cuenca, Ecuador. The city is the third-largest city in Ecuador, with 505.585 inhabitants: 66% are concentrated in the urban area, and the remaining 34% are distributed in the outskirts area. The distribution of economic activity is the following: 46% commercial sector, 31% industrial sector, 14% electricity sector, and 9% multiple economic activities. Its historic center is classified as a UNESCO World Heritage Site and is one of the city’s principal landmarks. The historic center has an internal 10 km long Light Railway Train (LRT) line that offers local residents and tourists transportation. The city belongs to an intermediate typology that consists of the demarcation of neighborhoods that are separated by local roads [39]. Moreover, the Cuenca central business district maintains the typical characteristics of Latin American medium-sized cities in which the city center constitutes the historical and central business district, in contrast to European cities, where the historical center and the central business district are different. The local transport authorities developed a SUMP with innovative strategies such as traffic solutions and parking policies. The SUMP’s established zones classifications (designated 1 to 15) within the city where the Central Business District (CBD) are represented by Zones 5, 6, and 7 (see Figure 4). Additionally, the SUMP and previous studies provided seven P&R facilities near the LRT stations. These trips can be made through various types of transportation, but for the P&R study, the trips through private vehicle are used. The public transport cost: 0.30 dollars per trip by buses, 0.35 dollars per trip by LRT, and private vehicle cost varies according to the type of vehicle and kilometers traveled. The data collected for this case study were extracted from Cuenca’s SUMP [40]:
Figure 4. Sustainable Urban Mobility Plan (SUMP) P&R system.
• The origin–destination (O–D) matrix of the number of private vehicle trips; • Four cost functions based on 7032 surveys, that considered the bus, private vehicles, LRT, and
P&R systems;
Figure 4. Sustainable Urban Mobility Plan (SUMP) P&R system.
6. Results
The mathematical model is evaluated according to two scenarios. For the first scenario, the potentialdemand of seven established P&R facilities from Cuenca’s SUMP was calculated. To further optimizethe results, a second scenario was introduced where the three most in-demand facilities were chosen tobe re-evaluated, identifying the most attractive P&R facility. For the first scenario, the mathematicalmodel was performed with the existing data, extracted from the city’s SUMP (Figure 4), to evaluate theexisting P&R system facilities. The results are presented in the following tables. The potential demandof the seven P&R facilities, A–G, is shown in Table 5. The distribution of trips from the outskirt areasto CBD through the P&R system is given in Table 6.
Table 5. Percentage of demand for each P&R in Scenario I.
P&R A 18%P&R B 11%P&R C 28%P&R D 7%P&R E 8%P&R F 7%P&R G 21%
Table 6. Percentage of potential demand from zones to the Central Business District (CBD) by P&R inScenario I.
By P&R to CBD%
FROM/TO A B C D E F G
1 – 0.8 19 – – – –2 1.1 0.4 7 – – – –3 16 9.6 – – – – –4 – – 2 – – – –8 – – – 4 – – –9 0.9 – – – –
10 – 0.2 – – – – –11 – – – – – 6 312 – – – – 6 1 –13 – – – 1 1 – –14 – – 2 1 – –15 – – – – – – 18
Total 18% 11% 28% 7% 8% 7% 21%

Sustainability 2020, 12, 4631 12 of 15
For the second scenario, the mathematical model was used to find the most attractive P&R facility(see Figure 5), evaluating the P&R facilities with higher demand, A, C, and G, as shown in Table 5.The potential demand for the P&R facilities A, C, and G is shown in Table 7. The distribution of tripsfrom the outskirt areas to CBD through P&R is shown in Table 8.
Sustainability 2020, 12, x FOR PEER REVIEW 12 of 15
Table 8. Percentage of potential demand from zones to Central Business District (CBD) by the P&R in Scenario II.
By P&R to CBD FROM/TO A % B % C %
1 -- 26.4 -- 2 2 8.6 -- 3 24.4 -- -- 4 -- 1.7 -- 8 -- 0.3 -- 9 1 2 --
10 1.6 -- -- 11 -- -- 5.9 12 -- -- 1.3 13 -- -- 4.6 14 -- -- 6.4 15 -- -- 13.8
Total 29% 39% 32%
Figure 5. Optimization of the P&R system.
7. Discussion
In the results presented above, through the use of the mathematical model, Scenario I considers seven P&R facilities. Scenario II takes the facilities that represent the greatest demand from Scenario I and re-calculates the potential demand. In both cases, Park and Ride facility “C” (P&R C) maintains consistency as it captures the highest demand in both scenarios.
The estimation through an Integrated Model to find the most demanded facility in both scenarios is effective and can be replicated in any city that has developed a SUMP and wishes to implement a P&R system as a parking policy. This method can act as a tool in transportation planning to calculate the number of P&R facilities needed. According to the concept of the location of the P&R facilities, which stipulates that they should be near to public transport stops, this approach would give the result that the number of facilities is equal to the number of public transport stops. Thus, this model can provide an order to implement the P&R system according to the demand of potential users. In
Figure 5. Optimization of the P&R system.
Table 7. Percentage of demand for each P&R in Scenario II.
P&R A 29%P&R C 39%P&R G 32%
Table 8. Percentage of potential demand from zones to Central Business District (CBD) by the P&R inScenario II.
By P&R to CBD
FROM/TO A% B% C%
1 – 26.4 –2 2 8.6 –3 24.4 – –4 – 1.7 –8 – 0.3 –9 1 2 –
10 1.6 – –11 – – 5.912 – – 1.313 – – 4.614 – – 6.415 – – 13.8
Total 29% 39% 32%
Sustainability 2020, 12, 4631 13 of 15
7. Discussion
In the results presented above, through the use of the mathematical model, Scenario I considersseven P&R facilities. Scenario II takes the facilities that represent the greatest demand from Scenario Iand re-calculates the potential demand. In both cases, Park and Ride facility “C” (P&R C) maintainsconsistency as it captures the highest demand in both scenarios.
The estimation through an Integrated Model to find the most demanded facility in both scenariosis effective and can be replicated in any city that has developed a SUMP and wishes to implement aP&R system as a parking policy. This method can act as a tool in transportation planning to calculatethe number of P&R facilities needed. According to the concept of the location of the P&R facilities,which stipulates that they should be near to public transport stops, this approach would give the resultthat the number of facilities is equal to the number of public transport stops. Thus, this model canprovide an order to implement the P&R system according to the demand of potential users. In addition,pre-established P&R systems can be evaluated to determine which need to be expanded on or relocated.Therefore, it is possible to propose a variety of scenarios with the methodology proposed to find themost attractive facilities.
The results obtained in Scenario I. Out of the seven P&R facilities, three facilities have less than10% demand, which leads to a more detailed analysis. Based on our model, users would choose thelowest cost route, which is the route through the P&R mode. Thus, P&R C is the facility with thehighest demand. In addition, some additional studies are needed to maintain its functionality, such asthe capacity of the P&R C. A public transport system could be planned based on the facilities withthe highest user demand. As mentioned before, the location of the facilities should be close to publictransport stops. Thus, exclusive public transport lines could be designed to capture all the potentialdemand. In addition, based on the results of our model, the P&R systems that have been identified inthe SUMPs can be classified according to their potential demand for their implementation.
In accordance with the result obtained from Scenario II. The three facilities in Scenario I thatshowed the highest demand are used. This re-calculation is carried out with the goal to evaluate howmuch the demand for the facilities in Scenario I would change. The result is that P&R C continuesto be the most demanded facility. Thus, a relevant strategy of the transport planners who use thismodel is to implement the P&R system progressively in accordance with the demand, thus conservingresources and optimizing the P&R system.
8. Conclusions
In this study, an Integrated Model of Park-and-Ride Facilities for Sustainable Urban Mobility isdeveloped. This model uses the data that the SUMPs provides, such as the number of trips of privatevehicles that are represented in an O-D matrix and the P&R location. Subsequently, the data are usedin a mathematical model that determines the percentage of users that chose the Park and Ride system.Thus, the potential demand of each facility is found and, therefore, is the most attractive facility forpotential users. Such choice is based on the use of the Logit Choice Model and its linearization process.In addition, a sensitivity parameter that modifies the cost functions is used; the sensitive value of oneis used in our case study, which gives a greater consistency in the use of the mathematical model.
In our case study, Cuenca developed a SUMP in 2014 in which a set of policies and guidelines toreduce the undesirable effects of private vehicles is determined, one of them being the P&R system.Thus, the first contribution of our study is achieved because the use of SUMP became an effectiveinstrument for data collection. The second contribution corresponds to the use of the mathematicalmodel to determine the potential demand of the P&R facilities and, consequently, the most attractiveof the seven P&R facilities. In the results presented above, through the use of the mathematical model,Scenario I considers seven P&R facilities, and Scenario II takes the facilities that represent the greatestdemand from Scenario I and re-calculates the potential demand. In both cases, the Park and Ridefacility “C” (P&R C) maintains consistency as it captures the highest demand.

Sustainability 2020, 12, 4631 14 of 15
The third contribution, which is the development of an Integrated Model for Sustainable UrbanMobility, becomes a tool for transport authorities and planners. The model provides a data collectionmodel for use in transport studies that can be gathered directly from SUMPs, which means that noadditional studies are needed to develop a P&R system. These data are input into a mathematicalmodel. In addition, this model validates existing P&R facilities with regard to their location, and itidentifies the most attractive facility in terms of potential demand. An interesting contribution of themodel is that a public transport system can be planned based on the location of the P&R facilities.The model is able to identify the origin of the demand (initial trips) through the zone-P&R-CBD route.Finally, the Integrated Model for Sustainable Urban Mobility is a methodological contribution that canbe used in multiple case studies.
In future research, the mathematical model could be extended to consider a large range of P&Rsystem characteristics such as the capacity of each facility. In addition, a line of research that is beingconducted in this area is a comprehensive model that links the interaction of the P&R with transportmodes and involves the replacement of conventional vehicles with electric and autonomous vehicles.
Author Contributions: Conceptualization, J.O., J.T. and T.P.; Formal analysis, J.O. and S.M.; Investigation, J.O.;Methodology, J.O., J.T. and P.T.; Resources, J.O.; Supervision, J.T. and T.P.; Writing—original draft, J.O., J.T. andT.P.; Editing & Review, all authors participated. All authors have read and agreed to the published version ofthe manuscript.
Funding: This research received no external funding.
Acknowledgments: We thank the Cuenca Municipality, which providing sources such as digital cartography,data, and layers through the Sustainable Mobility Plan.
Conflicts of Interest: The authors declare no conflicts of interest.
References
1. European Commission A Concept for Sustainable Urban Mobility Plans. Eur. Union 2013, 1, 153.2. Myrovali, G.; Morfoulaki, M.; Vassilantonakis, B.-M.; Mpoutovinas, A.; Kotoula, K.M. Travelers-led
Innovation in Sustainable Urban Mobility Plans. Period. Polytech. Transp. Eng. 2019, 48, 126–132. [CrossRef]3. Dejeammes, M. Urban Mobility Plans and Accessibility. J. Transp. Land Use 2009, 2, 67–78.4. Pitsiava-Latinopoulou, M.; Basbas, S.; Papoutsis, K.; Sdoukopoulos, E. Parking Policies for Supporting
Sustainable Mobility. Procedia Soc. Behav. Sci. 2012, 48, 897–906. [CrossRef]5. Yashiro, R.; Kato, H. Success factors in the introduction of an intermodal passenger transportation system
connecting high-speed rail with intercity bus services. Case Stud. Transp. Policy 2019, 7, 708–717. [CrossRef]6. Aros-Vera, F.; Marianov, V.; Mitchell, J.E. p-Hub approach for the optimal park-and-ride facility location
problem. Eur. J. Oper. Res. 2013, 226, 277–285. [CrossRef]7. Rizopoulos, D.; Esztergár-Kiss, D. A Method for the Optimization of Daily Activity Chains Including Electric
Vehicles. Energies 2020, 13, 906. [CrossRef]8. Wang, J.Y.T.; Yang, H.; Lindsey, R. Locating and pricing park-and-ride facilities in a linear monocentric city
with deterministic mode choice. Transp. Res. Part B Methodol. 2004, 38, 709–731. [CrossRef]9. Parkhurst, G. Park and ride: Could it lead to an increase in car traffic? Transp. Policy 1995, 2, 15–23. [CrossRef]10. Dickins, I.S.J. Park and ride facilities on light rail transit systems. Transportation 1991, 18, 23–36. [CrossRef]11. Liu, T.-L.; Huang, H.-J.; Yang, H.; Zhang, X. Continuum modeling of park-and-ride services in a linear
monocentric city with deterministic mode choice. Transp. Res. Part B Methodol. 2009, 43, 692–707. [CrossRef]12. Farhan, B.; Murray, A.T. A GIS-Based Approach for Delineating Market Areas for Park and Ride Facilities.
Trans. GIS 2005, 9, 91–108. [CrossRef]13. Williams, R. Oxford’s park-and-ride system. Proc. Inst. Civ. Eng. Munic. Eng. 1999, 133, 127–135. [CrossRef]14. Drezner, Z.; Hamacher, H.W. Facility Location: Applications and Theory, 1st ed.; Drezner, Z.,
Hamacher, H.W., Eds.; Springer: Berlin/Heidelberg, Germany, 2002.15. Balsa-Barreiro, J.; Ambuuhl, L.; Menendez, M.; Pentland, A. Mapping Time-Varying Accessibility and
Territorial Cohesion With Time-Distorted Maps. IEEE Access 2019, 7, 41702–41714. [CrossRef]16. Song, Z.; He, Y.; Zhang, L. Integrated planning of park-and-ride facilities and transit service. Transp. Res.
Part C Emerg. Technol. 2017, 74, 182–195. [CrossRef]

Sustainability 2020, 12, 4631 15 of 15
17. Zhou, Y.; Li, Y.; Hao, M.; Yamamoto, T. A System of Shared Autonomous Vehicles Combined withPark-And-Ride in Residential Areas. Sustainability 2019, 11, 3113. [CrossRef]
18. Ortega, J.; Hamadneh, J.; Esztergár-Kiss, D.; Tóth, J. Simulation of the Daily Activity Plans of Travelers Usingthe Park-and-Ride System and Autonomous Vehicles: Work and Shopping Trip Purposes. Appl. Sci. 2020,10, 2912. [CrossRef]
19. Chen, X.; Kim, I. Modelling Rail-Based Park and Ride with Environmental Constraints in a MultimodalTransport Network. J. Adv. Transp. 2018. [CrossRef]
20. Simicevic, J.; Molan, V.; Milosavljevic, N. Informal park-and-ride behaviour. Put i Saobracaj 2020, 66, 9–13.[CrossRef]
21. Zhang, J.; Wang, D.Z.W.; Meng, M. Which service is better on a linear travel corridor: Park & ride oron-demand public bus? Transp. Res. Part A Policy Pract. 2018, 118, 803–818.
22. Ortega, J.; Tóth, J.; Péter, T. Estimation of parking needs at Light Rail Transit System Stations/ISBN978-963-8121-85-1. Available online: https://www.researchgate.net/publication/331976894_Estimation_of_parking_needs_at_Light_Rail_Transit_System_stationsISBN_978-963-8121-85-1 (accessed on 30 April 2019).
23. Horner, M.W.; Grubesic, T.H. A GIS-based planning approach to locating urban rail terminals. Transportation2001, 28, 55–77. [CrossRef]
24. Farhan, B.; Murray, A.T. Distance decay and coverage in facility location planning. Ann. Reg. Sci. 2006, 40,279–295. [CrossRef]
25. Du, B.; Wang, D.Z.W. Continuum modeling of park-and-ride services considering travel time reliability andheterogeneous commuters – A linear complementarity system approach. Transp. Res. Part E Logist. Transp.Rev. 2014, 71, 58–81. [CrossRef]
26. Ni, A.; Lin, X.; Luo, J. Stochastic Traffic Assignment Model Considering Park & Ride Network and TravelTime Reliability. In Lecture Notes in Electrical Engineering; Springer: Singapore, 2018; Volume 419, pp. 873–886.
27. Farhan, B.; Murray, A.T. Siting park-and-ride facilities using a multi-objective spatial optimization model.Comput. Oper. Res. 2008, 35, 445–456. [CrossRef]
28. Cavadas, J.; Antunes, A.P. An optimization model for integrated transit-parking policy planning.Transportation 2019, 46, 1867–1891. [CrossRef]
29. Barauskas, A.; Mateckis, K.J.; Palevicius, V.; Antucheviciene, J. Ranking conceptual locations for apark-and-ride parking lot using EDAS method. Gradevinar 2018, 70, 11.
30. Sillano, M.; de Dios Ortúzar, J. Willingness-to-Pay Estimation with Mixed Logit Models: Some New Evidence.Environ. Plan. A Econ. Sp. 2005, 37, 525–550. [CrossRef]
31. Pang, H.; Khani, A. Modeling park-and-ride location choice of heterogeneous commuters. Transportation2018, 45, 71–87. [CrossRef]
32. Liu, X.; Yun, M.; Chen, Z.; Yang, X. Investigation, Analysis, and Modeling of Choice Behavior of Park and Ride;American Society of Civil Engineers (ASCE): Beijing, China, 2012; pp. 1643–1651.
33. Campbell, J.F. Hub Location and the p -Hub Median Problem. Oper. Res. 1996, 44, 923–935. [CrossRef]34. Gao, Y.; Qin, Z. A chance constrained programming approach for uncertain p-hub center location problem.
Comput. Ind. Eng. 2016, 102, 10–20. [CrossRef]35. Sadeghi, M.; Jolai, F.; Tavakkoli-Moghaddam, R.; Rahimi, Y. A new stochastic approach for a reliable p-hub
covering location problem. Comput. Ind. Eng. 2015, 90, 371–380. [CrossRef]36. de Dios Ortúzar, J.; Willumsen, L.G. Modelling Transport; John Wiley & Sons, Ltd.: Chichester, UK, 2011.37. de Dios Ortúzar, J. On the development of the nested logit model. Transp. Res. Part B Methodol. 2001, 35,
213–216. [CrossRef]38. Cavadas, J.; Antunes, A.P. Optimization-based study of the location of park-and-ride facilities. Transp. Plan.
Technol. 2019, 42, 201–226. [CrossRef]39. Hermosilla, T.; Palomar-Vázquez, J.; Balaguer-Beser, Á.; Balsa-Barreiro, J.; Ruiz, L.A. Using street based
metrics to characterize urban typologies. Comput. Environ. Urban Syst. 2014, 44, 68–79. [CrossRef]40. Cuenca Municipality. Sustainable Urban Mobility Plan and Public Areas; I.; Cuenca Municipality: Cuenca,
Spain, 2014.
© 2020 by the authors. Licensee MDPI, Basel, Switzerland. This article is an open accessarticle distributed under the terms and conditions of the Creative Commons Attribution(CC BY) license (http://creativecommons.org/licenses/by/4.0/).
Related Documents