1 OPPORTUNITY Activity Challenge – http://www.opportunity-project.eu/node/58 2 NOKIA Mobile Data Challenge – http://research.nokia.com/page/12000 An Integrated Framework for Human Activity Classification Hong Cao 1 , Minh Nhut Nguyen 1 , Clifton Phua 1 , Shonali Krishnaswamy 1,2 , Xiao-Li Li 1 1 Institute for Infocomm Research, A*STAR 2 Faculty of Information Technology, Monash University 1 Fusionopolis Way, Connexis (South Tower), Singapore 138632 {hcao, mnnguyen, cwcphua, spkrishna, xlli}@i2r.a-star.edu.sg ABSTRACT This paper presents an integrated framework to enable using standard non-sequential machine learning tools for accurate multi-modal activity recognition. We develop a novel framework that contains simple pre- and post- classification strategies to improve the overall performance. We achieve this through class-imbalance correction on the learning data using structure preserving oversampling (SPO), leveraging the sequential nature of sensory data using smoothing of the predicted label sequence and classifier fusion, respectively. Through evaluation on recent publicly available activity datasets comprising of a large amount of multi-dimensional sensory data, we demonstrate that our proposed strategies are effective in improving classification performance over common techniques such as One Nearest Neighbor (1NN) and Support Vector Machines (SVM). Our framework also shows better performance over sequential probabilistic models, such as Conditional Random Field (CRF) and Hidden Markov Model (HMM) and when these models are used as meta-learners. Author Keywords Activity recognition, Data mining, Imbalance, Learning, Ubiquitous computing, Smoothing, Wearable computing 1. INTRODUCTION Recognition of Human Activities (RHA) generally pertains to the determining of a human user’s activity using sensory and other contextual information that is readily available and accessible. Early research in activity recognition from sensory data focused on both the physical development and deployment of sensors, as well as signal processing for detecting physical activities such as walking, sitting, lying and so on from a combination of on-body sensors such as accelerometers, gyroscopes, temperature and other sensors [1-6]. More recent research has focused on the application of a range of intelligent techniques such as soft computing (e.g. neuro-fuzzy approaches [7]), Bayesian/topic modeling [8] and varied machine learning approaches [9-10, 12-15, 17-22] for RHA from sensory data. The widespread availability and easy accessibility of real- time sensory information is bringing a new maturity to the field of activity recognition evidenced by the emerging trend of benchmarking initiatives such as the OPPORTUNITY Activity Recognition Challenge 1 and the Nokia Mobile Data Challenge 2 . We hypothesize that the availability of such real-world datasets for activity recognition brings opportunities for deeper understanding of the characteristics of sensory data in this domain and facilitates the development of improved techniques to recognize activities from such data. While a number of machine learning categories have been explored for activity recognition including unsupervised [9] and semi-supervised/active [10], majority of existing techniques have focused on traditional classificatory approaches [12,13]. The classification process can be modeled in terms of a data collection stage, a data transfer process, a modeling stage where the classification model is trained and tested, and finally a deployment stage where the learnt model is deployed on-board the mobile device for classifying activities based on incoming sensory data. The typical approaches for building the classifiers for activity recognition were reviewed in [12] and most of the works deployed supervised machine learning algorithms such as Naive Bayes, Decision Trees, Hidden Markov Models (HMM), Conditional Random Field (CRF), Nearest Neighbor (NN), Support Vector Machines (SVM), and different Boosting techniques. While sequential classifiers, e.g. HMM and CRF, are common for learning from sequences, in this paper, we focus on developing a set of pre- and post-classification techniques that enable using standard non-sequential learning techniques for accurate activity recognition. This is motivated by our finding that the non-sequential techniques, such as SVM and NN, have good competitiveness and scalability on large-dimensional and continuous-valued activity sensory data. Our key premise is that a large number of state-of-the-art non-sequential classifiers in this domain involve applying existing learning methods without sufficient investigation and emphasis on certain distinctive characteristics of sensory data. These characteristics are quite apparent from the observation on recent publicly Permission to make digital or hard copies of all or part of this work for personal or classroom use is granted without fee provided that copies are not made or distributed for profit or commercial advantage and that copies bear this notice and the full citation on the first page. To copy otherwise, or republish, to post on servers or to redistribute to lists, requires prior specific permission and/or a fee. UbiComp’ 12, Sep 5 – Sep 8, 2012, Pittsburgh, USA. Copyright 2012 ACM 978-1-4503-1224-0/12/09...$10.00.

Welcome message from author
This document is posted to help you gain knowledge. Please leave a comment to let me know what you think about it! Share it to your friends and learn new things together.
Transcript
1 OPPORTUNITY Activity Challenge – http://www.opportunity-project.eu/node/58 2 NOKIA Mobile Data Challenge – http://research.nokia.com/page/12000
An Integrated Framework for Human Activity Classification Hong Cao1, Minh Nhut Nguyen1, Clifton Phua1, Shonali Krishnaswamy1,2, Xiao-Li Li1
1 Institute for Infocomm Research, A*STAR 2 Faculty of Information Technology, Monash University
1 Fusionopolis Way, Connexis (South Tower), Singapore 138632 {hcao, mnnguyen, cwcphua, spkrishna, xlli}@i2r.a-star.edu.sg
ABSTRACT This paper presents an integrated framework to enable using standard non-sequential machine learning tools for accurate multi-modal activity recognition. We develop a novel framework that contains simple pre- and post-classification strategies to improve the overall performance. We achieve this through class-imbalance correction on the learning data using structure preserving oversampling (SPO), leveraging the sequential nature of sensory data using smoothing of the predicted label sequence and classifier fusion, respectively. Through evaluation on recent publicly available activity datasets comprising of a large amount of multi-dimensional sensory data, we demonstrate that our proposed strategies are effective in improving classification performance over common techniques such as One Nearest Neighbor (1NN) and Support Vector Machines (SVM). Our framework also shows better performance over sequential probabilistic models, such as Conditional Random Field (CRF) and Hidden Markov Model (HMM) and when these models are used as meta-learners.
Author Keywords Activity recognition, Data mining, Imbalance, Learning, Ubiquitous computing, Smoothing, Wearable computing
1. INTRODUCTION Recognition of Human Activities (RHA) generally pertains to the determining of a human user’s activity using sensory and other contextual information that is readily available and accessible. Early research in activity recognition from sensory data focused on both the physical development and deployment of sensors, as well as signal processing for detecting physical activities such as walking, sitting, lying and so on from a combination of on-body sensors such as accelerometers, gyroscopes, temperature and other sensors [1-6]. More recent research has focused on the application of a range of intelligent techniques such as soft computing (e.g. neuro-fuzzy approaches [7]), Bayesian/topic modeling
[8] and varied machine learning approaches [9-10, 12-15, 17-22] for RHA from sensory data.
The widespread availability and easy accessibility of real-time sensory information is bringing a new maturity to the field of activity recognition evidenced by the emerging trend of benchmarking initiatives such as the OPPORTUNITY Activity Recognition Challenge1 and the Nokia Mobile Data Challenge2. We hypothesize that the availability of such real-world datasets for activity recognition brings opportunities for deeper understanding of the characteristics of sensory data in this domain and facilitates the development of improved techniques to recognize activities from such data.
While a number of machine learning categories have been explored for activity recognition including unsupervised [9] and semi-supervised/active [10], majority of existing techniques have focused on traditional classificatory approaches [12,13]. The classification process can be modeled in terms of a data collection stage, a data transfer process, a modeling stage where the classification model is trained and tested, and finally a deployment stage where the learnt model is deployed on-board the mobile device for classifying activities based on incoming sensory data. The typical approaches for building the classifiers for activity recognition were reviewed in [12] and most of the works deployed supervised machine learning algorithms such as Naive Bayes, Decision Trees, Hidden Markov Models (HMM), Conditional Random Field (CRF), Nearest Neighbor (NN), Support Vector Machines (SVM), and different Boosting techniques.
While sequential classifiers, e.g. HMM and CRF, are common for learning from sequences, in this paper, we focus on developing a set of pre- and post-classification techniques that enable using standard non-sequential learning techniques for accurate activity recognition. This is motivated by our finding that the non-sequential techniques, such as SVM and NN, have good competitiveness and scalability on large-dimensional and continuous-valued activity sensory data. Our key premise is that a large number of state-of-the-art non-sequential classifiers in this domain involve applying existing learning methods without sufficient investigation and emphasis on certain distinctive characteristics of sensory data. These characteristics are quite apparent from the observation on recent publicly
Permission to make digital or hard copies of all or part of this work forpersonal or classroom use is granted without fee provided that copies arenot made or distributed for profit or commercial advantage and that copiesbear this notice and the full citation on the first page. To copy otherwise,or republish, to post on servers or to redistribute to lists, requires priorspecific permission and/or a fee. UbiComp’ 12, Sep 5 – Sep 8, 2012, Pittsburgh, USA. Copyright 2012 ACM 978-1-4503-1224-0/12/09...$10.00.
available benchmarking activity datasets. Bearing in mind that more such multi-sensory data would be available in the future due to the improving body sensor hardware and the reducing cost, we hypothesize and establish in this paper that due consideration to these key features of activity data and factoring them into the classification process can significantly improve the recognition accuracy as opposed to simple application of existing classification techniques. The key factors that need to be considered in this context are as follows:
1. Class Imbalance - This refers to the naturally occurring characteristic in activity data wherein some activities recur at a considerably higher frequency and with a longer duration, while some others tend to be relatively infrequent and short. For example, walking/sitting might have a significantly higher frequency than lying down. However, in order to accurately recognize the rare activities, the imbalance in the data needs to be addressed so that the classifier’s bias is neutralized. A good contribution of this paper is that we propose to use structure preserving oversampling technique for addressing class imbalance in this new domain to classify multiclass sensory data and experimentally demonstrate the benefit of the improved learning accuracy.
2. Smoothing and fusion – Following the training of a classifier on the data, the model is typically validated through a testing phase to establish the predictive accuracy. We propose that the known fact of sensor sampling rates being at a significantly higher frequency than the rate of change of human activities can be effectively leveraged to inform and improve the classifier’s accuracy. Thus, we use information from the class labels in a small neighborhood (in the temporal dimension) to “smooth” the current activity prediction accuracy. Our second key contribution of our approach is the new development of a simple yet effective smoothing technique that results in improved recognition accuracy when compared with the traditional straight-forward application of a standard classifier and other post-classification learning strategies. Fusion further combines our smoothed results from different classifiers and our results show its effectiveness for improved performance in activity recognition.
Our proposed framework is generic (i.e. can be used with well known and different non-sequential classification techniques for activity classification) and integrated (i.e. combines the above two strategies with standard pre-processing and classification techniques) for learning to detect and classify activities from large-dimensional,
continuous-valued, multi-modal sensory data. Contrary to many existing RHA works that apply individual learning techniques in isolation, our work not only shows the incremental gains due to each proposed component, but also demonstrates the good performance achieved at framework level, i.e. when our different components are integrated. Experimental results show that our integrated framework is effective to enhance the classification accuracy of traditional non-sequential classifiers such as SVM and 1NN with confident margins. We further show that our framework also improves the learning performance when compared with sequential learning techniques such as Hidden Mark Models (HMM) and Conditional Random Fields (CRF). These techniques learn from temporal sequence data and are also widely used for activity recognition or as meta-learners. Our experiments are conducted on real-world, publicly available activity recognition dataset.
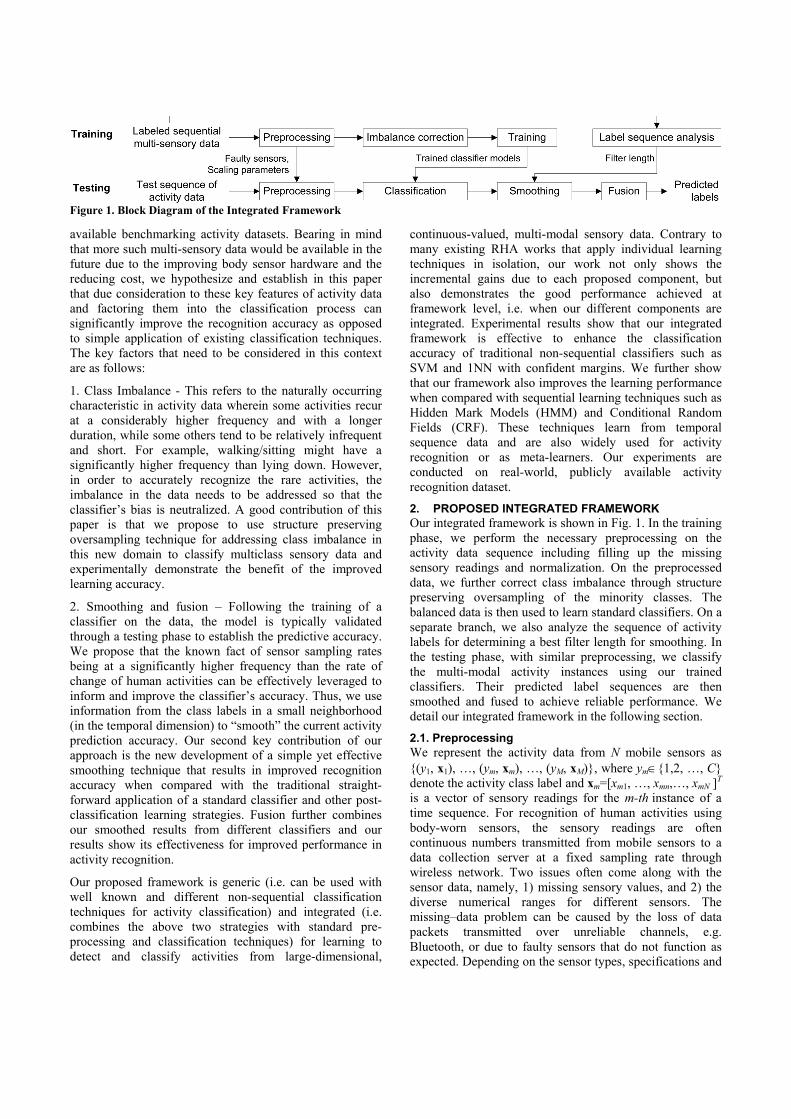
2. PROPOSED INTEGRATED FRAMEWORK Our integrated framework is shown in Fig. 1. In the training phase, we perform the necessary preprocessing on the activity data sequence including filling up the missing sensory readings and normalization. On the preprocessed data, we further correct class imbalance through structure preserving oversampling of the minority classes. The balanced data is then used to learn standard classifiers. On a separate branch, we also analyze the sequence of activity labels for determining a best filter length for smoothing. In the testing phase, with similar preprocessing, we classify the multi-modal activity instances using our trained classifiers. Their predicted label sequences are then smoothed and fused to achieve reliable performance. We detail our integrated framework in the following section.
2.1. Preprocessing We represent the activity data from N mobile sensors as {(y1, x1), …, (ym, xm), …, (yM, xM)}, where ym{1,2, …, C} denote the activity class label and xm=[xm1, …, xmn,…, xmN ]T is a vector of sensory readings for the m-th instance of a time sequence. For recognition of human activities using body-worn sensors, the sensory readings are often continuous numbers transmitted from mobile sensors to a data collection server at a fixed sampling rate through wireless network. Two issues often come along with the sensor data, namely, 1) missing sensory values, and 2) the diverse numerical ranges for different sensors. The missing–data problem can be caused by the loss of data packets transmitted over unreliable channels, e.g. Bluetooth, or due to faulty sensors that do not function as expected. Depending on the sensor types, specifications and
Figure 1. Block Diagram of the Integrated Framework
their manufacturers, different mobile sensors provide their values in diverse numerical ranges. Our preprocessing addresses these issues through cubic spline interpolation and linear normalization, respectively.
We choose a cubic spline method [21] for filling up the missing values as follows. Given a set of known readings {xt(1)n, xt(2)n, …, xt(P)n} from the n-th sensor, where t(1)≤t(2)≤…≤t(P) are the time indices, we can compute a
function fn(t) satisfying ( )nt p nx f t p for 1≤p≤P using a
interpolation function. The function fn(t) can be then used to approximate a missing value of the n-th sensor at any time index , where t(1)≤≤t(P). Using Cubic Spline Interpolation (CSI), fn(t) is written as [16]
1
1
if (1) (2)
if ( 1) ( )
n
n
nP
w t t t t
f t
w t t P t t P
(1)
where 3 2( ) ( ) ( ) +np np np np npw t t t p t t p t t p
is the p-th cubic spline, i.e. a third-order polynomial curve. By enforcing connectivity and smoothness constraints of all neighboring splines, the parameters { , , , }np np np np for
1≤p≤P-1 can be solved using standard solution [16, 21]. CSI has the desired property of smoothly approximating a nonlinear time signal. Considering that the high sampling rate of today’s sensors, say 30 samples per second, is much faster than human body movement, the consecutive sensor readings for monitoring human activities would not change dramatically in a short time of a few sampling intervals. Therefore, we choose CSI to fill up the missing sensory values. This method is expectedly efficient as it does not involve computing the correlation among the sensory data as required in the probabilistic approach [17] and in the multiple imputation approaches [21]. However, our interpolation approach (or any other interpolation approach) is not expected to work well in the case that a large percentage, e.g. 30%, of data from a sensor is missing (i.e. they do not provide sufficient information for reliable inference of other missing data). For such sensors, we regard them as faulty sensors and remove their corresponding data from our multimodal sensory data.
After filling up the missing values, we normalize each sensor’s data to have a zero mean and unity standard deviation. The normalization parameters learned from the training data are shared in the testing phase to normalize the n-th sensor readings of a given test data.
2.2. Imbalance Correction In a practical scenario, activity data are often imbalanced as different human activities naturally occur at diverse frequencies. This issue often results in degraded performance as standard learning tools often undesirably bias towards the majority classes with large population. However, neither do the majority classes necessarily represent high importance nor are the minority classes
trivial. This imbalance issue has not been well explored in activity spotting and recognition as many existing works [13, 19] rely on the sequential models’ capability to segment and recognize activities (e.g. through detecting changes in hidden state with HMM). Among a few existing works, Stager et al. [20] manipulate the operating point of receiver operating characteristic (ROC) curve to deal with the class skew issue in activity context recognition with probabilistic classifiers. Albinali et al. [18], briefly describe a non-parametric bootstrapping technique to generate pseudo samples for improving Bayesian network learners on sparse activity datasets. But the effectiveness of this procedure was not separately evaluated. In our work, we propose and evaluate using a new Structural Preserving Oversampling (SPO) [23] to correct the imbalance for its preserved covariance structure and enhanced representation of the minority classes.
By discarding the temporal sequence information of the training data, we reorganize the sensor records according to their class labels. Suppose our targeted population for each class is Q, meaning for each class whose population is less than Q, we generate some synthetic samples to complement its population to Q. Let P={s11, s12, …, s1|P|} be such a minority class, where |P|<Q, s1j is a vector of sensor readings with class label 0, and N={s01, s02,…, s0|N|} be the majority class containing all the instances from the remaining classes. sij 1N and N denote dimension of the sensor data. We perform the following steps to generate Q-|P| synthetic samples for each minority class:
1. Compute the covariance matrix for P
1 1 1 11
1 T
j jj W
Ps s s s
P (3)
where 1 11 jj P
s s P is mean vector;
2. Perform eigen decomposition
T V WV D (4)
where V=[v1,…,vj,…,vN] is the matrix of eigenvectors and D is a diagonal matrix with the corresponding eigenvalues d1…dj…dN in descending order, which is known as the eigen spectrum [25]. Suppose dN > 0, Eqn (4) is further decomposed as
1 2 1 2
1 1 1 11
= =
1
T TN
TT T T Tj j
j
VD W VD I F WF
F F F FP
s s s sP
(5)
where 1 21 1[ , , , , ]j j N Nd d d F VD v v v is a
scaled transformation so that { 1T
jF s } for 1≤j≤|P| has an
identity covariance matrix N NN
I .
3. Divide eigen spectrum:
By dividing P randomly into two equal partitions, we perform two-fold cross validation (CV) to find a suitable location B that divides the eigen spectrum {dj} into two regions, the reliable (dominant eigenvalues) and the unreliable region (trivial eigenvalues). Through computing and matching the eigen spectrum of each partition with the CV spectrum, B is determined as the location where the eigen spectrum departs from the CV spectrum. Here, the unreliable spectrum region can be caused by insufficient training instances relevant to the large dimension of available mobile sensors. In general, the larger the number training instances in a class, the greater is B with smaller unreliable eigen spectrum region.
4. Regularize unreliable eigen spectrum:
We use d1 and dB in the reliable spectrum to learn parameters e and r of an eigen spectrum model [24] below
e
jj r
(6)
where 1 1
1 1
1 and .B B
B B
d d B Bd de r
d d d d
The new j-th
eigenvalue becomes
, for (Reliable region)ˆ
, otherwise (Unreliable region)j
j
d j Bd
j
(7)
and note the dominant eigenvalues remain unchanged.
5. Generate a random vector 1Nz according to the multivariate Gaussian distribution ( , )N N0 IN . We choose
Gaussian distribution for its ubiquity and its nature of being quadratic, which agrees with majority of learning algorithms [25].
6. Transform z using
1 21 1
ˆ ˆT T F = D Vk z + s z + s (8)
where 1 21 1
ˆ ˆ ˆˆ ˆ [ , , , , ].j j N Nd d d F VD v v v
7. Cleaning:
Check whether the inclusion of k as a new instance in P would worsen the class overlapping by introducing a new Tomek link [26]. A Tomek link is defined as a pair of
mutually nearest instances in the training dataset, which share different class labels. In the case that no new Tomek link is created in the training dataset based on Euclidean distance measure, we keep k as a new instance of the minority class. Otherwise, we discard k.
8. Repeat Steps 5-7 until Q-|P| synthetic instances are generated.
9. The above algorithm is repeated for each minority class that requires oversampling to meet our targeted population of Q. Q is chosen to boost each rare class to a same substantial population level for reduced class imbalance.
Besides preserving the covariance structure of different sensors, the synthetic distribution generated from SPO intelligently adds buffering variances in the regularized eigen dimensions [23]. In the case of sparse distribution of the minority class, the synthetic instances also effectively disperse into the void space within and in the vicinity of the minority class to form a more comprehensive new class territory. Moreover, the cleaning mechanism ensures that the synthetic instances from SPO do not worsen the current class overlapping by introducing new Tomek links. This also reduces the inherent risk that the minority classes do not follow Gaussian distribution. Such desired features are seldom provided in conventional oversampling methods, such as SMOTE [24].
After SPO oversampling, we use sensory values in balanced dataset as features to train the non-sequential classification models, such as SVM [27] and 1NN [28], for classifying the test instances.
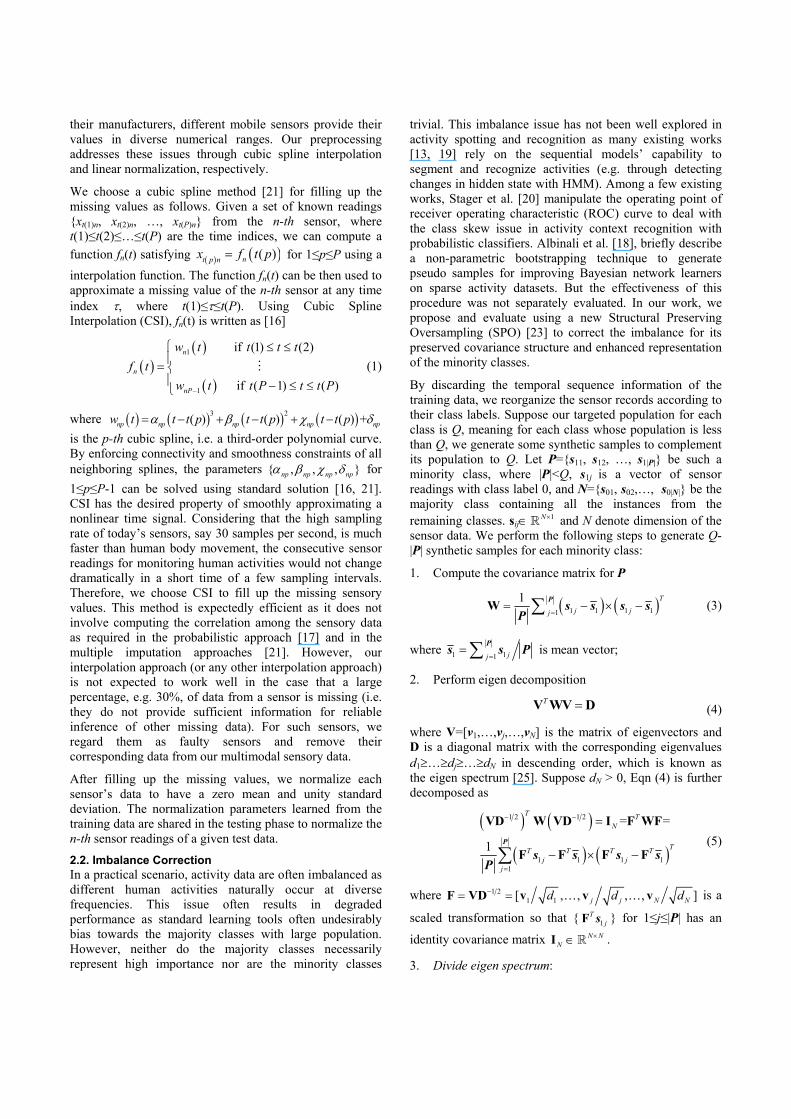
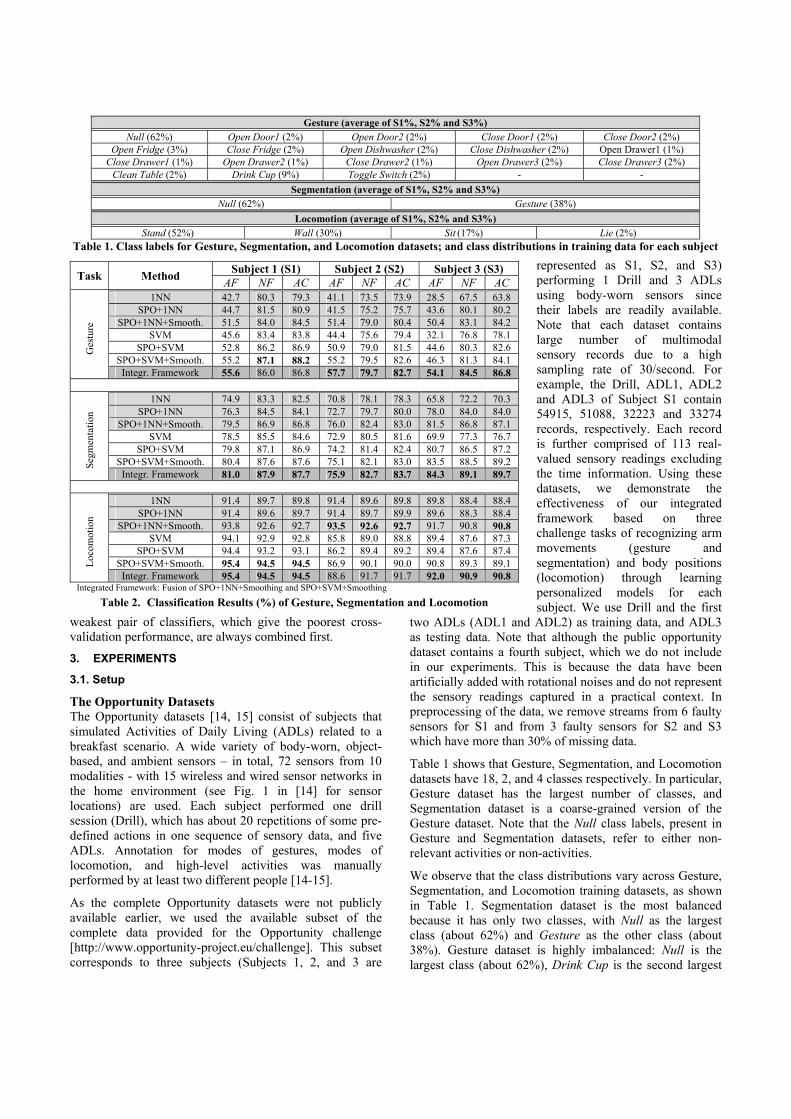
2.3. Smoothing and Fusion By applying our trained classifiers to a test sequence of activity instances, we readily obtain several predicted label sequences. As shown in Fig. 2, we further introduce two post-processes, i.e. smoothing and fusion, to enhance the classification performance. Given that instance sampling is performed on increasing time dimension, our smoothing operates along the temporal axis and utilizes the fact that neighboring instances in a sensor sequence often share similar activity class labels. This is due to the high sensor sampling rate in comparison with the frequency of human activity changes. We thus propose fusion as a mechanism to integrate the smoothed label sequences from different classifiers to have more robust prediction outcomes. We propose a simple smoothing algorithm. Given a label sequence signal =<1, 2, …, L> and pre-determined filter
length signal u = <u1, u2, …, uL>, the i-th smoothed label is computed using
Smoothing Window , ,i ih u i (9)
where Window , ,iu i is a segment of centered at the
location i with a length ui. Smoothing( ) finds the most
frequent label in this segment. The smoothed label is computed on all the sequential locations. The new label
Figure 2. Smoothing and Fusion of Predicted Label Sequences
sequence h = <h1, h2, …, hL> replaces the old sequence u as our smoothed predictions. Our smoothing is similar to low-pass filtering, which removes the impulse noises (most likely the prediction errors) and maintains the edges, i.e. the locations where the activity changes. Moreover, our
smoothing is well suited for symbolic sequence, such as our activity labels.
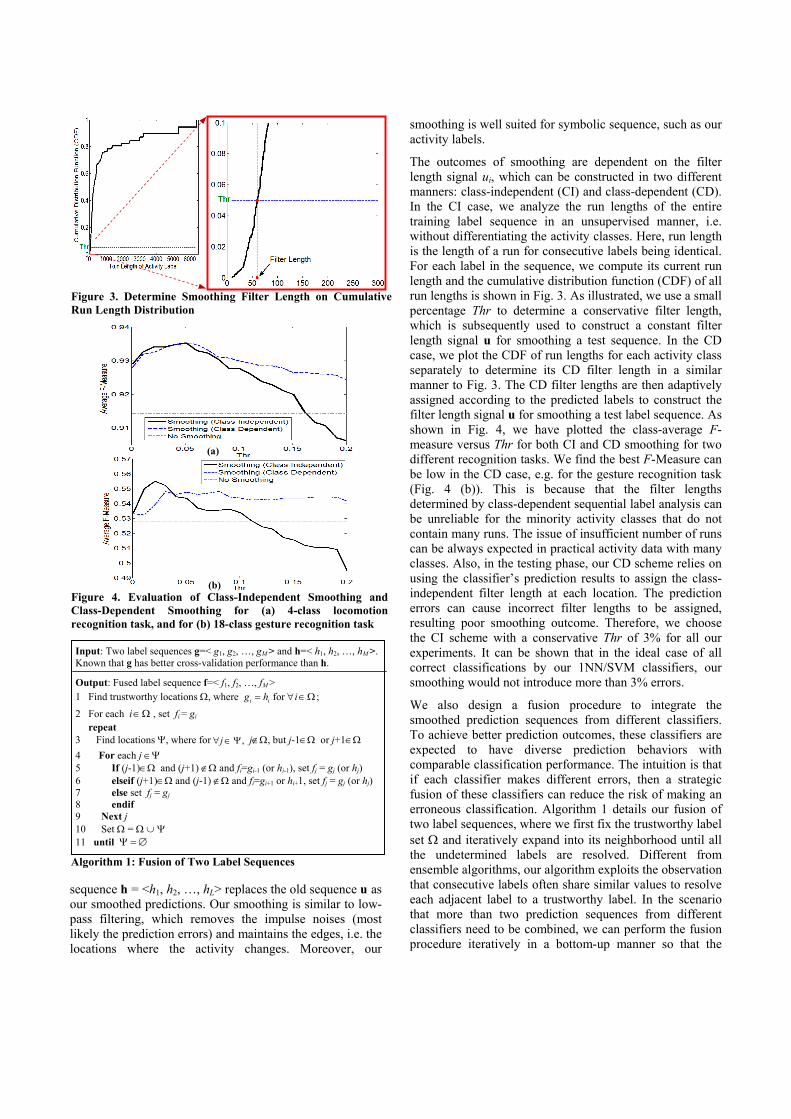
The outcomes of smoothing are dependent on the filter length signal ui, which can be constructed in two different manners: class-independent (CI) and class-dependent (CD). In the CI case, we analyze the run lengths of the entire training label sequence in an unsupervised manner, i.e. without differentiating the activity classes. Here, run length is the length of a run for consecutive labels being identical. For each label in the sequence, we compute its current run length and the cumulative distribution function (CDF) of all run lengths is shown in Fig. 3. As illustrated, we use a small percentage Thr to determine a conservative filter length, which is subsequently used to construct a constant filter length signal u for smoothing a test sequence. In the CD case, we plot the CDF of run lengths for each activity class separately to determine its CD filter length in a similar manner to Fig. 3. The CD filter lengths are then adaptively assigned according to the predicted labels to construct the filter length signal u for smoothing a test label sequence. As shown in Fig. 4, we have plotted the class-average F-measure versus Thr for both CI and CD smoothing for two different recognition tasks. We find the best F-Measure can be low in the CD case, e.g. for the gesture recognition task (Fig. 4 (b)). This is because that the filter lengths determined by class-dependent sequential label analysis can be unreliable for the minority activity classes that do not contain many runs. The issue of insufficient number of runs can be always expected in practical activity data with many classes. Also, in the testing phase, our CD scheme relies on using the classifier’s prediction results to assign the class-independent filter length at each location. The prediction errors can cause incorrect filter lengths to be assigned, resulting poor smoothing outcome. Therefore, we choose the CI scheme with a conservative Thr of 3% for all our experiments. It can be shown that in the ideal case of all correct classifications by our 1NN/SVM classifiers, our smoothing would not introduce more than 3% errors.
We also design a fusion procedure to integrate the smoothed prediction sequences from different classifiers. To achieve better prediction outcomes, these classifiers are expected to have diverse prediction behaviors with comparable classification performance. The intuition is that if each classifier makes different errors, then a strategic fusion of these classifiers can reduce the risk of making an erroneous classification. Algorithm 1 details our fusion of two label sequences, where we first fix the trustworthy label set and iteratively expand into its neighborhood until all the undetermined labels are resolved. Different from ensemble algorithms, our algorithm exploits the observation that consecutive labels often share similar values to resolve each adjacent label to a trustworthy label. In the scenario that more than two prediction sequences from different classifiers need to be combined, we can perform the fusion procedure iteratively in a bottom-up manner so that the
(a)
(b) Figure 4. Evaluation of Class-Independent Smoothing andClass-Dependent Smoothing for (a) 4-class locomotionrecognition task, and for (b) 18-class gesture recognition task
Input: Two label sequences g=< g1, g2, …, gM > and h=< h1, h2, …, hM >. Known that g has better cross-validation performance than h.
Output: Fused label sequence f=< f1, f2, …, fM > 1 Find trustworthy locations , where for ;i ig h i
2 For each i , set fi = gi
repeat 3 Find locations , where for ,j j, but j-1 or j+1
4 For each j 5 If (j-1) and (j+1) and fi=gi-1 (or hi-1), set fj = gj (or hj) 6 elseif (j+1) and (j-1) and fi=gi+1 or hi+1, set fj = gj (or hj)
7 else set fj = gj 8 endif 9 Next j 10 Set = 11 until
Algorithm 1: Fusion of Two Label Sequences
Figure 3. Determine Smoothing Filter Length on CumulativeRun Length Distribution
weakest pair of classifiers, which give the poorest cross-validation performance, are always combined first.
3. EXPERIMENTS
3.1. Setup
The Opportunity Datasets The Opportunity datasets [14, 15] consist of subjects that simulated Activities of Daily Living (ADLs) related to a breakfast scenario. A wide variety of body-worn, object-based, and ambient sensors – in total, 72 sensors from 10 modalities - with 15 wireless and wired sensor networks in the home environment (see Fig. 1 in [14] for sensor locations) are used. Each subject performed one drill session (Drill), which has about 20 repetitions of some pre-defined actions in one sequence of sensory data, and five ADLs. Annotation for modes of gestures, modes of locomotion, and high-level activities was manually performed by at least two different people [14-15].
As the complete Opportunity datasets were not publicly available earlier, we used the available subset of the complete data provided for the Opportunity challenge [http://www.opportunity-project.eu/challenge]. This subset corresponds to three subjects (Subjects 1, 2, and 3 are
represented as S1, S2, and S3) performing 1 Drill and 3 ADLs using body-worn sensors since their labels are readily available. Note that each dataset contains large number of multimodal sensory records due to a high sampling rate of 30/second. For example, the Drill, ADL1, ADL2 and ADL3 of Subject S1 contain 54915, 51088, 32223 and 33274 records, respectively. Each record is further comprised of 113 real-valued sensory readings excluding the time information. Using these datasets, we demonstrate the effectiveness of our integrated framework based on three challenge tasks of recognizing arm movements (gesture and segmentation) and body positions (locomotion) through learning personalized models for each subject. We use Drill and the first
two ADLs (ADL1 and ADL2) as training data, and ADL3 as testing data. Note that although the public opportunity dataset contains a fourth subject, which we do not include in our experiments. This is because the data have been artificially added with rotational noises and do not represent the sensory readings captured in a practical context. In preprocessing of the data, we remove streams from 6 faulty sensors for S1 and from 3 faulty sensors for S2 and S3 which have more than 30% of missing data.
Table 1 shows that Gesture, Segmentation, and Locomotion datasets have 18, 2, and 4 classes respectively. In particular, Gesture dataset has the largest number of classes, and Segmentation dataset is a coarse-grained version of the Gesture dataset. Note that the Null class labels, present in Gesture and Segmentation datasets, refer to either non-relevant activities or non-activities.
We observe that the class distributions vary across Gesture, Segmentation, and Locomotion training datasets, as shown in Table 1. Segmentation dataset is the most balanced because it has only two classes, with Null as the largest class (about 62%) and Gesture as the other class (about 38%). Gesture dataset is highly imbalanced: Null is the largest class (about 62%), Drink Cup is the second largest
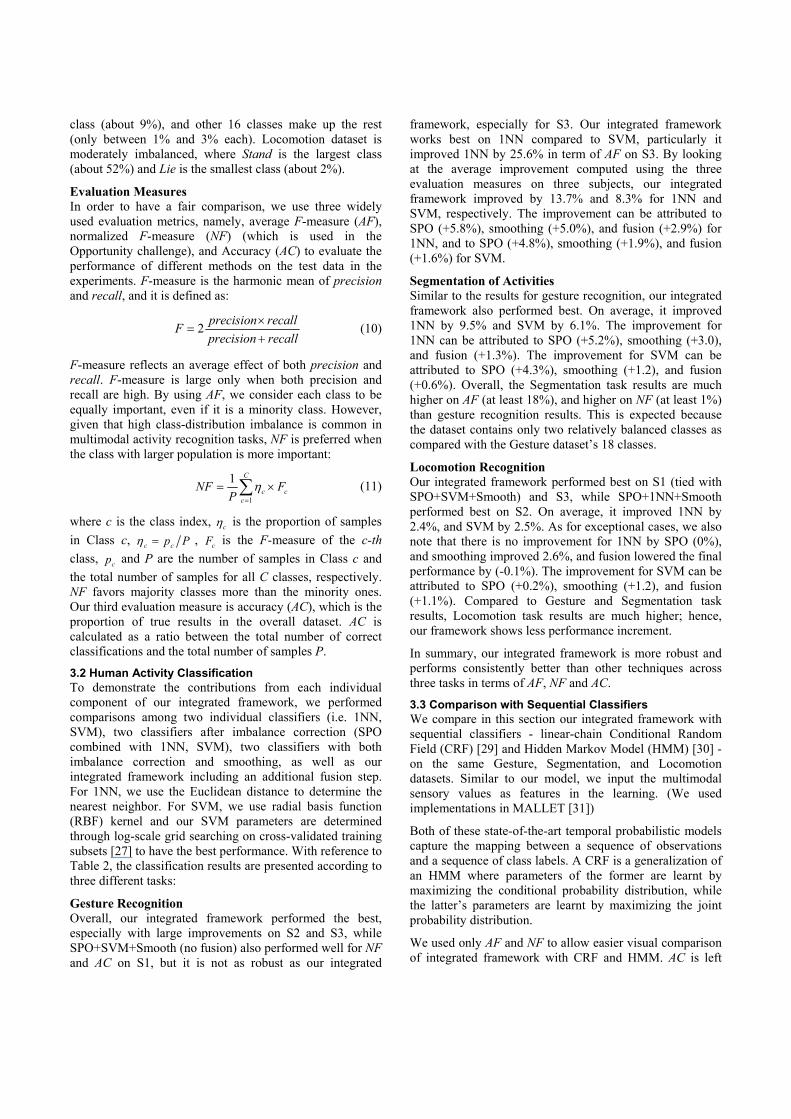
Gesture (average of S1%, S2% and S3%) Null (62%) Open Door1 (2%) Open Door2 (2%) Close Door1 (2%) Close Door2 (2%)
Open Fridge (3%) Close Fridge (2%) Open Dishwasher (2%) Close Dishwasher (2%) Open Drawer1 (1%) Close Drawer1 (1%) Open Drawer2 (1%) Close Drawer2 (1%) Open Drawer3 (2%) Close Drawer3 (2%)
Clean Table (2%) Drink Cup (9%) Toggle Switch (2%) - -
Segmentation (average of S1%, S2% and S3%) Null (62%) Gesture (38%)
Locomotion (average of S1%, S2% and S3%) Stand (52%) Wall (30%) Sit (17%) Lie (2%)
Table 1. Class labels for Gesture, Segmentation, and Locomotion datasets; and class distributions in training data for each subject
Task Method Subject 1 (S1) Subject 2 (S2) Subject 3 (S3)
AF NF AC AF NF AC AF NF AC
Ges
ture
1NN 42.7 80.3 79.3 41.1 73.5 73.9 28.5 67.5 63.8 SPO+1NN 44.7 81.5 80.9 41.5 75.2 75.7 43.6 80.1 80.2
SPO+1NN+Smooth. 51.5 84.0 84.5 51.4 79.0 80.4 50.4 83.1 84.2 SVM 45.6 83.4 83.8 44.4 75.6 79.4 32.1 76.8 78.1
SPO+SVM 52.8 86.2 86.9 50.9 79.0 81.5 44.6 80.3 82.6 SPO+SVM+Smooth. 55.2 87.1 88.2 55.2 79.5 82.6 46.3 81.3 84.1 Integr. Framework 55.6 86.0 86.8 57.7 79.7 82.7 54.1 84.5 86.8
Segm
enta
tion
1NN 74.9 83.3 82.5 70.8 78.1 78.3 65.8 72.2 70.3 SPO+1NN 76.3 84.5 84.1 72.7 79.7 80.0 78.0 84.0 84.0
SPO+1NN+Smooth. 79.5 86.9 86.8 76.0 82.4 83.0 81.5 86.8 87.1 SVM 78.5 85.5 84.6 72.9 80.5 81.6 69.9 77.3 76.7
SPO+SVM 79.8 87.1 86.9 74.2 81.4 82.4 80.7 86.5 87.2 SPO+SVM+Smooth. 80.4 87.6 87.6 75.1 82.1 83.0 83.5 88.5 89.2 Integr. Framework 81.0 87.9 87.7 75.9 82.7 83.7 84.3 89.1 89.7
Loc
omot
ion
1NN 91.4 89.7 89.8 91.4 89.6 89.8 89.8 88.4 88.4 SPO+1NN 91.4 89.6 89.7 91.4 89.7 89.9 89.6 88.3 88.4
SPO+1NN+Smooth. 93.8 92.6 92.7 93.5 92.6 92.7 91.7 90.8 90.8 SVM 94.1 92.9 92.8 85.8 89.0 88.8 89.4 87.6 87.3
SPO+SVM 94.4 93.2 93.1 86.2 89.4 89.2 89.4 87.6 87.4 SPO+SVM+Smooth. 95.4 94.5 94.5 86.9 90.1 90.0 90.8 89.3 89.1 Integr. Framework 95.4 94.5 94.5 88.6 91.7 91.7 92.0 90.9 90.8
Integrated Framework: Fusion of SPO+1NN+Smoothing and SPO+SVM+Smoothing
Table 2. Classification Results (%) of Gesture, Segmentation and Locomotion
class (about 9%), and other 16 classes make up the rest (only between 1% and 3% each). Locomotion dataset is moderately imbalanced, where Stand is the largest class (about 52%) and Lie is the smallest class (about 2%).
Evaluation Measures In order to have a fair comparison, we use three widely used evaluation metrics, namely, average F-measure (AF), normalized F-measure (NF) (which is used in the Opportunity challenge), and Accuracy (AC) to evaluate the performance of different methods on the test data in the experiments. F-measure is the harmonic mean of precision and recall, and it is defined as:
2precision recall
Fprecision recall
(10)
F-measure reflects an average effect of both precision and recall. F-measure is large only when both precision and recall are high. By using AF, we consider each class to be equally important, even if it is a minority class. However, given that high class-distribution imbalance is common in multimodal activity recognition tasks, NF is preferred when the class with larger population is more important:
1
1 C
c cc
NF FP
(11)
where c is the class index, c is the proportion of samples
in Class c, c cp P , cF is the F-measure of the c-th
class, cp and P are the number of samples in Class c and
the total number of samples for all C classes, respectively. NF favors majority classes more than the minority ones. Our third evaluation measure is accuracy (AC), which is the proportion of true results in the overall dataset. AC is calculated as a ratio between the total number of correct classifications and the total number of samples P.
3.2 Human Activity Classification To demonstrate the contributions from each individual component of our integrated framework, we performed comparisons among two individual classifiers (i.e. 1NN, SVM), two classifiers after imbalance correction (SPO combined with 1NN, SVM), two classifiers with both imbalance correction and smoothing, as well as our integrated framework including an additional fusion step. For 1NN, we use the Euclidean distance to determine the nearest neighbor. For SVM, we use radial basis function (RBF) kernel and our SVM parameters are determined through log-scale grid searching on cross-validated training subsets [27] to have the best performance. With reference to Table 2, the classification results are presented according to three different tasks:
Gesture Recognition Overall, our integrated framework performed the best, especially with large improvements on S2 and S3, while SPO+SVM+Smooth (no fusion) also performed well for NF and AC on S1, but it is not as robust as our integrated
framework, especially for S3. Our integrated framework works best on 1NN compared to SVM, particularly it improved 1NN by 25.6% in term of AF on S3. By looking at the average improvement computed using the three evaluation measures on three subjects, our integrated framework improved by 13.7% and 8.3% for 1NN and SVM, respectively. The improvement can be attributed to SPO (+5.8%), smoothing (+5.0%), and fusion (+2.9%) for 1NN, and to SPO (+4.8%), smoothing (+1.9%), and fusion (+1.6%) for SVM.
Segmentation of Activities Similar to the results for gesture recognition, our integrated framework also performed best. On average, it improved 1NN by 9.5% and SVM by 6.1%. The improvement for 1NN can be attributed to SPO (+5.2%), smoothing (+3.0), and fusion (+1.3%). The improvement for SVM can be attributed to SPO (+4.3%), smoothing (+1.2), and fusion (+0.6%). Overall, the Segmentation task results are much higher on AF (at least 18%), and higher on NF (at least 1%) than gesture recognition results. This is expected because the dataset contains only two relatively balanced classes as compared with the Gesture dataset’s 18 classes.
Locomotion Recognition Our integrated framework performed best on S1 (tied with SPO+SVM+Smooth) and S3, while SPO+1NN+Smooth performed best on S2. On average, it improved 1NN by 2.4%, and SVM by 2.5%. As for exceptional cases, we also note that there is no improvement for 1NN by SPO (0%), and smoothing improved 2.6%, and fusion lowered the final performance by (-0.1%). The improvement for SVM can be attributed to SPO (+0.2%), smoothing (+1.2), and fusion (+1.1%). Compared to Gesture and Segmentation task results, Locomotion task results are much higher; hence, our framework shows less performance increment.
In summary, our integrated framework is more robust and performs consistently better than other techniques across three tasks in terms of AF, NF and AC.
3.3 Comparison with Sequential Classifiers We compare in this section our integrated framework with sequential classifiers - linear-chain Conditional Random Field (CRF) [29] and Hidden Markov Model (HMM) [30] - on the same Gesture, Segmentation, and Locomotion datasets. Similar to our model, we input the multimodal sensory values as features in the learning. (We used implementations in MALLET [31])
Both of these state-of-the-art temporal probabilistic models capture the mapping between a sequence of observations and a sequence of class labels. A CRF is a generalization of an HMM where parameters of the former are learnt by maximizing the conditional probability distribution, while the latter’s parameters are learnt by maximizing the joint probability distribution.
We used only AF and NF to allow easier visual comparison of integrated framework with CRF and HMM. AC is left
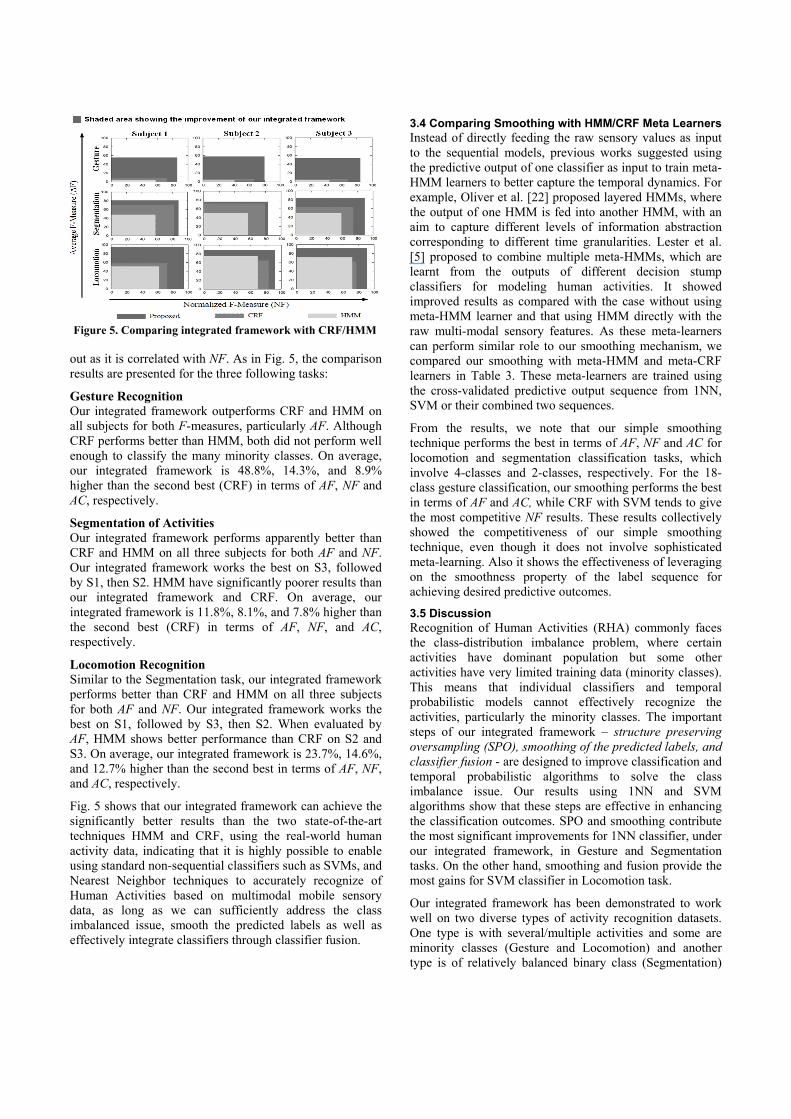
out as it is correlated with NF. As in Fig. 5, the comparison results are presented for the three following tasks:
Gesture Recognition Our integrated framework outperforms CRF and HMM on all subjects for both F-measures, particularly AF. Although CRF performs better than HMM, both did not perform well enough to classify the many minority classes. On average, our integrated framework is 48.8%, 14.3%, and 8.9% higher than the second best (CRF) in terms of AF, NF and AC, respectively.
Segmentation of Activities Our integrated framework performs apparently better than CRF and HMM on all three subjects for both AF and NF. Our integrated framework works the best on S3, followed by S1, then S2. HMM have significantly poorer results than our integrated framework and CRF. On average, our integrated framework is 11.8%, 8.1%, and 7.8% higher than the second best (CRF) in terms of AF, NF, and AC, respectively.
Locomotion Recognition Similar to the Segmentation task, our integrated framework performs better than CRF and HMM on all three subjects for both AF and NF. Our integrated framework works the best on S1, followed by S3, then S2. When evaluated by AF, HMM shows better performance than CRF on S2 and S3. On average, our integrated framework is 23.7%, 14.6%, and 12.7% higher than the second best in terms of AF, NF, and AC, respectively.
Fig. 5 shows that our integrated framework can achieve the significantly better results than the two state-of-the-art techniques HMM and CRF, using the real-world human activity data, indicating that it is highly possible to enable using standard non-sequential classifiers such as SVMs, and Nearest Neighbor techniques to accurately recognize of Human Activities based on multimodal mobile sensory data, as long as we can sufficiently address the class imbalanced issue, smooth the predicted labels as well as effectively integrate classifiers through classifier fusion.
3.4 Comparing Smoothing with HMM/CRF Meta Learners Instead of directly feeding the raw sensory values as input to the sequential models, previous works suggested using the predictive output of one classifier as input to train meta-HMM learners to better capture the temporal dynamics. For example, Oliver et al. [22] proposed layered HMMs, where the output of one HMM is fed into another HMM, with an aim to capture different levels of information abstraction corresponding to different time granularities. Lester et al. [5] proposed to combine multiple meta-HMMs, which are learnt from the outputs of different decision stump classifiers for modeling human activities. It showed improved results as compared with the case without using meta-HMM learner and that using HMM directly with the raw multi-modal sensory features. As these meta-learners can perform similar role to our smoothing mechanism, we compared our smoothing with meta-HMM and meta-CRF learners in Table 3. These meta-learners are trained using the cross-validated predictive output sequence from 1NN, SVM or their combined two sequences.
From the results, we note that our simple smoothing technique performs the best in terms of AF, NF and AC for locomotion and segmentation classification tasks, which involve 4-classes and 2-classes, respectively. For the 18-class gesture classification, our smoothing performs the best in terms of AF and AC, while CRF with SVM tends to give the most competitive NF results. These results collectively showed the competitiveness of our simple smoothing technique, even though it does not involve sophisticated meta-learning. Also it shows the effectiveness of leveraging on the smoothness property of the label sequence for achieving desired predictive outcomes.
3.5 Discussion Recognition of Human Activities (RHA) commonly faces the class-distribution imbalance problem, where certain activities have dominant population but some other activities have very limited training data (minority classes). This means that individual classifiers and temporal probabilistic models cannot effectively recognize the activities, particularly the minority classes. The important steps of our integrated framework – structure preserving oversampling (SPO), smoothing of the predicted labels, and classifier fusion - are designed to improve classification and temporal probabilistic algorithms to solve the class imbalance issue. Our results using 1NN and SVM algorithms show that these steps are effective in enhancing the classification outcomes. SPO and smoothing contribute the most significant improvements for 1NN classifier, under our integrated framework, in Gesture and Segmentation tasks. On the other hand, smoothing and fusion provide the most gains for SVM classifier in Locomotion task.
Our integrated framework has been demonstrated to work well on two diverse types of activity recognition datasets. One type is with several/multiple activities and some are minority classes (Gesture and Locomotion) and another type is of relatively balanced binary class (Segmentation)
Figure 5. Comparing integrated framework with CRF/HMM
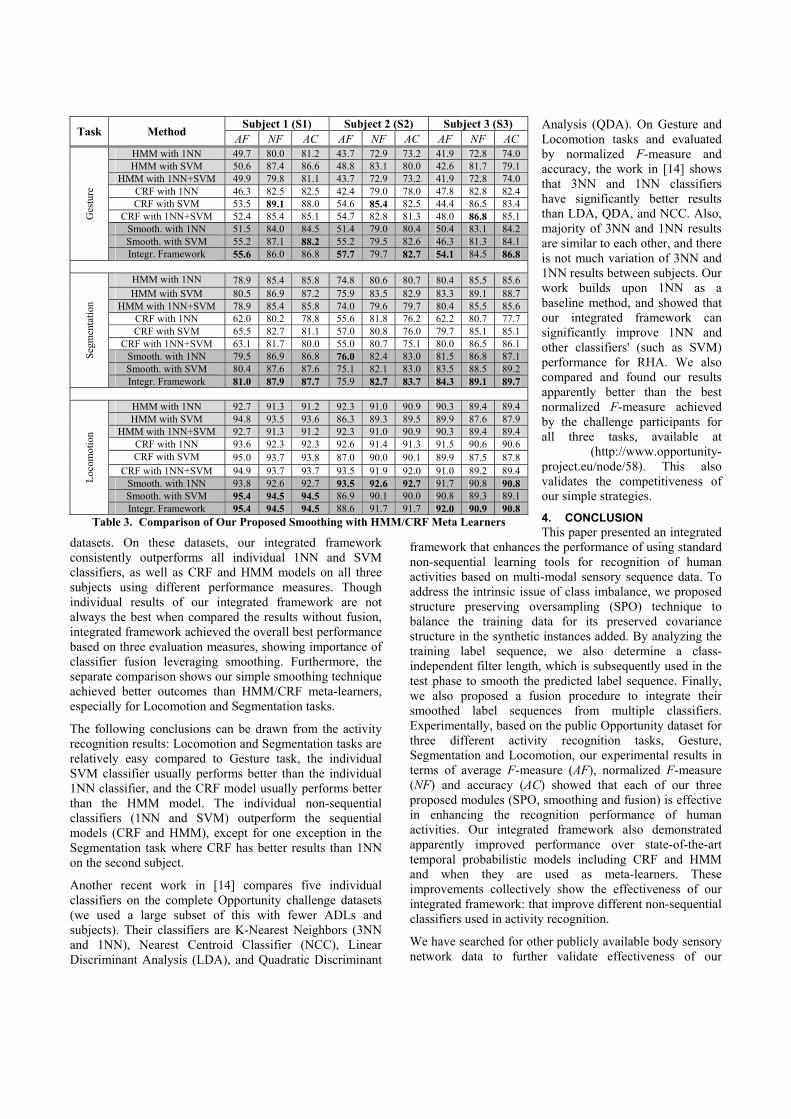
datasets. On these datasets, our integrated framework consistently outperforms all individual 1NN and SVM classifiers, as well as CRF and HMM models on all three subjects using different performance measures. Though individual results of our integrated framework are not always the best when compared the results without fusion, integrated framework achieved the overall best performance based on three evaluation measures, showing importance of classifier fusion leveraging smoothing. Furthermore, the separate comparison shows our simple smoothing technique achieved better outcomes than HMM/CRF meta-learners, especially for Locomotion and Segmentation tasks.
The following conclusions can be drawn from the activity recognition results: Locomotion and Segmentation tasks are relatively easy compared to Gesture task, the individual SVM classifier usually performs better than the individual 1NN classifier, and the CRF model usually performs better than the HMM model. The individual non-sequential classifiers (1NN and SVM) outperform the sequential models (CRF and HMM), except for one exception in the Segmentation task where CRF has better results than 1NN on the second subject.
Another recent work in [14] compares five individual classifiers on the complete Opportunity challenge datasets (we used a large subset of this with fewer ADLs and subjects). Their classifiers are K-Nearest Neighbors (3NN and 1NN), Nearest Centroid Classifier (NCC), Linear Discriminant Analysis (LDA), and Quadratic Discriminant
Analysis (QDA). On Gesture and Locomotion tasks and evaluated by normalized F-measure and accuracy, the work in [14] shows that 3NN and 1NN classifiers have significantly better results than LDA, QDA, and NCC. Also, majority of 3NN and 1NN results are similar to each other, and there is not much variation of 3NN and 1NN results between subjects. Our work builds upon 1NN as a baseline method, and showed that our integrated framework can significantly improve 1NN and other classifiers' (such as SVM) performance for RHA. We also compared and found our results apparently better than the best normalized F-measure achieved by the challenge participants for all three tasks, available at
(http://www.opportunity-project.eu/node/58). This also validates the competitiveness of our simple strategies.
4. CONCLUSION This paper presented an integrated
framework that enhances the performance of using standard non-sequential learning tools for recognition of human activities based on multi-modal sensory sequence data. To address the intrinsic issue of class imbalance, we proposed structure preserving oversampling (SPO) technique to balance the training data for its preserved covariance structure in the synthetic instances added. By analyzing the training label sequence, we also determine a class-independent filter length, which is subsequently used in the test phase to smooth the predicted label sequence. Finally, we also proposed a fusion procedure to integrate their smoothed label sequences from multiple classifiers. Experimentally, based on the public Opportunity dataset for three different activity recognition tasks, Gesture, Segmentation and Locomotion, our experimental results in terms of average F-measure (AF), normalized F-measure (NF) and accuracy (AC) showed that each of our three proposed modules (SPO, smoothing and fusion) is effective in enhancing the recognition performance of human activities. Our integrated framework also demonstrated apparently improved performance over state-of-the-art temporal probabilistic models including CRF and HMM and when they are used as meta-learners. These improvements collectively show the effectiveness of our integrated framework: that improve different non-sequential classifiers used in activity recognition.
We have searched for other publicly available body sensory network data to further validate effectiveness of our
Task Method Subject 1 (S1) Subject 2 (S2) Subject 3 (S3)
AF NF AC AF NF AC AF NF AC
Ges
ture
HMM with 1NN 49.7 80.0 81.2 43.7 72.9 73.2 41.9 72.8 74.0 HMM with SVM 50.6 87.4 86.6 48.8 83.1 80.0 42.6 81.7 79.1
HMM with 1NN+SVM 49.9 79.8 81.1 43.7 72.9 73.2 41.9 72.8 74.0 CRF with 1NN 46.3 82.5 82.5 42.4 79.0 78.0 47.8 82.8 82.4 CRF with SVM 53.5 89.1 88.0 54.6 85.4 82.5 44.4 86.5 83.4
CRF with 1NN+SVM 52.4 85.4 85.1 54.7 82.8 81.3 48.0 86.8 85.1 Smooth. with 1NN 51.5 84.0 84.5 51.4 79.0 80.4 50.4 83.1 84.2 Smooth. with SVM 55.2 87.1 88.2 55.2 79.5 82.6 46.3 81.3 84.1 Integr. Framework 55.6 86.0 86.8 57.7 79.7 82.7 54.1 84.5 86.8
Seg
men
tati
on
HMM with 1NN 78.9 85.4 85.8 74.8 80.6 80.7 80.4 85.5 85.6 HMM with SVM 80.5 86.9 87.2 75.9 83.5 82.9 83.3 89.1 88.7
HMM with 1NN+SVM 78.9 85.4 85.8 74.0 79.6 79.7 80.4 85.5 85.6 CRF with 1NN 62.0 80.2 78.8 55.6 81.8 76.2 62.2 80.7 77.7 CRF with SVM 65.5 82.7 81.1 57.0 80.8 76.0 79.7 85.1 85.1
CRF with 1NN+SVM 63.1 81.7 80.0 55.0 80.7 75.1 80.0 86.5 86.1 Smooth. with 1NN 79.5 86.9 86.8 76.0 82.4 83.0 81.5 86.8 87.1 Smooth. with SVM 80.4 87.6 87.6 75.1 82.1 83.0 83.5 88.5 89.2 Integr. Framework 81.0 87.9 87.7 75.9 82.7 83.7 84.3 89.1 89.7
Loc
omot
ion
HMM with 1NN 92.7 91.3 91.2 92.3 91.0 90.9 90.3 89.4 89.4 HMM with SVM 94.8 93.5 93.6 86.3 89.3 89.5 89.9 87.6 87.9
HMM with 1NN+SVM 92.7 91.3 91.2 92.3 91.0 90.9 90.3 89.4 89.4 CRF with 1NN 93.6 92.3 92.3 92.6 91.4 91.3 91.5 90.6 90.6 CRF with SVM 95.0 93.7 93.8 87.0 90.0 90.1 89.9 87.5 87.8
CRF with 1NN+SVM 94.9 93.7 93.7 93.5 91.9 92.0 91.0 89.2 89.4 Smooth. with 1NN 93.8 92.6 92.7 93.5 92.6 92.7 91.7 90.8 90.8 Smooth. with SVM 95.4 94.5 94.5 86.9 90.1 90.0 90.8 89.3 89.1 Integr. Framework 95.4 94.5 94.5 88.6 91.7 91.7 92.0 90.9 90.8
Table 3. Comparison of Our Proposed Smoothing with HMM/CRF Meta Learners
integrated framework. However, several datasets we found, e.g. those in [31], either contain a few sensor dimensions or are mostly environmental sensors with discrete symbolic readings. In view of the growing prospect of large-dimensional body sensor network, our future work would involve sourcing new datasets or data collection for comprehensive study in the modeling of human activities.
REFERENCES 1. Bao, L., Intille, S.S.: Activity Recognition from User-Annotated Acceleration Data. In: Pervasive Computing, LNCS 3001, 1-17, (2004) 2. Krishnan, N.C., Colbry, et al.: Real Time Human Activity Recognition using Tri-Axial Accelerometers. In: Sensors Signals and Info. Processing Workshop, (2008) 3. Long, X., Yin, B., Aarts, R.M.: Single-Accelerometer-based Daily Physical Activity Classification. In: IEEE Eng. Med. Biol. Soc., 1, 6107-10, (2009) 4. Lee, S.W., Mase, K.: Activity and Location Recognition Using Wearable Sensors. In: IEEE Pervasive Computing, 1(3), 24-32, (2002) 5. Lester, J., Choudhury, T., et al.: A Hybrid Discriminative/Generative Approach for Modeling Human Activities. In: IJCAI’05, 766-772, (2005) 6. Maurer, U., Smailagic, A., et al.: Activity Recognition and Monitoring using Multiple Sensors on Different Body Positions. In: BSN '06, 113-116, (2006) 7. Helmi, M., Almodarresi, S.M.T.: Human Activity Recognition using a Fuzzy Inference System. In: IEEE Int. Conf. on Fuzzy Systems, 1897-1902, (2009) 8. Huynh, T., Fritz, M., Schiele, B.: Discovery of Activity Patterns using Topic Models. In: UbiComp '08, 10-19, (2008) 9. Li, F., Dustdar, S.: Incorporating Unsupervised Learning in Activity Recognition. In: AAAI Workshops at the 25th AAAI Conference on Artificial Intelligence, (2011) 10. Longstaff, B., Reddy, S., Estrin, D.: Improving Activity Classification for Health Applications on Mobile Devices using Active and Semi-Supervised Learning. In: PervasiveHealth'10, 1-7, (2010) 11. Nguyen, M.N., Li X.-L., Ng, S.-K.: Positive Unlabeled Learning for Time Series Classification. In: IJCAI’11, 1421-1426, (2011). 12. Preece, S.J., Goulermas, J.Y., et al.: Activity Identification using Body-Mounted Sensors: a Review of Classification Techniques, Physiological Measurement, 30(4), R1-R33, (2009) 13. Van Kasteren, T., Noulas, A., Englebienne, G., Krose, B.: Accurate Activity Recognition in a Home Setting. In: UbiComp'08, 1-9, (2008) 14. Sagha, H., Digumarti, S.T., et al.: Benchmarking Classification Techniques using the Opportunity Human Activity Dataset. In: IEEE Int. Conf. on Systems, Man, and Cybernetics (2011)
15. Roggen, D., Calatroni, A., et al.: Collecting Complex Activity Datasets in Highly Rich Networked Sensor Environments. In: Seventh Int. INSS'10, 233-240, (2010) 16. Farin, G.: Curves and Surfaces for Computer Aided Geometric Design: A Practical Guild. 4th ed, Academic, New York, (1996) 17. Sagha, H., Millan, J.R., et al. A Probabilistic Approach to Handel Missing Data for Multi-Sensory Activity Recognition. In: Workshop on Context Awareness and Information Processing in Opportunistic Ubiquitous Systems at Ubicomp’10, (2010) 18. Albinali, F., Davies, N. and Friday, A. Structural Learning of Activities from Sparse Datasets. In: PerCom’07, 221-228, (2007) 19. Junker, H., Amft, O., et al.: Gesture Spotting with Body-Worn Inertial Sensors to Detect User Activities. vol. 41(6), 2010-2024, (2008) 20. Stager, M, Lukowicz, P. and Troster, G. Dealing with Class Skew in Context Recognition, Proc. ICDCSW’06, pp. 58-63, (2006) 21. Chiewchanwattana S. and Lursinsap, C.: FI-GEM Networks for Incomplete Time-Series Prediction. Proc. IJCNN’02, pp. 1757 – 1762, (2002) 22. Oliver, N., Horvitz, E. and Garg A.: Layered Representations for Human Activity Recognition. Proc. Int. Conf. on Multimedia Interfaces, (2002) 23. Cao, H., Li, X.-L., et al.: SPO: Structure Preserving Oversampling for Imbalanced Time Series Classification. In: Proc. IEEE Int. Conf. on Data Mining, (2011) 24. Chawla, N.V., Bowyer, K.W., et al.: SMOTE: Synthetic Minority Over-Sampling Technique. J. Artificial Intelligence, 16, 321-357, (2002) 25. Jiang, X., Mandal, B., Kot, A.C.: Eigenfeature Regularization and Extraction in Face Recognition. IEEE Trans. on Pattern Analysis and Machine Intelligence, 30(3), 383-394, (2008) 26. Tomek, I.: Two Modifications of CNN. IEEE Trans. System, Man, Cybernetics, 6(11), 769-772, (1976) 27. Hsu, C.-W., Chang C.-C., Lin, C.-J.: A Practical Guide to Support Vector Classification, (2008) 28. Keogh E., Kasetty, S.: On the Need for Time Series Data Mining Benchmarks: A Survey and Empirical Demonstration. Data Mining and Knowledge Discovery, 7(4), 349-371, (2003) 29. Lafferty, J., McCallum, A., Pereira, F.: Conditional Random Fields: Probabilistic Models for Segmenting and Labeling Sequence Data. In: ICML'01, 282–289, (2001) 30. Rabiner, L.: A Tutorial on Hidden Markov Models and Selected Applications in Speech Recognition. Proc. of IEEE. 77 (2), 257–286, (1989) 31. McCallum, A.: MALLET: A Machine Learning for Language Toolkit. (2002), http://mallet.cs.umass.edu 32. List of Activity Classification Datasets. Available at: http://ailab.wsu.edu/casas/datasets/index.html
Related Documents