Applied Physics Research; Vol. 4, No. 4; 2012 ISSN 1916-9639 E-ISSN 1916-9647 Published by Canadian Center of Science and Education 98 An Innovative Technique of Liquid Purity Analysis and Its Application to Analysis of Water Concentration in Alcohol-Water Mixtures and Studies on Change of Activation Energies of the Mixtures Dilip K. De 1,2 & A. B. Dikko 1 1 Department of Physics, Federal University of Technology, Yola, Adamawa State 2 Department of Physics, UNIJOS, JOS Plateau State, Nigeria Correspondence: Dilip K. De, Department of Physics, UNIJOS, JOS Plateau State, Nigeria. Tel: 234-805-089-0271, 234-816-158-7450. Email: [email protected], [email protected] Received: May 18, 2012 Accepted: June 20, 2012 Online Published: October 22, 2012 doi:10.5539/apr.v4n4p98 URL: http://dx.doi.org/10.5539/apr.v4n4p98 Abstract The activation energy of a liquid molecule and hence its viscosity coefficient changes with addition of contaminants to the original liquid. This forms the basis of a new technology for analysis of purity of the liquid. We discovered that concentration of certain contaminants such as water in alcohol or vice versa can be uniquely and accurately determined in a short time (about 10-15 minutes) using a simple and yet innovative technique that only requires measurement of time of flow of the impure liquid (say, water-alcohol mixture) and distilled water through a simple viscometer designed and constructed for this purpose. We find that the viscosity coefficient μ of alcohol increased almost linearly with water concentration at a rate that depends on the type of alcohol and water concentration. We determined the increase of activation energy of alcohol molecules with increase of water concentration. This increase also depends on type of alcohol. Our detailed investigation on alcohol-water mixtures for both ethyl and methyl alcohol along with discussion on possible future potential application of such a simple, yet very reliable inexpensive technique for liquid purity analysis is presented. A comparison is made of our present method with other methods on the accuracies, problems and reliability of impurity analysis. A part of the quantum theory of viscosity of liquid mixtures that is in the developmental stage in order to explain some of the observed properties is presented. Keywords: purity analysis, concentration, water-alcohol mixtures, activation energy, viscosity, reduced time ratio 1. Introduction In brewery industry often is required rapid and accurate analysis of water content in alcohol products. Precise estimation of concentration of water in alcohol products can be done within 30 minutes time using sophisticated techniques such as gas chromatography (GC) (Juvet, 1997), high pressure liquid chromatography (HPLC) (Dropsy, 1997) mass spectrometry (MS), spectrophotometry (UV) etc. These above techniques are capable of estimating impurity concentrations both in solid and solutions. However, all the techniques are highly expensive and require trained personals for proper estimation, apart from constant electric power supply. Such techniques are however very expensive and cannot be applied in a mass scale by common people whenever needed and more so, during shortage of electric power which is very common in many parts of Africa. Moreover, these sophisticated techniques require highly experienced technicians for precise estimation of the contaminants in liquids. The less sophisticated techniques that employ the variation of refractive index or surface tension (Adamson, 1990) with water concentration in alcohol don’t often yield very accurate result since the minimum in accuracy is usually not less than ±3.3%. Such techniques also can’t be applied in absence of electric power. The question then arises how can we find an inexpensive, simple yet very reliable, unique and yet quick method of determination of the concentration of water or any other liquid in alcohol, or in other words, a one component solute in a liquid solvent, in general. Is it possible to develop the technique such that it can be applied even when there is no electric power available? Obviously such a technique would be based on the strong dependence of a brought to you by CORE View metadata, citation and similar papers at core.ac.uk provided by Covenant University Repository

Welcome message from author
This document is posted to help you gain knowledge. Please leave a comment to let me know what you think about it! Share it to your friends and learn new things together.
Transcript
Applied Physics Research; Vol. 4, No. 4; 2012 ISSN 1916-9639 E-ISSN 1916-9647
Published by Canadian Center of Science and Education
98
An Innovative Technique of Liquid Purity Analysis and Its Application to Analysis of Water Concentration in Alcohol-Water
Mixtures and Studies on Change of Activation Energies of the Mixtures
Dilip K. De1,2 & A. B. Dikko1 1 Department of Physics, Federal University of Technology, Yola, Adamawa State 2 Department of Physics, UNIJOS, JOS Plateau State, Nigeria
Correspondence: Dilip K. De, Department of Physics, UNIJOS, JOS Plateau State, Nigeria. Tel: 234-805-089-0271, 234-816-158-7450. Email: [email protected], [email protected]
Received: May 18, 2012 Accepted: June 20, 2012 Online Published: October 22, 2012
doi:10.5539/apr.v4n4p98 URL: http://dx.doi.org/10.5539/apr.v4n4p98
Abstract
The activation energy of a liquid molecule and hence its viscosity coefficient changes with addition of contaminants to the original liquid. This forms the basis of a new technology for analysis of purity of the liquid. We discovered that concentration of certain contaminants such as water in alcohol or vice versa can be uniquely and accurately determined in a short time (about 10-15 minutes) using a simple and yet innovative technique that only requires measurement of time of flow of the impure liquid (say, water-alcohol mixture) and distilled water through a simple viscometer designed and constructed for this purpose. We find that the viscosity coefficient µ of alcohol increased almost linearly with water concentration at a rate that depends on the type of alcohol and water concentration. We determined the increase of activation energy of alcohol molecules with increase of water concentration. This increase also depends on type of alcohol. Our detailed investigation on alcohol-water mixtures for both ethyl and methyl alcohol along with discussion on possible future potential application of such a simple, yet very reliable inexpensive technique for liquid purity analysis is presented. A comparison is made of our present method with other methods on the accuracies, problems and reliability of impurity analysis. A part of the quantum theory of viscosity of liquid mixtures that is in the developmental stage in order to explain some of the observed properties is presented.
Keywords: purity analysis, concentration, water-alcohol mixtures, activation energy, viscosity, reduced time ratio
1. Introduction
In brewery industry often is required rapid and accurate analysis of water content in alcohol products. Precise estimation of concentration of water in alcohol products can be done within 30 minutes time using sophisticated techniques such as gas chromatography (GC) (Juvet, 1997), high pressure liquid chromatography (HPLC) (Dropsy, 1997) mass spectrometry (MS), spectrophotometry (UV) etc. These above techniques are capable of estimating impurity concentrations both in solid and solutions. However, all the techniques are highly expensive and require trained personals for proper estimation, apart from constant electric power supply.
Such techniques are however very expensive and cannot be applied in a mass scale by common people whenever needed and more so, during shortage of electric power which is very common in many parts of Africa. Moreover, these sophisticated techniques require highly experienced technicians for precise estimation of the contaminants in liquids. The less sophisticated techniques that employ the variation of refractive index or surface tension (Adamson, 1990) with water concentration in alcohol don’t often yield very accurate result since the minimum in accuracy is usually not less than ±3.3%. Such techniques also can’t be applied in absence of electric power. The question then arises how can we find an inexpensive, simple yet very reliable, unique and yet quick method of determination of the concentration of water or any other liquid in alcohol, or in other words, a one component solute in a liquid solvent, in general. Is it possible to develop the technique such that it can be applied even when there is no electric power available? Obviously such a technique would be based on the strong dependence of a
brought to you by COREView metadata, citation and similar papers at core.ac.uk
provided by Covenant University Repository

www.ccsenet.org/apr Applied Physics Research Vol. 4, No. 4; 2012
99
measurable physical property of the solution on the type and concentration of its component liquids or the solutes in the solvent. Our intensive investigation confirms that viscosity is such a property and we can uniquely employ the variation of viscosity coefficient and also density (in some cases) of a solution with its compositions to determine the unknown concentration of its components. Alkali et al. (2003) studied the rheological characteristics of canarium oil using Brookfield viscometer. They found that the viscosity of canarium oil decreased with increase in both shear rate and temperature. Satimehin et al. (2003) used the rotational viscometer and studied the rheological behaviour of palm oil. They found that a reduction in viscosity of palm oil occurred as shear rate increased and the consistency index decreased exponentially with temperature. For analysis of liquid mixtures whose viscosity is not as high as palm oil or canarium oil, one does not need to use the rotational method. In the later method the shear rate influences the viscosity and may complicate the analysis of impurity concentration and types.
Below, we first describe the design, construction and theory of a simple flow-type viscometer (where the shear rate is low), which can be readily fabricated in any laboratory of Nigeria and its application how to determine a one-component adulterant in a solvent. Our main focus in this paper will be its application to determine water concentration in ethyl and methyl alcohol and development of techniques to easily distinguish between the two types, when unknown. We also focus on the variation of activation energy of alcohol molecules as water molecules are added and the possible contribution of such studies to the development of liquid physics, which unlike solid state physics, is not in a mature stage yet. In this paper we try to present a part of the theory of the liquid mixture that is in progress.
2. Theory
2.1 Basic Physics and Underlying Assumptions of the New Technique
Like that of a crystalline solid, the molecules of a liquid execute thermal vibrations about the equilibrium position with frequency, vo = 1/τo. At an average time tav >> τo, this position of equilibrium is displaced by a distance, δ, which is of the order of magnitude of the average distance, dav, between the molecules given by dav = (M/NАρ)1/3, where M, ρ and tav are the molar mass, the density of the liquid and the relaxation time of the liquid molecule. We should note that in the absence of any external force the displacement of the liquid molecule occurs in random directions and is related to the average thermal velocity. The action of an external force (pressure) with time period T far greater than tav enables the molecules to overcome the barrier (Ea) in the form jumps (Yavorsky & Detlaf, 1980) that occur at intervals of tav. The result is a stream of particles flowing in a preferred direction, which is the same as that of the applied force, and thus giving rise to fluidity, a measure of which is 1/µ(µ = viscosity coefficient). If the applied force is just enough to enable the molecules overcome the said barrier (which is the same as the activation energy, Ea) we get a streamline flow (without acceleration) that is governed by Poisseulis equation (Sinha & Das Sarma, 1969; Smith, 1972). The activation energy (Yavorsky & Detlaf, 1980; Rakshit, 1997) results from the bonds between the molecules and the adjacent particles. With this idea the corresponding fluidity is then proportional to the jump frequency which is proportional to exp (-Ea/kBT). Thermal vibration will try to randomize this streamline flow and thus giving another factor 1/T to streamline fluidity. Thus 1/µ, is proportional to exp(-Ea/kBT)/T and thus
µ = ATexp(Ea/KBT) (1)
Where A is a constant.
The activation energy, Ea of the original pure liquid should change when a solute molecule is added to it since the addition may change the bond strength of the given molecule as the impurity molecules tend to occupy the neighbouring positions. The change Equation (1) µ is expected to be affected significantly by addition of impurity molecules and thus the time of flow of the mixture through a capillary tube. This time of flow can be measured very accurately and hence the type and concentration of the contaminant. This forms the scientific basis of developing the present new technique of analyzing contamination in a liquid by measuring the time flow the impure liquid.
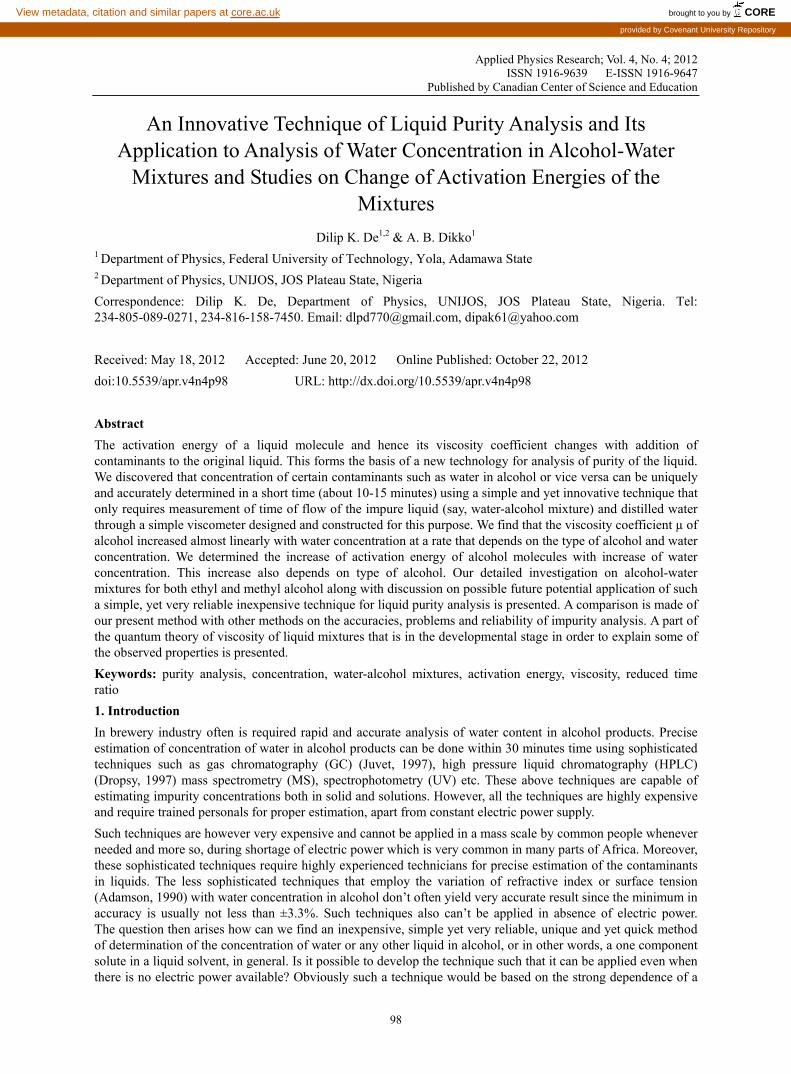
3. Viscometer Design and Construction
The simple design of the viscometer is shown in Figure 1. EFGH is a uniform vertical glass tube of diameter 4.7 cm and length 8 cm. At the two ends are attached two narrow tubes (ID~7mm). There are horizontal fixed marks C and D on these tubes. At the bottom end of the lower tube is attached a uniform capillary tube of length, L = 30.8 cm. The internal radius, r of the very uniform LASER drilled capillary brass tube, KI, is 0.6 mm (obtained from SMALL PARTS INC. PO BOX 4650, MIAMI LAKES, FLORIDA 33014-0650, USA) where as the outer radius is 1.0 mm. While EFGH is held vertical, the capillary tube is enclosed in a larger tube and fixed as
www.ccsenet.org/apr Applied Physics Research Vol. 4, No. 4; 2012
100
horizontally as possible. The glass tube and the attached capillary tube are mounted on a right angled solid wooden frame (Figure 1) fitted with levelling-screws and level-indicators. The latter arrangement ensures constant vertical alignment of the apparatus during different runs of experiments. The whole glass tube is filled with the liquid solution under investigation. As the upper tube is held vertically fixed, the solution descends and flows through the capillary tube and drops in a beaker. The time, t required by the liquid to descend from mark C to D is noted with the help of a stopwatch. The diameter of the capillary should be chosen such that turbulence flow is avoided.
Figure 1. A simple viscometer with a highly uniform brass capillary tube (LASER drawn) that was used to measure the viscosities of alcohol-water mixture reported in this paper
3.1 Viscometer Theory
It is shown earlier (De & Sheikh, 2002) that the time taken by the liquid level to descend from mark C to D in Figure 1 is given by
t = Kµ/ρ (2)
Where
K = (alnH1/H2 + blnH3/H4)8L/πgr4 (3)
In equation (3) H1, H2, H3 and H4 are the heights of the liquid levels as indicated in Figure 1. A, a and b are cross sections of tubes EFGH, MC and KL. For inclination of the upper tube axis at an angle θ with the vertical, g in above equation should be replaced by gcosθ (assuming that the capillary still remains horizontal). As long as the vertical inclination of the apparatus (Figure 1) is held constant for different sets of experiments conducted at a given place, K remains constant. With the same vertical inclination of the apparatus and at the same place (i.e, constant g), let t2 and t1 be the respective times for the solution (index 2) under investigation and pure water (index 1) at a given temperature, T to descend from mark C to mark D (Figure 1). Then from Equation (2) we get
µ2 = µ1ρ2t2/ρ1t1 (4)
The density ρ2 can be easily determined using a desity meter. ρ1 at the given temperature can be easily known from a handbook of physical constant. Then using the simple relation (4) µ2 can be determined. For most purposes ρ1 can be taken as 1 kg/liter. The accuracy of determining µ2 from equation (4) then depends on the accuracy of noting the time t1 and t2 and the accuracy of knowing µ1. The above theory also works perfectly with

www.ccsenet.org/apr Applied Physics Research Vol. 4, No. 4; 2012
101
Oswald (Sinha & Das Sharma, 1969; Smith, 1972) viscometer. For manual observation, the inaccuracy in noting time t1 and t2 can be easily kept within ± 2 sec. or lower. However, if automatic electronic watch is employed (which will be focus of our next study), the maximum inaccuracy of noting the time can be limited to ± 0.01 sec, or even lower. This can then greatly enhance the accuracy of determination of µ for the unknown solution whose solute concentrations are to be determined. From Equation (4) we see that
t2/t1= µ2 ρ1/µ1ρ2 (5)
Note that the quantities on the right side Equation (5) depend only on the physical property of the solution and that of pure water under investigation, where as both t2 and t1 depend also on the apparatus (i.e on L, g,a,A,b, LnH1/H2 etc). Thus the ratiot2/t1(when precise vertical inclination is maintained throughout the experiments at constant temperature T) is a unique signature of the nature and concentration of the solute in the particular solvent and independent of the physical dimensions of the apparatus used and the place where the experiment is carried out.
4. Experiments
The apparatus described in (De and Sheikh 2002) was also used for the present investigations of two different types of mixtures of ethyl alcohol and methyl alcohol (BDH grades) with distilled water at different concentration (% by volume). The densities were determined by measuring the mass (M) of a given volume (V) of the mixture and using the relation, ρ = M/V. Time t required for the liquid to descend from Mark C to D (Figure 1) was measured by a stop-watch with accuracy of ±1 s. The results of measurements are discussed below.
5. Results: Determination of Water Concentration in Alcohol and Vice Versa
To apply the above theory for determination of unknown water concentration in an alcohol sample we prepared different alcohol solutions containing different amounts of water in a fixed volume (300 c.c) of ethyl or methyl alcohol as shown Tables 1 and 2. These are reference solutions. The densities of all the liquid mixtures and pure liquids were experimentally determined using the simple relation ρ = M/V and given in the Tables 1 & 2. Three readings for the time of flow, t2 were recorded that agreed very closely (within ±2 sec) for pure methyl alcohol, pure ethyl alcohol, pure water (distilled) as well as for each of the water-alcohol mixtures of Tables 1 & 2. The average of these three readings are given in Tables 3 and 4 for different water concentration, Cw(%) = Vw/Val) x 100. For pure water the average of three such readings was recorded to be t1 = 1544 ± 1 second. The temperature during the experiments was recorded to vary from 34 to 36oC. The variation of t2/t1 with Cw for both ethyl and methyl alcohol thus determined is given in Figure 2. This calibration curve is independent of the place and the apparatus used. It depends only on the physical property of the solution mixtures. The average temperature for Figure 2 and for computations (see discussion) is taken to be 35oC. To determine the viscosity coefficient of a given liquid using Equation (4) we need the absolute value of µ1 of water at 35oC. The values of µ1 at several temperatures are known (Rakshit 1997) and are given in Table 5. By using PLOTIT program of MS Office 2000, the interpolated value of µ1 at 35oC is found to be 7.3 millipoise (1 millipoise = 10-4kgm-1s-1 (10 poise = 1 Pa.s. = 1 kgm-1s-1) (Cutnell & Johnson, 1995). Using this value of µ1, ρ2 from Tables 1 & 2 and t2/t1 from Tables 3 and 4, the viscosity coefficient µ2 of the water alcohol mixtures are then calculated using equation (4) and the values are also given in Tables 3 & 4 for various Cw. With the maximum inaccuracy in time measurements around ± 1 sec, the typical inaccuracy in t2/t1 can be easily kept around ± 7.5 x 10⁻⁴. As seen from Tables 3 and 4 the observed change in time of flow with water concentration has been found to be quite appreciable for both ethyl and methyl alcohol.
This observation justifies the assumptions made in the theory section that the viscosity coefficient of a liquid should sensitively depend on the type and concentration of the solute. We find that in methyl alcohol-water solution the flow time increases from 1268 to 1380 as Cw increases from 0 to 50%. Whereas for ethyl alcohol-water solution, the corresponding increase in time of flow is from 2107 sec to 2403 sec. Thus viscosity method allows un-parallel advantage over other methods in distinguishing between ethyl and methyl alcohol.
www.ccsenet.org/apr Applied Physics Research Vol. 4, No. 4; 2012
102
Table 1. Densities of the standard mixtures of ethyl alcohol (C2H3OH) and water prepared for the data in Table 3
Vol. Va of pure
Alcohol or kg/m3
Vol. Vw of water
added (cc) Vol. Vm of the mixture(cc)
Conc. of C2H3OH
in the mixture Density of (%)gm/cc
(cc) ± 0.5 ± 0.5 ± 0.5 Cw=(Vw/Va)x100 ± 0.004
300.0 0 300.0 0 0.882
300.0 15.0 315.0 5 0.888
300.0 30.0 330.0 10 0.892
300.0 45.0 345.0 15.0 0.897
300.0 60.0 360.0 20 0.902
300.0 75.0 375.0 25 0.906
300.0 90.0 390.0 30 0.909
300.0 105.0 405.0 35 0.913
300.0 120.0 420.0 40 0.916
300.0 135.0 435.0 45 0.919
300.0 150.0 450.0 50 0.921
*For all the prepared mixtures the density is measured as usual.
Table 2. Densities of the standard mixtures of methyl alcohol (CH3OH) and water mixture prepared for the data in Table 4
Vol. Va of pure
Alcohol or kg/m3
Vol. Vw of water
added (cc) Vol. Vm of the mixture
C2H3OH
in the mixture Density of (%)gm/cc
(cc) ± 0.5 ± 0.5 ± 0.5 Cw=(Vw/Va)x100 ± 0.005
300.0 0 300.0 0 0.724
300.0 15.0 315.0 5 0.737
300.0 30.0 330.0 10 0.749
300.0 45.0 345.0 15 0.760
300.0 60.0 360.0 20 0.770
300.0 75.0 375.0 25 0.779
300.0 90.0 390.0 30 0.788
300.0 105.0 405.0 35 0.796
300.0 120.0 420.0 40 0.803
300.0 135.0 435.0 45 0.810
300.0 150.0 450.0 50 0.818 *For all the prepared mixtures the density is measured as usual using the relation d = M/V.

www.ccsenet.org/apr Applied Physics Research Vol. 4, No. 4; 2012
103
Table 3. Time of flow, reduced time ratio, viscosity coefficient and activation energy of the ethyl alcohol and water mixture at 35 oC
Cw=Vw/Va(%) t2 ±1 sec
t2/t1 ±0.001
µexp ±0.01
(millipoise)
∆Ea ±0.02 (mev)
µtheo ±0.01
∆µ = µexp - µtheo
(millipoise) (millipoise) +0.02
0 2107 1.364 8.79
5 2180 1.412 9.15 1.07 8.92 0.23
10 2203 1.427 9.29 1.47 8.85 0.45
15 2228 1.443 9.45 1.92 8.78 0.67
20 2253 1.459 9.61 2.37 8.72 0.89
25 2278 1.475 9.76 2.78 8.67 1.08
30 2302 1.491 9.89 3.13 8.62 1.23
35 2328 1.508 10.05 3.56 8.57 1.47
40 2354 1.525 10.19 3.93 8.53 1.66
45 2378 1.540 10.33 4.29 8.49 1.84
50 2403 1.556 10.46 4.62 8.45 2.02
Water only 1544
Table 4. Time of flow, reduced time ratio, viscosity coefficient and activation energy of the methyl alcohol water mixture at 35 oC
Cw=Vw/Va(%) ±1 sec
t2 ±0.001
t2/t1 ±0.01
µexp ±0.02
(millipoise)
∆Ea
±0.01
(mev)
µtheo
(millipoise)
∆µ = µexp - µtheo
(millipoise)
0 1268 0.821 4.92 4.92
5 1281 0.830 5.03 0.59 5.24 -0.21
10 1293 0.837 5.12 1.06 5.48 -0.36
15 1304 0.844 5.20 1.47 5.68 -0.48
20 1315 0.851 5.29 2.86 5.83 -0.54
25 1325 0.858 5.37 2.32 5.96 -0.59
30 1336 0.865 5.46 2.77 6.07 -0.61
35 1346 0.872 5.55 3.20 6.16 -0.61
40 1357 0.879 5.64 3.63 6.24 -0.60
45 1369 0.887 5.74 4.09 6.31 -0.57
50 1380 0.894 5.83 4.51 6.37 -0.54
Water only 1544 1.00 7.30
6. Discussion
6.1 Technological Aspect
If we are given an unknown alcohol sample how do we find out whether it contains water and if it does, in what concentration? If we have a simple viscometer as described above, we can readily answer these questions. Let us see how we accomplish this.
First we determine t2 for the sample mixture with unknown water concentration and t1 for pure distilled water employing the procedure described above and then take the ratio t2/t1. Let us assume that the type of the alcohol is known, say ethyl alcohol. Then looking at the calibration curve (Figure 2) we see that when the concentration,

www.ccsenet.org/apr Applied Physics Research Vol. 4, No. 4; 2012
104
Cw of water in methyl alcohol changes from 0% to 50% the reduced time ratio t2/t1 changes from 0.821 to 0.894 ± 0.001 (see also Table 4). It can be seen from Table 3 that t2/t1 the corresponding changes for ethyl alcohol are from 1.364 to 1.556. Thus the present technique provides an easy way of differentiating between ethyl and methyl alcohol (without water). The t2/t1 of the sample with unknown water concentration can then be placed on the Figure 2 corresponding to the type of alcohol, to give us the concentration of water. In case where the type of alcohol is not precisely known, one can carry out the measurement of density of the sample mixture. Then using Tables 1-4 one can easily determine both the type of alcohol and the water concentration precisely. Ideally the technique can be applied to any type of alcohol. It can be seen from Tables 3 and 4 that for increase of water concentration by 5% , average variation in t2/t1 is about 0.007 for methyl alcohol and 0.015 for ethyl alcohol (at 35oC) (Tables 3 and 4). These observed characteristics may also be utilized to determine the type of alcohol and the water concentration, Cw simultaneously when a density measurement cannot be carried out precisely. For this, one needs to measure t2/t1 for the unknown sample as well as for the sample with addition of 15 ml water in 300 ml of the sample and compare the thus observed change in t2/t1 with the above observations.
6.2. Uncertainties and Effect of Temperature Variations
The total uncertainty in Cw thus determined consists of the following parts: (i) due to uncertainty in t2/t1; (ii) due to uncertainty in the Cw used in the calibration curve (Figure 2); (iii) due to variation in temperature from that of the calibration curve. Let us address these three sources of errors. As mentioned above, for manual observation, the uncertainty in t2/t1 is around 7.5 x 10⁻⁴. Figure 2 shows that a change of Cw from 0% to 50%, causes a change of t2/t1 from 0.821 to 0.894 in methyl alcohol whereas Figure 2 shows a change of t2/t1 from 1.364 to 1.556 in ethyl alcohol. Therefore, one can easily see that the average uncertainly in Cw due to factor (i) is 0.2% in ethyl alcohol and 0.5% in methyl alcohol, the uncertainty in the measured volume is ± 0.5cc. This leads to uncertainty in Cw ~ 0.17%. Thus the total uncertainty in the unknown Cw that can result by using the Tables 3 and 4 or Figure 2 is roughly around 0.67% for methyl alcohol and 0.37% for ethyl alcohol respectively. On the other hand if one employs the variation of density, from Tables 1 and 2 one can easily see the minimum errors in determination of Cw are 5.6% for methyl alcohol + water mixture and 2.3% for ethyl alcohol + water mixture. Thus the measurement of time of flow through a capillary tube will yield much higher accuracy in estimation of alcohol concentration over density measurement.
Viscosity of alcohols are quite sensitive to temperature variations (Grubbs; Zeberg-Mikkelsen, Watson, Baylaucq, Galliero, & Boned, 2005). The application of the method for estimation of water concentration in alcohol when the temperature is different from 35 oC is discussed below. The change of activation energy of the alcohol molecules with addition of water is positive (Tables 3 and 4) for both ethyl alcohol and methyl alcohol. Even though they are of nearly equal magnitudes, the actual activation energy of ethyl alcohol is higher than that of methyl alcohol and hence of the corresponding mixtures with water. Determination of the actual activation energy is possible with measurements at different temperatures by small increments.
6.2.1 Possibility of Further Improvement on the Accuracy of Determination of Cw and Scope of the New Technique
In future the above uncertainty can be further improved as follows: If automatic optical time counting with digital watch (with accuracy up to a hundredth of a second) is employed and a larger size of the tube (with volume ~ 700 c.c) then the uncertainty in t2/t1 can be improved at least to 5x10⁻⁶. This can lead to improvement of accuracy in Cw due to factor (i) of section 5.1 above, to better than + 0.003% (or 3 parts in 105). The calibration curve (Figure 2) can be further improved by measuring the volume of water and alcohol (before mixing for calibration purpose) with accuracy of at least ± 0.1 c.c. Then the accuracy in Cw (of the reference solutions for Figure 2) can be easily improved to at least ± 0.01%. Then the average total inaccuracy due to the factors (i) and (ii) of section 5.1 can be kept around ± 0.013% (i.e 13 parts in 105). The major inaccuracy thus stems from the measurement of concentration of standard solutions and using the calibration curve. The improvement of the technique to such accuracy level or higher is out next goal and will be reported later. The application of this technique can be extended to analysis of virtually any soluble impurity in a solvent as long as the resulting solution does not chemically react with the material of the capillary and the tubes (Figure 1). Ability to determine Cw of water in alcohol and vice versa with such an accuracy and in a short time (~15 minutes) makes this new technique very attractive for commercial and domestic use. The method is non-destructive.
The accuracy can however depend on the variation of temperature, T during the course of measurements. In the ideal situation, the data in Tables 3 and 4 and Figure 2 should be collected at constant temperature. In our calibration measurements the temperature variation was within ± 1oC. Since t2/t1 is equal to µ2ρ1/µ1ρ2 (see Equation 5), the small variation of temperature may influence both numerator and denominator in the same way

www.ccsenet.org/apr Applied Physics Research Vol. 4, No. 4; 2012
105
and the net effect on the ratio of this small µ2ρ1/µ1ρ2 of this small variation in T may not be significant. See below (section 5.3) for further discussion on this aspect.
From our discussion above and Tables 3 and 4 we see that as water concentration is increased from 0%, the viscosity coefficient, µ of the resulting alcohol-water mixture increases from that of alcohol. Let us try to understand this from the physics point of view. In our temperature T was constant within ±1 oC. Therefore, the observed increase in µ of alcohol with water concentration can be attributed to the increase in Ea (see Equation 1 and section 2.1) from that of pure alcohol, since water molecules can influence the bond between the alcohol molecules. This influence will in turn depend on how water molecules arrange themselves among the alcohol molecules and obviously on water concentration. Though from our limited present studies we are unable to throw light on the latter aspect, we definitely can deduce the increase in Ea of alcohol molecules as more and more water are added to alcohol. Using Equation (1) and the µ values from Tables 3 and 4, the increase in Ea is deduced as a function of Cw and are given in the same Tables also.
So far, we have not discussed the effect of temperature on the determination of unknown Cw of a water-alcohol mixture using the calibration curve of Figure 2 which corresponds to temperature 35oC; or, in other words can the same Figure 2 be used to determine unknown Cw when the ambient temperature differs from 35oC? Let us see how we can address this issue. Since the ambient temperature does not usually exceed 50oC, Equation 1 may still be used to obtain µ at any other temperature, T. Using this equation one can easily show that, for small variation of T (around the calibration temperature Tcal) which may not affect activation energy, Ea of the liquids and that of pure water appreciably,
(µ2/µ1)T = (µ2/µ1)calexp(Tcal/T) (6)
and by using Equation (5)
(ρ2t2/ρ1t1)T = (ρ2t2/ρ1t1)calexp(Tcal/T) (7)
Where not too high accuracy is required and T differs from Tcal by only a few degrees,
(ρ2/ρ1)T may be reasonably assumed to be equal to (ρ2/ρ1)cal since the density of a liquid does
not change significantly with small change of temperature. Then from equation (7) we get
(t2/t1)T = (t2/t1)calexp(Tcal/T) (8)
Thus from Equation (8) one can easily determine (t2/t1)cal (that will correspond to the calibration curve of Figure 2), by finding out (t2/t1)T experimentally and thus the unknown Cw).
Where high accuracy is required, the quantity (ρ2/ρ1)T/((ρ2/ρ1)cal, which is very close to unity, may need to be evaluated accurately, with the help of a very sensitive density-meter at different temperatures. It may be mentioned that for T = 40oC and Cal = 35oC, calculation using the thermal expansion coefficients (Cutnell & Johnson, 1995) yields the value of ((ρ2/ρ1)T/(ρ2/ρ1)cal = 0.9948 for methyl alcohol, which can be taken to be close to unity when very high accuracy is not required. Further experiments are necessary to establish a real deviation, if any, from that of equations (7) and (8) within the range of ambient temperatures. This will enable us to determine strategy for this technique to be applied as an analytical tool in laboratory as well as in brewery industry. This new inexpensive technique has the following superior advantages over other techniques employing variation of a) refractive index η and b) surface tension γ with concentration of one component adulterants. Within accuracy of +0.00002 the refractive index (Hall & Payne, 1922) of water at 300C is 1.33192 and that of ethyl alcohol is 1.35639. Assuming linear variation with alcohol concentration the highest accuracy in alcohol content measurement is then +0.08%. Using a high-precision, non-contact laser based technique to measure very accurately the refractive index, it has been shown that the concentration of alcohol can be determined with accuracy (Longtin & Fan, 1998) of 0.01%. This requires accuracy in refractive index measurement of +0.000002 or less. Equipment making such precision measurement of refractive index is much more expensive than the current proposed technique of using viscosity method. The other problem with refractive index method is control of wavelength and temperature. There is no defined theory of variation of η with T and hence the standard curves have to be constructed at many temperatures within the possible range of variation of temperature (at a given wavelength of light) unlike the present technique. The case of surface tension technique has been discussed at length in later section on “Comparison with other techniques”.

www.ccsenet.org/apr Applied Physics Research Vol. 4, No. 4; 2012
106
Figure 2. Plot of t2/t1 vs concentration (Cw %vol) of water in methyl and ethyl alcohol
7. Theoretical Analysis of Viscosity Coefficient of Liquid Mixtures
In this paper we assume a simple linear model according to which the viscosity coefficient, µT of a mixture of different liquids is given by
µT = ΣPiµi (9)
where µi is the viscosity coefficient of the liquid component i whose mole fraction in the mixture is Pi. Pi is related to Va and Vw of Tables 1 and 2 by the equation
Pa = (Vaρa/Ma)/(Vaρa/Ma + Vwρw/Mw) (10)
Where ρa and Ma etc are the density and molecular weight of the component. The experimentally determined, µexp will differ from µT of Equation (9) by
µexp = µT + ∆µ (11)
∆µ is a correction to Equation (9) arising out of association/interaction (that includes cluster formation, caging etc.) (Nagasawa, Naka-gawa, Nagafuji, Okada, Miyasaka 2003) among the molecules of different components of the liquid mixture. We may assume that the interaction between molecules is of a pair-wise nature and is accomplished by central forces having a potential U(r) and a radial distribution G(r). These two important parameters determine the equation of state of the liquid. If we assume the liquid to consist of spherically symmetric molecules the equation of state is given by the following Equation (2):
∞Pv/KBT = 1 – (2π/3vkBT)∫dU(r)G(r)r2 dr 0 dr (12)
Where P = pressure; v = average volume per particle of liquid.
In a pure liquid, Gi(r) may be written as
Gi(r) = PiΨi(r)Ψi(r)* (13)
Ψi is the quantum mechanical wave function of a molecule of the liquid type i at position r and the Scrodinger equation may be expressed as:
[-h2 2/8π2m + Ui(r)] Ψi(r) = EiΨi(r)
Ρi is expressed in average number of molecules of ith type per unit volume of the liquid mixture. In a liquid mixture,
G(r) = ρΨ(r)Ψ(r)* and U(r)= Σi Ui(r) + Σ(i ≠ j)Uij(r) (14)
Where Ψ(r) = Σi (Pi)½Ψi and ρ = ΣiρiPi (15)

www.ccsenet.org/apr Applied Physics Research Vol. 4, No. 4; 2012
107
Uij(r) is the potential at a point r arising out of interaction between molecules of liquid i and liquid j in the liquid mixture. The exponent ½ of Pi in the expression for Ψ(r) is based on the assumption that the probability of finding a molecule of the ith type liquid in a small volume ∆V of the liquid mixture about the position r should be proportional to Pi ∆V and not to any other power of Pi times ∆V. The average energy per particle can then be written as:
∞ E = 3kBT/2 + (π/v) ∫ U(r)G(r)r2 dr 0
(16)
Gi(r) depends on Pi of Equation (9). Ideally it is expected to have also an implicit dependence on temperature also, at least through the term Pi.
The activation energy Ea is embedded in the second term of the above Equation (16) for the average energy. Once Ea can be evaluated, the µ of the resulting liquid mixture and hence ∆µ can be evaluated from Equatons (1) and (9). This correction of ∆µ is obviously a function of Pi, true nature of which is not yet theoretically known but expected to be obtained from above equations and the detailed theoretical evaluation is left for future work.
From Tables 3 and 4 using the values of µ as 4.92 and 8.79 millipoiseb at 35 C, for pure methyl and ethyl alcohol (i.e for Cw = 0) we calculate µT for different values of Cw in Tables 3 and 4. These calculated values are also given in Tables 3 and 4 under the column µth. We also give the values of ∆µ from 0.23 to 2.2 Equation (11) in Tables 3 and 4. Such increase (known as excess property) though observed earlier (Yilmaz, 2002) has remained unexplained and it depends on temperature. For methyl alcohol, ∆µ decreases continuously from -0.21 to - 0.61 as Cw increases from 5% to 35% (Table 4) and thereafter it increases slightly with increase of Cw. It appears that water molecules influences the viscosities of ethyl and methyl alcohol differently. The negative values of ∆µ for methyl alcohol indicates that the alcohol molecules have the greater influence in the flow of the mixture than the water molecules. The detailed explanation for this very interesting observation from the molecular physics point of view is left for future work including the theoretical computation of ∆µ from above model. Once ∆µ can be understood theoretically (probably following the line of above ideas in Equations 9-16) then Equations (9)-(11) can form the basis of a new emerging technology of analyzing the concentration of the liquid components of any liquid mixture (which does not contain dissolved solid materials – the analysis of dissolved solid materials will be treated in another paper).
It may not be out of place to mention a few words about the temperature variation of Ea and hence µ of liquid/liquid mixture based on the present model even though detailed computations are yet to be made. From Equation (16) the temperature variation of Ea can be accounted for in the first order by considering the thermal expansion of the volume and consequently the thermal variation of G(r) through the density term ρ containing Pi (Equation 15). It may be mentioned that the thermal expansion coefficients (Cutnell & Jhonson, 1995) for methyl alcohol, ethyl alcohol and water are respectively: 1240, 1200 and 207 times 10-6. From above theory it is expected that –δEa/δT for ethyl alcohol would be about six times than that of water for considering the thermal expansion of the volume and consequently the thermal variation of G(r) through the term Pi. This conjecture yet remains to be validated by experiments on µ of water and alcohol at different temperatures at close intervals. One thing that is clear from the above model is that it can clearly account for the decrease of µ of liquid with temperature. Another dependence on temperature may also come from the Boltzman population of the different eigen energy levels E of Equation (13) in which case Ψi(r)Ψi(r)* in Equation (13) may be replaced as;
Ψi(r)Ψi(r)* = ΣnΨni(r)Ψni(r)*exp(-Eni/kBT). (17)
The above model together with Equation (1) should account for the viscosity coefficient of a liquid mixture when the knowledge of Ui(r) + ΣUij(r) would be available for the molecules of the liquid mixture. Detailed computation using above model would be presented separately.
8. Comparison of Methods of Estimation of Concentrations of Components of a Liquid Mixture: Accuracies, Problems and Reliability
In a liquid mixture we can consider the major component as the base and the other components as impurities whether present in trace or appreciable amounts. Apart from very sophisticated methods, such as GC, HPLC, MS etc. for estimations of concentrations of components of liquid mixture there are various other methods such as (i) spectroscopic method, (2) surface tension method, (3) conductivity method, (4) refractive index method and (5) the present viscosity method which can be employed for estimation of concentration. We discuss below briefly the principles of the four methods, minimum limits of detection, applicability, problem and reliability, cost

www.ccsenet.org/apr Applied Physics Research Vol. 4, No. 4; 2012
108
effectiveness etc. for the four methods (1 to 4) and compare them with the present method (5). The lower the minimum limit of detection of impurity concentration/amount, the higher is the accuracy of the detection technique.
8.1 Spectroscopic Methods in Pharmaceuticals
There is an ever increasing interest in proper estimation of impurities present in APIs (Active pharmaceutical ingredients). There are various methods of detecting and characterizing (both components and concentrations) the impurities such (Bari, Kadan, Jaiswal, & Shirkhedar, 2007): as TLC (Thin layer chromatography), HPLC (high pressure liquid chromatography), HPTLC (combination of HPLC and TLC), AAS (Atomic absorption spectroscopy), MS (Mass spectroscopy), NMR (Nuclear magnetic resonance), FTICR-MS (Fourier transform ion cyclotron mass spectroscopy), GC (gas chromatography) etc. A number of articles ( Bari et al. 2007 and Refs 8 – 10 there in) have stated guidelines and designated approaches for isolation and identification of process-related impurities in and degradation of pharmaceutical products, using MS, NMR, HPLC, Fourier transform Ion Cylotron Resonance Mass spectrometry, FTICR-MS and Tandem Mass spectrometry etc. Most of these techniques have capabilities of detecting impurities in ppm (parts per million) and some (e.g., GC) in ppb (parts per billions) ranges and thus are highly accurate and suitable for impurity estimations in pharmaceuticals where in majority cases detection of impurity below 0.05% is not necessary according to ICH (Internal conference on harmonization of Technical requirements for registration of pharmaceuticals for human consumption). This translates to 1 mg a day in drugs consumed by average patient. Most of these techniques require highly sophisticated equipment, experienced technologist and obviously constant presence of electric power. Application of such techniques in African countries is still at a premature stage, specially because of high cost and lack of trained man-power. The above techniques are capable of estimating impurity concentrations both in solid and solutions.
Many deaths (Hilton, Pellegrino, & Scheinkestel, 2008) and serious patients’ complications in hospitals result from wrong use of IV solutions, which may have the following: (1) contamination with bacteria; (2) wrong labelling of concentration of IV fluid; (3) contamination of the fluid with impurity. Since the viscosity method of estimating concentrations of known components as presented in this paper has the capability of estimating concentration of components easily within 0.05% (with a larger tube EFGH) with an optical time counting device (capable of measuring time accurately up to 100 ms), it should find application to estimation of impurity levels and concentrations of IV solutions.
There are other techniques which can have capability of accurate estimation of impurity concentration, specially, in solutions. Some of these techniques are: (1) Surface tension (γ) methods; (2) density (ρ) methods; (3) Electrical conductivity (σ) methods; (4)Viscosity (μ) methods; (5) refractive index(η) methods etc. The major advantages of these techniques over the above sophisticated techniques are (i) Lower cost of operation; (2) does not require highly trained man-power as the above techniques; (3) some of these techniques (1, 2, 4) can be applied without electric power. In each of these methods it is important to have calibration of the equipment to find out the measured changes in the properties of the standard solution with known concentration of the impurity added to it.
The minimum error δ(c) (which is the same as the minimum detectable impurity concentration) in the estimation of one component impurity concentration in an unknown solution can be obtained from the following equation
δ(c ) = + [Δ(c)α/ Δ(p) + β] (8.1)
Where Δ(p) = The absolute value of the measured change in the given property (e.g., , ρ,σ,η, or μ etc.) with a change(+) of concentration Δ(c) of the one component in the solution. α = absolute value of minimum error in the estimation of that given property. β = Absolute value of minimum error in the measurement of concentration of the impurity when preparing the standard solutions.
For good applicability of the above techniques in estimation of impurity concentration Δ(c) should be the maximum spread of concentration changes over which a maximum change Δ(p) in the physical property can occur. The methods reliability ranges are the range of Δ(c) beyond which Δ(p)/Δ(c) becomes quite small compared to a few times α/ β. If the standard solutions are prepared with one component impurity concentration estimated with high accuracy then, then β is small and the techniques can yield high accuracy in estimation of unknown concentration (i.e., very low δ(c )) if α can be kept small.
8.2 Surface Tensions Methods
This method is definitely less expensive than the above mentioned methods. It is suitable to estimate the concentrations of surfactants in water with high accuracy, especially on the surface. There are various methods of
www.ccsenet.org/apr Applied Physics Research Vol. 4, No. 4; 2012
109
measuring surface tension, each one having its limit of accuracy α.
8.2.1 Static method of Surface Tension:
1. Capillary rise – Accuracy in, + 0.5 mN/m
2. Sessile drop - Accuracy + 1.8 mN/m, not suitable for low surface tension[a1]
3. Pendant drop - Accuracy 4 to 5%
4. Drop weight
5. Maximum bubble pressure - +0.2 mN/m
6. Wilhelmy plate-
8.2.2 Dynamic methods
1. Capillary waves
2. Unstable jets
3. Du Nong ring (rapid)
4. Drop weight (fast)
5. Wilhelmy plate
6. Spinning drop
There are various reports of highest accuracy (i.e., minimum detectable surface tension) by the above methods. Sensa Dyne Instrument Division reports Tensiometer Accuracy of static surface tension measurement to +0.1 N/m. (http://www.sensadyne.com/tensiometer-accuracy-1) Actual measurements by researchers provide different reports of accuracy: (1) For example, Yao-Yuan Chang et al, (2011) reports accuracy of pendant drop method at 5% for high surface tension material like glass melts, while Wan, Wei, Chen and Gao (2009) report accuracy of pendant drop measurement at 4%. Ziesing (1953) reports accuracy of surface tension measurements of mercury by sessile drop method at 3 mN/m which is about 0.6%. All these accuracy depends on the sophistication of the optical system used in the measurement and the materials of investigation. No consistent measurements have been performed on variation of surface tension with multicomponent (three or more) solutions. Surface tension (Wan et al., 2009) of water and ethyl alcohol at room temperature (20 oC) are 73 and 22 mN/m. If we assume conservative values of accuracy at 1% then assuming a linear relation the average accuracy in estimation of water concentration in alcohol will be about 2% by surface tension method. This is definitely less than that offered by Viscosity method as seen in the present studies.
The spinning drop seems to offer higher accuracy (0.001 mN/m) but suitable only for measurement of low surface tension (2-10 mN/m) and not high. Thus it is not applicable for water-alcohol mixture. It is highly suitable for measurement of concentration of surfactants in water. Data collected from Das (2011) should yield a theoretical limit of accuracy (using Equation 1) of measurement of BHBC16 surfactant concentration in water at 1.2x10⁻⁷ mol/m3. However, no one has reported yet actual measurement of concentration with such high accuracy and such measurement is very sensitive to temperature variation, form of which has not been established theoretically. Such accuracy is not possible for non-surfactant materials.
A simple method for simultaneous measurements of surface tension ( and density (ρ) was discussed by Thirumiavukkarasu and Srinivasan (2003). The method consists of drawing two liquids (one standard (water, 1) and the other experimental liquid, 2) by suction through two vertical capillary tubes connected at the top by a common horizontal tube that is connected to a vertical suction tube. The two capillary tubes are dipped in two beakers containing the two liquids. The heights h1 and h2 of the liquids in the capillary tubes above the liquid surfaces in the beakers are related by the equation:
h1ρ1g - 2 1/r1 = h2ρ2g - 2 2/r2 (8.2)
or, h2 = h1ρ1/ ρ2 + (2 2/r2 - 2 1/r1)/ρ2g (8.3)
The suction by different amounts varies both h1 and h2 simultaneously in accordance with the relation (8.3). Plot of h2 vs h1 gives ρ1/ ρ2 and (2 2/r2 - 2 1/r1)/ρ2g as the slope and intercept respectively. In their measurements they assumed r2 = r1. If we use their measured data of water + ethylene glycol (assumed 1:1 by vol) changed from 72 (mN/m) for water to 47(mN/m). Their accuracy of measurements of for this mixture was 2%. This gives the value of Δ(c)α/ Δ(p) to 2.4%. To this the minimum error β should be added to have a reliable estimation of the accuracy. Assuming that it is 0.27% (same as the error in their density measurement) this gives a value of minimum absolute error of 2.7% in the estimation of unknown concentration(c) of ethylene glycol in a water
www.ccsenet.org/apr Applied Physics Research Vol. 4, No. 4; 2012
110
solution by capillary rise measurement of surface tension. In their case the density varied from 1 g/ml to 1.108 g/ml. They mentioned the error to be less than 5%. If we assume 1% error, this gives an average error 4.6% (Equation 1) in the estimation of unknown concentration %. Thus the minimum error of estimating unknown concentration using their method lies between 2.7% and 4.6%. However this is only a crude approximation assuming a st. line relationship between and c since the detailed behavior of with c has not been studied by them. The major problem in the application of this method is as follows:
1) Significant errors creep in from errors in measurement of r2 & r1 and even in the assumption r2 = r1.
2) The use of the value of 1 should correspond to the experimental temperature as varies significantly with temperature.
3) The Raleigh correction factor should be used in the Equation (3). This replaces each of r1 and r2 by equation such as: r1’ = r1( 1 + r1/3h1 -0.128 r1
2/h12 + 0.1312 r1
3/h13)/cosθ1
4) In the application of this method for estimation of unknown concentration of a component in a liquid mixture it would not be prudent to assume contact angle θ to be always zero. Measurement of θ is not simple.
5) Even if the method is standardized by measurements with solutions of carefully measured known concentrations of the component at a given temperature, application of the method when temperature changes can give rise to significant errors in the estimation of unknown concentration, since important physical parameters like ρ, change with temperature. All these factors (1 to 5) can increase the minimum error much beyond the above value, i.e., 2.7%. The main advantage of the above method is the simultaneous measurement of both ρ, . These two quantities together can characterize the composition of a given solution better than a single parameter, ρ or .
8.3 Electrical Conductivity Method
Electrical conductivity of a solution changes significantly when concentration of ions changes. It is an important analytical measurement for certain water purity applications such as the treatment of boiler feed water, and the preparation of very high purity water used for semiconductor manufacture. Conductivity measurement is meaningful, when we know about the type of ions present in water/solutions or when the purpose is to eliminate all ions present in the solution such as the case of ultra-pure water treatment, in which case we don’t care about type of ions present since the goal is zero-conductivity. For application of electrical conductivity (σ) measurements to estimate unknown ion concentration, we need to have the standard curve of variation of electrical conductivity with the particular ion concentration or the theoretical equation connecting ion-concentration with electrolytic conductivity. As an example, for HCl, σ changes (Aquarius Bulletin, 2000) from 11.8 (μS/cm/ppm) to 10.2 (μS/cm/ppm) when the concentration of HCL changes from 1 to 10000 ppm. Using this data the average minimum detection limit (ppm) of HCL in water (Equation 7.1) is 0.1α + β. α (μS/cm) depends on instrument. If the instrument is accurate to within 0.1% then average α (within the above data range) = 50(μS/cm). With β = 0.5 ppm, this gives a minimum detection limit of HCl in water = 5.5 ppm. The minimum detection limit depends on the electrolyte apart from α and β. From the data reported in (Aquarius Bulletin, 2000) the corresponding detection limit for NaOH and NaCl (with same α and β) are 10.5 and 30.5 ppm. Most of the equipment can be said to be accurate if they have accuracy of 1% which translates to average α (within the above data range) = 500(μS/cm) and the above minimum detection limits are then: 50.5, 100.5 and 300.5 ppm for HCl, NaOH and NaCl in water. An equipment to measure electrical conductivity of solutions have been developed (LSchiefelbein, Fried, Rhodes, & Sadoway, 1998) that gives accuracy of conductivity measurements by +0.5%. The accuracy α of electrical conductivity measurements of solution depends on:
1) Electronic stability and linearity of the instrument
2) Linearity of instrument/sensor with solutions
3) Accurate temperature measurements and corrections for temperature effects in solutions
4) Knowledge of the relationship between conductivity and solutions of interest.
The major problem in the application of conductivity measurements for estimation of solute (ionic) concentrations :
(1) The temperature coefficient θ of conductivity varies anywhere from 1% to 4% per oC. And also it depends on concentration and temperature. For example(Hunt, 1995), θ varies from0.02 at 0oC to 0.0225 at 29oC for saturated NaCl. It varies from 0.0165 at 0 C to 0.0175 at 27 C for 0.1 N KCl solution. It varies from 0.0146 at 5 C to 0.0133 at 65 C for 1 M HCl. This even can offset the high accuracy limit

www.ccsenet.org/apr Applied Physics Research Vol. 4, No. 4; 2012
111
of measurement if the temperature is not quoted with accuracy makes the application of conductivity measurement somewhat difficult for estimation of unknown impurity concentration. Then the temperature coefficient θ for a given electrolyte (say HCl in water) has to be known over the possible variation of temperature range, so that from measurement of conductivity of the solution of unknown concentration at one temperature we can get the conductivity corresponding to the temperature at which conductivity vs. concentration calibration has been recorded. All these problems could have been overcome if precise theoretical formula connecting conductivity with concentration of each electrolyte and temperature is known.
(2) The second major problem is that conductivity reaches a peak with electrolyte concentration in water (Hunt, 1995). For example for HCl, HNO3, H2SO4 and NaOH the conductivity peaks are reached at 18%, 30%, 30% and 15% by weight concentration.
Moreover, the relationships between σ and c are not linear at all. The only perfectly linear relationship is exhibited by KCl up to conc. of 26% by weight. Conductivity method alone is not suitable for estimation of concentration beyond these limits. It must be accompanied by measurements of other parameters such as density, viscosity, dielectric constants etc. for reliably accurate estimation of concentration beyond these points.
(3) The third major problem is that conductivity of solution cannot be applied to those solutes which are not electrolytes. Thus it is limited to ionic salts only.
8.4 Refractive Index Methods of Estimation of Concentration of Solutes in Liquids
Precision laser based (Longtin and Fan 1998) method of determination of refractive index of water, ethyl and
methyl alcohol yielded values: 1.3330[17], 1.3614[17], 1.3290[17] at 20oC and at 589 nm. Even though they claimed that the accurate technique of refractive index measurement can yield accuracy in concentration measurement of +0.01% we estimate the average accuracy to be (using the equation) about 6% for ethyl alcohol water mixture and 42.5% for methyl alcohol-water mixture. Since the variation in refractive index with water concentration in methyl and ethyl alcohol is quite small, the refractive index method is not suitable, specially because it is much more expensive than the present viscosity method and some other conventional methods suggested above. For the refractive index method to yield the accuracy of 0.01% the measurements have to be accurate to +0.000003 in refractive index. It is not easy to achieve that experimentally and not achieved by Longtin and Fan (1998). Thus their claim of 0.01% accuracy in estimation of alcohol concentration may not be authentic. Moreover, for methyl alcohol the inaccuracy will be higher since the variation in refractive index with water is much less pronounced than for ethyl alcohol.
A High-precision optical metrology system for determining alcohol concentration of liquid sample26. Ref: Figure 1 in Yen-Liang Yeh, Cheng Chi Wang, Ming-Jyi Jang &Yen-Pin Lin in Optics and Lasers in Engineering, 47(5),
pp.599-603, (2009)
Using a high-precision measurement technique (Figure 1 in ref. Yeh et al. (2009)) for evaluating alcohol concentrations using optical metrology system based on a positioning sensor detector Yeh et al (2009) determined the refractive index of pure ethyl alcohol (95%) and water at 25oC to be 1.36587 and 1.33128
www.ccsenet.org/apr Applied Physics Research Vol. 4, No. 4; 2012
112
accurate (+0.00005) to the fifth place of decimal. Using the data and Equation (1) and assuming linear relation we see that the accuracy in estimation of concentration using their technique, the accuracy in estimation of concentration of water in ethyl alcohol or vice versa is around +0.14%. From their measurements they have developed an empirical relation between the concentration and refractive index as follows:
μ = - 0.00000234C 2 + 0.00056068C + 1.33227197
Using this relation and the experimentally determined refractive index of a known concentration (37%) of ethyl alcohol they found a maximum error in estimation of concentration using that relation is 0.7%. refractive index of methyl alcohol is 1.328 quite close to that(1.333) of water at 20oC. Thus employing refractive index method for estimation of water concentration in methyl alcohol would yield accuracy much less than that of the present viscosity method (see results above and Equation 7.1) Our experimental studies as discussed above clearly shows that simple inexpensive viscosity method can have advantage over the index of refraction method in estimating water concentration in alcohol if the accuracy of time counting can be improved to 100 ms or better. The technique has potential application as an analytical tool.
9. Conclusion and Future Recommendations
With the above comparison of estimation of solute concentration in a solvent, it appears that the present viscosity method has several advantages: 1) the method can yield fairly good accuracy. (2) The method is inexpensive and yield reliably consistent results. For example we have seen the time of flow to be reliable within +2 sec for repeated measurements. The accuracy can be improved by following the suggestions made earlier. (3) The application of the method does not need highly trained personal like in some of the other methods like conductivity, resistivity and refractive index measurements. (4) It offers accuracy in estimation of concentration that is comparable to that obtained by more expensive techniques like refractive index methods or conductivity methods. (5) It is applicable to almost all types of liquids, (acid, base, organics, water solutions of solid like salt, sugar, milk etc.) and color unlike the conductivity and refractive index method; (6) It can be operated without power (if accuracy of concentration estimation is limited to above +0.5% ) unlike the other techniques, except, density method. As shown earlier simple density method does not yield results with good accuracy for alcohol-water mixture.
We recommend that further research be carried out to establish on a firm ground the viscosity method combined with another method(s) such as density method and variation with temperature as an analytical tool for accurate estimation of concentration of solute and even identification when the type is unknown. Both from experiments and theory (even if it is empirical) relations connecting viscosity (or density) and concentration of solute, temperature should be found out. Such relation could find easy application in the estimation of unknown concentration of the solute at any temperature at the given solvent.
Bacterial contamination of IV solutions should change the viscosity of the solution. It would be interesting to perform research how this could be exploited to predict bacterial growth in the solution.
Determining the time of flow of a solution and that of pure water through a sensitive viscometer, one can determine the concentration of the solute or contaminant in the solvent of the solution using the method developed above. Our further investigations (not reported in this work) show that this new technique can be used to determine unknown concentration of one-component solute like sugar, salt, acid, alkali, etc in water (as solvent) with fairly good accuracy and in a short time (~12 minutes). The hardness and softness of water can also be assessed easily with this technique. The effect of temperature variation on such determination needs further investigation so that a common strategy could be formulated for easy application of this technique for accurate estimation of impurity concentration in a solution, irrespective of the ambient temperature. There is a possibility that with further research and combining with measurement of surface tension the technique can also extended to determination of concentrations of multi-component solute impurities in a known solvent. The technique can then find broad range analytical applications in laboratories and industries. Our further studies show that the technique can be adopted to the easy analysis of the components (protein, fat, lactose, minerals) in both liquid and powder milk.
This technique enables us to study the change of activation energy of solvent molecules with the nature and concentration of a solute molecule and it can be extended (by incorporating temperature variation and control facility) to study the effect of temperature on such changes. Such data can then throw light on how solute molecules arrange themselves (by obtaining information of G(r) in Equation 14 around the solvent molecules and how this in turn affects the bond strength and transport properties of solvent molecules. Analysis of such data can greatly help to develop liquid physics which unlike solid state physics has not reached a matured stage yet.
www.ccsenet.org/apr Applied Physics Research Vol. 4, No. 4; 2012
113
According to the previous investigations (Nagasawa et al., 2003) on the micro-viscosity of water–alcohol binary solvents (keeping water volume fixed and varying alcohol volume in the solution), the formation of the alcohol clusters caged inside the H-bond network of water molecules increases the bulk viscosity at alcohol mole fraction in the range of XA≤0.2 (Roney, Space, Castner, Napoleon, & Moore, 1991; Mashimo, Umechara, & Redlin, 1991). In the range of XA≥0.3, alcohol clusters start to gather and break the ‘clathrate-like’ structure, leading to lowering of bulk viscosity with higher alcohol fraction. The later aspect agrees with present investigation while the first aspect needs further investigation. Aprano, Donato, Carruba (1982) experiments on viscosity of water-pentanol mixture did not yield any consistent variation of viscosity with water concentration.
We recommend that temperature variation of the viscosity of both ethyl and methyl alcohol be carried out so that absolute values of the activation energies of each of the alcohol can be found out from the slope of a plot of ln(μ/T) vs 1/T curve. Similar determination has recently been done by Rohindra, Lata and Coll (2012) for polymer solutions. Then using the values of change of activation energies with addition of water one can find out the absolute values of the activation energies of water –alcohol mixtures for various water concentrations in ethyl and methyl alcohol. Such data would be useful in further research on extension of the technique to determine concentrations of both types of alcohol in water.
Acknowledgment
The author (DKDE) acknowledges the research grant given by FUTY under Ref: No. FUTY/R/ACA/R.2/Vol.I to develop the technique of analyzing petroleum and kerosene mixtures which were partly used for the present work also. The authors are grateful to both the former Vice-Chancellors of FUTY: Prof. Salihu Mustafa and Prof. Abdullahi Ribadu for providing facilities and encouragements during the above research work. Thanks to the referees for suggestions to improve the work further.
References
Adamson, A. W. (1990). Physical Chemistry of Surfaces (p.72-76). New York, NY: John Wiley Inc.
Akali, J. S., Ijabo O. J., & Satimehin, A. A. (2003). Rheological Characteristics of Canarium Oil. Science Forum, 6(2), 298-303.
Aprano, A. D., Donato, D. I., & Carruba, A. (1982). Journal of Solution Chemistry, 11(4), 271. http://dx.doi.org/10.1007/BF00657318
Aquarius Technical Bulletin. (2000). No.8, Conductivity Measurement, August 2000. Published by Aquarius technologies PTY. Retrieved from http://www.google.com.ng/search?q=Aquarius%20Bulletin%202000&ie=utf-8&oe=utf-8&aq=t&rls=org.mozilla:en-US:official&client=firefox-a&source=hp&channel=np
Bari, S. B., Kadan, B. R., Jaiswal, Y. S., & Shirkhedkar, A. A. (2007). Impurity Profile-Significance in Active Pharmaceutical Ingredient. Eurasian Journal of Analytical Chemistry, 2(1), 32.
Chang, Y. Y., Wu, M. Ya., Hung, Y. L., & Lin, S. Y. (2011). Accurate surface tension measurement of glass melts by the pendant drop method. Rev. Sci. Instr., 82, 055-107.
Cutnell, J. D., & Jhonson, K. (1995). W. Physics (3rd ed., p.367). New York, NY: John Wiley & Sons, Inc.
Das, S. (2011). Effect of impurities in the description of surface nano-tubes: Role of non-idealities in the surface layer. Phys. Rev E, 83, 066315. http://dx.doi.org/10.1103/PhysRevE.83.066315
De, D. K., & Sheikh, M. A. (2002). An innovative technique of rapid analysis of petroleum contamination in kerosene. Technology and Development, 8, 13-20.
Dropsy, J. G. (1997). Liquid Chromatography. In Encyclopedia of Science and Technology (MHEST) (Vol.10, 126). New York, NY: McGraw Hill.
Grubbs, T. (2012). Viscosity of simple liquids- Temperature variations. Retrieved from http://www2.stetson.edu/~wgrubbs/datadriven/viscosity/viscositywtg.html
Hall, E. E., & Payne, A. R. (1922). The variation of the index of refraction of water, ethyl alcohol and carbon disulphide. Physical Review, 20(3), 249. http://dx.doi.org/10.1103/PhysRev.20.249
Hilton, A. K., Pellegrino, V. A., & Scheinkestel, C. D. (2008). Avoiding common problems associated with intravenous fluid therapy. The Medical Journal of Australia, 189(9), 509-513.
Hunt, R. C. (1995). How to increase Accuracy of solutions conductivity measurements. Sensor Developments Inc. Retrieved from http://www.astisensor.com/How_to_Increase_Accuracy_Conductivity_Measurements.pdf
www.ccsenet.org/apr Applied Physics Research Vol. 4, No. 4; 2012
114
Juvet, R. S. Jr. (1997). Gas Chromatography. in Encylopedia of Science and Technology (Vol. 3, 656). Macraw Hill.
Longtin, J. P., & Fan, C. H. (1998). Microscale, Precision Laser based Concentration and refractive index measurement of liquids. Thermophysical Engineering, 2, 261-272.
LSchiefelbein, S., Fried, N. A., Rhodes, K. G., & Sadoway, D. R. (1998). A high-accuracy calibarion –free technique for measuring electrical conductivity of liquids. Rev. Sci. Instrm., 69, 3308-3313. http://dx.doi.org/10.1063/1.1149095
Mashimo, S., Umechara, T., & Redlin, H. (1991). Structures of water and primary alcohol studied by microwave dielectric analyses. J. Chem. Phys., 951, 6257. http://dx.doi.org/10.1063/1.461546
Nagasawa, Y., Naka-gawa, Y., Nagafuji, A., Okada, T., & Miyasaka, H. (2003). The microscopic viscosity of water–alcohol binary solvents studied by ultrafast spectroscopy utilizing diffusive phenyl ring rotation of malachite green as a probe. J. Mol. Structure, 735-736, 217-223. http://dx.doi.org/10.1016/j.molstruc.2004.11.014
Poole, C. F. (1997). in Chromatography: MHEST Vol.3, 656.
Rakshit, P. C. (1997). Physics Chemistry (4th Reprint, p.88). Calcutta: P. M. Bagchi and Co. PVT Ltd.
Rohindra, D. R., Lata, R. A., & Coll, R. K. (2012). A simple experiment to determine the activation energy of the viscous flow of polymer solutions using a glass capillary viscometer. Euro, J. Phys., 33, 1457-1461. http://dx.doi.org/10.1088/0143-0807/33/5/1457
Roney, A. B., Space, B. E., Castner, W., Napoleon, R. L., & Moore, P. B. (1991). J. Phys. Chem., 951, 6257.
Satimahen, A. A., Akinremi, O. M., & Ijabo, O. J. (2003). Rheological behavior of Palm Oil. Science Forum, 6(2), 29-297.
Sinha, D. B., & Das Sarma, J. M. (1969). College Physics (Vol.1, p.322). Calcutta: Modern Book Agency Private Ltd.
Smith, C. J. (1972). The General Properties of Matter, Royal Holloway College, Engle Field Green, Survey, 554.
Thirunavukkarasu, G., & Srinivasan, G. J. (2003). Novel Method for the simultaneous estimation of density and Surface tension of liquids. Rev. Sci. Instr., 74(6), 3146-3150. http://dx.doi.org/10.1063/1.1574391
Wan, S., Wei, Z. Chen, X., & Gao, J. (2009). Pendant drop method for interfacial tension measurement based on edge detection method. IEEE 978-1-4244-4131.
Yavorsky, B., & Detlaf, A. (1980). Hand Book of Physics (p.313). Moscow: MIR Publishers.
Yeh, Yen L., Wang, C. C., Jang, M. J., & Lin, Y. P. (2009). A high precision measurement technique for evaluating alcohol concentration using optical metrology system based on a position sensing detector. Optics & Lasers in Engineering, 47(5), 599-603.
Yilmaz, H. (2002). Excess properties of Alcohol-Water systems at 298.15 K. Turk J. Phys, 26, 243-246.
Ziesing, G. M. (1953). The determination of Surface tension by sessile drop measurement with application to mercury- G. M. Ziesing. Australian Journal of Physics, 6, 86. http://dx.doi.org/10.1071/PH530086
Zéberg-Mikkelsen, C. K., Watson, G., Baylaucq, A., Galliéro, G., & Boned, C. (2005). Comparative experimental and modelling studies of the viscosity behaviour of ethanol + C7 hydrocarbon mixtures versus pressure and temperature. Retrieved from http://thermophysics.ru/pdf_doc/AutoPlay/Docs/CollectionOfManuscripts/ECTP2005paper5 4.pdf
Related Documents


