ORIGINAL ARTICLE doi:10.1111/evo.12844 An information-theoretic approach to estimating the composite genetic effects contributing to variation among generation means: Moving beyond the joint-scaling test for line cross analysis Heath Blackmon 1,2 and Jeffery P. Demuth 3 1 Department of Ecology, Evolution, and Behavior, University of Minnesota, Saint Paul, Minnesota 55108 2 E-mail: [email protected] 3 Department of Biology, University of Texas at Arlington, Texas 76019 Received December 5, 2014 Accepted December 11, 2015 The pace and direction of evolution in response to selection, drift, and mutation are governed by the genetic architecture that underlies trait variation. Consequently, much of evolutionary theory is predicated on assumptions about whether genes can be considered to act in isolation, or in the context of their genetic background. Evolutionary biologists have disagreed, sometimes heatedly, over which assumptions best describe evolution in nature. Methods for estimating genetic architectures that favor simpler (i.e., additive) models contribute to this debate. Here we address one important source of bias, model selection in line cross analysis (LCA). LCA estimates genetic parameters conditional on the best model chosen from a vast model space using relatively few line means. Current LCA approaches often favor simple models and ignore uncertainty in model choice. To address these issues we introduce Software for Analysis of Genetic Architecture (SAGA), which comprehensively assesses the potential model space, quantifies model selection uncertainty, and uses model weighted averaging to accurately estimate composite genetic effects. Using simulated data and previously published LCA studies, we demonstrate the utility of SAGA to more accurately define the components of complex genetic architectures, and show that traditional approaches have underestimated the importance of epistasis. KEY WORDS: Composite genetic effects, epistasis, genetic architecture, joint-scaling test, line cross analysis. The genetic architecture of a trait is a description of how vari- ation in genotypes map onto variation in phenotypes. Because the details of this mapping govern how a trait will respond to evolutionary forces, much of evolutionary theory is predicated on assumptions about whether genetic architectures are sim- ple or complex (reviewed in Wolf et al. 2000; Svensson and Calsbeek 2012). As most textbooks will report, simple architec- tures, in which all genetic variation is due to additive gene action (i.e., heterozygotes have exactly intermediate value to either ho- mozygote), provide the most efficient substrate for adaptation via natural selection (Fisher 1941; Crow and Kimura 1970; Lande and Arnold 1983; Lynch and Walsh 1998). However, more complex architectures that include within and between locus interactions (dominance and epistasis, respectively) can cause the available additive genetic variance to increase or decrease, and thereby accelerate or impede adaptation, even in the absence of addi- tive gene action at any constituent locus (Goodnight 1988, 2000; Falconer and Mackay 1996, p. 128; Wade 2000, 2002; Carter et al. 2005; Carlborg et al. 2006). Genetic interactions may also facilitate evolutionary phenomena such as the origin of sex and re- combination (Charlesworth 1990; Barton 1995; Peters and Lively 1999), mating system evolution (Charlesworth and Charlesworth 420 C 2015 The Author(s). Evolution C 2015 The Society for the Study of Evolution. Evolution 70-2: 420–432

Welcome message from author
This document is posted to help you gain knowledge. Please leave a comment to let me know what you think about it! Share it to your friends and learn new things together.
Transcript

ORIGINAL ARTICLE
doi:10.1111/evo.12844
An information-theoretic approach toestimating the composite genetic effectscontributing to variation among generationmeans: Moving beyond the joint-scaling testfor line cross analysisHeath Blackmon1,2 and Jeffery P. Demuth3
1Department of Ecology, Evolution, and Behavior, University of Minnesota, Saint Paul, Minnesota 551082E-mail: [email protected]
3Department of Biology, University of Texas at Arlington, Texas 76019
Received December 5, 2014
Accepted December 11, 2015
The pace and direction of evolution in response to selection, drift, and mutation are governed by the genetic architecture that
underlies trait variation. Consequently, much of evolutionary theory is predicated on assumptions about whether genes can be
considered to act in isolation, or in the context of their genetic background. Evolutionary biologists have disagreed, sometimes
heatedly, over which assumptions best describe evolution in nature. Methods for estimating genetic architectures that favor
simpler (i.e., additive) models contribute to this debate. Here we address one important source of bias, model selection in line
cross analysis (LCA). LCA estimates genetic parameters conditional on the best model chosen from a vast model space using
relatively few line means. Current LCA approaches often favor simple models and ignore uncertainty in model choice. To address
these issues we introduce Software for Analysis of Genetic Architecture (SAGA), which comprehensively assesses the potential
model space, quantifies model selection uncertainty, and uses model weighted averaging to accurately estimate composite genetic
effects. Using simulated data and previously published LCA studies, we demonstrate the utility of SAGA to more accurately define
the components of complex genetic architectures, and show that traditional approaches have underestimated the importance of
epistasis.
KEY WORDS: Composite genetic effects, epistasis, genetic architecture, joint-scaling test, line cross analysis.
The genetic architecture of a trait is a description of how vari-
ation in genotypes map onto variation in phenotypes. Because
the details of this mapping govern how a trait will respond to
evolutionary forces, much of evolutionary theory is predicated
on assumptions about whether genetic architectures are sim-
ple or complex (reviewed in Wolf et al. 2000; Svensson and
Calsbeek 2012). As most textbooks will report, simple architec-
tures, in which all genetic variation is due to additive gene action
(i.e., heterozygotes have exactly intermediate value to either ho-
mozygote), provide the most efficient substrate for adaptation via
natural selection (Fisher 1941; Crow and Kimura 1970; Lande and
Arnold 1983; Lynch and Walsh 1998). However, more complex
architectures that include within and between locus interactions
(dominance and epistasis, respectively) can cause the available
additive genetic variance to increase or decrease, and thereby
accelerate or impede adaptation, even in the absence of addi-
tive gene action at any constituent locus (Goodnight 1988, 2000;
Falconer and Mackay 1996, p. 128; Wade 2000, 2002; Carter
et al. 2005; Carlborg et al. 2006). Genetic interactions may also
facilitate evolutionary phenomena such as the origin of sex and re-
combination (Charlesworth 1990; Barton 1995; Peters and Lively
1999), mating system evolution (Charlesworth and Charlesworth
4 2 0C© 2015 The Author(s). Evolution C© 2015 The Society for the Study of Evolution.Evolution 70-2: 420–432

I -T APPROACH TO LINE CROSS ANALYSIS
1990; Schierup and Christiansen 1996; Jacobs and Wade 2003),
reproductive isolation (Cabot et al. 1994; Orr and Turelli 2001;
Demuth and Wade 2005; Moehring et al. 2006), and developmen-
tal robustness and canalization (Rice 1998; Bergman and Siegal
2003; de Visser et al. 2003; Flatt 2005; Felix and Barkoulas 2015)
that are each difficult to explain with theory that omits epistasis
from the genetic architecture. There is also a broad correlation
in evolutionary theory in which simpler architectures are empha-
sized when trait variation is among individuals within a family or
population, but more complex architectures are emphasized as the
relatedness among potential mates decreases (Lynch 1991; Coyne
et al. 1997; Orr 2001; Demuth and Wade 2005). More specifically,
inbreeding depression and heterosis between closely related in-
dividuals are traditionally attributed to dominance effects (Bruce
1910; Crow 1948; Lande and Schemske 1985; Charlesworth and
Charlesworth 1999; but see Moorad and Wade 2005), a view
consistent with observations of linear relationship between in-
breeding and decline in trait mean (reviewed in Lynch and Walsh
1998; Byers and Waller 1999). In contrast, outcrossing depression
and speciation are typically attributed to the breakup of coad-
apted gene complexes, environment-dependent effects (Carson
and Templeton 1984; Fenster and Galloway 2000) and/or nega-
tive interactions between loci (Dobzhansky 1937; Muller 1940,
1942; Gavrilets 1997, 2003).
Debate over the relative importance of simple vs. complex
architectures in nature has persisted among evolutionary biolo-
gists for decades (Wright 1931; Fisher 1958; Coyne et al. 1997;
Wade and Goodnight 1998). It has been argued that reconciling the
long-standing debates about when complex genetic interactions
are important considerations for our understanding of evolution
requires relevant empirical measures of genetic architecture along
a continuum of divergence (Lynch 1991; Demuth and Wade 2005,
2006). However, efforts to empirically measure genetic architec-
tures are often laborious and suffer from methodological biases
against finding gene interactions (Demuth and Wade 2006). Our
purpose in the work presented below is to alleviate a major source
of bias associated with the line cross analysis approach to mea-
suring genetic architecture.
Line cross analysis (LCA) is a widely used quantitative genet-
ics method for estimating genetic architecture by partitioning a set
of mean phenotypes into their composite genetic effects (CGEs;
e.g., additive, dominance, and epistatic gene action). Originally
developed in efforts to understand the genetic architecture of traits
important to human agriculture (Mather and Jinks 1982), LCA
has also provided insights into the genetic basis of adaptation and
speciation (Armbruster et al. 1997; Lair et al. 1997; Edmands
1999; Galloway and Fenster 2001; Miller et al. 2003; Demuth
and Wade 2005, 2007a,b; Tymchuk et al. 2007; Fuller 2008;
Demuth et al. 2014). The LCA approach typically uses two
parental strains that have diverged in a phenotype of interest.
These parents are crossed, producing an F1, and subsequent
crosses (e.g., F2, backcross, reciprocals) are made to generate
groups that have different combinations of parental genes. We
refer to each of these groups as cohorts. Using a weighted least
squares regression with weights inversely proportional to the vari-
ance of the cohort means, the degree to which a phenotype is
determined by different CGEs may be estimated (Cavalli 1952;
Hayman 1958). It is important to keep in mind that LCA does not
identify specific genetic features; rather CGEs represent the net
effect of all genetic features contributing to the differences in the
phenotype of interest between the parental lines. Furthermore, be-
cause LCA requires multiple generations, any environmental fac-
tors that contribute to spurious covariances among cohort means
have the potential to confound estimates of genetic architecture.
Failure to inter-randomize the cohorts in experimental assays may
be an important source of faulty inference and deserves close at-
tention during experimental design.
The most widely implemented statistical approach to testing
among LCA models with different CGEs is called the joint-scaling
(J-S) test (essentially a forward variable selection weighted least
squares regression). Using this approach a simple additive model
is first fit and then additional higher order CGEs are added un-
til, based on the results of a likelihood ratio test, no significant
improvement in the model is achieved (Mather and Jinks 1982;
Lynch and Walsh 1998). This approach is common in studies of
both plants and animals (Edmands 1999; Schiffer et al. 2006; van
Heerwaarden et al. 2008; Bentz et al. 2011). Due to concerns that
this approach may not find the best model, a number of alternative
variable selection approaches have been implemented including
backward and stepwise variable selection (Gilchrist and Partridge
1999; Demuth and Wade 2007 b). Additionally, hybrid approaches
have been implemented using Akaike information criterion (AIC)
to choose a most parsimonious model from an a priori chosen sub-
set of potential models followed by the use of significance tests
to add or remove CGEs and arrive at a final “best” model (Bieri
and Kawecki 2003; Fritz et al. 2006; Fox et al. 2011). Finally, an
iterative approach using AIC to compare multiple small candidate
sets of models has been used to choose a single “best” model (Fox
et al. 2004).
There are several documented issues with the variable selec-
tion processes implemented in the J-S test and existing ad hoc
approaches (Whittingham et al. 2006): (1) Different variable se-
lection approaches (forward, backward, and stepwise) do not con-
sistently identify the same variables as important (Derksen and
Keselman 1992). (2) Parameter estimates under these approaches
are biased away from zero (Burnham and Anderson 2002). (3)
Calculating valid P-values is difficult due to multiple compar-
isons (Wilkinson 1979). (4) Hypothesis testing approaches place
an inappropriate focus on a single model ignoring the degree of
model uncertainty implied by the data (Burnham and Anderson
EVOLUTION FEBRUARY 2016 4 2 1

H. BLACKMON AND J. P. DEMUTH
2002). Finally, because the number of cohorts is often small rel-
ative to the number of CGEs being considered, the use of AIC
as a metric is inappropriate for line cross data and should be re-
placed with AICc (Hurvich and Tsai 1989). More broadly, the
often repeated aphorism that “all models are wrong, but some are
useful” suggests that the search for a single best model may often
be misguided (Box and Draper 1987). A more prudent approach
would be to evaluate all models that the data allow and identify
the useful one(s).
Following, we describe and demonstrate a full information-
theoretic (I-T) approach to model selection and parameter es-
timation for LCA that alleviates the difficulties associated with
previous approaches and provides additional understanding that is
not possible under a J-S, hybrid, or ad hoc approach. Our approach
leverages the finite sample size corrected version of the Akaike
information criterion (AICc) to explore all possible models and
make unbiased and, when appropriate, model-averaged estimates
of the contribution of CGEs to cohort means. We have developed
an R package: Software for the Analysis of Genetic Architecture
(SAGA) that makes this approach straightforward to implement.
The SAGA software is available from the R package repository
CRAN. We describe our approach and its performance on simu-
lated datasets as well as contrasting the results of this method to
those from the J-S test using 22 previously published datasets.
Method and InterpretationThe first step in LCA is the development of a C-matrix that de-
scribes the potential contribution of CGEs to cohort means. Two
versions of C-matrices have been widely used and have been
shown to have a linear relationship (Basford and De Lacy 1979).
We use a C-matrix that is scaled to the midparent mean (equiv-
alent to F�), and includes 23 potential CGEs (Table S1). By
maximizing the number of CGEs (many of which are normally
not explored), we reduce the risk that results are biased by the
selection of CGEs tested. For each CGE we have calculated co-
efficients for 24 potential crosses; each of which is divided into
male, female, or mixed sex cohorts.
Depending on the identity of the cohorts supplied, some
CGEs may not vary or may be perfectly correlated with one an-
other. Therefore, the first step in our approach is to reduce the
C-matrix to include only the CGEs that can be partitioned with
the available cohorts. Next, we generate all possible models that
have at most two fewer CGEs than the number of cohorts being
analyzed (number of cohorts—intercept—1). We use the existing
implementation of weighted least squares regression in the base R
package in the function GLM (R Development Core Team 2013).
Some CGEs may be either highly correlated or contain a linear
dependency (when one CGE can be described as a linear combi-
nation of one or more other CGEs). The GLM function will drop
the highest order CGE from a model if it is highly correlated with
a lower order CGE or if its inclusion creates a linear dependency.
When this occurs it would effectively create a duplicate lower or-
der model in the set being evaluated. If this occurs, we remove the
equation with the confounded CGEs from the set being evaluated
allowing the CGEs to be estimated independently by lower order
equations that are otherwise equivalent.
The function GLM returns the parameter and standard error
estimates conditional on the model as well as the AIC value for
the model. AIC scores have been used to evaluate LCA models
(Bieri and Kawecki 2003; Fox et al. 2004, 2011), but if the ratio
of the number of cohorts to the number of CGEs being evaluated
is less than 40, which will almost always be the case in LCA,
then AICc is preferable (Burnham and Andersen 1998). AICc
provides an appropriate trade-off between model complexity and
goodness of fit, and as sample size increases it converges on
AIC (McQuarrie and Tsai 1998). The higher penalty assessed for
additional parameters under AICc should help to reduce the risk
of including spurious variables and overfitting. We convert AIC
to AICc using equation (1), where n is the number of cohorts and
K is the number of parameters being estimated.
AICc = AIC + 2K (K + 1)
n − K − 1(1)
Once all models have been evaluated, we calculate AICc differ-
ences (�AICc) using equation (2).
�AICci = AICci − AICcmin, (2)
where AICcmin is the minimum AICc score calculated across
all possible models and AICci is the AICc calculated for a specific
model. �AICc allows models to be ranked and is used in generat-
ing Akaike weights (wi ) using equation (3). The denominator in
equation (3) is the summation of the numerator across all possible
models being evaluated (R). The wi generated in this way will
sum to 1 and can be evaluated as evidence for whether a model is
correct.
wi = e−0.5×�AICci∑Rr = 1 e−0.5×�AICcr
(3)
If wi of the best model is 0.95 or greater, then we perform
parameter estimation under a single model. If no model reaches
this threshold, then we construct a 95% confidence set of models
that contains the minimum number of models whose wi sum to
0.95. We then compute model-averaged results for the 95% con-
fidence set. To calculate model-averaged parameter estimates and
unconditional standard errors, we recalculate wi for each model
performing the summation in the denominator of equation (3)
across all models in the confidence set. The model weighted pa-
rameter estimates (θ) are then calculated using equation (4), where
wi is the recalculated model weight and θi is the parameter es-
4 2 2 EVOLUTION FEBRUARY 2016
I -T APPROACH TO LINE CROSS ANALYSIS
timate from the model; the product of these values is summed
across all models (R) in the confidence set.
θ =R∑
i = 1
wi × θi (4)
Standard error estimates that are not conditional on any one
model are calculated using equation (5).
se(θ)
=R∑
i = 1
wi
√var
(θi |gi
) +(θi −θ)2
(5)
The term var (θi |gi ) represents the conditional variance of a
parameter estimate under an individual model whereas (θi −θ)2
is simply the squared deviation of the parameter estimate under a
given model from the model weighted average for that parameter.
Our I-T approach also provides estimates of variable impor-
tance calculated by summing wi of all models (R) in which a CGE
occurs (eq. 6).
vi =R∑
i = 1
wi (6)
The vi score provides evidence that a CGE is important even
if its contribution is small or poorly defined.
For the remainder of the article, we denote CGEs using a
capital letter for the source of an effect: autosomal (A), cytotype
(C), maternal effect (M), X chromosome (X), Y chromosome (Y);
and we use lower case to denote the type of effect: additive (a) or
dominance (d). Two-locus epistatic CGEs are denoted by joining
the single locus notations (e.g., AaAd is autosomal additive by
autosomal dominance epistasis).
INTERPRETING RESULTS OF AN I-T APPROACH
TO LCA
Interpreting LCA results using an I-T approach involves consid-
eration of a number of factors not present in the traditional J-S
approach. In our experience, few LCA datasets strongly support a
single model of genetic architecture, yet goodness-of-fit statistics
and parameter estimates are typically only reported for the best
model. A major advance of SAGA, and the I-T approach more
generally, is the ability to quantify the degree of model selection
uncertainty. In general, the lower the Akaike weight of the best
model and or the more models contained in the 95% confidence
set, the greater the degree of model selection uncertainty. Using
our software, users can plot the distribution of Akaike weights
across all possible models to allow a simple visual interpretation
of model selection uncertainty.
In cases in which there is considerable model selection un-
certainty, vi scores often provide a strong indication of the impor-
tance of a specific CGE’s role in the genetic architecture of a trait.
This occurs because even when a 95% confidence set contains
many models, one or a handful of CGEs may be present in the
majority of them. In these situations, we can infer that the CGE
is likely to be important, but we may have little confidence in
estimating its true magnitude or sign because it depends on the
other components in the model.
After assessing model selection uncertainty and vi scores,
we can evaluate the CGE estimates and their unconditional error
estimates. Due to the inherent biases in previous J-S approaches
noted above, our model-averaged parameter estimates will often
be of lower magnitude and because the error now properly in-
cludes model selection uncertainty it will often be higher. SAGA
returns a table containing the model-averaged parameter estimate
and unconditional standard error for all CGEs included in the 95%
confidence set of models.
VALIDATING THE I-T APPROACH
To evaluate our I-T approach to LCA, we created 1250 simu-
lated datasets under five simulation conditions based on the sam-
ple sizes, midparent mean, and standard deviations observed in a
study of sperm receptacle length in Drosophila mojavensis (Miller
et al. 2003). The first four simulation conditions are based on a
simple genetic architecture in which the midparent mean is 4.58
and there are three CGEs (Aa, Ma, AaAd) that each contribute
to variation among line means with equal magnitude. The magni-
tude of each CGE was 0.25, 0.5, 1, and 2 in conditions 1 through
4, respectively, and 250 datasets were simulated under each of
these conditions. Although the architecture is simple in all cases,
by varying the magnitude of the CGEs we simulate data that pose
difficulty for traditional approaches that must not only specify the
best model but accurately estimate the values of the CGEs. We
also generated an additional 250 datasets in which the true CGEs
are expected to be difficult to estimate because the genetic archi-
tecture is complex. For these simulations the midparent mean is
also 4.58, but six CGEs (Aa, Ad, Ma, AaAa, AaAd, AdAd) con-
tribute to line means, all with magnitude = 1. For each simulated
dataset, we included the following mixed sex cohorts: P1, P2, F1
(P1 × P2), rF1 (P2 × P1), (P1 × F1), (rF1 × P1), (P2 × F1),
(rF1 × P2); parents are indicated as sire × dam. We introduced
sampling error to the simulated cohort means by randomly sam-
pling 30 values from a normal distribution centered on the known
cohort mean (specified by model parameters), and a standard de-
viation equal to 0.087 (the highest standard deviation recorded in
the D. mojavensis dataset). The CGEs that we can evaluate with
these cohorts are as follows: Aa, Ad, Ca, Ma, Md, AaAa, AaAd,
AdAd, CaAa, and CaAd. These 10 effects allow for more than
800 possible underlying models.
We also compare the results of our I-T approach to the results
from Miller et al. (2003), and our own LCA of hybrids among
Tribolium castaneum populations (Demuth and Wade 2007a,b)
and Silene species (Demuth et al. 2014). The LCA of coevolution
EVOLUTION FEBRUARY 2016 4 2 3
H. BLACKMON AND J. P. DEMUTH
between male sperm length and female sperm receptacle length
(empirical datasets 1 and 2, respectively) among populations of
D. mojavensis (Miller et al. 2003) was included because it is one
of the few studies in which the authors published the underlying
data for sexed cohorts. Analyzing the sexes separately allows us
to include sex chromosome effects, which greatly expands the
potential model space. This increase in model space is a problem
for traditional LCA approaches, but less so for the I-T approach
in SAGA.
From previous work by Demuth and colleagues, we reana-
lyze the genetic architecture of divergence among a cosmopoli-
tan sample of T. castaneum interpopulation crosses (empirical
datasets 3–17). We include 15 population pairs in which the num-
ber of offspring was measured, based on the original analysis,
we expect to harbor a wide range of genetic architectures. We
also reanalyze the recent LCA of interspecific hybrids between
S. latifolia and S. diclinus (Demuth et al. 2014). This study an-
alyzed male and female fertility (ovule and pollen production)
and viability (offspring number for each sex) in pure parental
crosses and interspecific hybrids (empirical datasets 18–22);
Table S2 provides detailed information on all empirical datasets.
In all cases, the original studies implemented a J-S approach using
X2 to assess model fit and likelihood ratio tests to add or remove
CGEs from the overall model; we contrast these to results with
the I-T approach implemented in SAGA.
All analyses were computed using our software package
SAGA version 1.0 loaded with RStudio version 0.98.976 run-
ning R version 3.02 on a MacBookPro with 4 GB of 2600 MHz
RAM and a 2.5 GHz processor (RStudio 2012; R Development
Core Team 2013). Our R package is available from the CRAN
repository and includes a vignette (supplement text 1) that guides
users through an analysis of two empirical datasets.
ResultsSIMULATIONS STUDIES
To evaluate the performance of our I-T approach using simulated
data, we report the accuracy of parameter estimates, as well as
performance in identification of CGEs included in the generating
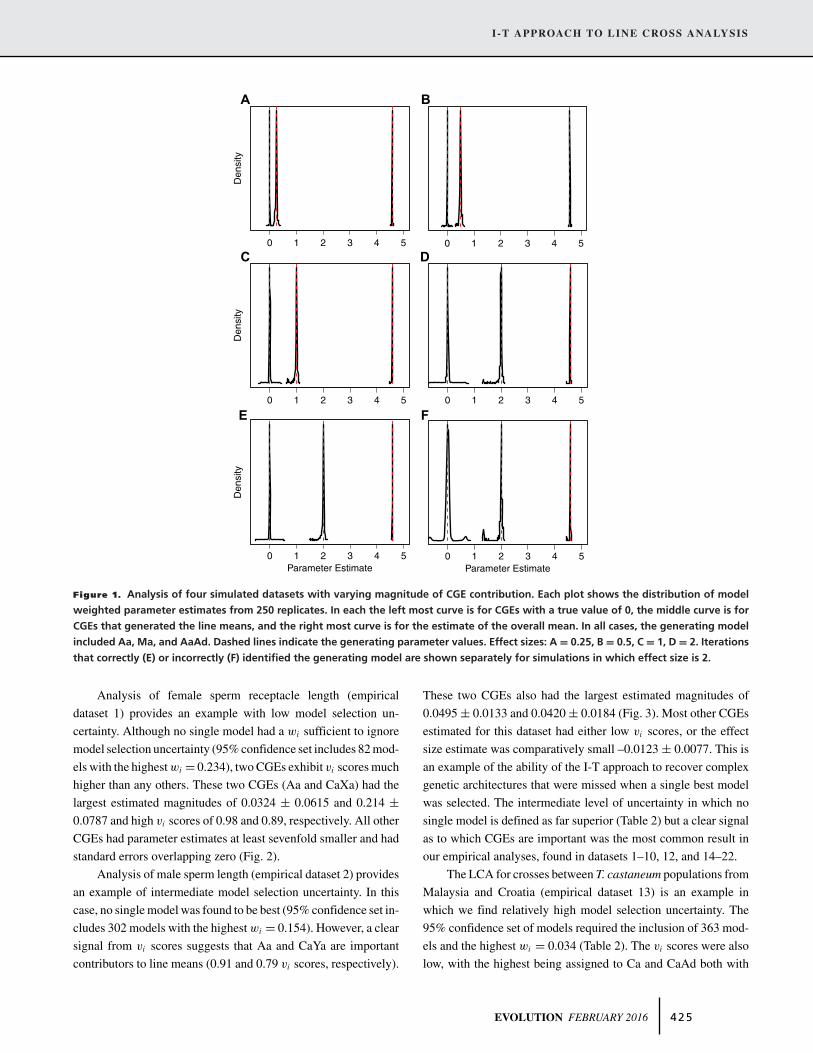
model. In simulated datasets with simple architectures in which
we varied the magnitude of CGEs, SAGA accurately estimated
the true values in all cases (Fig. 1A-D). In fact, even when the
magnitude of the CGEs was only 5% of the mean, the estimate
of the magnitude of the CGEs was within 2% of the true value
(Fig. 1A). A key benefit of SAGA is that the parameter estimates
are accurate despite substantial overall model selection uncer-
tainty. The true model used to generate the simulated data was
only identified as the best model in 73, 71, 73, and 69% of the
replicates among datasets simulated under conditions 1–4, respec-
tively. The fact that SAGA very accurately estimates parameter
values while simultaneously failing to always identify the correct
model as best is likely due to CGEs that have small parameter
estimates, large standard errors, and low vi but by chance explain
enough stochastic variation in cohort means to be included in a
subset of high scoring models.
Because analysis of the simple architecture with effect sizes
of 2 (simulation condition 4) had the lowest success (69%) in
identifying the generating model as best, we used it to investigate
the impact of model misspecification on parameter estimates. We
parsed the results from the 250 replicates based on whether the
true generating model was identified as the best model (Fig. 1E;
N = 174) or not (Fig. 1F; N = 76). Even in the 76 datasets
in which the generating model was not identified as the best
model, the individual parameter estimates remain accurate. There
were no cases in which the estimates for CGEs excluded from
the generating model were as large as the estimates for CGEs
included in the generating model.
The last set of simulated data offers the opportunity to eval-
uate a more complex genetic architecture in which the number of
CGEs generating the cohort means is approaching the maximum
number of estimable parameters (8 cohorts – [6 CGEs + inter-
cept] = 1 degree of freedom). Our analysis of these data shows
that SAGA can clearly distinguish the CGEs generating the line
means based on vi scores. Table 1 shows the minimum vi for a
CGE included in the generating model was 0.659 whereas the
maximum vi for a CGE excluded from the generating model was
0.02. We find that most CGEs are accurately estimated. In par-
ticular, Aa, Ma, and AaAd have mean estimates of 0.994, 1.000,
and 0.998, respectively, and vi scores of 0.993, 0.997, and 0.996
respectively. The three other CGEs included in the generating
model (Ad, AaAa, AdAd) have more variable estimates rang-
ing from 0.663 to 1.173 due to a linear dependency between the
CGEs that precludes their joint estimation with the cohorts sim-
ulated. Thus, the parameter estimates for Ad, AaAa, and AdAd
are generated by fewer models (those that are missing at least one
of the CGEs). Despite this, the parameter estimates and the vi
scores for these three CGEs are all at least one order of magnitude
greater than the estimates for CGEs that were not included in the
generating model (Table 1).
ANALYSIS OF EMPIRICAL DATA
Analysis of the 22 empirical datasets in SAGA revealed the antic-
ipated advantages of using an I-T approach: (1) successfully find-
ing complex models in which J-S fails; (2) providing a clear signal
of model selection uncertainty; (3) identifying CGEs that are often
ignored; and (4) providing parameter and error estimates uncon-
ditional on any single model. The results for all empirical datasets
are reported in Table 2. Below we briefly report results from the
analyses of several exemplar datasets that illustrate the range of
model selection uncertainty we have found in empirical data.
4 2 4 EVOLUTION FEBRUARY 2016
I -T APPROACH TO LINE CROSS ANALYSIS
0 1 2 3 4 5D
ensi
ty0 1 2 3 4 5
0 1 2 3 4 5
Den
sity
0 1 2 3 4 5
0 1 2 3 4 5Parameter Estimate
Den
sity
0 1 2 3 4 5Parameter Estimate
A B
C D
E F
Figure 1. Analysis of four simulated datasets with varying magnitude of CGE contribution. Each plot shows the distribution of model
weighted parameter estimates from 250 replicates. In each the left most curve is for CGEs with a true value of 0, the middle curve is for
CGEs that generated the line means, and the right most curve is for the estimate of the overall mean. In all cases, the generating model
included Aa, Ma, and AaAd. Dashed lines indicate the generating parameter values. Effect sizes: A = 0.25, B = 0.5, C = 1, D = 2. Iterations
that correctly (E) or incorrectly (F) identified the generating model are shown separately for simulations in which effect size is 2.
Analysis of female sperm receptacle length (empirical
dataset 1) provides an example with low model selection un-
certainty. Although no single model had a wi sufficient to ignore
model selection uncertainty (95% confidence set includes 82 mod-
els with the highest wi = 0.234), two CGEs exhibit vi scores much
higher than any others. These two CGEs (Aa and CaXa) had the
largest estimated magnitudes of 0.0324 ± 0.0615 and 0.214 ±0.0787 and high vi scores of 0.98 and 0.89, respectively. All other
CGEs had parameter estimates at least sevenfold smaller and had
standard errors overlapping zero (Fig. 2).
Analysis of male sperm length (empirical dataset 2) provides
an example of intermediate model selection uncertainty. In this
case, no single model was found to be best (95% confidence set in-
cludes 302 models with the highest wi = 0.154). However, a clear
signal from vi scores suggests that Aa and CaYa are important
contributors to line means (0.91 and 0.79 vi scores, respectively).
These two CGEs also had the largest estimated magnitudes of
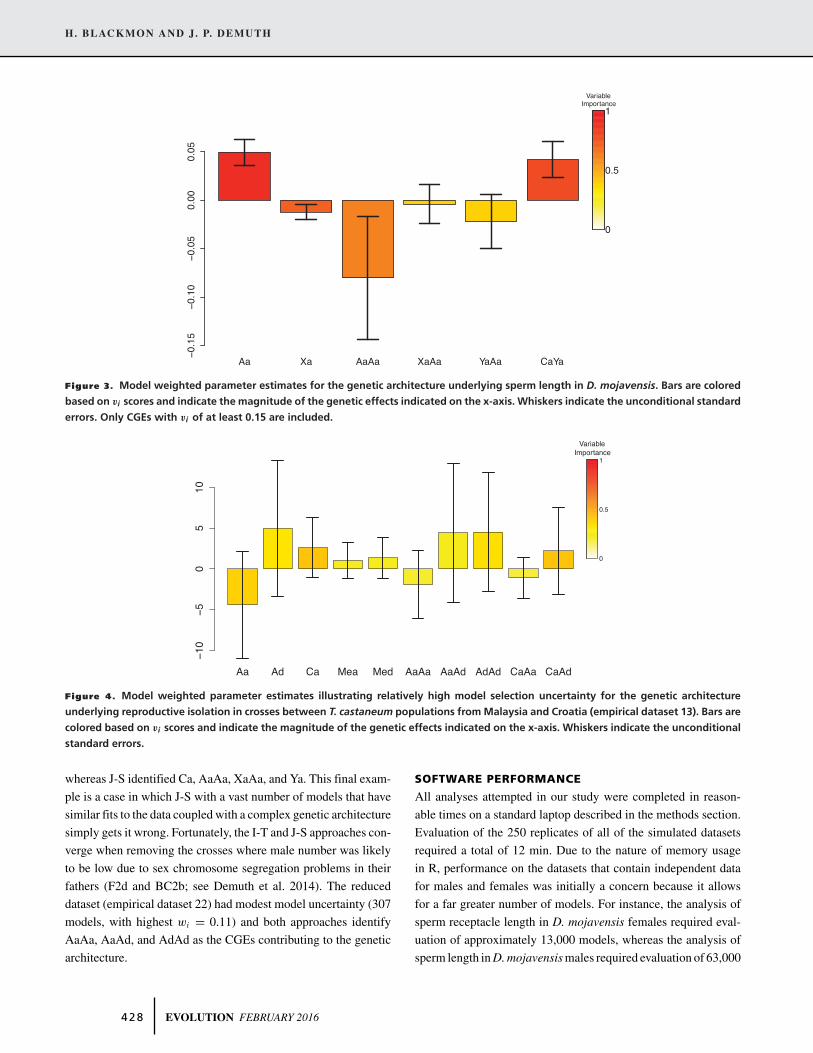
0.0495 ± 0.0133 and 0.0420 ± 0.0184 (Fig. 3). Most other CGEs
estimated for this dataset had either low vi scores, or the effect
size estimate was comparatively small –0.0123 ± 0.0077. This is
an example of the ability of the I-T approach to recover complex
genetic architectures that were missed when a single best model
was selected. The intermediate level of uncertainty in which no
single model is defined as far superior (Table 2) but a clear signal
as to which CGEs are important was the most common result in
our empirical analyses, found in datasets 1–10, 12, and 14–22.
The LCA for crosses between T. castaneum populations from
Malaysia and Croatia (empirical dataset 13) is an example in
which we find relatively high model selection uncertainty. The
95% confidence set of models required the inclusion of 363 mod-
els and the highest wi = 0.034 (Table 2). The vi scores were also
low, with the highest being assigned to Ca and CaAd both with
EVOLUTION FEBRUARY 2016 4 2 5

H. BLACKMON AND J. P. DEMUTH
Table 1. Mean variable importance (vi ) and parameter estimates for 250 datasets generated under simulation condition 5.
Variable Variable importance Estimate/true value Unconditional SE
Mean 1.000 4.746/4.58 0.773Aa 0.993 0.994/1.00 0.016Ad 0.659 0.662/1.00 1.545Ca 0.005 0.007/0.00 0.007Ma 0.997 1.000/1.00 0.013Md 0.005 0.000/0.00 0.005AaAa 0.66 0.827/1.00 0.774AaAd 0.996 0.998/1.00 0.035AdAd 0.67 1.173/1.00 0.774CaAa 0.02 0.007/0.00 0.004CaAd 0.014 –0.007/0.00 0.003
Bold lines indicate variables included in the generating model.
Figure 2. Model weighted parameter estimates for sperm receptacle length in D. mojavensis. Bars are colored based on vi scores and
indicate the magnitude of the genetic effects indicated on the x-axis. Whiskers indicate the unconditional standard errors.
scores of 0.43. Furthermore, the standard error of the estimates
for all CGEs overlap zero (Fig. 4). This dataset illustrates that
in some cases the degree of model selection uncertainty can be
so high that LCA is not able to recover the genetic architecture
of the trait of interest with the cohorts available. The only other
empirical dataset in our analyses that showed a similar level of
uncertainty was dataset 11, which contained 310 models in the
95% confidence set and all CGE estimates failed to exclude zero.
Finally, analyses of pollen production and male offspring
number (empirical datasets 19 and 21; Table 2) in hybrids be-
tween S. latifolia and S. diclinis represent two examples in which
there was extreme model uncertainty. Compared to the original
J-S analyses these two datasets yielded the same and different es-
timates of genetic architecture respectively. The types of crosses
in the Silene study were carefully chosen to maximize the number
of CGEs that could be tested and consequently resulted in a model
space of greater than 100,000 potential genetic architectures. The
95% confidence set of models for pollen production (empirical
dataset 19) included 2524 models and the highest wi = 0.047
(Table 2). Despite the high model uncertainty, the CGEs with
highest vi scores (AaAd and XaAa) were the same as those iden-
tified by the J-S approach and the effect size estimates from the
two approaches were statistically indistinguishable. In contrast,
analysis of male offspring number (empirical dataset 21), which
also had very high model uncertainty (3650 models in the 95%
confidence set with highest wi = 0.14), did not identify the exact
CGEs identified as significant using the “right” model from the
J-S approach. The I-T and J-S approaches both identify Ad and
AaYa as important, but with different effect size estimates. The
I-T approach also identified AdAd, CaAa, and CaYa as important,
4 2 6 EVOLUTION FEBRUARY 2016

I -T APPROACH TO LINE CROSS ANALYSIS
Ta
ble
2.
Para
met
eres
tim
ates
for
mo
del
so
fth
eg
enet
icar
chit
ectu
refr
om
emp
iric
ald
ata.
Dat
aset
Phen
otyp
em
ax.w
iC
SSM
Aa
Ad
Ma
Md
Ca
Xa
AaA
aA
aAd
AdA
dC
aAa
CaA
dC
aXa
CaY
aX
aAa
XaA
dY
aA
aYa
1aI-
TSp
erm
rec.
0.23
482
4.58
0.32
0.00
0.01
0.00
0.00
−0.0
10.
033.
010.
00−0
.01
0.00
−0.2
14†
−−0
.03
††
J-S
nr0.
31−
−−
−−
−−
−†
††
†−
††
†
2aI-
TSp
erm
0.15
430
21.
880.
050.
012.
15−4
.63
−0.2
1−0
.01
−0.0
80.
00−0
.01
−0.
000.
000.
040.
00†
††
J-S
1.73
0.05
0.30
−−
−−0
.02
0.07
−−0
.20
††
††
−†
††
3bI-
TO
ffsp
ring
0.19
213
548
.71
−2.9
81.
862.
16−4
.64
−0.2
1†
−22.
21−4
.49
−27.
230.
112.
37†
††
††
†
J-S
58.9
9−1
.88
−38.
12−
−−
†−3
0.50
−−
−−
††
††
††
4bI-
TO
ffsp
ring
0.50
811
033
.85
−18.
276.
0810
.27
−10.
87−0
.11
†−1
5.67
24.6
7−2
.20
0.02
0.21
††
††
††
J-S
21.7
4−2
3.29
17.7
511
.69
−7.4
1−
†−
32.9
4−
−−
††
††
††
5bI-
TO
ffsp
ring
0.10
128
063
.92
0.51
−38.
640.
34−7
.42
−0.4
8†
−30.
628.
456.
190.
93−0
.85
††
††
††
J-S
78.4
7−
−51.
65−
−12.
95−
†−4
5.21
14.0
2−
−−
††
††
††
6bI-
TO
ffsp
ring
0.07
214
581
.26
5.10
−4.2
8−1
.32
0.87
0.08
†1.
61−1
.30
−3.3
2−2
5.04
−0.0
5†
††
††
†
J-S
36.6
922
.18
71.8
2−7
.76
16.1
4−1
.79
†23
.11
−18.
53−3
9.72
−−
††
††
††
7bI-
TO
ffsp
ring
0.06
216
41.9
2−1
.96
9.90
−1.6
425
.50
−1.7
6†
−5.3
1−2
1.72
4.70
5.53
−0.0
8†
††
††
†
J-S
42.6
2−
−−6
.32
25.1
7−
†−
−26.
4718
.03
−−
††
††
††
8bI-
TO
ffsp
ring
0.38
113
661
.26
−40.
07−0
.71
12.0
02.
0618
.95
†−8
.95
106.
4−1
.28
−0.9
4−3
6.17
††
††
††
J-S
65.8
8−2
1.81
−1.2
57.
683.
111.
07†
−17.
6777
.54
−17.
31−
−†
††
††
†
9bI-
TO
ffsp
ring
0.05
221
921
.46
−1.6
97.
910.
620.
960.
12†
14.0
649
.19
6.43
−0.2
81.
59†
††
††
†
J-S
−13.
41−1
3.65
56.2
98.
8911
.74
−†
52.0
642
.42
−−
−†
††
††
†
10b
I-T
Off
spri
ng0.
432
583.
6620
.25
51.8
5−1
1.96
−0.2
41.
88†
16.6
1−4
4.70
−29.
04−0
.12
−3.1
9†
††
††
†
J-S
−22
.55
63.2
3−1
2.78
−−
†19
.41
−47.
89−3
7.25
−−
††
††
††
11b
I-T
Off
spri
ng0.
029
310
31.8
8−2
.28
13.5
10.
592.
00−0
.07
†8.
09−0
.51
0.91
−0.5
62.
41†
††
††
†
J-S
−−
54.3
0−
10.7
4−
†39
.62
−−
−−
††
††
††
12b
I-T
Off
spri
ng0.
3211
9−4
1.88
−0.5
297
.15
11.5
516
.45
−0.0
9†
80.9
37.
05−4
.73
−1.7
9−0
.13
††
††
††
J-S
−69.
54−1
8.07
151.
4314
.11
23.0
2−1
.54
†11
4.0
45.7
8−3
3.29
−−
††
††
††
13b
I-T
Off
spri
ng0.
034
363
27.9
1−4
.38
4.97
1.03
1.36
2.60
†−1
.93
4.44
4.52
−1.0
92.
22†
††
††
†
J-S
25.5
1−1
4.01
−−
5.77
6.40
†−
17.5
914
.56
−−
††
††
††
14b
I-T
Off
spri
ng0.
378
2097
.79
−0.0
7−1
81.6
30.
04−1
6.67
0.01
†−3
8.94
−0.2
415
8.1
0.02
−1.5
4†
††
††
†
J-S
98.5
7−0
.66
−183
.39
2.34
−16.
32−2
.06
†−3
9.44
−3.7
415
9.1
−−
††
††
††
15b
I-T
Off
spri
ng0.
2325
63.6
24.
72−1
23.4
5−0
.83
0.06
−4.4
0†
−4.1
961
.34
131.
3−0
.01
−2.3
5†
††
††
†
J-S
78.5
68.
31−1
54.1
8−3
.56
−−5
.39
†−1
9.16
57.2
414
7.1
−−
††
††
††
16b
I-T
Off
spri
ng0.
193
1673
.56
34.7
5−1
48.6
8−1
7.62
−0.2
5−0
.42
†−0
.15
−0.1
314
2.2
2.52
−2.2
6†
††
††
†
J-S
76.8
1−
−147
.04
−15.
72−3
.75
−3.0
2†
−65
.02
136.
7−
−†
††
††
†
17b
I-T
Off
spri
ng0.
089
184
40.6
3−7
.77
−0.1
02.
101.
201.
20†
−16.
77−1
0.22
−1.1
314
.39
2.18
††
††
††
J-S
39.0
7−9
.75
−−
−5.
66†
−−2
4.41
−−
−†
††
††
†
18c
I-T
Ovu
le0.
039
2211
2.19
−0.3
440.
000.
000.
000.
00−0
.02
0.00
−0.0
5−0
.01
0.00
0.00
0.00
−−0
.01
0.05
−−
J-S
2.19
−0.3
82−
−−
−−
−−
−−
−−
−−
−−
−19
cI-
TPo
llen
0.04
725
240.
595
0.00
−0.0
5−
−0.0
1−0
.01
−0.0
10.
02−0
.22
0.00
0.00
0.02
0.01
0.00
0.25
−0.0
50.
000.
01J-
S0.
558
−−
−−
−−
−−0
.312
−−
−−
−0.
33−
−−
20c
I-T
Num
ber♀
0.02
153
8512
.45
0.05
−0.4
91.
67−0
.23
−0.3
9−0
.03
−0.2
60.
020.
02−0
.05
−0.2
40.
28−
−1.4
2−0
.22
−−
J-S
nr−
−3.
898
11.0
5−0
.93
−−
−−
−−
−−
−−
−−
21c
I-T
Num
ber♂
0.14
936
506.
150.
46−1
0.27
−0.
170.
120.
070.
32−1
.20
9.93
−1.1
20.
05−0
.17
0.61
0.71
−0.0
2−0
.22
0.66
J-S
nr−
12.6
5−
−−2
.45
−47
.49
−−
−−
−−
−12.
135.
591.
93−9
.08
22c
I-T
Num
ber♂
0.11
230
73.
760.
44−2
.49
−0.
320.
330.
854.
78−8
.69
4.33
−0.5
30.
01−0
.32
−0.0
7−0
.31
0.02
0.04
0.29
J-S
nr−
−−
−−
−10
.62
−4.6
56.
85−
−−
−−
−−
−
†co
mp
osi
teef
fect
no
tin
clu
ded
inan
alys
is;-
com
po
site
effe
ctn
ot
incl
ud
edin
the
esti
mat
ing
mo
del
(s);
nr:
no
tre
po
rted
;bo
ldin
dic
ates
vi>
0.50
;ad
dit
ion
alin
form
atio
nab
ou
to
rig
inal
dat
aar
ein
tab
leS2
.
a:M
iller
etal
2003
;b:D
emu
than
dW
ade
2007
a&
Dem
uth
and
Wad
e20
07b
;c:D
emu
thet
al20
14.
EVOLUTION FEBRUARY 2016 4 2 7
H. BLACKMON AND J. P. DEMUTH
Figure 3. Model weighted parameter estimates for the genetic architecture underlying sperm length in D. mojavensis. Bars are colored
based on vi scores and indicate the magnitude of the genetic effects indicated on the x-axis. Whiskers indicate the unconditional standard
errors. Only CGEs with vi of at least 0.15 are included.
Figure 4. Model weighted parameter estimates illustrating relatively high model selection uncertainty for the genetic architecture
underlying reproductive isolation in crosses between T. castaneum populations from Malaysia and Croatia (empirical dataset 13). Bars are
colored based on vi scores and indicate the magnitude of the genetic effects indicated on the x-axis. Whiskers indicate the unconditional
standard errors.
whereas J-S identified Ca, AaAa, XaAa, and Ya. This final exam-
ple is a case in which J-S with a vast number of models that have
similar fits to the data coupled with a complex genetic architecture
simply gets it wrong. Fortunately, the I-T and J-S approaches con-
verge when removing the crosses where male number was likely
to be low due to sex chromosome segregation problems in their
fathers (F2d and BC2b; see Demuth et al. 2014). The reduced
dataset (empirical dataset 22) had modest model uncertainty (307
models, with highest wi = 0.11) and both approaches identify
AaAa, AaAd, and AdAd as the CGEs contributing to the genetic
architecture.
SOFTWARE PERFORMANCE
All analyses attempted in our study were completed in reason-
able times on a standard laptop described in the methods section.
Evaluation of the 250 replicates of all of the simulated datasets
required a total of 12 min. Due to the nature of memory usage
in R, performance on the datasets that contain independent data
for males and females was initially a concern because it allows
for a far greater number of models. For instance, the analysis of
sperm receptacle length in D. mojavensis females required eval-
uation of approximately 13,000 models, whereas the analysis of
sperm length in D. mojavensis males required evaluation of 63,000
4 2 8 EVOLUTION FEBRUARY 2016

I -T APPROACH TO LINE CROSS ANALYSIS
Increasing Model Complexity ↓ ↓
Incr
easi
ng M
odel
Com
plex
ity→
0.00
0.508Akaike WeightsA
Increasing Model Complexity
Incr
easi
ng M
odel
Com
plex
ity→
0.00
0.072Akaike WeightsB
Figure 5. Visual depictions of model space for the genetic architecture of reproductive isolation in T. castaneum. Each box represents a
genetic architecture model is colored to reflect its wi . The scale ranges from lightest for models with wi of zero to darkest for those with
the maximum value for the analysis. Models are organized with the simplest model at the lower left and increase in complexity upward
and to the left, that is, all one-parameter models are on the bottom row followed by two-parameter models when the right edge of
the graph is reached a second row is added on top of the first. (A) Results from the analysis of dataset 4 showing low model selection
uncertainty. (B) Results from the analysis of dataset 6 showing considerable model selection uncertainty.
models. These analyses required only 2 and 5 min, respectively,
to complete. The most computationally intensive search among
our analyses (Silene hybrid female number) required evaluation
of 192,984 models and took 49 min.
DiscussionComparing the original results from of all 22 empirical datasets
with those from SAGA suggests that the I-T approach is more
successful than traditional approaches at identifying higher order
CGEs. For example, nine of the datasets had one or more epistatic
CGE (11 in total) not identified with the J-S test that had a vi
> 0.5 in the I-T analysis. One datasets had maternal effects not
identified with the J-S test that had vi > 0.5 in the I-T analysis, and
only one dataset had a nonepistatic autosomal CGE identified with
the I-T approach but not with the J-S test. These results indicate
that the traditional version of the J-S test may underestimate the
contribution of epistatic interactions in determining phenotypes.
Finding a larger role for epistasis in empirical datasets is
particularly important since, as highlighted in the introduction, it
affects our perception of how adaptation and speciation are likely
to occur in nature. For instance, if epistasis is a common feature
of the genetic architecture of variation within species, then small
variations in allele frequency among populations with limited
gene flow may result in rapid genetic divergence among those
populations even if selective pressures are similar (Goodnight
1987, 1988; Wade and Goodnight 1998). Because not all types of
epistasis are equally disposed to fostering population divergence
and or speciation (Demuth and Wade 2005), the methods devel-
oped in SAGA are especially important because they provide a
much more powerful way to differentiate among all the compo-
nents of complex genetic architectures. The utility of SAGA and
LCA will be particularly powerful for systems in which there is
a continuum of divergence among populations as well as species
that are in the so called “Goldilocks zone” (Demuth et al. 2014) in
which viable hybrids can still be produced. In such systems LCA
allows for the investigation of how architectures change as traits
diverge and reproductive isolation arises between species.
There has been concern that comparing the large number
of possible models in LCA experiments may lead to spurious
results (Bieri and Kawecki 2003). This concern seems to trace
back to discussions of “data dredging” (Burnham and Andersen
1998; Burnham and Anderson 2002). Described in the context of
ecological studies, data dredging is the process of measuring and
searching for significance among a great many variables without
a clear a priori decision of what variables may be biologically
important. Burnham and Anderson encourage careful selection
of a reduced set of variables based on a sound understanding of
the biology involved and by doing this reducing the total number
of models that must be evaluated (2002). In LCA, the variables
are known CGEs, and each one describes a biologically plausible
component of the genetic architecture underlying the phenotypes
of the observed cohorts. The goal of LCA, finding the set of CGEs
that best explains the observed data, can best be accomplished if
we examine all possible combinations of CGEs. Assuming the
necessary cohorts are available, the I-T approach accomplishes
this goal.
EVOLUTION FEBRUARY 2016 4 2 9

H. BLACKMON AND J. P. DEMUTH
Existing approaches to LCA share two common shortcom-
ings: (1) there is no framework to adequately describe model
selection uncertainty, and (2) there is no way to quantify the
impact of model uncertainty on the estimated contributions of
individual CGEs. The importance of model selection uncertainty
is highlighted by our analysis of empirical data in which 21 of 22
datasets showed nontrivial model selection uncertainty. The abil-
ity to quantify model selection uncertainty is perhaps one of the
most important benefits of turning to an I-T approach. Previous
analyses (even those that implemented AIC to choose a model)
have presented only results conditional on specific models, and
have largely ignored uncertainty in model selection. Furthermore,
hypothesis-testing approaches do not provide us with a way to
rank models relative to one another. For instance the result of the
J-S approach cannot tell us if one or many models are almost as
good as the best model identified. Akaike weights and evidence
ratios offer a natural way to do this.
The maximum wi of all models tested as well as the num-
ber of models required to produce a 95% confidence set are two
simple metrics that quantify the degree of uncertainty in model
selection. The maximum wi we recorded ranged from 0.02 to
0.98 with a mean maximum wi = 0.21. The number of mod-
els required to construct a 95% confidence model set varied
accordingly, ranging from 82 in the case of sperm receptacle
length in D. mojavensis (dataset 1) to 5385 models for the num-
ber of females produced in crosses between species of Silene
(dataset 20, Table 2). We illustrate examples in which model se-
lection uncertainty is low (dataset 4; Fig. 5A) and high (dataset 6;
Fig. 5B). The model uncertainty metrics and visual depiction of
model space allow for a more realistic interpretation of LCA ex-
periments than previous approaches.
By implementing an I-T approach and examining all models
possible given the data, we also resolve the issue of finding the
best possible model. The potential of failing to find the best model
was illustrated in our analysis of dataset 1 in which we found a
model that outperformed all other possible models that the J-S test
had failed to find. However, the ultimate goal of LCA is to find the
composite genetic effects responsible for a phenotype. Previous
methods depend on identifying the best model and interpreting
the CGEs that are included in that model (conditional effects).
With SAGA we get accurate estimates of the CGEs that are not
dependent on the ability to specify one overall model as best, and
our analysis of simulated datasets indicates that even when we
are unable to identify the generating model our I-T approach is
still able to identify the generating CGEs. The I-T approach to
LCA we have presented eliminates issues in existing approaches
and offers a more powerful and nuanced examination of the ge-
netic architecture of quantitative traits. Furthermore, estimates of
CGEs are unbiased and confidence intervals incorporate model
selection uncertainty, a characteristic impossible under previous
approaches. Finally, the ability to visualize the distribution of
Akaike weights of all possible models can provide a strong indi-
cation of whether LCA of the phenotype of interest is informative.
We recommend that future studies assess model uncertainty and
shift away from making estimates that are conditional on a single
model.
AKNOWLEDGMENTSWe thank R. Shaw, D. Adams, and two anonymous reviewers for com-ments that greatly improved the quality of this manuscript.
LITERATURE CITEDArmbruster, P., W. E. Bradshaw, and C. M. Holzapfel. 1997. Evolution of
the genetic architecture underlying fitness in the pitcher-plant mosquito,Wyeomyia smithii. Evolution 51:451–458.
Barton, N. 1995. A general model for the evolution of recombination. Genet.Res. 65:123–144.
Basford, K. E., and I. H. De Lacy. 1979. The use of matrix specifications indefining gene action in genotypic value models and generation meananalysis. Theor. Appl. Genetics 55:225–229.
Bentz, B. J., R. R. Bracewell, K. E. Mock, and M. E. Pfrender. 2011. Geneticarchitecture and phenotypic plasticity of thermally-regulated traits in aneruptive species, Dendroctonus ponderosae. Evol. Ecol. 25:1269–1288.
Bergman, A., and M. L. Siegal. 2003. Evolutionary capacitance as a generalfeature of complex gene networks. Nature 424:549–552.
Bieri, J., and T. J. Kawecki. 2003. Genetic architecture of differences betweenpopulations of cowpea weevil (Callosobruchus maculatus) evolved inthe same environment. Evolution 57:274.
Box, G. E., and N. R. Draper. 1987. Empirical model-building and responsesurfaces. John Wiley & Sons, New York.
Bruce, A. 1910. The Mendelian theory of heredity and the augmentation ofvigor. Science 32:627–628.
Burnham, K. P., and S. B. Andersen. 1998. Model selection and inference: apractical information-theoretic approach. Springer-Verlag, New York.
Burnham, K. P., and D. R. Anderson. 2002. Model selection and multimodelinference: a practical information-theoretic approach. Springer, NewYork.
Byers, D. and D. Waller. 1999. Do plant populations purge their genetic load?Effects of population size and mating history on inbreeding depression.Annu. Rev. Ecol. Evol. Syst. 479–513.
Cabot, E. L., A. W. Davis, N. A. Johnson, and C. I. Wu. 1994. Geneticsof reproductive isolation in the Drosophila simulans clade: complexepistasis underlying hybrid male sterility. Genetics 137:175–189.
Carlborg, O., L. Jacobsson, P. Ahgren, P. Siegel, and L. Andersson. 2006.Epistasis and the release of genetic variation during long-term selection.Nat. Genet. 38:418–420.
Carson, H. L., and A. R. Templeton. 1984. Genetic revolutions in relationto speciation phenomena: the founding of new populations. Ann. Rev.Ecol. Evol. Syst. 97–131.
Carter, A. J., J. Hermisson, and T. F. Hansen. 2005. The role of epistatic geneinteractions in the response to selection and the evolution of evolvability.Theor. Popul. Biol. 68:179–196.
Cavalli, L. L. 1952. An analysis of linkage in quantitative inheritance. Papersread at a colloquium held at the Institute of Animal Genetics EdinburghUniversity under the auspices of the Agricultural Research Council. HMStationery Office London.
Charlesworth, B. 1990. Mutation-selection balance and the evolutionary ad-vantage of sex and recombination. Genet. Res. 55:199–221.
Charlesworth, B., and D. Charlesworth. 1999. The genetic basis of inbreedingdepression. Genet. Res. 74:329–340.
4 3 0 EVOLUTION FEBRUARY 2016

I -T APPROACH TO LINE CROSS ANALYSIS
Charlesworth, D., and B. Charlesworth. 1990. Inbreeding depression withheterozygote advantage and its effect on selection for modifiers changingthe outcrossing rate. Evolution 870–888.
Coyne, J. A., N. H. Barton, and M. Turelli. 1997. Perspective: a critique ofSewall Wright’s shifting balance theory of evolution. Evolution 51:643–671.
Crow, J. F. 1948. Alternative hypotheses of hybrid vigor. Genetics 33:477.Crow, J. F., and M. Kimura. 1970. An introduction to population genetics
theory. Harper and Row, New York.de Visser, J. A. G. M., J. Hermisson, G. P. Wagner, L. A. Meyers, H. Bagheri-
Chaichian, J. L. Blanchard, L. Chao, J. M. Cheverud, S. F. Elena, andW. Fontana. 2003. Perspective: evolution and detection of genetic ro-bustness. Evolution 57:1959–1972.
Demuth, J. P., and M. J. Wade. 2005. On the theoretical and empirical frame-work for studying genetic interactions within and among species. Am.Nat. 165:524–536.
———. 2006. Experimental methods for measuring gene interactions. Annu.Rev. Ecol. Evol. Syst. 37:289–316.
———. 2007a. Population differentiation in the beetle Tribolium castaneum.II. Haldane’s rule and incipient speciation. Evolution 61:694–699.
———. 2007. Population differentiation in the beetle Tribolium castaneum.I. Genetic architecture. Evolution 61:494–509.
Demuth, J. P., R. J. Flanagan, and L. F. Delph. 2014. Genetic architectureof isolation between two species of Silene with sex chromosomes andHaldane’s rule. Evolution 68:332–342.
Derksen, S., and H. J. Keselman. 1992. Backward, forward and stepwiseautomated subset selection algorithms; frequency of obtaining authenticand noise variables. Br. J. Math. Stat. Psychol. 45:265–282.
Dobzhansky, T. 1937. Genetics and the origin of species. Columbia UniversityPress, New York.
Edmands, S. 1999. Heterosis and outbreeding depression in interpopula-tion crosses spanning a wide range of divergence. Evolution 53:1757–1768.
Falconer, D. S., and T. F. Mackay. 1996. Introduction to quantitative genetics.Longman Scientific & Technical, Harlow, U.K.
Felix, M.-A., and M. Barkoulas. 2015. Pervasive robustness in biologicalsystems. Nat. Rev. Genet. 16:483–496.
Fenster, C. B., and L. F. Galloway. 2000. Inbreeding and outbreeding de-pression in natural populations of Chamaecrista fasciculata (Fabaceae).Conserv. Biol. 14:1406–1412.
Fisher, R. A. 1941. Average excess and average effect of a gene substitution.Ann. Eugen. 11:53–63.
———. 1958. The genetical theory of natural selection. Dover Publications,New York.
Flatt, T. 2005. The evolutionary genetics of canalization. Q. Rev. Biol. 80:287–316.
Fox, C. W., M. E. Czesak, and W. G. Wallin. 2004. Complex genetic architec-ture of population differences in adult lifespan of a beetle: nonadditiveinheritance, gender differences, body size and a large maternal effect. JEvol Biol 17:1007–1017.
Fox, C. W., J. D. Wagner, S. Cline, F. A. Thomas, and F. J. Messina. 2011.Rapid evolution of lifespan in a novel environment: sex-specific re-sponses and underlying genetic architecture. Evol. Biol. 38:182–196.
Fritz, R. S., C. G. Hochwender, B. R. Albrectsen, and M. E. Czesak. 2006.Fitness and genetic architecture of parent and hybrid willows in commongardens. Evolution 60:1215.
Fuller, R. C. 2008. Genetic incompatibilities in killifish and the role of envi-ronment. Evolution 62:3056–3068.
Galloway, L. F., and C. B. Fenster. 2001. Nuclear and cytoplasmic con-tributions to intraspecific divergence in an annual legume. Evolution55:488–497.
Gavrilets, S. 1997. Evolution and speciation on holey adaptive landscapes.Trends Ecol. Evol. 12:307–312.
———. 2003. Perspective: models of speciation: what have we learned in 40years? Evolution 57:2197–2215.
Gilchrist, A. S., and L. Partridge. 1999. A comparison of the genetic basisof wing size divergence in three parallel body size clines of Drosophilamelanogaster. Genetics 153:1775–1787.
Goodnight, C. J. 1987. On the effect of founder events on epistatic geneticvariance. Evolution 41:80–91.
———. 1988. Epistasis and the effect of founder events on the additive geneticvariance. Evolution 42:441–454.
———. 2000. Quantitative trait loci and gene interaction: the quantitativegenetics of metapopulations. Heredity 84:587–598.
Hayman, B. I. 1958. The seperation of epistatic from additive and dominancevariation in generation means. Heredity 12:371–390.
Hurvich, C. M., and C.-L. Tsai. 1989. Regression and time series modelselection in small samples. Biometrika 76:297–307.
Jacobs, M. S. and M. J. Wade. 2003. A synthetic review of the theory ofgynodioecy. Am. Nat. 161:837–851.
Lair, K. P., W. E. Bradshaw, and C. M. Holzapfel. 1997. Evolutionary di-vergence of the genetic architecture underlying photoperiodism in thepitcher-plant mosquito, Wyeomyia smithii. Genetics 147:1873–1883.
Lande, R., and S. J. Arnold. 1983. The measurement of selection on correlatedcharacters. Evolution 37:1210–1226.
Lande, R., and D. W. Schemske. 1985. The evolution of self-fertilization andinbreeding depression in plants. I. Genetic models. Evolution 24–40.
Lynch, M. 1991. The genetic interpretation of inbreeding depression andoutbreeding depression. Evolution 622–629.
Lynch, M., and B. Walsh. 1998. Genetics and analysis of quantitative traits.Sinauer Associates, Sunderland, MA.
Mather, K. and J. L. Jinks. 1982. Biometrical genetics: the study of continuousvariation. Chapman and Hall, Lond.
McQuarrie, A. D., and C.-L. Tsai. 1998. Regression and time series modelselection. World Scientific Publishing Company, Singapore.
Miller, G. T., W. T. Starmer, and S. Pitnick. 2003. Quantitative genetic analysisof among-population variation in sperm and female sperm-storage organlength in Drosophila mojavensis. Genet. Res. 81:213–220.
Moehring, A. J., A. Llopart, S. Elwyn, J. A. Coyne, and T. F. Mackay.2006. The genetic basis of postzygotic reproductive isolation betweenDrosophila santomea and D. yakuba due to hybrid male sterility. Genet-ics 173:225–233.
Moorad, J. A., and M. J. Wade. 2005. A genetic interpretation of the variationin inbreeding depression. Genetics 170:1373–1384.
Muller, H. J. 1940. Bearing of the Drosophila work on systematics. Pp. 185–268 in J. Huxley, ed. The new systematics. Clarendon Press, Oxford,U.K.
———. 1942. Isolating mechanisms, evolution and temperature. Biol. Symp.6:71–125.
Orr, H. A. 2001. The genetics of species differences. Trends Ecol. Evol.16:343–350.
Orr, H. A., and M. Turelli. 2001. The evolution of postzygotic isolation: ac-cumulating Dobzhansky-Muller incompatibilities. Evolution 55:1085–1094.
Peters, A., and C. Lively. 1999. The Red Queen and fluctuating epistasis:a population genetic analysis of antagonistic coevolution. Am. Nat.154:393–405.
R Development Core Team. 2013. R: a language and environment for statisticalcomputing. R Foundation for Statistical Computing, Vienna, Austria.
Rice, S. H. 1998. The evolution of canalization and the breaking of von Baer’slaws: modeling the evolution of development with epistasis. Evolution647–656.
EVOLUTION FEBRUARY 2016 4 3 1

H. BLACKMON AND J. P. DEMUTH
RStudio. 2012. RStudio: integrated development environment for R (Version0.98.976). Boston, MA.
Schierup, M. H., and F. B. Christiansen. 1996. Inbreeding depression andoutbreeding depression in plants. Heredity 77:461–468.
Schiffer, M., A. S. Gilchrist, and A. A. Hoffmann. 2006. The contrastinggenetic architecture of wing size, viability, and development time ina rainforest species and its more widely distributed relative. Evolution60:106.
Svensson, E., and R. Calsbeek. 2012. The adaptive landscape in evolutionarybiology. OUP, Oxford, U.K.
Tymchuk, W. E., L. F. Sundstrom, and R. H. Devlin. 2007. Growth and survivaltrade-offs and outbreeding depression in rainbow trout (Oncorhynchusmykiss). Evolution 61:1225–1237.
van Heerwaarden, B., Y. Willi, T. N. Kristensen, and A. A. Hoffmann. 2008.Population bottlenecks increase additive genetic variance but do notbreak a selection limit in rain forest Drosophila. Genetics 179:2135–2146.
Wade, M. J. 2000. Epistasis as a genetic constraint within popualtions andan accelerant of adaptive divergence among them. P. 213–231 in J. B.
Wolf, E. D. Brodie, and M. J. Wade, eds. Epistasis and the evolutionaryprocess. Oxford Univ. Press, Oxford, U.K.; New York.
———. 2002. A gene’s eye view of epistasis, selection and speciation. J.Evol. Biol. 15:337–346.
Wade, M. J., and C. J. Goodnight. 1998. Perspective: the theories of Fisherand Wright in the context of metapopulations: when nature does manysmall experiments. Evolution 52:1537–1553.
Whittingham, M. J., P. A. Stephens, R. B. Bradbury, and R. P. Freckleton. 2006.Why do we still use stepwise modelling in ecology and behaviour? J.Anim. Ecol. 75:1182–1189.
Wilkinson, L. 1979. Tests of significance in stepwise regression. Psychol.Bull. 86:168–174.
Wolf, J. B., E. D. Brodie, and M. J. Wade. 2000. Epistasis and the evolutionaryprocess. Oxford Univ. Press, New York.
Wright, S. 1931. Evolution in Mendelian populations. Genetics 16:97–159.
Associate Editor: D. AdamsHandling Editor: R. Shaw
Supporting InformationAdditional Supporting Information may be found in the online version of this article at the publisher’s website:
Table S1. Matrix of composite genetic effects included in SAGA.Table S2. Detailed information on the identity of crosses reanalyzed.
4 3 2 EVOLUTION FEBRUARY 2016
Related Documents