This article appeared in a journal published by Elsevier. The attached copy is furnished to the author for internal non-commercial research and education use, including for instruction at the authors institution and sharing with colleagues. Other uses, including reproduction and distribution, or selling or licensing copies, or posting to personal, institutional or third party websites are prohibited. In most cases authors are permitted to post their version of the article (e.g. in Word or Tex form) to their personal website or institutional repository. Authors requiring further information regarding Elsevier’s archiving and manuscript policies are encouraged to visit: http://www.elsevier.com/copyright

Welcome message from author
This document is posted to help you gain knowledge. Please leave a comment to let me know what you think about it! Share it to your friends and learn new things together.
Transcript

This article appeared in a journal published by Elsevier. The attachedcopy is furnished to the author for internal non-commercial researchand education use, including for instruction at the authors institution
and sharing with colleagues.
Other uses, including reproduction and distribution, or selling orlicensing copies, or posting to personal, institutional or third party
websites are prohibited.
In most cases authors are permitted to post their version of thearticle (e.g. in Word or Tex form) to their personal website orinstitutional repository. Authors requiring further information
regarding Elsevier’s archiving and manuscript policies areencouraged to visit:
http://www.elsevier.com/copyright

Author's personal copy
An inexpensive flow-through laser nephelometer for the detection of naturalcolloids and manufactured nanoparticles
Richard B. Greswell a,*, Syed H. Rahman b, Mark O. Cuthbert a, John H. Tellam a
a School of Geography, Earth and Environmental Sciences, University of Birmingham, Edgbaston, Birmingham B15 2TT, UKb Department of Geology, Jahangirnagar University, Dhaka 132, Bangladesh
a r t i c l e i n f o
Article history:Received 25 September 2009Received in revised form 17 February 2010Accepted 22 April 2010
This manuscript was handled by L. Charlet,Editor-in-Chief, with the assistance ofBernhard Wehrli, Associate Editor
Keywords:NephelometerColumn experimentManufactured nanoparticlesInexpensiveTurbidityHydrogeology
s u m m a r y
The transport and fate of colloidal particles is coming under increasing scrutiny, largely because of theexpected rapid expansion in the production of manufactured nanoparticles and because of possible inter-actions of natural and manufactured nanoparticles with pollutants. Risk assessments of engineered nano-particles may only be carried out if means exist to quantify the processes that control the fate of theparticles as they interact with materials in the environment. For aqueous systems, there are several ana-lytical methods available that may be utilised to classify and quantify a colloidal suspension but wherethe particles are of a generally uniform nature, and in sufficient number, the turbidity of the fluid pro-vides an accurate measurement of concentration. In order to investigate the transport of manufacturednanoparticles through small saturated rock columns, a simple and inexpensive laser nephelometer wasdeveloped which incorporates a low volume flow-through cell in order to provide a continuous recordof the elution of particles from the column. The design, construction and evaluation of the device are pre-sented together with example data. Although designed specifically for the laboratory study of colloidtransport through columns, the device may be readily adapted for other purposes in the field or labora-tory wherever an inexpensive and robust continuous means of turbidity measurement is required.
Crown Copyright � 2010 Published by Elsevier B.V. All rights reserved.
1. Introduction
The requirement by water companies and water scientists forwater quality measurement based on turbidity has been one ofthe primary drivers for the development of sensitive turbidimeters.In rivers, lakes and artificial water distribution systems, turbiditymeasurements are commonly undertaken in order to estimate sus-pended particle concentrations. They can also be used as a surro-gate for direct analysis of pathogens as a rapid means of waterquality assessment (Brookes et al., 2004). Two different principlesare commonly used to measure the turbidity of liquids. Devicesbased on the turbidimetric principle pass a beam of light throughthe sample and measure its attenuation due to absorption by theparticles in the liquid. In contrast nephelometric instruments mea-sure the intensity of light scattered by particles at right angles tothe incident light source. In both cases the light intensity is mea-sured by conversion into an electrical signal which is proportionalto the concentration of particles in suspension. Nephelometers aretypically chosen for the measurement of samples containing lowconcentrations of solids as they are significantly more sensitivethan turbidimetric devices in these circumstances. Nephelometers
vary in design based on the ranges of particle size, nature of thesampling and sensitivity required in the analysis. Advances in thetechnologies of light sources, light detection and signal processinghave further driven the methodologies adopted in nephelometry(EPA, 1999). Today an excellent range of on-line, bench-top, fieldand portable nephelometers are available such as those manufac-tured by Hach (USA), Hannah Instruments (Italy) and HF ScientificInc. (USA). In some circumstances, however, a commercial devicemay not be ideal for an investigation due reasons such as a fielddeployment requirement, physical size or cost. In such instancesworkers have developed bespoke systems usually based on simpleelectronic detectors and LED light sources (e.g. Smith and Witter,1982; Lawler and Brown, 1991; Papadopoulou et al., 1998; Orwenand Smart, 2004).
Column experiments are a well established method of examin-ing the movement and interaction of solutes and colloids throughnatural materials. In the case of inorganic particles, column exper-iments on colloid and colloid-facilitated transport have been con-ducted using clay minerals such as kaolinite and montmorillonite(e.g. Grolimund et al., 1996), haematite (Puls and Powell, 1992),natural colloids from different sediments (e.g. Zhuang and Jin,2003), silica (Johnson et al., 1996; Noell et al., 1998), silica coatedzirconia (Loveland et al., 2003), and polystyrene latex beads (e.g.Higgo et al., 1993). In these laboratory experiments, silt loam soils
0022-1694/$ - see front matter Crown Copyright � 2010 Published by Elsevier B.V. All rights reserved.doi:10.1016/j.jhydrol.2010.04.033
* Corresponding author. Tel.: +44 (0) 21 414 6167; fax: +44 (0) 21 414 4942.E-mail address: [email protected] (R.B. Greswell).
Journal of Hydrology 388 (2010) 112–120
Contents lists available at ScienceDirect
Journal of Hydrology
journal homepage: www.elsevier .com/locate / jhydrol

Author's personal copy
(Grolimund et al., 1996), sand and gravel (Puls and Powell, 1992;Zhuang and Jin, 2003), spherical glass beads (Noell et al., 1998),clean sand mixed with ferric oxyhydroxides coated sand (Lovelandet al., 2003), and clean sand with a layer of silt or clay (Higgo et al.,1993) were used as media and were repacked into columns for theexperiment. Biocolloids such as bacteria, viruses and other micro-organisms are similarly studied to determine their transport prop-erties and interactions with sediments using both packed columnsin the laboratory and field-scale studies (e.g. Bales et al., 1991;Dowd and Pillai, 1997; Cortis et al., 2006; Joyce et al., 2008). Whereconcentrations of microorganisms are sufficiently high, theirdetection and quantification may also be possible using turbidi-metric methods (e.g. Amrane and Prigent, 1998).
In the study of colloid or solute transport through aquifer form-ing rock, the repacking of disaggregated material into a column isundesirable since the physico-chemical properties of the systemthat are fundamental in controlling transport are significantly al-tered. It is therefore highly preferable to undertake such investiga-tion using intact specimens where a cylindrical core cut from intactrock is encapsulated to create a column. One of the common disad-vantages of this approach, for example when specimens are takenfrom borehole cores, is the limited size of the resulting column.Studies undertaken by the authors typically concerned the trans-port of low concentrations (0–10 mg/l) of manufactured colloids(particle sizes ranging from 10 to 50 nm) through small intactcores of porous rock, artificial fractures and other columns that re-quired a means of continuous on-line detection based on the tur-bidity of the elutant. The small size of the samples (typical porevolumes of between 10 and 15 cm3) necessitated a low volumemeasuring cell to minimise the influence of the cell itself on the ob-served concentration breakthrough curve. In addition, due to therequirement of simulating typical groundwater flow velocitieswithin the sample, and long-term colloidal interactions withinthe rock, experiments needed to run continuously over extendedperiods of up to 2 months without significant instrumental drift.No commercially available device (based on cost and design) wassuitable for the task and so a simple laser nephelometer was de-signed and built for the investigation, and subsequently developedin a range of studies. The construction of the device is within thecapabilities of technical staff within research institutions andmay readily be adapted to studies of a similar nature in both waterand other sciences wherever on-line nephelometric measurementsare required. The estimated cost of components excluding a signalmonitoring system (e.g. a data-logger) is approximately £300. Thispaper discusses the design and evaluation of the device and pre-sents example data.
2. Theory and principles of the instrument
2.1. Light scattering and nephelometry
When a light beam passes through a fluid containing suspendedsolids it undergoes a complex scattering process resulting from theinterplay between factors that include: the concentration of parti-cles, their size (and size distribution), colour, shape, surface prop-erties and refractive index as well as the refractive index of thefluid and the wavelength (k) of the incident light (e.g. Lawler,2005). Mie’s solution to Maxwell’s theory of the scattering of elec-tromagnetic waves by spherical particles (Kerker, 1969) shows thatlight of shorter wavelengths undergoes greater scattering thandoes light of longer wavelengths, and particles with a small diam-eter (d) scatter light more strongly than larger particles. However,no single theory adequately describes the nature of scatter for allsizes of particle in suspension. Although various criteria have beensuggested for the limiting case (Plantz, 1984), when d� k, the
scattering is best described by Rayleigh theory and is approxi-mately uniform in all directions, whereas when d approaches k,Mie theory becomes appropriate, and the intensity of light scat-tered forward in the direction of the incident beam becomes great-er, as does therefore the asymmetry of the scatter pattern (Vanouset al., 1982). The asymmetry of scattering is an important consid-eration, as nephelometry depends on measurements at 90� to theincident light such that both particle size and concentration con-trol the intensity of scattering. Quantitative analysis of suspendedparticle concentration in a liquid may be made either directly bycalibrating the device using standards made from identical parti-cles to those being measured, or where the nature of the particleis unknown, inferred by comparison to an artificial referencebased, typically, on a formazine suspension and most commonlyexpressed in nephelometric turbidity units (NTU).
2.2. Flow-through cell
Breakthrough curves are commonly used to indicate the pro-cesses occurring during transport of solutes and suspensionsthough porous media but dispersion within flow cells alone cansignificantly affect the shape of the breakthrough, the larger thecell relative to the pore volume of the column, the larger the effect.Rock cores typically used in experiments for which the laser neph-elometer was utilised had pore volumes of between 9 and 13 ml, arelatively small volume. In order to determine the suitability of theflow cell for use in conjunction with these columns, a numericalsimulation was undertaken of the solute concentration eluted fromthe column/flow cell system. A simple model was implementedusing an explicit finite difference scheme with time-step Dt. Com-plete, instantaneous mixing of solutes within the cell was assumedsuch that the mass of solute leaving the cell at time t Mout
t
� �may be
calculated by the following equation:
Moutt ¼ Q � Dt � Ct�Dt ð1Þ
where Ct�Dt is the concentration in the flow-through cell at timet � Dt, and Q is the flow rate through the cell.
It then follows that the concentration in the cell at time t (Ct)may be calculated as follows:
Ct ¼ Ct�Dt þQ � Dt
VCin
t � Ct�Dt
� �ð2Þ
where Cint is the concentration of the solute entering the cell and V is
the volume of the cell.Rock-core parameters typical of those used in the experiments
described below were used to simulate a synthetic breakthroughcurve using the Ogata–Banks solution (Ogata and Banks, 1961) tothe 1-D advection–dispersion equation using parameters shownin Fig. 1. Using the resulting time series for Cin
t , apparent break-through curves were then calculated for a variety of cell volumesusing Eq. (2). An Ogata–Banks solution was then fitted to thesebreakthrough curves (Fig. 1), by minimising the sum of squaredresiduals, to estimate values for effective porosity of the columnand dispersivity while holding all other parameters constant. Aswould be expected, the resultant errors in effective porosity esti-mates are equal to the ratio of cell volume to pore volume. Further-more, as cell volume increases beyond approximately 1 ml theerror in the estimated hydrodynamic dispersion also becomesincreasingly significant.
Construction of low volume cells becomes difficult when usingequipment typically available to the non-specialist and althoughlow volume flow-through cells are available commercially, a fur-ther consideration resulting from low cell volume is a reductionin signal due to the decrease in particle mass from which the lightis scattered. Furthermore, as the windows of the flow cell becomesmaller, the focussing requirements of the optical system become
R.B. Greswell et al. / Journal of Hydrology 388 (2010) 112–120 113

Author's personal copy
more demanding. In our work, the lower practical limit of the cellwas found to be 0.2 ml which, as shown by the above analysis, doesnot produce significant errors in the estimation of transport prop-erties based on the interpretation of a breakthrough curve.
For the majority of work for which the device was constructed,the input colloid concentration remains constant and only long-term colloid-rock pseudo-steady-state interaction processes areconsidered. In these circumstances the slow rate of change of theelutant concentration greatly outweighs any influence the cellhas on the breakthrough. However, when estimation of transportproperties is to be determined based on a rapid breakthrough, itis clear that cell volume is an important consideration when plan-ning an investigation if errors are to be minimised.
3. Components and construction
3.1. Optics
The optical components are shown schematically in Fig. 2awhich also demonstrates the basic principle of a nephelometer.Light from a laser module passes through a cuvette containing a
colloidal suspension. Light scattered by the particles is focussedby a lens-system onto the active area of a photodiode forming partof the detector circuit.
The adoption of a laser to illuminate the sample has severaladvantages over conventional light sources. Small, low power(<5 mW), inexpensive (�£70) laser diode modules with stabilisedoutputs have been commercially available for the last few years.Such modules produce high light intensity which improves thesensitivity of the analytical device and requires no collimation,thus precluding the need for additional focussing optics and a sig-nificant reduction in the amount of stray light within the nephe-lometer (Hargesheimer et al., 2002; Sadar, 2003). In addition, thepower supply requirements are low (�5 mW and �5 V) which isadvantageous if the device is to be used in the field. The moduleused in our design is a ‘Sigma’ device by Global Laser (UK) with a3 mW output and a centre wavelength of 650 nm. The choice ofwavelength was determined by the nature of silicon photodiodesused for detection (these devices are typically more sensitive atlonger wavelengths) and also because red laser modules are morereadily available and less expensive. Most importantly, the parti-cles that were used in our experiments were approximately spher-ical and ranged between 10 and 100 nm and therefore, according
0
0.1
0.2
0.3
0.4
0.5
0.6
0.7
0.8
0.9
1
6000 7000 8000 9000 10000 11000 12000Time (s)
C/C
0
Cin 0.1ml 0.2ml 0.5ml 1ml
Core characteristicsLength 0.075 mDiameter 0.035 mEffective porosity 0.2 -Flow rate 1.7E-09 m3/sDispersion Coeff. 4.5E-09 m2/s
Cin
0.1ml
0.2ml
Fig. 1. Synthetically generated breakthrough curves for a typical small rock-core of the properties indicated, with flow-through cells of various volumes, from 0 to 1 ml.
Laser Module
Lens system
Photodiode
(a)
Cuvette
Clamping screw
Needle block
Base of optical
Platform
ABS block
Laser diode module
Radial heat-sink
1 cm
(b)Fig. 2. Plan (a) and sectional (b) view of optical system and flow-through cell components.
114 R.B. Greswell et al. / Journal of Hydrology 388 (2010) 112–120

Author's personal copy
to Raleigh theory, strongly scattered light at right angles to the650 nm incident beam.
The laser module is supplied with a lens that allows the beam tobe diverged which offers an advantage in allowing the light to bedirected through the flow cell as a highly elliptical beam thus illu-minating a greater volume of sample which in turn increases theintensity of the scattered light. The laser module was located in amachined block of acrylonitrile butadiene styrene (ABS) by drillinga hole into which the laser module could be press-fitted (thoughABS was used, other types of engineering plastic would be equallysuitable). The block also doubles as the holder for the flow cell(Figs. 2b and 3). In order to dissipate heat from the laser, a radialclip-on heat sink of the type normally designed for round metaltransistors was attached to the body; this also served as a connec-tion point for an electrical ground to the case, as recommended bythe manufacturer.
Any optical system such as this must be rigidly constructedsuch that the key components cannot move in relation to one an-other in order to prevent possible errors from subsequent mis-alignment of the light paths. This may be achieved by mountingthe components on a common base or optical-stage such as maybe constructed from sheet aluminium with a thickness greaterthan �5 mm. Provision must be made to allow fine three-dimen-sional adjustment of the light source, flow-through cell and detec-tor unit such that the light paths may be re-aligned and focusedduring the setting up of the instrument. In practice the ABS flow-through cell holder and laser were rigidly mounted with the detec-tor and lens-system adjustable in order to achieve the optimalalignment. All components were housed in a metal lightproofbox (with the inner surfaces painted matt-black) to exclude bothexternal sources of light and shield the electronics from externalelectromagnetic interference.
Light scattered by particles in the flow cell emitted in the direc-tion of the detector must be focussed onto the photodiode. Ideally,the field of view of the optical system should not extend beyondthe cell sample cross-section so as to minimise the effect of extra-neous light. In the case of the instrument described in this paper, aconvenient solution was achieved by using the objective lens froma microscope with a 10� magnification. When placed approxi-mately 10 mm from the centre of the flow cell, emitted light is fo-cussed onto a spot covering the active area of photodiode when the
latter is set at a distance of approximately 45 mm from the front ofthe lens (Fig. 3). The lens was glued using an epoxy adhesive into a20 mm hole drilled into an aluminium box with a light-proof lidcontaining the detector circuitry.
3.2. Detector
The electronic circuit used to detect light scattered from theflow cell is shown in Fig. 4 with the electronic components shownin Table 1. The detector is based, with minor modification, on a de-sign by Hamamatsu Photonics (2008) for a sensitive light sensorusing a low noise silicon photodiode. Light entering the box viathe lens is directed onto the 5.7 mm2 sensitive area of a Hamama-tsu (Japan) S1226 5BK photodiode which was selected for its lownoise characteristics and a sensitivity that matched the peak wave-length of the light source. The signal from the photodiode is ampli-fied by an AD549 operational amplifier. The gain of the amplifier isset by the resistance of R1 which is determined experimentallybased on the light level entering the detector. Adjustment of thegain allows the voltage output from the detector over the rangeof colloid concentrations of interest to be matched to that of therecording device. A typical value for R1 will range from 1 to10 GO where the gain is proportional to the resistance. The capac-itor (C5) in parallel with R1 sets the bandwidth of the amplifierwhich in combination with the low pass filter formed by R2 andC6 improves the signal to noise ratio. IC2 buffers the output anddrives a recording device or logging system.
Due to the exceptionally high sensitivity of the AD549 opera-tional amplifier, which has a bias current of �1 pA, the detectorcircuit must be constructed with care and using design consider-ations extensively discussed in the data sheet for the device (Ana-log Devices Inc., 2002). The circuit should be constructed on apurpose-made printed circuit board (PCB) using a prototypingacid-etch method such as described in Horowitz and Hill (1989).Great care must be used to avoid any stray or parasitic currentfrom being applied to the input of the amplifier. Such is the sensi-tivity that the input to the amplifier should not be connected to thePCB since even the minimal resistance of the circuit board materialitself is sufficient to cause a current to flow. Instead, all lines shownin bold in Fig. 4 should be soldered together above the board sothey are insulated from it by an air space (Fig. 3). Similarly, care
Fig. 3. Photograph showing electronic components, lens and flow-through cell.
R.B. Greswell et al. / Journal of Hydrology 388 (2010) 112–120 115

Author's personal copy
must be taken when handling both the AD549 and the photodiodeso as to prevent contamination from potentially conductive fingermarks.
Electromagnetic interference must be minimised in order toprevent unwanted noise being transferred to the output signal.By placing the detector circuit within a separate electricallygrounded metal box most external sources can be excluded suc-cessfully. The ±5 V power supply (Fig. 4) should be housed in an-other separate box away from the rest of the system and allground points (laser diode module case and metal of the detectorbox) connected to the 0 V line of the power supply at a single pointin order to avoid ground loops. The output signal from the detector
should be routed via a BNC type coaxial connector using shieldedcoaxial cable to the monitoring or recording system.
The PCB should be mounted within the box such that the pho-todiode may be adjusted slightly in order that the light from thelens falls directly on the active area. In our design the photodiodeis aligned at right angles to the PCB by bending the two connectingwires.
3.3. Flow-through cell
The flow-through cell is a key component in the system. Opti-cally it must produce a minimum of scatter due to surface imper-fection or contamination and physically, as has already beendiscussed, should have a small internal volume to minimise disper-sion. A large range of cells for optical analytical techniques arecommercially available, including ones with low volume designedfor flow-through measurements. A simple solution was developedwhich uses a conventional asymmetric fluorescence cell (Hellma[Germany] Type 104F-OS) which has a 10 mm � 4 mm light pathand an internal volume of 1.4 ml. In this application the spreadbeam from the laser is passed through the wider (10 mm) sectionof the cell and viewed perpendicularly through the 4 mm window.To minimise cell volume and to achieve flow-through functional-ity, the fluid under test enters and exits the cell via two 1 mmdiameter hypodermic needles set into a small block of acrylic plas-tic machined precisely to fit inside the cell (Fig. 2b). The needle-block is positioned inside the cell with the lower edge approxi-mately 5 mm from the base and sealed into place using a highmodulus transparent silicone sealant such as those made by DowCorning (USA), to give a final cell volume of approximately0.2 ml. The Luer fittings on the hypodermic needles may then beused in conjunction with appropriate connectors and narrowdiameter PTFE tubing to direct fluid into the apparatus from theexperiment and out to waste. The primary advantage of adapting
Fig. 4. Circuit diagram of detector electronics and power supply.
Table 1Components used in detector circuit.
Part Item Value/description Remarks
R1 Resistor 1–10 GXa Metal film 1%R2 Resistor 10 kX Metal film 1%C1, C2 Capacitor 6800 lF 35 V ElectrolyticC3, C4 Capacitor 4700 lF 12 V ElectrolyticC5 Capacitor 10–100 pFa PolystyreneC6 Capacitor 1 lF PolyesterD1 Si photodiode S1226 5BK HamamatsuD2–D5 Bridge rectifier 50 V >1 AD6 Laser photodiode 650 nm 3 mW Global Laser, SigmaT1 Transformer 2 � 7.5 V
secondaryCentre tapped
IC1 Operationalamplifier
AD549 Ultra highimpedance
IC2 Operationalamplifier
OP07
IC3 +5 V voltageregulator
1 A +5 V
IC4 �5 V voltageregulator
1 A �5 V
a Refer to text.
116 R.B. Greswell et al. / Journal of Hydrology 388 (2010) 112–120

Author's personal copy
a cell in this way is the ability to configure the volume of the cell byposition of the needle-block and cost (�£70) as purpose-made flowcells are usually several times more expensive.
The cell was mounted on the same block of plastic that supportsthe laser (Fig. 2b). A small strip of black-painted aluminium held bytwo 3 mm screws allows the cell to be clamped into the desired po-sition such that the laser beam passes through the centre of thefluid flow path.
3.4. Setting up
A combination of adjustments is required in order to align thecomponents in the system optimally. Basic alignment is achievedby careful measurement with a vernier calliper such that the cen-tre line of the laser module and detector lens are an equal distanceabove the plane of the optical-stage and at 90� to, and aligned with,the centre of the flow cell window in the X and Y plane. The flowcell may be aligned subsequently in the Z axis by releasing andtightening the clamp until the path of the beam passes throughits centre. The most difficult adjustment required is that to alignthe focussed light from the detector lens onto the photodiode.Although careful measurement will result in reasonable alignment,the final adjustments are usually more subtle. In order to achievethis, the flow cell was substituted for a cuvette into which hadbeen placed a small piece of white paper spanning the width ofthe cell from corner to corner angled at 45� to the incident beam.Laser light falling on the paper produces an intense red spot, thescattered light from which is focussed by the lens and may be usedin a darkened room to set up the detector optics. Note that extremecare is necessary to undertake this operation in order to prevent di-rect laser light from entering the eyes of anyone in sight of the pro-cess. By observing the location of light passing through thedetector lens, the detector (and, if necessary, the photodiode itself)may be moved until the light falls directly onto the sensitive area.The simplest approach to minor adjustment is to bend gently theconnecting wires on the photodiode until it is correctly alignedwith the focussed spot.
In order to achieve the highest resolution of measurement itmay be necessary to adjust the gain of the amplifier to match thefull-scale output voltage from the detector to that of the recordingdevice. As the amount of light scattered is a function of the physicaland optical nature of the particle as well as its concentration, it isusually necessary to introduce into the cell a suspension of the col-loid with the desired maximum concentration and then adjust thevalue of R1 by substitution until the output voltage is approxi-mately equal to, but less than, the upper limit of the recording de-vice, subject to maximum limiting value of around 3.5 V. For themajority of work described in this paper a value of 2 GO bestmatched the typical range of concentrations (0–20 mg/l of�100 nm �monodisperse SiO2) giving a peak voltage output ofaround 3 V. Where a much larger range of measurement is re-quired it is possible to modify the circuit to allow R1 to beswitch-substituted using reed-relays (Hamamatsu Photonics,2008).
3.5. Monitoring the output
The simplest solution to monitoring the output is to use a dig-ital multimeter to display the voltage, which can then be convertedto a concentration following calibration against known standards.However, by far the most useful approach is to use a data-loggersuch that data may be continuously recorded over the durationof the experiment. Most modern stand-alone data-loggers are sup-plied with PC based software that produce a real-time display thatallows the progress of the experiment to be monitored visually. APC based logging solution can prove less expensive whereby the
analog to digital conversion is done using a plug-in card or moduleand the data stored directly on the hard drive of the PC. Systemsthat have configurable gain are the most versatile as they can beprogrammed to match the signal voltage range of the device. Log-gers that multi-sample over a period and store an average value areadvantageous if signal noise is a problem.
3.6. Experimental practice
An accurate low-flow peristaltic pump provides an ideal meansof driving fluid from a reservoir through the rock column undertest. A bubble trap should be placed immediately before the devicein order to prevent air bubbles from entering the nephelometercell. This is essential since air bubbles refract very large amountsof light and will cause significant errors in measurement. In addi-tion, due to the small volume of the cell, once having entered,the surface tension of a bubble will be sufficient to prevent it fromeasily being flushed from the cell. Fluid leaving the cell may be dis-posed of as waste or directed to other analytical devices. Narrowbore tubing (�0.1–0.2 mm internal diameter) and associated fit-tings of the type used in liquid chromatography equipment areideal for connecting the components in the system. The use of nar-row bore tubing helps minimise dispersion and mixing of fluidwithin the system and performs well at the flow rates employedin our experiments which were usually �1.0 ml/min. However,as flow rates rise, so may the pressure within the flow cell whichmay ultimately lead to component failure. For this reason a maxi-mum flow rate of 10 ml/min should be regarded as a workingupper limit for the design described above. If flow rates higher thanthis are required, an increase in pipe diameter is recommendedsuch that the pressure within the flow cell does not exceed100 mbar, or that a purpose-made flow cell is used which has apressure rating sufficient for the intended use.
4. Evaluation
As the intensity of light scattered from a suspension of given con-centration is dependent on the properties of the particle, most as-pects of the performance of the nephelometer may only bedefined in terms of the particular suspension being measured. Theevaluation presented here is based on a range of standards dilutedfrom a 5.86% aqueous suspension of nominally monodisperse100 nm (±30 nm) silica microspheres manufactured by PolysciencesInc. (USA).
4.1. Stability, drift and the effect of temperature
Unwanted perturbation of the signal may arise from varioussources but typically the most significant are: electronic noise inthe detector or monitoring devices, variation in the intensity ofthe light source and external influences such as temperature. Theperturbation may be rapid, such as is the case with electronicnoise, or take place over hours or days leading to drift in the base-line or calibration slope. Short-term variation (defined here as aperiod of less than 4 h) was variously examined during the devel-opment of the device by repeatedly measuring the concentration ofa continuous stream of a standard dispersion of silica or waterblank. Typical standard deviations (r) were found to be approxi-mately 0.02 mg/l for the baseline (a water blank) and 0.06 mg/lfor a 10 mg/l suspension. The magnitude of r is caused most signif-icantly by the slight instability of the light output from the laserdiode. By comparison, noise level from the detector alone producesan r value of just 0.005 mg/l. As the intensity of light scatteredfrom the suspension increases, so will the amplitude of the noisewhich may explain the higher value of r for the 10 mg/l standard.
R.B. Greswell et al. / Journal of Hydrology 388 (2010) 112–120 117
Author's personal copy
The properties of most electronic components are influenced bytemperature variation which can additionally perturb the outputsignal. Operational amplifiers such as those used in the nephelom-eter are designed with this in mind and are minimally affected butmay be influenced by changes in the other electronic componentsused in the circuit. Most experiments using the nephelometer wereconducted in a refrigerator set to a nominal temperature of 12 �C inorder to simulate both natural UK groundwater conditions and alsoto minimise temperature fluctuation. Early prototypes of the neph-elometer were adversely influenced by temperature changes (Rah-man, 2006) but were subsequently substantially compensated forusing simultaneously recorded air temperatures. Over the limitedrange of temperature variation recorded within the refrigerator(�5�) no significant influence on the output signal was detected.
For periods of several days or more, such as those required forthe experiments themselves, stability and drift was harder to mea-sure since the output concentration from the rock columns werecontinuously varying and the experiments could not be inter-rupted in order to carry out recalibration. However, by comparingthe calibration made at the beginning of the experiment with thatat the end (often >20 days), some indication of long term driftcould be estimated. Typical maximum differences were in the or-der of 2–3% and data were corrected by assuming that drift waslinear over the duration of the experiment.
Indications are that the laser diode becomes progressivelyunstable after approximately 1500–2000 h of use and should be re-placed when noise levels are observed to increase significantly.
4.2. Calibration
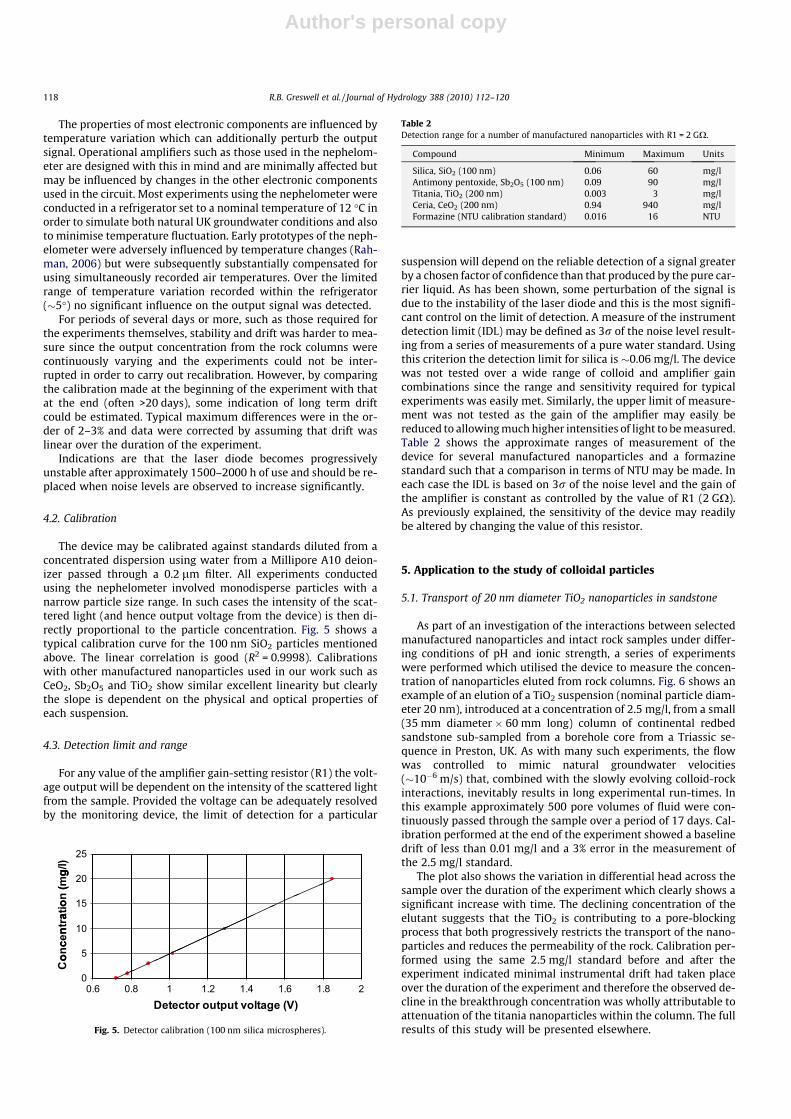
The device may be calibrated against standards diluted from aconcentrated dispersion using water from a Millipore A10 deion-izer passed through a 0.2 lm filter. All experiments conductedusing the nephelometer involved monodisperse particles with anarrow particle size range. In such cases the intensity of the scat-tered light (and hence output voltage from the device) is then di-rectly proportional to the particle concentration. Fig. 5 shows atypical calibration curve for the 100 nm SiO2 particles mentionedabove. The linear correlation is good (R2 = 0.9998). Calibrationswith other manufactured nanoparticles used in our work such asCeO2, Sb2O5 and TiO2 show similar excellent linearity but clearlythe slope is dependent on the physical and optical properties ofeach suspension.
4.3. Detection limit and range
For any value of the amplifier gain-setting resistor (R1) the volt-age output will be dependent on the intensity of the scattered lightfrom the sample. Provided the voltage can be adequately resolvedby the monitoring device, the limit of detection for a particular
suspension will depend on the reliable detection of a signal greaterby a chosen factor of confidence than that produced by the pure car-rier liquid. As has been shown, some perturbation of the signal isdue to the instability of the laser diode and this is the most signifi-cant control on the limit of detection. A measure of the instrumentdetection limit (IDL) may be defined as 3r of the noise level result-ing from a series of measurements of a pure water standard. Usingthis criterion the detection limit for silica is �0.06 mg/l. The devicewas not tested over a wide range of colloid and amplifier gaincombinations since the range and sensitivity required for typicalexperiments was easily met. Similarly, the upper limit of measure-ment was not tested as the gain of the amplifier may easily bereduced to allowing much higher intensities of light to be measured.Table 2 shows the approximate ranges of measurement of thedevice for several manufactured nanoparticles and a formazinestandard such that a comparison in terms of NTU may be made. Ineach case the IDL is based on 3r of the noise level and the gain ofthe amplifier is constant as controlled by the value of R1 (2 GX).As previously explained, the sensitivity of the device may readilybe altered by changing the value of this resistor.
5. Application to the study of colloidal particles
5.1. Transport of 20 nm diameter TiO2 nanoparticles in sandstone
As part of an investigation of the interactions between selectedmanufactured nanoparticles and intact rock samples under differ-ing conditions of pH and ionic strength, a series of experimentswere performed which utilised the device to measure the concen-tration of nanoparticles eluted from rock columns. Fig. 6 shows anexample of an elution of a TiO2 suspension (nominal particle diam-eter 20 nm), introduced at a concentration of 2.5 mg/l, from a small(35 mm diameter � 60 mm long) column of continental redbedsandstone sub-sampled from a borehole core from a Triassic se-quence in Preston, UK. As with many such experiments, the flowwas controlled to mimic natural groundwater velocities(�10�6 m/s) that, combined with the slowly evolving colloid-rockinteractions, inevitably results in long experimental run-times. Inthis example approximately 500 pore volumes of fluid were con-tinuously passed through the sample over a period of 17 days. Cal-ibration performed at the end of the experiment showed a baselinedrift of less than 0.01 mg/l and a 3% error in the measurement ofthe 2.5 mg/l standard.
The plot also shows the variation in differential head across thesample over the duration of the experiment which clearly shows asignificant increase with time. The declining concentration of theelutant suggests that the TiO2 is contributing to a pore-blockingprocess that both progressively restricts the transport of the nano-particles and reduces the permeability of the rock. Calibration per-formed using the same 2.5 mg/l standard before and after theexperiment indicated minimal instrumental drift had taken placeover the duration of the experiment and therefore the observed de-cline in the breakthrough concentration was wholly attributable toattenuation of the titania nanoparticles within the column. The fullresults of this study will be presented elsewhere.
25
20
15
10
5
g/l)
(mg
on (
atio
ntra
cen
onc
Co
00.6 0.8 1 1.2 1.4 1.6 1.8 2
Detector output voltage (V)
Fig. 5. Detector calibration (100 nm silica microspheres).
Table 2Detection range for a number of manufactured nanoparticles with R1 = 2 GX.
Compound Minimum Maximum Units
Silica, SiO2 (100 nm) 0.06 60 mg/lAntimony pentoxide, Sb2O5 (100 nm) 0.09 90 mg/lTitania, TiO2 (200 nm) 0.003 3 mg/lCeria, CeO2 (200 nm) 0.94 940 mg/lFormazine (NTU calibration standard) 0.016 16 NTU
118 R.B. Greswell et al. / Journal of Hydrology 388 (2010) 112–120

Author's personal copy
5.2. Transport of 100 nm diameter silica nanoparticles in sandstone
Fig. 7 shows the elution of a 10 mg/l suspension of 100 nmdiameter silica particles suspended in pure water from a core ofTriassic sandstone taken from the Birmingham University campus,UK. Pure water was initially pumped through the core before apulse of silica suspension was introduced and finally a pure waterflush. The concentration of the elutant remained less than the con-centration of the injected fluid for the duration of the injectionphase; by varying the water velocity, the kinetics of the removalof the particles by the rock were evaluated (Rahman, 2006), andthese and other results will be reported elsewhere.
6. Conclusions
An inexpensive flow-through laser nephelometer has beendeveloped that is suitable for measuring the concentrations of arange of suspended nanoparticles and has been successfully ap-plied in the study of their transport through intact porous rock col-umns. The low volume of the flow-through cell minimises theeffects of dispersion, an important consideration when pore vol-
umes are low if breakthrough curves are to be used in order to esti-mate the properties of the rock involved in short term interactions.Long term stability is good and allows experiments of several tensof days duration to be performed with drifts of <3%. The detectionlimit of �0.06 mg/l for silica was acceptable for the experimentsperformed by the authors but may be improved substantially if amore stable light source were utilised as the signal to noise ratioof the nephelometer is compromised by the laser module used inthis design. The design is simple and although some care is re-quired in order to build a successful instrument, the constructionis within the capabilities of most technical departments of univer-sities or research establishments. The device would be of particularbenefit to workers requiring on-line detection who are unable toutilise commercial devices due to their cost or design limitation.Although so far exclusively used in the laboratory, the laser neph-elometer may readily be adapted for use in the field. The totalpower consumption is low (�100 mW) such that it could be pow-ered by a pair of small 6 V lead-acid batteries with the output re-corded using a stand-alone data-logger. For long-termmonitoring the power may be switched using a suitable data-log-ger such that the current was only applied for a few minutes to al-low the instrument to settle prior to the recording of a
2 5 125.
2 1002
1.5 75
1
g/l)
(mg
nia
Tita 50
O)
H2
(cm
ur
e (
essu
Pre
0.5 25
0 00 100 200 300 400 500
00 100 200 300 400 500
pore volumes ( )pore volumes (-)
Elutant concentrationDifferential pressure
Fig. 6. Elution concentration over time (expressed as pore volumes of injected fluid) of nanoparticulate TiO2 from an intact core of UK Triassic sandstone undergoing acontinuous injection of a 2.5 mg/l suspension. Also plotted is the differential water pressure between up-stream and down-stream faces of the core.
109
109876545
34
)m
g/l
a (m
ica
Sil
3210
0 10 20 30 40 50 60 70 80 90 1000 10 20 30 40 50 60 70 80 90 100
Pore volumes ( )Pore volumes (-)
Fig. 7. Elution concentration over time (expressed as pore volumes of injected fluid) of a ‘step’ injection of 10 mg/l colloidal silica into a column of intact sandstone (UKcontinental, Triassic). Injection sequence: pure water; 10 mg/l silica suspension; pure water.
R.B. Greswell et al. / Journal of Hydrology 388 (2010) 112–120 119

Author's personal copy
measurement. The flow cell could be made significantly largerwhich would in turn simplify the design and potentially increasethe sensitivity of the instrument. Clearly nephelometry is not lim-ited to the study of manufactured nanoparticles, and hence the de-vice may be applied to the on-line measurement of turbidityresulting from the suspension of many types of particle, includingmicro organisms, either in natural or artificial systems.
The application to manufactured nanoparticle transport de-scribed in this paper allows a direct measurement of the concen-tration of the suspension to be made since the device may becalibrated using known standards of these often relatively simplecolloidal suspensions. Many potential applications of the devicewill involve the detection of particles of varying size, shape, aggre-gation and colour amongst other physical characteristics each ofwhich may influence light-scattering properties. In some instancesthe range of these characteristics may be sufficiently limited that itis still possible to infer accurately particle concentration based onthe amount of light scattered provided an independent means ofparticle characterisation (e.g. particle sizers, field flow fraction-ation, electron microscopy, etc.) are available to the user. In manyinvestigations, however, particularly those involving natural sys-tems, the range of particle properties may vary so significantly overthe period of investigation that the amount of light scattered bythe sample may only be used as a guide to the particle concentra-tion. In such instances the turbidity of the sample may be ex-pressed in terms of NTU following calibration with recognisedstandards. Table 2 includes an indication of the range of measure-ment of the device expressed in these terms.
We believe that the device described in this paper, adaptedwhere necessary to suit individual requirements, should providean inexpensive means of colloid detection suited to a wide rangeof investigations.
Acknowledgements
The development and use of the nephelometer took place over aperiod of several years and was made possible by funding providedby: Natural Environment Research Council (UK) (Grant Nos. NE/E015166/1 and NER/A/S/2001/00656), Environment Agency (UK)and the British Commonwealth Scholarship Commission. Severalpostdoctoral and many student researchers have contributed tothe development of the device either directly or by using it in theirwork. The authors would like to thank amongst others: BryonyAnderson, Michelle Andrews, Josh Bradley, Katrina Charles, JuliaFalb, David Harrison, Eadaoin Joyce, Karen Parker, Jessica Crane,Oliver Pattenden and Harry Snell.
References
Amrane, A., Prigent, Y., 1998. A new turbidimetric device for on-line monitoring ofgrowth of filamentous microorganisms. Journal of Microbiological Methods 33,37–43.
Analog Devices, Inc., 2002. Ultralow Input Bias Current Operational AmplifierAD549. Analog Devices, Inc. <http://www.analog.com>.
Bales, R.C., Hinkle, S.R., Kroeger, T.W., 1991. Bacteriophage adsorption duringtransport through porous-media – chemical perturbations and reversibility.Environmental Science and Technology 25 (12), 2088–2095.
Brookes, J.D., Antenucci, J., Hipsey, M., Burch, M.D., Ashbolt, J.D., Ferguson, C., 2004.Fate and transport of pathogens in lakes and reservoirs. EnvironmentInternational 30 (5), 741–759.
Cortis, A., Harter, T., Hou, L., Atwill, E.R., Packman, A.I., Green, P.G., 2006. Transportof Crytosporidium parvum in porous media: long term elution experiments andcontinuous time random walk filtration modeling. Water Resources Research42.
Dowd, S.E., Pillai, S.D., 1997. Survival and transport of selected bacterial pathogensand indicator viruses under sandy aquifer conditions. Journal of EnvironmentalScience and Health 32A, 2245–2258.
EPA, 1999. Guidance Manual for Compliance with the Interim Enhanced SurfaceWater Treatment Rule: Turbidity Provisions. US Environmental ProtectionAgency 815-R-99-010.
Grolimund, D., Borkovec, M., Barmettler, K., Sticher, H., 1996. Colloid facilitatedtransport of strongly sorbing contaminants in natural porous media: alaboratory column study. Environmental Science and Technology 30, 3118–3123.
Hamamatsu Photonics, 2008. Application Circuit Examples of Si Photodiode.Hamamatsu Photonics K.K. Solid State Division. Cat. No. KPD1043E07.
Hargesheimer, E.E., Conio, O., Popovicova, J. (Eds.), 2002. Online Monitoring forDrinking Water Utilities #2545. Water Research Foundation.
Higgo, J.J.W., Williams, G.M., Harrison, I., Warwick, P., Gardiner, M.P., Longworth, G.,1993. Colloid transport in a glacial sand aquifer. Laboratory and field studies.Colloids and Surfaces A: Physicochemical and Engineering Aspects 73, 179–200.
Horowitz, P., Hill, W., 1989. The Art of Electronics, second ed. Harvard University.Johnson, P.R., Sun, N., Elimelech, M., 1996. Colloid transport in geochemically
heterogeneous porous media: modelling and measurements. EnvironmentalScience and Technology 30, 3284–3293.
Joyce, E., Charles, K., Rahman, H., Aller, M.F., Durand, V., Riley, M.S., Greswell, R.B.,Renshaw, J.C., Mackay, R., Rivett, M.O., Hart, A., Pedley, S., Tellam, J.H., 2008.Assessing the hazard from viruses in wastewater recharge of urban sandstoneaquifers. In: Trefry, Michael G. (Ed.), Securing Groundwater Quality in Urbanand Industrial Environments, vol. 324. IAHS Publ., pp. 319–326.
Kerker, M., 1969. The Scattering of Light and other Electromagnetic Radiation.Academic Press, New York.
Lawler, D.M., 2005. Turbidimetry and nephelometry. In: Worsfold, P., Townshend,A., Poole, C. (Eds.), Encyclopedia of Analytical Science, second ed. Elsevier, pp.343–351.
Lawler, D.M., Brown, R.M., 1991. A simple and inexpensive turbidity meter for theestimation of suspended sediment concentrations. Hydrological Processes 6 (2),159–168.
Loveland, J.P., Bhattacharjee, S., Ryan, J.N., Elimelech, M., 2003. Colloid transport in ageochemically heterogeneous porous medium: aquifer tank experiment andmodeling. Journal of Contaminant Hydrology 65 (3–4), 161–182.
Noell, A.L., Thompson, J.L., Corapcioglu, M.Y., Triay, I.R., 1998. The role of silicacolloids on facilitated caesium transport through glass bead columns andmodelling. Journal of Contaminant Hydrology 31 (1–2), 23–56.
Ogata, A., Banks, R.B., 1961. A Solution of Differential Equation of Dispersion inPorous Media. US Government Printing Office, Washington, DC.
Orwen, J.F., Smart, C.C., 2004. An inexpensive turbidimeter for monitoringsuspended sediment. Geomorphology 68, 3–15.
Papadopoulou, A.A., Mouza, A.A., Paras, S.V., Karablelas, A.J., 1998. A new turbiditymeter for monitoring the quality of water. In: Conf. Abs. Protection andRestoration of the Environment IV, 1–4 July, 1998, Sani, Halkidiki, Greece.
Plantz, P.E., 1984. Particle size measurement from 0.1 to 1000 lm based on lightscattering and diffraction. In: Barth, H.G. (Ed.), Modern Methods of Particle SizeAnalysis. Wiley Interscience.
Puls, R.W., Powell, R.M., 1992. Transport of inorganic colloids through naturalaquifer material: implications for contaminant transport. EnvironmentalScience and Technology 26, 614–621.
Rahman, S.H., 2006. Colloid Movement through Saturated Sandstone Matrix.Unpublished PhD Thesis. University of Birmingham, UK.
Sadar, M., 2003. An Introduction to Laser Nephelometry: An Alternative toConventional Particulate Analysis Methods. Hach Company, Lit No. 7044.
Smith, T.L., Witter, L.D., 1982. Inexpensive laboratory-constructed nephelometer.Applied Environmental Microbiology 44, 1476–1478.
Vanous, R.D., Larson, P.E., Hach, C.C., 1982. The theory and measurement ofturbidity and residue. In: Minear, R.A., Keith, L.H. (Eds.), Water Analysis, vol. 1.Academic Press, New York, pp. 163–234.
Zhuang, J., Jin, Y., 2003. Virus retention and transport through Al-oxide coated sandcolumns: effects of ionic strength and composition. Journal of ContaminantHydrology 60 (3–4), 193–209.
120 R.B. Greswell et al. / Journal of Hydrology 388 (2010) 112–120
Related Documents


![Colloids and Surfaces B: Biointerfaces · Colloids and Surfaces B: Biointerfaces 88 (2011) 279–286 Contents lists available at ScienceDirect Colloids ... [26,27]. Other researchers](https://static.cupdf.com/doc/110x72/5fc50395d8208315bc08a19b/colloids-and-surfaces-b-colloids-and-surfaces-b-biointerfaces-88-2011-279a286.jpg)

