http://www.sciforum.net/conference/wsf-4 World Sustainability Forum 2014 – Conference Proceedings Paper An Inexact Fuzzy Optimization Programming with Hurwicz Criterion (IFOPH) for Sustainable Irrigation Planning in Arid Region Xueting Zeng 1 , Yongpin Li 2, * 1 Research Assistant, MOE Key Laboratory of Regional Energy Systems Optimization, Sino-Canada Resources and Environmental Research Academy, North China Electric Power University, Beijing 102206, China; 2 Ph.D. and Research Scientist, Environmental Systems Engineering Program, Faculty of Engineering and Applied Science, University of Regina, Regina, Sask. S4S 0A2, Canada; E-Mails: [email protected]; [email protected] * Author to whom correspondence should be addressed; Tel.: +13269279739 Fax: +13269279739 Sino- Canada Resources and Environmental Research Academy, North China Electric Power University, Beijing 102206, China Received: 20 September 2014 / Accepted: 6 October 2014 / Published: 1 November 2014 Abstract: In the past decades, sustainability in irrigation planning has been of concern to many researchers and managers. However, uncertainties existed in an irrigation planning system can bring about enormous difficulties and challenges in generating desired decision alternatives with aim of sustainability. In this study, an inexact fuzzy optimization programming with Hurwicz criterion (IFOPH) is developed for sustainable irrigation planning under uncertainty, which incorporates two-stage stochastic programming (TSP), interval-parameter programming (IPP), fuzzy credibility-constraint programming (FCP) and Hurwicz criterion (TCP-CH) within an framework. The developed method is applied to a real case of planning sustainable irrigation OPEN ACCESS

Welcome message from author
This document is posted to help you gain knowledge. Please leave a comment to let me know what you think about it! Share it to your friends and learn new things together.
Transcript
http://www.sciforum.net/conference/wsf-4
World Sustainability Forum 2014 – Conference Proceedings Paper
An Inexact Fuzzy Optimization Programming with Hurwicz
Criterion (IFOPH) for Sustainable Irrigation Planning in Arid
Region
Xueting Zeng 1, Yongpin Li
2, *
1 Research Assistant, MOE Key Laboratory of Regional Energy Systems Optimization, Sino-Canada
Resources and Environmental Research Academy, North China Electric Power University, Beijing
102206, China; 2 Ph.D. and Research Scientist, Environmental Systems Engineering Program, Faculty of Engineering
and Applied Science, University of Regina, Regina, Sask. S4S 0A2, Canada;
E-Mails: [email protected]; [email protected]
* Author to whom correspondence should be addressed; Tel.: +13269279739 Fax: +13269279739 Sino-
Canada Resources and Environmental Research Academy, North China Electric Power University,
Beijing 102206, China
Received: 20 September 2014 / Accepted: 6 October 2014 / Published: 1 November 2014
Abstract: In the past decades, sustainability in irrigation planning has been of concern to many
researchers and managers. However, uncertainties existed in an irrigation planning system can
bring about enormous difficulties and challenges in generating desired decision alternatives
with aim of sustainability. In this study, an inexact fuzzy optimization programming with
Hurwicz criterion (IFOPH) is developed for sustainable irrigation planning under uncertainty,
which incorporates two-stage stochastic programming (TSP), interval-parameter programming
(IPP), fuzzy credibility-constraint programming (FCP) and Hurwicz criterion (TCP-CH) within
an framework. The developed method is applied to a real case of planning sustainable irrigation
OPEN ACCESS
in Tarim Basin, which is one of the aridest regions of China. The results based on confidence
degrees are obtained, which can permit in-depth analyses of various policy scenarios of that are
associated with different levels of economic penalties. Meanwhile, the results reveal that an
appropriate irrigation planning can improve the efficiency of water allocations, which has
brought positive effects on remedying water deficit and promoting the sustainable development
of agricultural production activities. Moreover, tradeoffs between economic benefit and system-
failure risk based on Hurwicz criterion can support generating an increased robustness in risk
control, which can facilitate the local decision makers in adjusting water-allocation pattern.
Keywords: sustainable irrigation planning; water resources management; two-stage stochastic
programming; fuzzy credibility-constraint programming; Hurwicz criterion; uncertainty; arid
region.
1. Introduction
Water resources are lifeline of oasis agriculture development in arid region [1]. Practically, around 70%
of global freshwater diverted to agriculture, at the same time, water demand of irrigation is still increasing
because the farmland being irrigated continues to be expanded. Particular in decades, controversial and
conflict-laden water resources allocation issue has challenged decision makers due to rising demand
pressure for freshwater associated with a variety of factors such as population growth, economic
development, food security, environmental concern, and climate change [2]. Water shortage is subject to
increasing pressure particularly for arid regions that are mainly characterized by low rainfall and high
evaporation. On the contrary, increased population shifts and shrinking water supplies have exacerbated
competition among different users. When the demand for water has reached the limits of what the natural
system can provide with, sustainable irrigation planning has been of concern to many researchers and
managers, which not only contributes to remit pressure of water shortage characterized, but also improve
deteriorated water quality and endangered ecosystems [3-4]. Moreover, irrigation planning systems are
complicated with a variety of uncertainties (e.g., imprecise economic data, random stream flows, uncertain
economic benefits and varied water allocations) and their interactions which may intensify the conflict
laden issues of water allocation [5]. Therefore, comprehensive, complex and ambitious plans for
sustainable irrigation planning under uncertainties is required, with the aim of developing and
implementing appropriate water resources infrastructure and management strategies [6].
Previously, various mathematical programming models were developed for supporting water resources
planning including irrigation planning under uncertainties [7-13]. For example, Maqsood et al. [14]
developed an interval-fuzzy two-stage stochastic programming method for planning water resources
management systems associated with multiple uncertainties, in which techniques of interval-parameter
programming (IPP) and fuzzy programming were integrated into a TSP framework. Li and Huang [15]
proposed a fuzzy-stochastic-based violation analysis (FSVA) for the planning for agriculture water
resources management, in which can deal with uncertainties expressed as probability distributions and
fuzzy sets. Vidoli [16] developed a two stage method for evaluating the water resources service, through
integrating the conditional robust nonparametric frontier and multivariate adaptive regression splines into
a TSP framework. In general, TSP can provide an effective linkage between policies and the economic
penalties, which has advantages in reflecting complexities of system uncertainties as well as analyzing
policy scenarios when the pre-regulated targets are violated.
However uncertainties may be related to errors in acquired data, variations in spatial and temporal units,
and incompleteness or impreciseness of observed information in water resources planning [17]. Fuzzy
programming (FP) is effective in dealing with decision problems under fuzzy goal or constraints and in
handling ambiguous coefficients of objective function and constraints caused by imprecision and
vagueness, when the quality and quantity of uncertain information is often not satisfactory enough to be
presented as probabilistic distribution [15]. Fuzzy credibility constrained programming (FCP) can measure
the confidence levels in fuzzy water system to tackle uncertainties expressed as fuzzy sets, when detailed
information is not able to be presented by interval or stochastic numbers [18-20]. However, FCP can not
tackle uncertainties expressed fuzzy sets which existed in constraint’s left and right-hand sides
contemporarily, particularly in function [21]. Therefore, Hurwicz criterion is introduced into FCP, which
can tackle uncertainties in function when different type uncertainties expressed fuzzy sets in function and
constraints contemporarily. A compromise stroked by optimistic criterion (maximum payoff and minimin
loss) and pessimistic criterion (minimin payoff and maximum loss) of Hurwicz criterion makes that
decision maker is neither adventurous nor conservative in decision process with uncertain importations
[22]. In addiction, the major problem of TSP and FCP methods is that the increased data requirement for
specifying the probability distributions of coefficients may affect their practical applicability [23].
Interval-parameter programming (IPP) is introduced to handle uncertainties in the model’s left- and/or
right-hand sides as well as those that cannot be quantified as membership or distribution functions, since
interval numbers are acceptable as its uncertain inputs [23]. Previously, few studies were reported in the
presentation and interpretation of multiple uncertainties in hybrid formats previously, although multi-types
of uncertainties may exist within the practical irrigation planning.
Therefore, an inexact fuzzy optimization programming with Hurwicz criterion (IFOPH) is developed to
better account for optimizing irrigation planning under uncertainty with aim of sustainability, which
incorporate two-stage stochastic programming (TSP), interval-parameter programming (IPP), fuzzy
credibility-constraint programming (FCP) and Hurwicz criterion (HC) within an framework. The
developed IFOPH method will be applied to a real case study of sustainable irrigation in Tarim Basin,
which is one of the aridest regions in Northwest China. The proposed IFOPH can provide an effective
linkage between conflicting economic benefits and the associated penalties attributed to the violation of
the pre-regulated policies. The modeling results can be used for supporting the adjustment of the existing
irrigation patterns to raise the water demand, as well as the capacity planning of water resources to satisfy
the basin’s increasing water demands. Satisfaction degrees for constraints and Hurwicz criterions can be
represented using interval credibility levels and Hurwicz parameters (i.e., optimistic and pessimistic
criterion), which can provide a scientific support for large-scale regional irrigation under uncertainties at
the watershed level.
2. Model development
In a sustainable irrigation planning problem, a water manager is responsible for allocating water to
multiple crops, with the aim of maximizing system benefits (e.g., economic, and social benefits) based on
limited water. An appropriate planning concluding many factors such as food security, population growth,
ecosystem deterioration and economic-social development should be considered, which can not only
improve system benefits, but also optimal water availabilities. Based on local irrigation policies, a
prescribed quantity of water is promised to each crop. If the promised water is delivered, it will result in
net benefits to the local economy; otherwise, crops will have to either obtain water from more expensive
sources or curtail their development plans, resulting in economic penalties. In such a problem, the water
flow levels are uncertain (expressed as random variables), while a decision of water-allocation target (first
stage decision) must be made before the realization of random variables, and then a recourse action can be
taken after the disclosure of random variables (second-stage decision) [23]. Therefore, this problem under
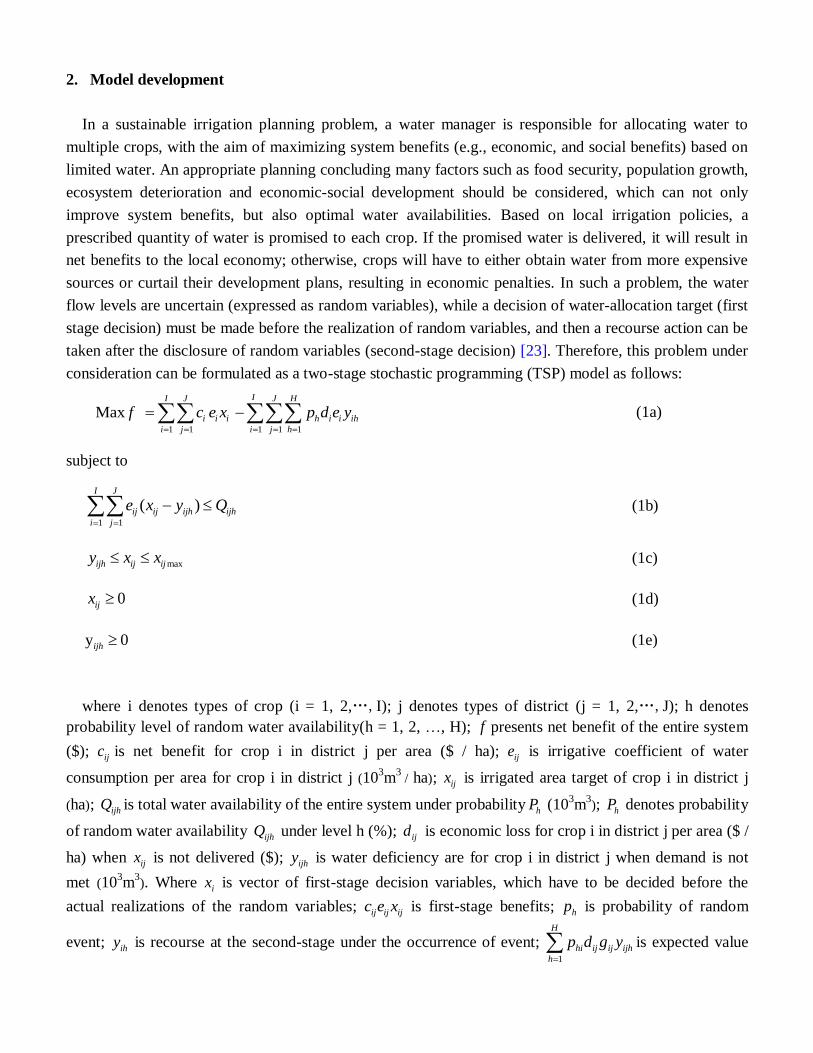
consideration can be formulated as a two-stage stochastic programming (TSP) model as follows:
1 1 1 1 1
Max II J J H
i i i h i i ih
i j i j h
f c e x p d e y
(1a)
subject to
1 1
( )I J
ij ij ijh ijh
i j
e x y Q
(1b)
maxijh ij ijy x x (1c)
0ijx (1d)
y 0ijh (1e)
where i denotes types of crop (i = 1, 2,…,I); j denotes types of district (j = 1, 2,…,J); h denotes
probability level of random water availability(h = 1, 2, …, H); f presents net benefit of the entire system
($); ijc is net benefit for crop i in district j per area ($ / ha); ije is irrigative coefficient of water
consumption per area for crop i in district j (103m
3 / ha); ijx is irrigated area target of crop i in district j
(ha); ijhQ is total water availability of the entire system under probability hP (103m
3); hP denotes probability
of random water availability ijhQ under level h (%); ijd is economic loss for crop i in district j per area ($ /
ha) when ijx is not delivered ($); ijhy is water deficiency are for crop i in district j when demand is not
met (103m
3). Where ix is vector of first-stage decision variables, which have to be decided before the
actual realizations of the random variables; ij ij ijc e x is first-stage benefits; hp is probability of random
event; ihy
is recourse at the second-stage under the occurrence of event; 1
H
hi ij ij ijh
h
p d g y
is expected value
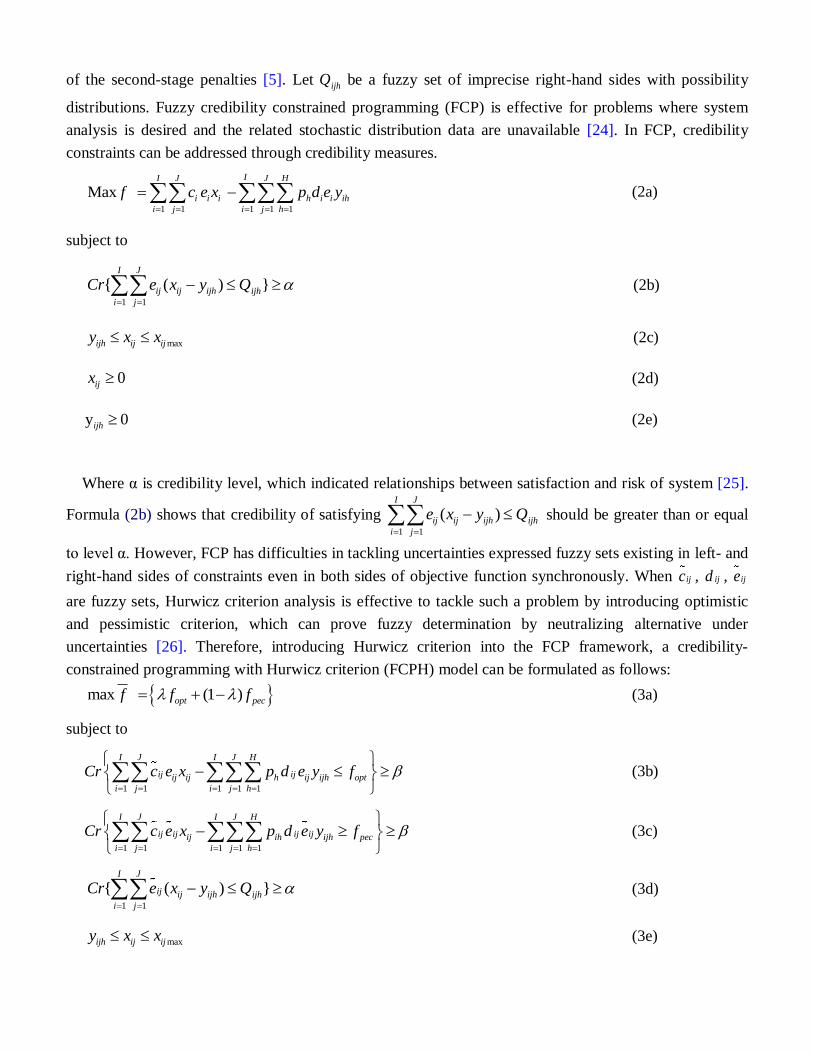
of the second-stage penalties [5]. Let ijhQ be a fuzzy set of imprecise right-hand sides with possibility
distributions. Fuzzy credibility constrained programming (FCP) is effective for problems where system
analysis is desired and the related stochastic distribution data are unavailable [24]. In FCP, credibility
constraints can be addressed through credibility measures.
1 1 1 1 1
Max II J J H
i i i h i i ih
i j i j h
f c e x p d e y
(2a)
subject to
1 1
{ ( ) }I J
ij ij ijh ijh
i j
Cr e x y Q
(2b)
maxijh ij ijy x x (2c)
0ijx (2d)
y 0ijh (2e)
Where α is credibility level, which indicated relationships between satisfaction and risk of system [25].
Formula (2b) shows that credibility of satisfying 1 1
( )I J
ij ij ijh ijh
i j
e x y Q
should be greater than or equal
to level α. However, FCP has difficulties in tackling uncertainties expressed fuzzy sets existing in left- and
right-hand sides of constraints even in both sides of objective function synchronously. When ijc , ijd , ije
are fuzzy sets, Hurwicz criterion analysis is effective to tackle such a problem by introducing optimistic
and pessimistic criterion, which can prove fuzzy determination by neutralizing alternative under
uncertainties [26]. Therefore, introducing Hurwicz criterion into the FCP framework, a credibility-
constrained programming with Hurwicz criterion (FCPH) model can be formulated as follows:
max (1 )opt pecf f f (3a)
subject to
1 1 1 1 1
I J I J H
ij ijij ij h ij ijh opt
i j i j h
Cr c e x p d e y f
(3b)
1 1 1 1 1
I J I J H
ij ij ij ijij ih ijh pec
i j i j h
Cr c e x p d e y f
(3c)
1 1
{ ( ) }I J
ij ij ijh ijh
i j
Cr e x y Q
(3d)
maxijh ij ijy x x (3e)
0ijx (3f)
y 0ijh (3e)
where the decision payoffs are weighted by a coefficient of optimism λ (realism), where 0 1 .
Conversely, ( 1 ) represent a measure of the decision maker’s pessimism. The Hurwicz criterion
requires that, for each decision alternative, the maximum payoff (minimum cost) be multiplied by the
coefficient of optimism, and the minimum payoff (maximum cost) be multiplied by the coefficient of
pessimism [21]. Therefore, by varying the coefficient λ, the Hurwicz criterion becomes various criteria,
e.g., when λ= 1, the criterion is the optimistic criterion; when λ= 0, it degenerate to a pessimistic criterion.
is credibility levels to (3b) and (3c), which indicated relationships between satisfaction and risk of
system under optimistic and pessimistic situations.
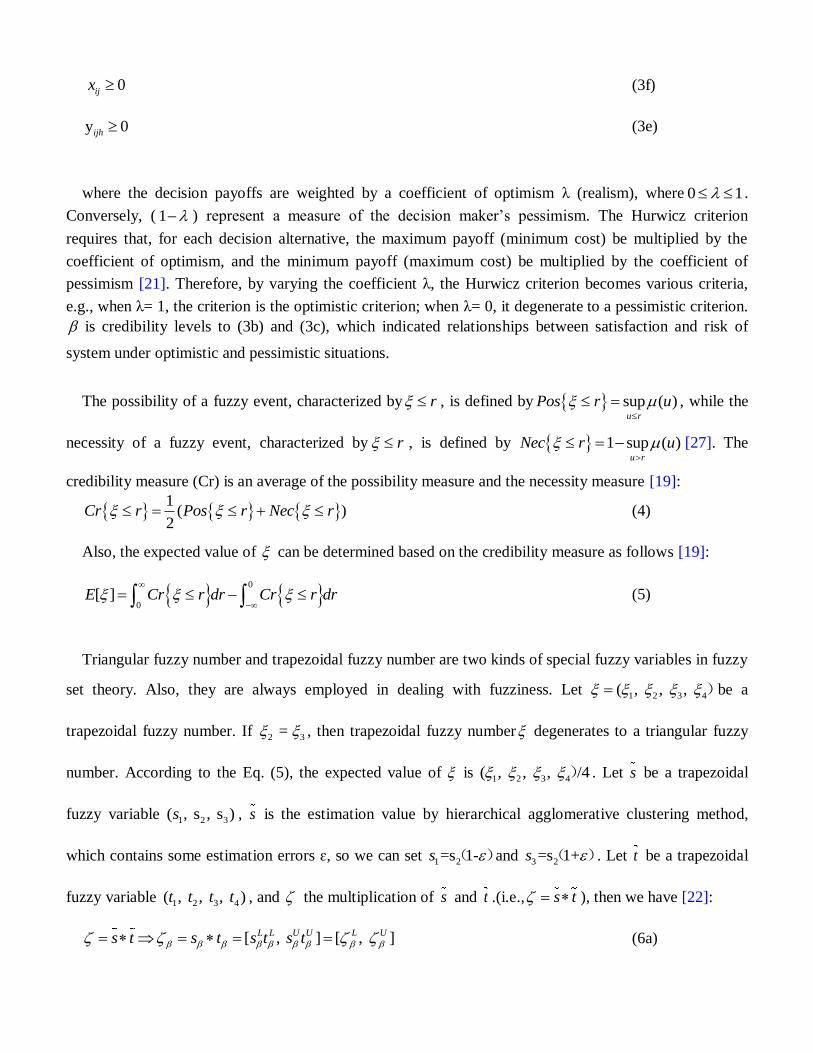
The possibility of a fuzzy event, characterized by r , is defined by sup ( )u r
Pos r u
, while the
necessity of a fuzzy event, characterized by r , is defined by 1 sup ( )u r
Nec r u
[27]. The
credibility measure (Cr) is an average of the possibility measure and the necessity measure [19]:
1
( )2
Cr r Pos r Nec r (4)
Also, the expected value of can be determined based on the credibility measure as follows [19]:
0
0[ ]E Cr r dr Cr r dr
(5)
Triangular fuzzy number and trapezoidal fuzzy number are two kinds of special fuzzy variables in fuzzy
set theory. Also, they are always employed in dealing with fuzziness. Let 1 2 3 4( , , , )be a
trapezoidal fuzzy number. If 2 3 = , then trapezoidal fuzzy number degenerates to a triangular fuzzy
number. According to the Eq. (5), the expected value of is 1 2 3 4( , , , /4 ) . Let s be a trapezoidal
fuzzy variable 1 2 3( , s , s )s , s is the estimation value by hierarchical agglomerative clustering method,
which contains some estimation errors ɛ, so we can set 1 2=s 1-s ( )and 3 2=s 1+s ( ). Let t be a trapezoidal
fuzzy variable 1 2 3 4( , , , )t t t t , and the multiplication of s and t .(i.e., s t ), then we have [22]:
[ , ] [ , ]L L U U L Us t s t s t s t (6a)
2
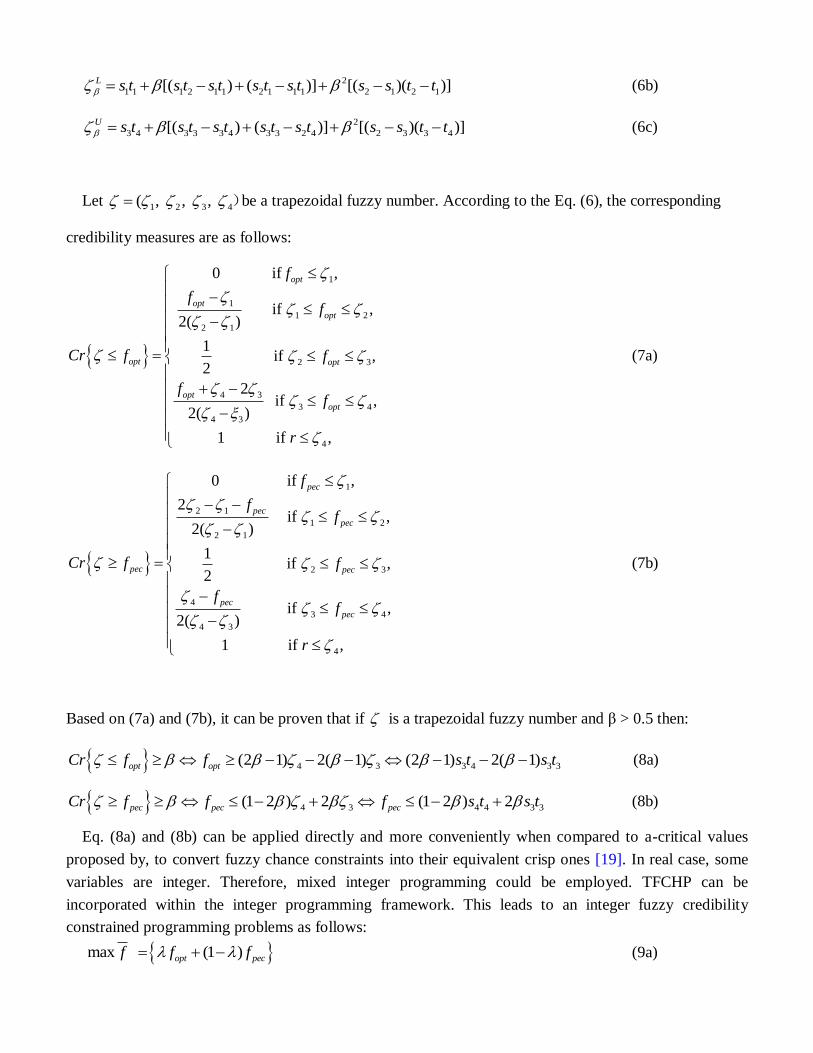
1 1 1 2 1 1 2 1 1 1 2 1 2 1[( ) ( )] [( )( )]L s t s t s t s t s t s s t t (6b)
2
3 4 3 3 3 4 3 3 2 4 2 3 3 4[( ) ( )] [( )( )]U s t s t s t s t s t s s t t (6c)
Let 1 2 3 4( , , , )be a trapezoidal fuzzy number. According to the Eq. (6), the corresponding
credibility measures are as follows:
1
1
1 2
2 1
2 3
4 3
3 4
4 3
4
0 if ,
if ,2( )
1 if ,
2
2 if ,
2( )
1 if ,
opt
opt
opt
opt opt
opt
opt
f
ff
Cr f f
ff
r
(7a)
1
2 1
1 2
2 1
2 3
4
3 4
4 3
4
0 if ,
2 if ,
2( )
1 if ,
2
if ,2( )
1 if ,
pec
pec
pec
pec pec
pec
pec
f
ff
Cr f f
ff
r
(7b)
Based on (7a) and (7b), it can be proven that if is a trapezoidal fuzzy number and β > 0.5 then:
4 3 3 4 3 3(2 1) 2( 1) (2 1) 2( 1)opt optCr f f s t s t (8a)
4 3 4 4 3 3(1 2 ) 2 (1 2 ) 2pec pec pecCr f f f s t s t (8b)
Eq. (8a) and (8b) can be applied directly and more conveniently when compared to a-critical values
proposed by, to convert fuzzy chance constraints into their equivalent crisp ones [19]. In real case, some
variables are integer. Therefore, mixed integer programming could be employed. TFCHP can be
incorporated within the integer programming framework. This leads to an integer fuzzy credibility
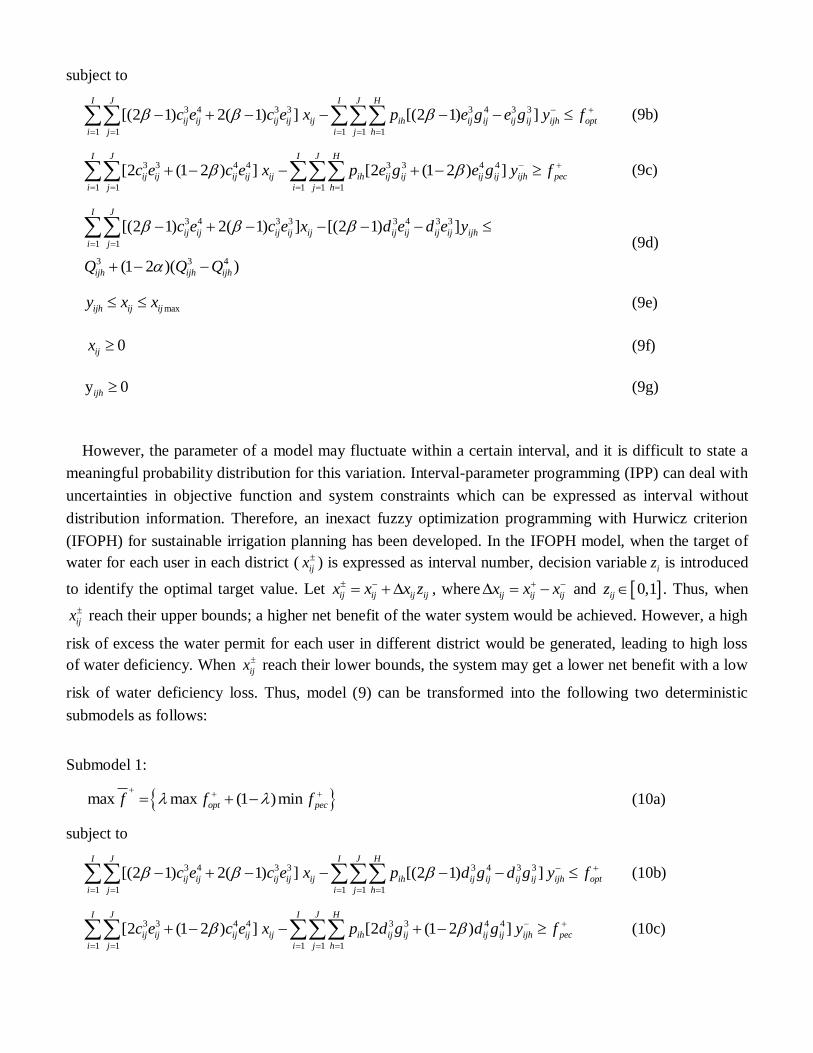
constrained programming problems as follows:
max (1 )opt pecf f f (9a)
subject to
3 4 3 3 3 4 3 3
1 1 1 1 1
[(2 1) 2( 1) ] [(2 1) ] I J I J H
ij ij ij ij ij ih ij ij ij ij ijh opt
i j i j h
c e c e x p e g e g y f
(9b)
3 3 4 4 3 3 4 4
1 1 1 1 1
[2 (1 2 ) ] [2 (1 2 ) ] I J I J H
ij ij ij ij ij ih ij ij ij ij ijh pec
i j i j h
c e c e x p e g e g y f
(9c)
3 4 3 3 3 4 3 3
1 1
3 3 4
[(2 1) 2( 1) ] [(2 1) ]
(1 2 )( )
I J
ij ij ij ij ij ij ij ij ij ijh
i j
ijh ijh ijh
c e c e x d e d e y
Q Q Q
(9d)
maxijh ij ijy x x (9e)
0ijx (9f)
y 0ijh (9g)
However, the parameter of a model may fluctuate within a certain interval, and it is difficult to state a
meaningful probability distribution for this variation. Interval-parameter programming (IPP) can deal with
uncertainties in objective function and system constraints which can be expressed as interval without
distribution information. Therefore, an inexact fuzzy optimization programming with Hurwicz criterion
(IFOPH) for sustainable irrigation planning has been developed. In the IFOPH model, when the target of
water for each user in each district ( ijx ) is expressed as interval number, decision variable iz is introduced
to identify the optimal target value. Let ij ij ij ijx x x z , where ij ij ijx x x and 0,1ijz . Thus, when
ijx reach their upper bounds; a higher net benefit of the water system would be achieved. However, a high
risk of excess the water permit for each user in different district would be generated, leading to high loss
of water deficiency. When ijx reach their lower bounds, the system may get a lower net benefit with a low
risk of water deficiency loss. Thus, model (9) can be transformed into the following two deterministic
submodels as follows:
Submodel 1:
max max (1 )minopt pecf f f
(10a)
subject to
3 4 3 3 3 4 3 3
1 1 1 1 1
[(2 1) 2( 1) ] [(2 1) ] I J I J H
ij ij ij ij ij ih ij ij ij ij ijh opt
i j i j h
c e c e x p d g d g y f
(10b)
3 3 4 4 3 3 4 4
1 1 1 1 1
[2 (1 2 ) ] [2 (1 2 ) ] I J I J H
ij ij ij ij ij ih ij ij ij ij ijh pec
i j i j h
c e c e x p d g d g y f
(10c)
3 4 3 3 3 4 3 3
1 1
3 3 4
{[(2 1) 2( 1) ]( ) [(2 1) ] }
(1 2 )( )
I J
ij ij ij ij ij ij i ij ij ij ij ijh
i j
ijh ijh ijh
c e c e x x z e g e g y
Q Q Q
(10d)
max( )ijh ij ij i ijy x x z x (10e)
0 ijhy i , (10f)
Submodel 2:
1max max (1 )minopt pecf f f
(11a)
subject to
3 4 3 3 3 4 3 3
1 1 1 1 1
[(2 1) 2( 1) ] [(2 1) ] I J I J H
ij ij ij ij ij ih ij ij ij ij ijh opt
i j i j h
c e c e x p e g e g y f
(11b)
3 3 4 4 3 3 4 4
1 1 1 1 1
[2 (1 2 ) ] [2 (1 2 ) ] I J I J H
ij ij ij ij ij ih ij ij ij ij ijh pec
i j i j h
c e c e x p e g e g y f
(11c)
3 4 3 3 3 4 3 3
1 1
3 3 4
{[(2 1) 2( 1) ]( ) [(2 1) ] }
(1 2 )( )
I J
ij ij ij ij ij ij i ij ij ij ij ijh
i j
ijh ijh ijh
c e c e x x z e g e g y
Q Q Q
(11d)
max( )ijh ij ij i ijy x x z x (11e)
0 ijhy i , (11f)
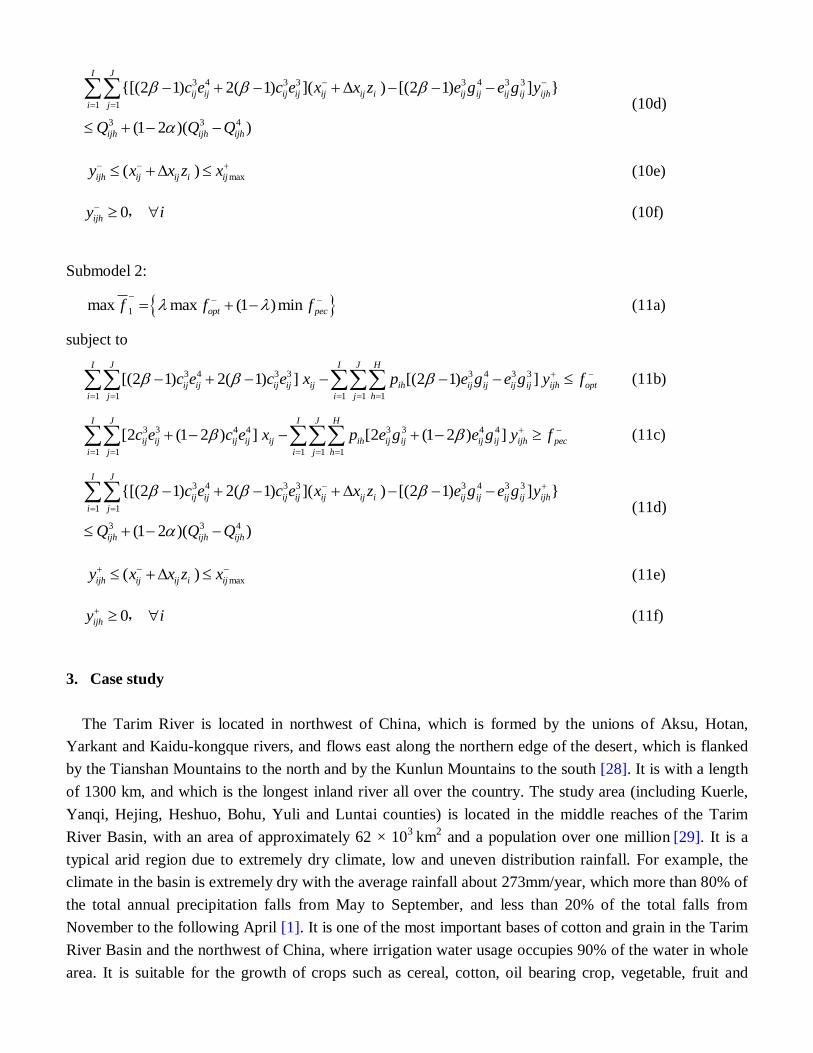
3. Case study
The Tarim River is located in northwest of China, which is formed by the unions of Aksu, Hotan,
Yarkant and Kaidu-kongque rivers, and flows east along the northern edge of the desert, which is flanked
by the Tianshan Mountains to the north and by the Kunlun Mountains to the south [28]. It is with a length
of 1300 km, and which is the longest inland river all over the country. The study area (including Kuerle,
Yanqi, Hejing, Heshuo, Bohu, Yuli and Luntai counties) is located in the middle reaches of the Tarim
River Basin, with an area of approximately 62 × 103
km2 and a population over one million
[29]. It is a
typical arid region due to extremely dry climate, low and uneven distribution rainfall. For example, the
climate in the basin is extremely dry with the average rainfall about 273mm/year, which more than 80% of
the total annual precipitation falls from May to September, and less than 20% of the total falls from
November to the following April [1]. It is one of the most important bases of cotton and grain in the Tarim
River Basin and the northwest of China, where irrigation water usage occupies 90% of the water in whole
area. It is suitable for the growth of crops such as cereal, cotton, oil bearing crop, vegetable, fruit and
forage, which accelerates agricultural products processing and manufacturing [30]. Water demands of
crops in seven districts rely on river’s streamflow, which is mainly from its upstream, snow melting, and
rainfall. Due to dry climate, low-rainfall, and high evaporation, the water supply capacity of river is quite
low, which has difficulties in satisfying the water demands of crops. Particular in recent years, the demand
of irrigation has reached the limits of what the natural system can provide, so that water shortage can
become a major obstacle to social and economic development for this region. Therefore, population
growth, food security challenge, economy development and the potential threat of climate change elevate
the attention given to efficient and sustainable irrigation.
The manager of study region desires to create a sustainable plan to allocate water resources to multiple
crops, which should be consider the system benefit and system disruption risk attributable to uncertainties
simultaneously. On the one hand, appropriate decisions have been made by water manager based on water
demands of various crops planting. If the promised water is delivered, a net benefit to the local economy
will be generated for each unit of water allocated; otherwise, either the water must be obtained from
higher-priced alternatives or the demand must be curtailed by reduced planting, resulting in a reduced
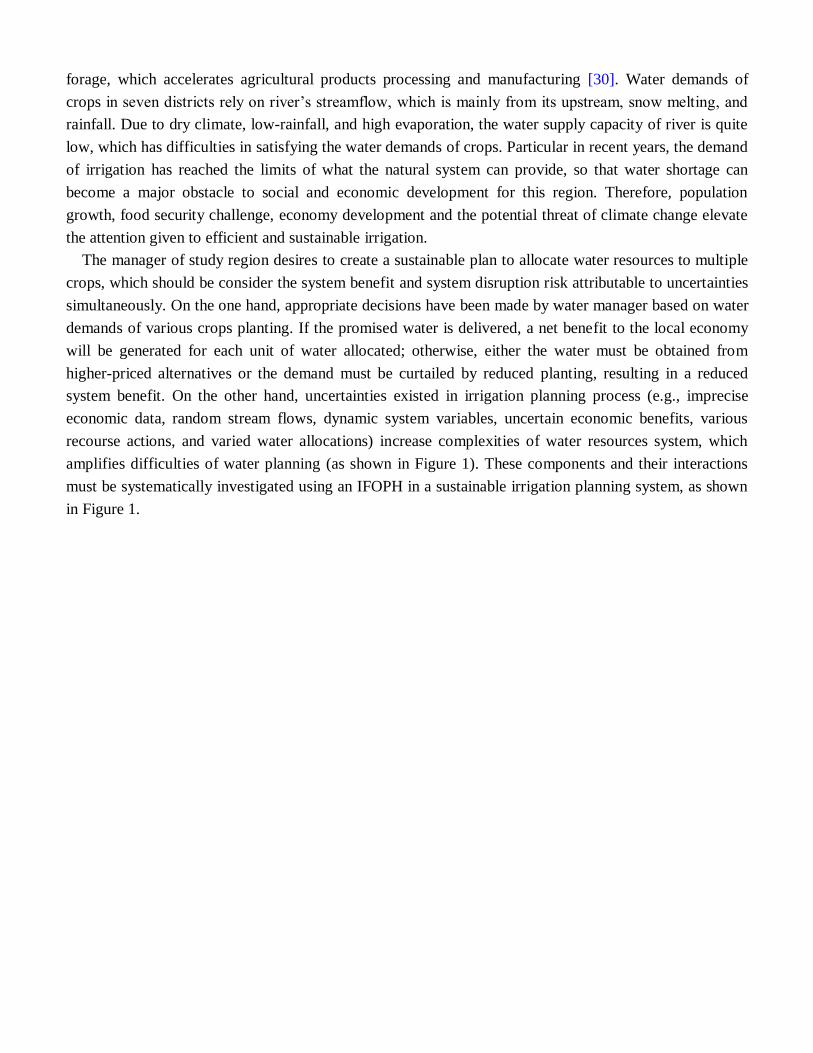
system benefit. On the other hand, uncertainties existed in irrigation planning process (e.g., imprecise
economic data, random stream flows, dynamic system variables, uncertain economic benefits, various
recourse actions, and varied water allocations) increase complexities of water resources system, which
amplifies difficulties of water planning (as shown in Figure 1). These components and their interactions
must be systematically investigated using an IFOPH in a sustainable irrigation planning system, as shown
in Figure 1.
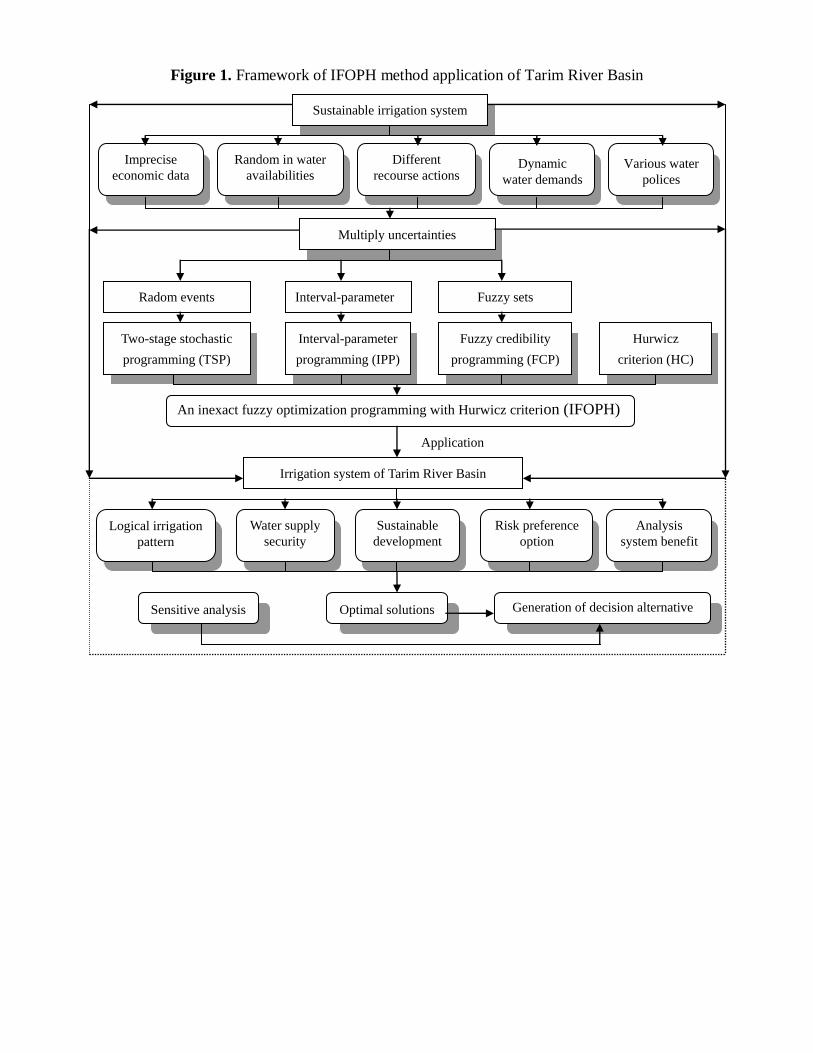
Figure 1. Framework of IFOPH method application of Tarim River Basin
Application
Radom events Fuzzy sets
Fuzzy credibility
programming (FCP)
Different
recourse actions
Dynamic
water demands
Random in water
availabilities
Imprecise
economic data
Irrigation system of Tarim River Basin
Two-stage stochastic
programming (TSP)
Optimal solutions
Hurwicz
criterion (HC)
Sensitive analysis
Various water
polices
Sustainable irrigation system
Multiply uncertainties
Interval-parameter
programming (IPP)
Interval-parameter
An inexact fuzzy optimization programming with Hurwicz criterion (IFOPH)
Logical irrigation
pattern
Water supply
security
Sustainable
development
Analysis
system benefit
Generation of decision alternative
Risk preference
option
Table 1 Economic data
Cereal Cotton Oil bearing crops Vegetable Forage
Net benefit when water demand is satisfied ( $)
Kuerle [4096, 4180, 4264] [3018, 3080, 3142] [3032, 3094, 3156] [7584, 7739, 7893] [3336, 3404, 3473]
Yanqi [3773, 3850, 3927] [2533, 2585, 2636] [3126, 2585, 2636] [7082, 7227, 7372] [3870, 3949, 4018]
Hejing [5050, 5154, 5257] [2452, 2503, 2553] [2965, 3025, 3086] [7578, 7733, 7888] [3380, 3449, 3517]
Heshuo [5336, 5445, 5554] [2954, 3014, 3074] [2781, 2838, 2895] [7320, 7469, 7618] [3557, 3630, 3703]
Bohu [3881, 3960, 4039] [3051, 3113, 3175] [3115, 3179, 3242] [8558, 8733, 8907] [3297, 3364, 3431]
Yuli [4204, 4290, 4375] [2264, 2310, 2356] [3101, 3179, 3321] [7761, 7920, 8078] [3401, 3471, 3560]
Luntai [3671, 2745, 3820] [3115, 3179, 3242] [3180, 3245, 33110] [7600, 7755, 7910] [3773, 3850, 3927]
Loss of net benefit when water demand is satisfied ( $)
Kuerle [4670, 4765, 4860] [3441, 3511, 3581] [3457, 3528, 3598] [[8645, 8821, 8998] [3803, 3881, 3959]
Yanqi [4301, 4389, 4476] [2888, 2947, 2010] [3564, 3637,3709] [8074, 8239, 8403] [4411, 4502, 4592]
Hejing [5757, 5874, 5992] [2796, 2853, 2910] [3380, 3449, 3515] [8639, 8815, 8992] [3853, 3932, 4010]
Heshuo [6083, 6207, 6331] [3367, 3436, 3505] [3171, 3235, 3300] [8344, 8515, 8685] [4055, 4138, 4221]
Bohu [4424, 4514, 4604] [3478, 3549, 3620] [3551, 3624, 3697] [9756, 9956, 10155] [3758, 3835, 3911]
Yuli [4793, 4891, 4988] [2580, 2633,2686] [3638, 3711, 3786] [8848, 9028, 9209] [3877, 3956, 4055]
Luntai [4184, 4270, 4355] [3552, 3624, 3697] [3625, 3699, 3773] [8664, 8841, 9018] [4301, 4389, 4477]
Table 2 Probability levels and total water availabilities
Flow level Low (h=1) Low-medium (h=2) Medium (h=3) High-medium (h=4) High (h=5)
Probability (%) 0.15 0.49 0.24 0.08 0.04
Water flow (106 m3) [2291.55, 2326.45] [2357.64, 2393.55] [2404.8, 2441.42] [2451.91, 2489.29] [2546.25, 2489.29]
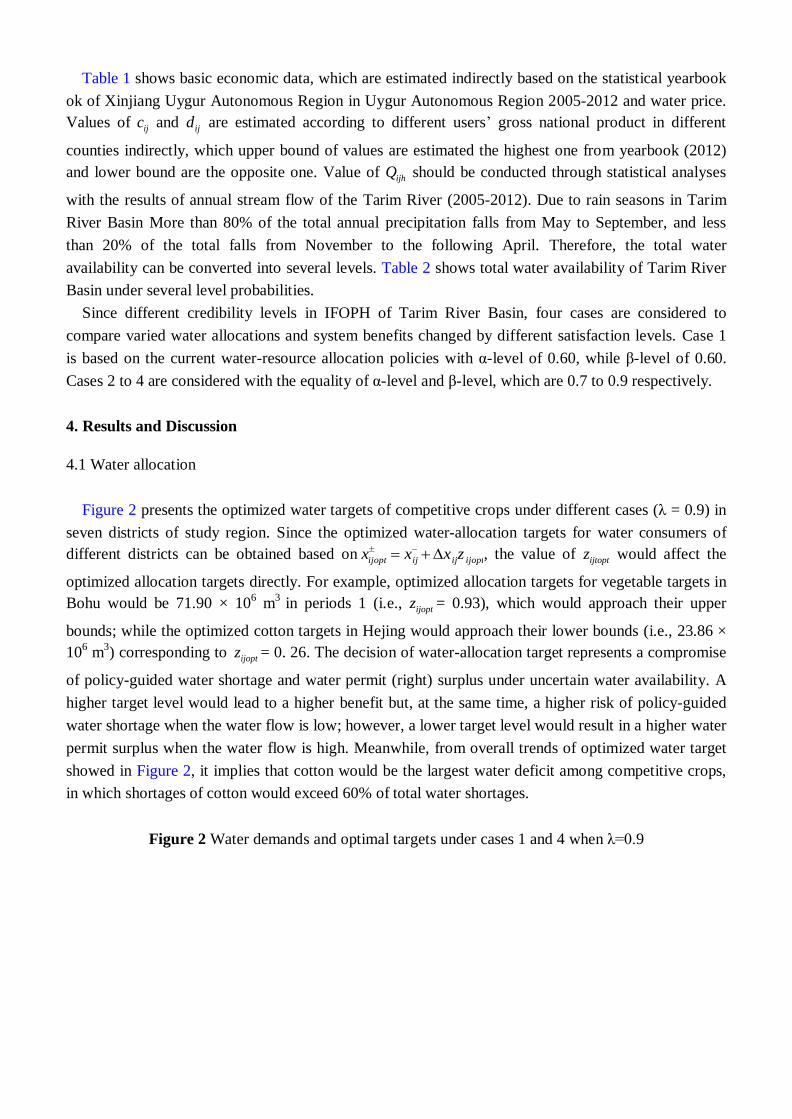
Table 1 shows basic economic data, which are estimated indirectly based on the statistical yearbook
ok of Xinjiang Uygur Autonomous Region in Uygur Autonomous Region 2005-2012 and water price.
Values of ijc and ijd are estimated according to different users’ gross national product in different
counties indirectly, which upper bound of values are estimated the highest one from yearbook (2012)
and lower bound are the opposite one. Value of ijhQ should be conducted through statistical analyses
with the results of annual stream flow of the Tarim River (2005-2012). Due to rain seasons in Tarim
River Basin More than 80% of the total annual precipitation falls from May to September, and less
than 20% of the total falls from November to the following April. Therefore, the total water
availability can be converted into several levels. Table 2 shows total water availability of Tarim River
Basin under several level probabilities.
Since different credibility levels in IFOPH of Tarim River Basin, four cases are considered to
compare varied water allocations and system benefits changed by different satisfaction levels. Case 1
is based on the current water-resource allocation policies with α-level of 0.60, while β-level of 0.60.
Cases 2 to 4 are considered with the equality of α-level and β-level, which are 0.7 to 0.9 respectively.
4. Results and Discussion
4.1 Water allocation
Figure 2 presents the optimized water targets of competitive crops under different cases (λ = 0.9) in
seven districts of study region. Since the optimized water-allocation targets for water consumers of
different districts can be obtained based on ijopt ij ij ijoptx x x z , the value of ijtoptz would affect the
optimized allocation targets directly. For example, optimized allocation targets for vegetable targets in
Bohu would be 71.90 × 10⁶ m
3 in periods 1 (i.e., ijoptz = 0.93), which would approach their upper
bounds; while the optimized cotton targets in Hejing would approach their lower bounds (i.e., 23.86 ×
106 m
3) corresponding to ijoptz = 0. 26. The decision of water-allocation target represents a compromise
of policy-guided water shortage and water permit (right) surplus under uncertain water availability. A
higher target level would lead to a higher benefit but, at the same time, a higher risk of policy-guided
water shortage when the water flow is low; however, a lower target level would result in a higher water
permit surplus when the water flow is high. Meanwhile, from overall trends of optimized water target
showed in Figure 2, it implies that cotton would be the largest water deficit among competitive crops,
in which shortages of cotton would exceed 60% of total water shortages.
Figure 2 Water demands and optimal targets under cases 1 and 4 when λ=0.9
14
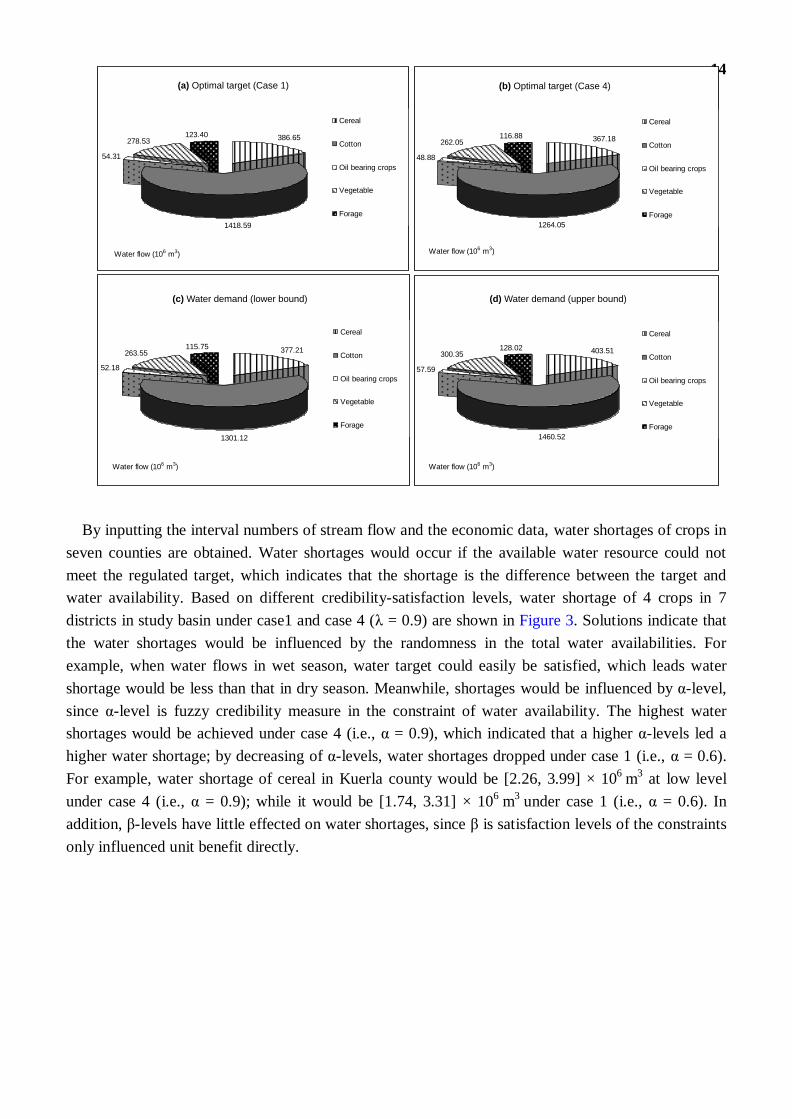
By inputting the interval numbers of stream flow and the economic data, water shortages of crops in
seven counties are obtained. Water shortages would occur if the available water resource could not
meet the regulated target, which indicates that the shortage is the difference between the target and
water availability. Based on different credibility-satisfaction levels, water shortage of 4 crops in 7
districts in study basin under case1 and case 4 (λ = 0.9) are shown in Figure 3. Solutions indicate that
the water shortages would be influenced by the randomness in the total water availabilities. For
example, when water flows in wet season, water target could easily be satisfied, which leads water
shortage would be less than that in dry season. Meanwhile, shortages would be influenced by α-level,
since α-level is fuzzy credibility measure in the constraint of water availability. The highest water
shortages would be achieved under case 4 (i.e., α = 0.9), which indicated that a higher α-levels led a
higher water shortage; by decreasing of α-levels, water shortages dropped under case 1 (i.e., α = 0.6).
For example, water shortage of cereal in Kuerla county would be [2.26, 3.99] × 106
m3 at low level
under case 4 (i.e., α = 0.9); while it would be [1.74, 3.31] × 106
m3
under case 1 (i.e., α = 0.6). In
addition, β-levels have little effected on water shortages, since β is satisfaction levels of the constraints
only influenced unit benefit directly.
Water flow (106 m3)
386.65
1418.59
54.31
278.53123.40
Cereal
Cotton
Oil bearing crops
Vegetable
Forage
Water flow (106 m3)
367.18
1264.05
48.88
262.05116.88
Cereal
Cotton
Oil bearing crops
Vegetable
Forage
Water flow (106 m3)
377.21
1301.12
52.18
263.55115.75
Cereal
Cotton
Oil bearing crops
Vegetable
Forage
Water flow (106 m3)
403.51
1460.52
57.59
300.35128.02
Cereal
Cotton
Oil bearing crops
Vegetable
Forage
(a) Optimal target (Case 1) (b) Optimal target (Case 4)
(c) Water demand (lower bound) (d) Water demand (upper bound)
15
Figure 3 Water shortages under cases 1 and 4 when λ=0.9
(b) Upper bound
0
3
6
9
12
15
Kuerla
Yanqi
Hejin
g
Heshuo
Bohu
Yuli
Lunta
i
Kuerla
Yanqi
Hejin
g
Heshuo
Bohu
Yuli
Lunta
i
Kuerla
Yanqi
Hejin
g
Heshuo
Bohu
Yuli
Lunta
i
Kuerla
Yanqi
Hejin
g
Heshuo
Bohu
Yuli
Lunta
i
Kuerla
Yanqi
Hejin
g
Heshuo
Bohu
Yuli
Lunta
i
Cereal Cotton Oil bearing crops Vegetable Forage
Wa
ter
sh
ort
ag
e (
10
6 m
3)
C1 C4
(a) Lower bound
0
3
6
9
12
15
Kuerla
Yanqi
Hejin
g
Heshuo
Bohu
Yuli
Lunta
i
Kuerla
Yanqi
Hejin
g
Heshuo
Bohu
Yuli
Lunta
i
Kuerla
Yanqi
Hejin
g
Heshuo
Bohu
Yuli
Lunta
i
Kuerla
Yanqi
Hejin
g
Heshuo
Bohu
Yuli
Lunta
i
Kuerla
Yanqi
Hejin
g
Heshuo
Bohu
Yuli
Lunta
i
Cereal Cotton Oil bearing crops Vegetable Forage
Wa
ter
sh
ort
ag
e (
10
6 m
3)
C1 C4
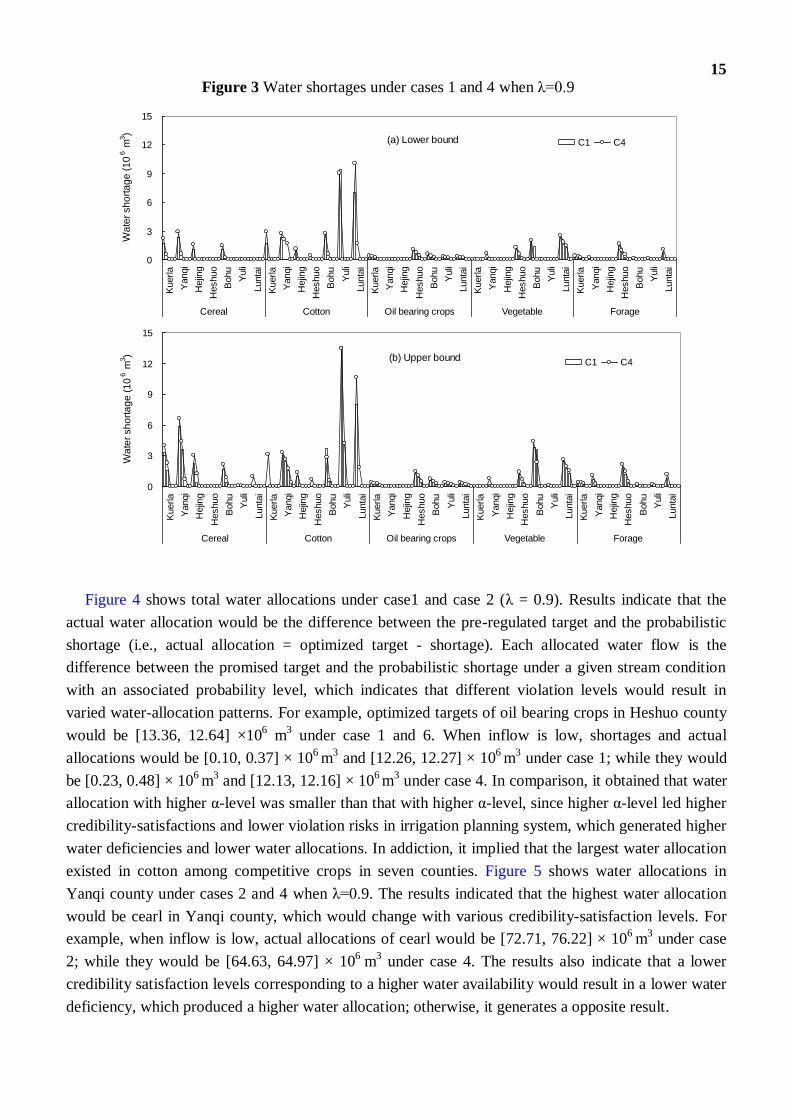
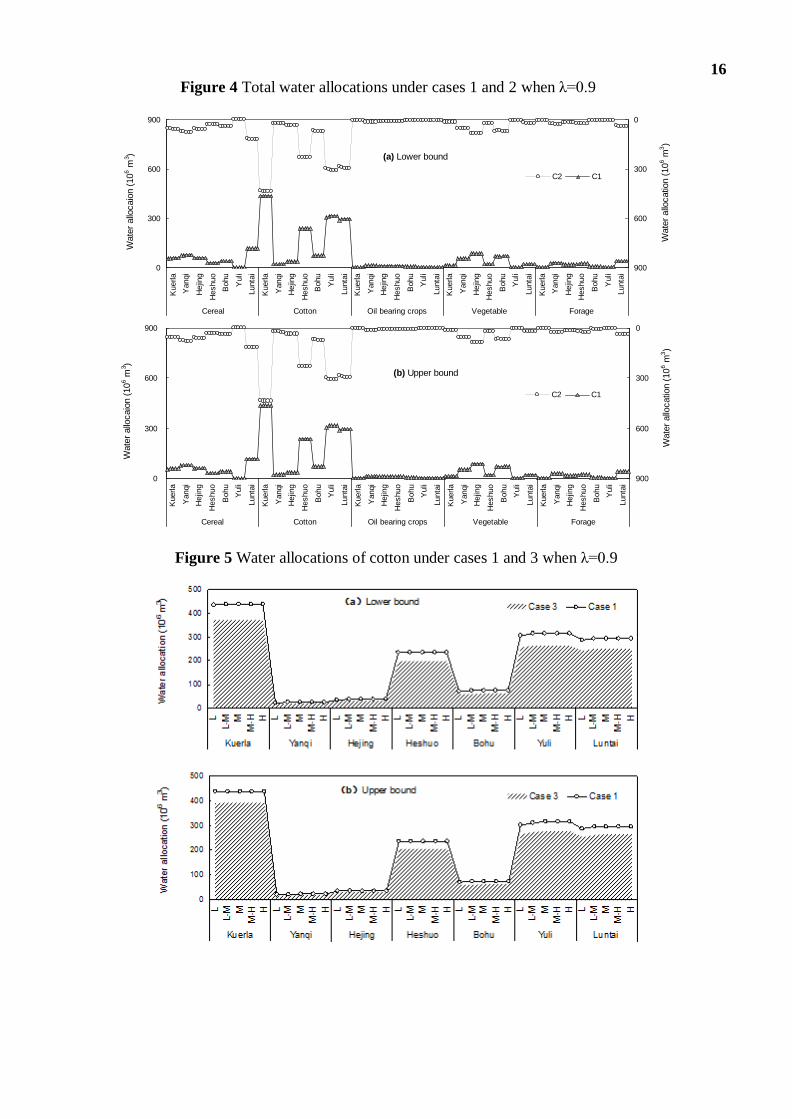
Figure 4 shows total water allocations under case1 and case 2 (λ = 0.9). Results indicate that the
actual water allocation would be the difference between the pre-regulated target and the probabilistic
shortage (i.e., actual allocation = optimized target - shortage). Each allocated water flow is the
difference between the promised target and the probabilistic shortage under a given stream condition
with an associated probability level, which indicates that different violation levels would result in
varied water-allocation patterns. For example, optimized targets of oil bearing crops in Heshuo county
would be [13.36, 12.64] ×106 m
3 under case 1 and 6. When inflow is low, shortages and actual
allocations would be [0.10, 0.37] × 106 m
3 and [12.26, 12.27] × 10
6 m
3 under case 1; while they would
be [0.23, 0.48] × 106 m
3 and [12.13, 12.16] × 10
6 m
3 under case 4. In comparison, it obtained that water
allocation with higher α-level was smaller than that with higher α-level, since higher α-level led higher
credibility-satisfactions and lower violation risks in irrigation planning system, which generated higher
water deficiencies and lower water allocations. In addiction, it implied that the largest water allocation
existed in cotton among competitive crops in seven counties. Figure 5 shows water allocations in
Yanqi county under cases 2 and 4 when λ=0.9. The results indicated that the highest water allocation
would be cearl in Yanqi county, which would change with various credibility-satisfaction levels. For
example, when inflow is low, actual allocations of cearl would be [72.71, 76.22] × 106
m3 under case
2; while they would be [64.63, 64.97] × 106
m3 under case 4. The results also indicate that a lower
credibility satisfaction levels corresponding to a higher water availability would result in a lower water
deficiency, which produced a higher water allocation; otherwise, it generates a opposite result.
16
Figure 4 Total water allocations under cases 1 and 2 when λ=0.9
(a) Lower bound
0
300
600
900
Kuerla
Yanqi
Hejin
g
Heshuo
Bohu
Yuli
Lunta
i
Kuerla
Yanqi
Hejin
g
Heshuo
Bohu
Yuli
Lunta
i
Kuerla
Yanqi
Hejin
g
Heshuo
Bohu
Yuli
Lunta
i
Kuerla
Yanqi
Hejin
g
Heshuo
Bohu
Yuli
Lunta
i
Kuerla
Yanqi
Hejin
g
Heshuo
Bohu
Yuli
Lunta
i
Cereal Cotton Oil bearing crops Vegetable Forage
Wate
r allo
caio
n (
10 6 m
3)
0
300
600
900
Wate
r allo
catio
n (
10 6 m
3)
C2 C1
(b) Upper bound
0
300
600
900
Kuerla
Yanqi
Hejin
g
Heshuo
Bohu
Yuli
Lunta
i
Kuerla
Yanqi
Hejin
g
Heshuo
Bohu
Yuli
Lunta
i
Kuerla
Yanqi
Hejin
g
Heshuo
Bohu
Yuli
Lunta
i
Kuerla
Yanqi
Hejin
g
Heshuo
Bohu
Yuli
Lunta
i
Kuerla
Yanqi
Hejin
g
Heshuo
Bohu
Yuli
Lunta
i
Cereal Cotton Oil bearing crops Vegetable Forage
Wate
r allo
caio
n (
10 6 m
3)
0
300
600
900
Wate
r allo
catio
n (
10 6 m
3)
C2 C1
Figure 5 Water allocations of cotton under cases 1 and 3 when λ=0.9
17
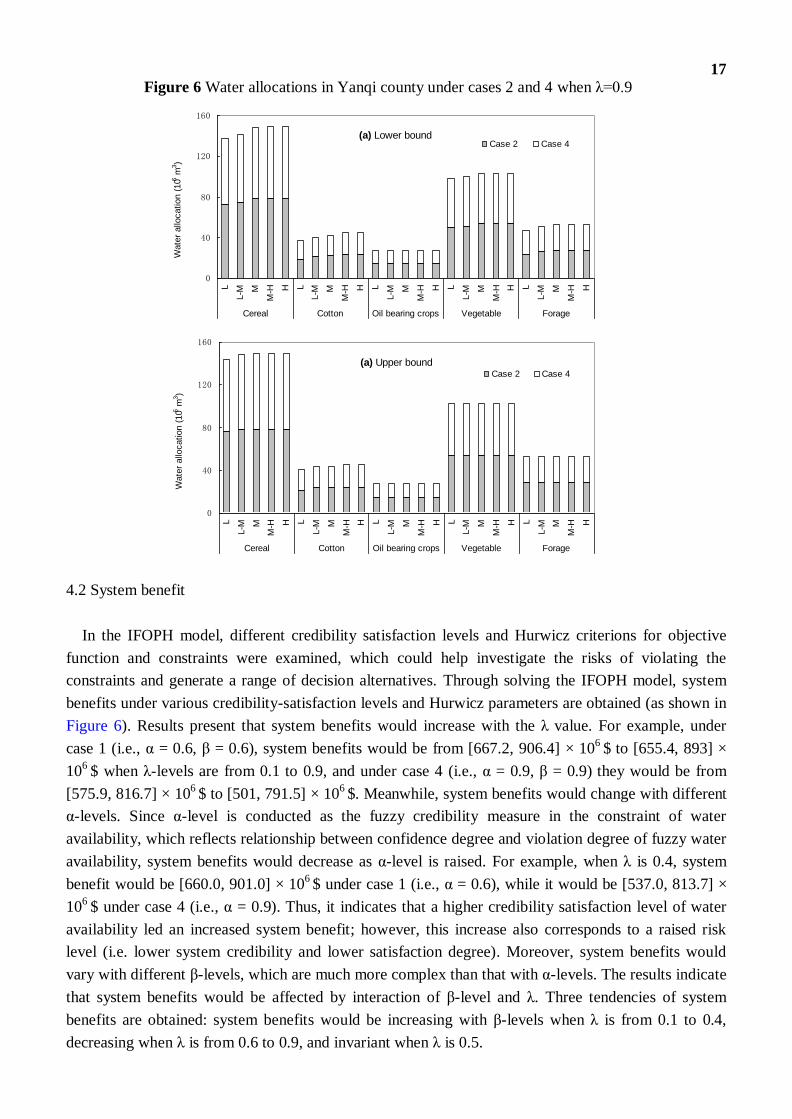
Figure 6 Water allocations in Yanqi county under cases 2 and 4 when λ=0.9
(a) Lower bound
0
40
80
120
160
L
L-M M
M-H H L
L-M M
M-H H L
L-M M
M-H H L
L-M M
M-H H L
L-M M
M-H H
Cereal Cotton Oil bearing crops Vegetable Forage
Wate
r allo
cation (
106
m3)
Case 2 Case 4
(a) Upper bound
0
40
80
120
160
L
L-M M
M-H H L
L-M M
M-H H L
L-M M
M-H H L
L-M M
M-H H L
L-M M
M-H H
Cereal Cotton Oil bearing crops Vegetable Forage
Wate
r allo
cation (
106
m3)
Case 2 Case 4
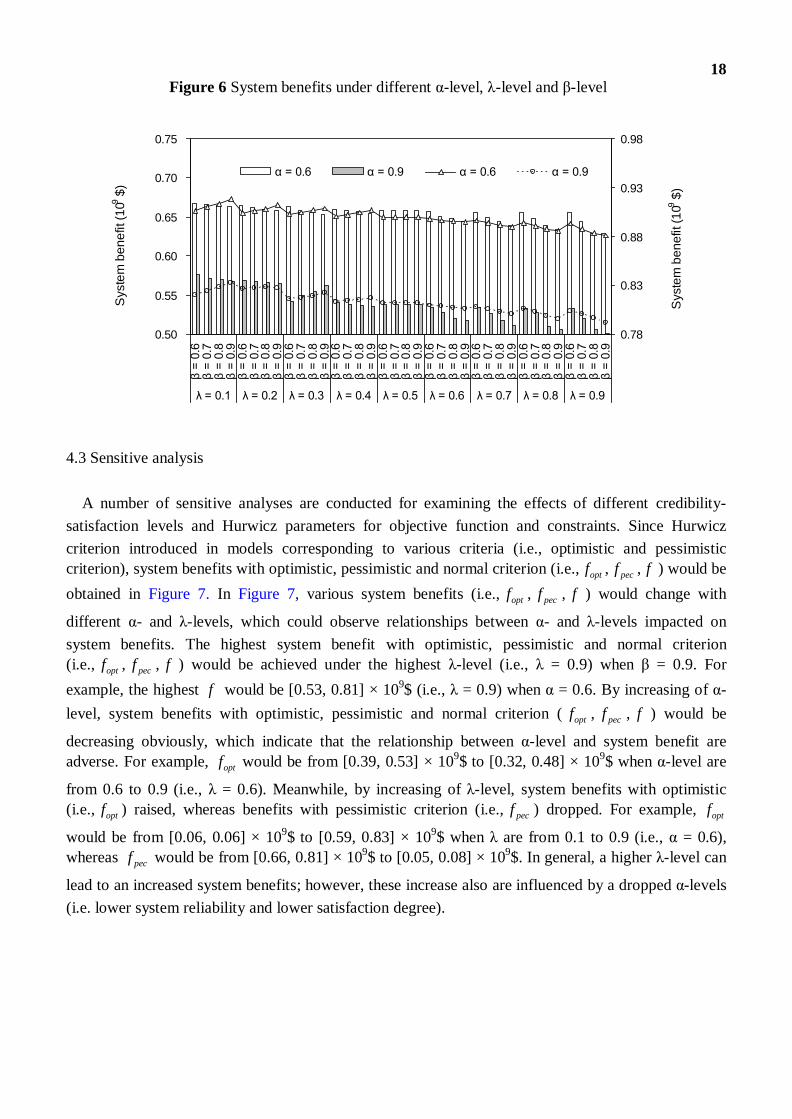
4.2 System benefit
In the IFOPH model, different credibility satisfaction levels and Hurwicz criterions for objective
function and constraints were examined, which could help investigate the risks of violating the
constraints and generate a range of decision alternatives. Through solving the IFOPH model, system
benefits under various credibility-satisfaction levels and Hurwicz parameters are obtained (as shown in
Figure 6). Results present that system benefits would increase with the λ value. For example, under
case 1 (i.e., α = 0.6, β = 0.6), system benefits would be from [667.2, 906.4] × 106
$ to [655.4, 893] ×
106
$ when λ-levels are from 0.1 to 0.9, and under case 4 (i.e., α = 0.9, β = 0.9) they would be from
[575.9, 816.7] × 106 $ to [501, 791.5] × 10
6 $. Meanwhile, system benefits would change with different
α-levels. Since α-level is conducted as the fuzzy credibility measure in the constraint of water
availability, which reflects relationship between confidence degree and violation degree of fuzzy water
availability, system benefits would decrease as α-level is raised. For example, when λ is 0.4, system
benefit would be [660.0, 901.0] × 106 $ under case 1 (i.e., α = 0.6), while it would be [537.0, 813.7] ×
106
$ under case 4 (i.e., α = 0.9). Thus, it indicates that a higher credibility satisfaction level of water
availability led an increased system benefit; however, this increase also corresponds to a raised risk
level (i.e. lower system credibility and lower satisfaction degree). Moreover, system benefits would
vary with different β-levels, which are much more complex than that with α-levels. The results indicate
that system benefits would be affected by interaction of β-level and λ. Three tendencies of system
benefits are obtained: system benefits would be increasing with β-levels when λ is from 0.1 to 0.4,
decreasing when λ is from 0.6 to 0.9, and invariant when λ is 0.5.
18
Figure 6 System benefits under different α-level, λ-level and β-level
0.50
0.55
0.60
0.65
0.70
0.75
β =
0.6
β =
0.7
β =
0.8
β =
0.9
β =
0.6
β =
0.7
β =
0.8
β =
0.9
β =
0.6
β =
0.7
β =
0.8
β =
0.9
β =
0.6
β =
0.7
β =
0.8
β =
0.9
β =
0.6
β =
0.7
β =
0.8
β =
0.9
β =
0.6
β =
0.7
β =
0.8
β =
0.9
β =
0.6
β =
0.7
β =
0.8
β =
0.9
β =
0.6
β =
0.7
β =
0.8
β =
0.9
β =
0.6
β =
0.7
β =
0.8
β =
0.9
λ = 0.1 λ = 0.2 λ = 0.3 λ = 0.4 λ = 0.5 λ = 0.6 λ = 0.7 λ = 0.8 λ = 0.9
Syste
m b
en
efit (1
0 9 $
)
0.78
0.83
0.88
0.93
0.98
Syste
m b
en
efit (1
0 9 $
)
α = 0.6 α = 0.9 α = 0.6 α = 0.9
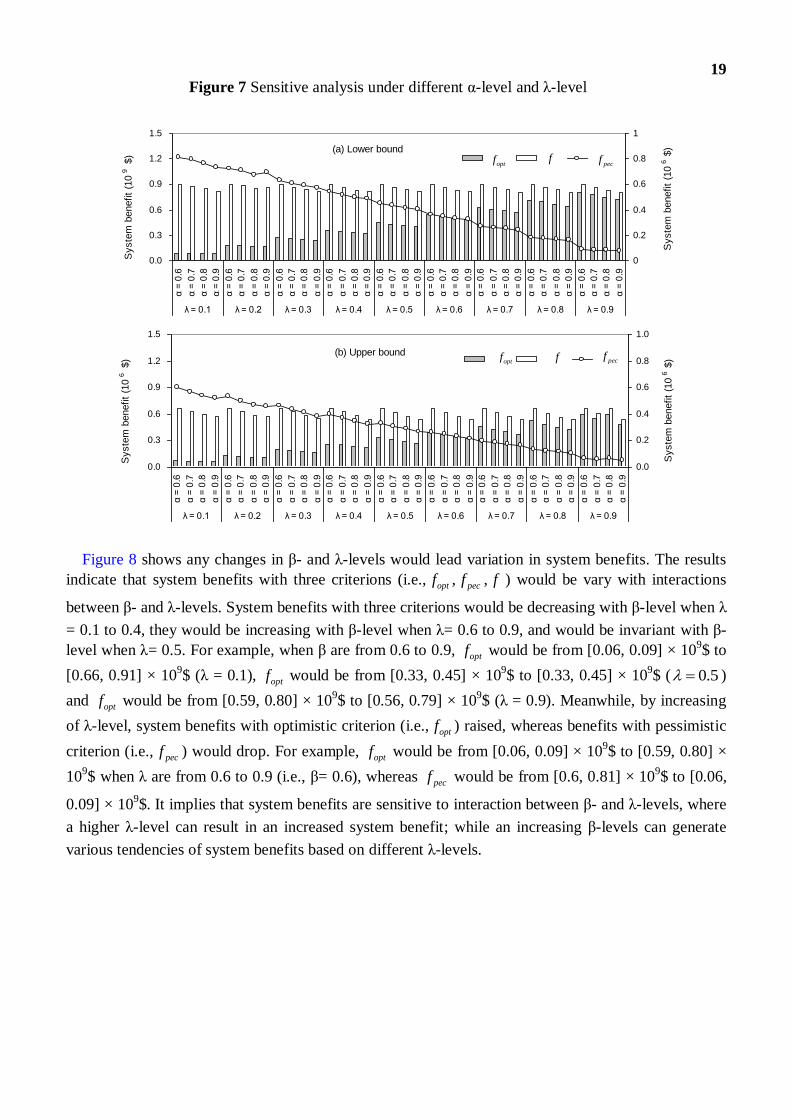
4.3 Sensitive analysis
A number of sensitive analyses are conducted for examining the effects of different credibility-
satisfaction levels and Hurwicz parameters for objective function and constraints. Since Hurwicz
criterion introduced in models corresponding to various criteria (i.e., optimistic and pessimistic
criterion), system benefits with optimistic, pessimistic and normal criterion (i.e., optf , pecf , f ) would be
obtained in Figure 7. In Figure 7, various system benefits (i.e., optf , pecf , f ) would change with
different α- and λ-levels, which could observe relationships between α- and λ-levels impacted on
system benefits. The highest system benefit with optimistic, pessimistic and normal criterion
(i.e., optf , pecf , f ) would be achieved under the highest λ-level (i.e., λ = 0.9) when β = 0.9. For
example, the highest f would be [0.53, 0.81] × 109$ (i.e., λ = 0.9) when α = 0.6. By increasing of α-
level, system benefits with optimistic, pessimistic and normal criterion ( optf , pecf , f ) would be
decreasing obviously, which indicate that the relationship between α-level and system benefit are
adverse. For example, optf would be from [0.39, 0.53] × 109$ to [0.32, 0.48] × 10
9$ when α-level are
from 0.6 to 0.9 (i.e., λ = 0.6). Meanwhile, by increasing of λ-level, system benefits with optimistic
(i.e., optf ) raised, whereas benefits with pessimistic criterion (i.e., pecf ) dropped. For example, optf
would be from [0.06, 0.06] × 109$ to [0.59, 0.83] × 10
9$ when λ are from 0.1 to 0.9 (i.e., α = 0.6),
whereas pecf would be from [0.66, 0.81] × 109$ to [0.05, 0.08] × 10
9$. In general, a higher λ-level can
lead to an increased system benefits; however, these increase also are influenced by a dropped α-levels
(i.e. lower system reliability and lower satisfaction degree).
19
Figure 7 Sensitive analysis under different α-level and λ-level
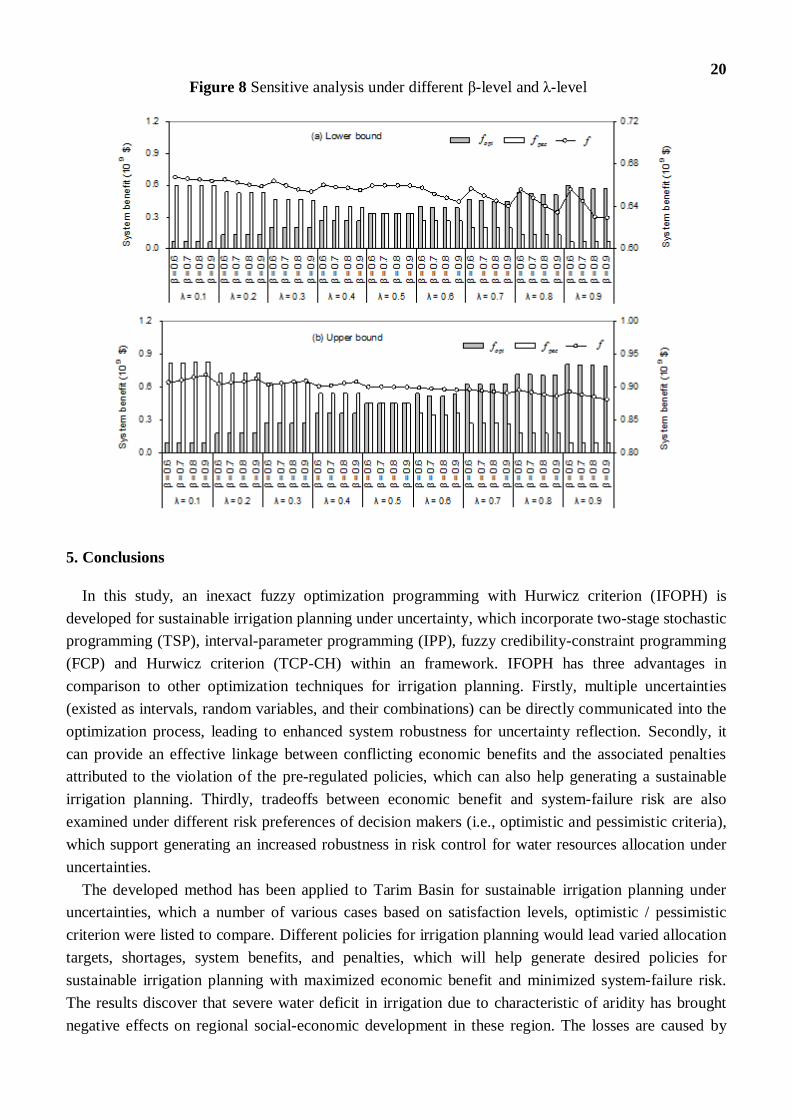
Figure 8 shows any changes in β- and λ-levels would lead variation in system benefits. The results
indicate that system benefits with three criterions (i.e., optf , pecf , f ) would be vary with interactions
between β- and λ-levels. System benefits with three criterions would be decreasing with β-level when λ
= 0.1 to 0.4, they would be increasing with β-level when λ= 0.6 to 0.9, and would be invariant with β-
level when λ= 0.5. For example, when β are from 0.6 to 0.9, optf would be from [0.06, 0.09] × 109$ to
[0.66, 0.91] × 109$ (λ = 0.1), optf would be from [0.33, 0.45] × 10
9$ to [0.33, 0.45] × 10
9$ ( 0.5 )
and optf would be from [0.59, 0.80] × 109$ to [0.56, 0.79] × 10
9$ (λ = 0.9). Meanwhile, by increasing
of λ-level, system benefits with optimistic criterion (i.e., optf ) raised, whereas benefits with pessimistic
criterion (i.e., pecf ) would drop. For example, optf would be from [0.06, 0.09] × 109$ to [0.59, 0.80] ×
109$ when λ are from 0.6 to 0.9 (i.e., β= 0.6), whereas pecf would be from [0.6, 0.81] × 10
9$ to [0.06,
0.09] × 109$. It implies that system benefits are sensitive to interaction between β- and λ-levels, where
a higher λ-level can result in an increased system benefit; while an increasing β-levels can generate
various tendencies of system benefits based on different λ-levels.
(b) Upper bound
0.0
0.3
0.6
0.9
1.2
1.5
α =
0.6
α =
0.7
α =
0.8
α =
0.9
α =
0.6
α =
0.7
α =
0.8
α =
0.9
α =
0.6
α =
0.7
α =
0.8
α =
0.9
α =
0.6
α =
0.7
α =
0.8
α =
0.9
α =
0.6
α =
0.7
α =
0.8
α =
0.9
α =
0.6
α =
0.7
α =
0.8
α =
0.9
α =
0.6
α =
0.7
α =
0.8
α =
0.9
α =
0.6
α =
0.7
α =
0.8
α =
0.9
α =
0.6
α =
0.7
α =
0.8
α =
0.9
λ = 0.1 λ = 0.2 λ = 0.3 λ = 0.4 λ = 0.5 λ = 0.6 λ = 0.7 λ = 0.8 λ = 0.9
Syste
m b
enefit
(10 6
$)
0.0
0.2
0.4
0.6
0.8
1.0
Syste
m b
enefit
(10 6
$)
(a) Lower bound
0.0
0.3
0.6
0.9
1.2
1.5
α =
0.6
α =
0.7
α =
0.8
α =
0.9
α =
0.6
α =
0.7
α =
0.8
α =
0.9
α =
0.6
α =
0.7
α =
0.8
α =
0.9
α =
0.6
α =
0.7
α =
0.8
α =
0.9
α =
0.6
α =
0.7
α =
0.8
α =
0.9
α =
0.6
α =
0.7
α =
0.8
α =
0.9
α =
0.6
α =
0.7
α =
0.8
α =
0.9
α =
0.6
α =
0.7
α =
0.8
α =
0.9
α =
0.6
α =
0.7
α =
0.8
α =
0.9
λ = 0.1 λ = 0.2 λ = 0.3 λ = 0.4 λ = 0.5 λ = 0.6 λ = 0.7 λ = 0.8 λ = 0.9
Syste
m b
enefit
(10 9
$)
0
0.2
0.4
0.6
0.8
1
Syste
m b
enefit
(10 6
$)
optf
optf
f
f pecf
pecf
20
Figure 8 Sensitive analysis under different β-level and λ-level
5. Conclusions
In this study, an inexact fuzzy optimization programming with Hurwicz criterion (IFOPH) is
developed for sustainable irrigation planning under uncertainty, which incorporate two-stage stochastic
programming (TSP), interval-parameter programming (IPP), fuzzy credibility-constraint programming
(FCP) and Hurwicz criterion (TCP-CH) within an framework. IFOPH has three advantages in
comparison to other optimization techniques for irrigation planning. Firstly, multiple uncertainties
(existed as intervals, random variables, and their combinations) can be directly communicated into the
optimization process, leading to enhanced system robustness for uncertainty reflection. Secondly, it
can provide an effective linkage between conflicting economic benefits and the associated penalties
attributed to the violation of the pre-regulated policies, which can also help generating a sustainable
irrigation planning. Thirdly, tradeoffs between economic benefit and system-failure risk are also
examined under different risk preferences of decision makers (i.e., optimistic and pessimistic criteria),
which support generating an increased robustness in risk control for water resources allocation under
uncertainties.
The developed method has been applied to Tarim Basin for sustainable irrigation planning under
uncertainties, which a number of various cases based on satisfaction levels, optimistic / pessimistic
criterion were listed to compare. Different policies for irrigation planning would lead varied allocation
targets, shortages, system benefits, and penalties, which will help generate desired policies for
sustainable irrigation planning with maximized economic benefit and minimized system-failure risk.
The results discover that severe water deficit in irrigation due to characteristic of aridity has brought
negative effects on regional social-economic development in these region. The losses are caused by
21
several reasons such as unreasonable water plans, inefficient water usage (e.g., behindhand
irrigation regime) and unscientific risk option. Secondly, it discover that risk preference of decision
makers in decision process with uncertain importations can affect water planning and allocation, which
support decision makers making neither adventurous nor conservative decisions in sustainable
irrigation planning. Thirdly, the irrigation regime and water saving technology of this region is relative
backward, which generate more inefficient water usage. Therefore, the manager of study region should
adjust water policy the aim of sustainability in study region, which not only balance the tradeoff
between the system benefit and risk of practical water planning, but also support in-depth analysis of
different manager preferences toward risk permits. Meanwhile, advanced irrigation regime and water
saving technology (e.g., drop irrigation) should be recommended to further improve efficiency of
agricultural water usage.
Acknowledgments
This research was supported by the National Natural Science Foundation for Distinguished Young
Scholar (Grant No. 51225904), the Natural Sciences Foundation of China (Grant Nos. 51379075 and
51190095), and Fundamental Research Funds for the Central Universities (Grant No. 2014XS67).
Author Contributions
Main text paragraph is written by Xueting Zeng, and Yongping Li is responsible for polishing the
manuscript.
Conflicts of Interest
The authors declare no conflict of interest.
References and Notes
1. Huang, Y.; Li, Y.P.; Chen, X.; Ma, Y.G. Optimization of irrigation water resources for agricultural
sustainability in Tarim River Basin, China. Agr. Water. Manage. 2012, 107, 74-85.
2. Li, Y.P.; Huang, G.H. Planning Agricultural Water Resources System Associated With Fuzzy and
Random Features. J. Am. Water. Resour. As. 2011, 47, 841-860.
3. Rosegrant, M. W.; Schleyer, R. G.; Yadav, S. N. Water policy for efficient agricultural
diversification: market-based approaches, Food. Policy. 1995, 20, 203-223.
4. Landry, C. Market transfers of water for environmental protection in the Western United State,
Water. Policy. 1998, 1, 457–469.
5. Li, Y.P.; Huang, G.H.; Nie, S.L. An interval-parameter multistage stochastic programming model
for water resources management under uncertainty. Adv. Water. Resour. 2006, 29, 776-789.
6. Davies, E.G.R.; Simonovic, S.P. Water resources and integrated assessment modeling—the ANEMI
model. Adv Water. Resour. 2011, 34, 684–700.
7. Huang, G. H. A hybrid inexact-stochastic water management model, Eur. J. Oper. Res. 1998, 107,
137–158.
22
8. Jairaj, P.G.; Vedula, S. Multi-reservoir system optimization using fuzzy mathematical
programming. Water. Resour. Manage. 2000, 14, 457-472.
9. Seifi, A.; Hipel, K.W. Interior-point method for reservoir operation with stochastic inflows. Water.
Res. Pl-ASCE. 2001, 127, 48-57.
10. Jiménez, M.; Arenas, M.; Bilbao, A. Linear programming with fuzzy parameters: an interactive
method resolution. Eur. J. Oper. Res. 2007, 177, 1599-1609.
11. Barghouth, J.M.; Al-Sa`ed, R.M.Y. Sustainability of Ancient Water Supply Facilities in Jerusalem.
Sustainability 2009, 1, 1106-1119.
12. Beall A.; Fiedler F.; Boll J.; Cosens, B. Sustainable Water Resource Management and Participatory
System Dynamics Case Study: Developing the Palouse Basin Participatory Model. Sustainability
2011, 3, 720-742.
13. Fernald, A.; Tidwell, V.; Rivera, J.; Rodríguez, S.; Guldan, S,; Steele, C.; Ochoa, C.; Hurd, B.;
Marquit, O.; Boykin, K.; Cibils, A. Modeling Sustainability of Water, Environment, Livelihood, and
Culture in Traditional Irrigation Communities and Their Linked Watersheds. Sustainability 2012, 4,
2998-3022.
14. Maqsood, I.; Huang, G.H.; Yeomans, J.S. An interval-parameter fuzzy two-stage stochastic
program for water resources management under uncertainty. Eur. J. Oper. Res. 2005, 167, 208-225.
15. Li, Y.P.; Huang, G.H. Fuzzy-stochastic-based violation analysis method for planning water
resources management systems with uncertain information. Inform. Science. 2009, 179, 4261-4276.
16. Vidoli, F. Evaluating the water sector in Italy through a two stage method using the conditional
robust nonparametric frontier and multivariate adaptive regression splines. Eur. J. Oper. Res. 2011,
3, 584-595.
17. Freeze, R.A.; Massmann, J.; Smith, L.; Sperling, T.; James, B. Hydrogeological decisionanalysis.
1. A framework. Ground. Water. 1990, 28, 738-766.
18. Vylder, F.D.; Sundt, B. Constrained credibility estimators in the regression model. Scand. Actuar.
J. 1982, 1, 27-31.
19. Liu, B.; Liu, Y.K. Expected value of fuzzy variable and fuzzy expected value models. IEEE T. on
Fuzzy Syst. 2002, 10, 45-50.
20. Punyangarm, V.; Yanpirat, P.; Charnsethikul, P.; Lertworasirikul, S. A. Credibility Approach for
Fuzzy Stochastic Data Envelopment Analysis (FSDEA). Proceedings of the 7th Asia Pacific Ind.
Eng. Manage. Syst. Conference 2006. Bangkok, Thailand, 2006.
21. Zeng, X.T.; Li, Y.P.; Huang, W.; Bao, A.M.; Chen, X. Two-stage credibility-constrained
programming with Hurwicz criterion (TCP-CH) for planning water resources management. Eng.
Appl. Artif. Intel. 2014, 35:164–175.
22. Lau, H.C.W.; Jiang, Z.Z.; Ip, W.H.; Wang, D. A credibility-based fuzzy location model with
Hurwicz criteria for the design of distribution systems in B2C e-commerce. Comput. Ind. Eng. 2010,
59, 873-886.
23. Li, Y.P.; Huang, G.H. Interval-parameter two-stage stochastic nonlinear programming for water
resources management under uncertainty. Water. Resour. Manage. 2008, 22, 681-698.
24. Zhang, Y.M.; Huang, G.H. Inexact credibility constrained programming for environmental system
management. Resour. Conserv. Recy. 2011, 55, 1-7.
25. Li, Z.; Huang, G.H.; Zhang, Y.M.; Li Y.P. Inexact two-stage stochastic credibility constrained
programming for water quality management. Resour. Conserv. Rec. 2013, 73, 122-132.
23
26. Hurwicz, L. Some specification problems and application to econometric models (abstract).
Econometrica. 1951, 19, 343-344.
27. Huang, X. Credibility-based chance-constrained integer programming models for capital budgeting
with fuzzy parameters. Inform. Sci. 2006, 176, 2698-2712.
28. Chen, Y.N.; Li, W.H.; Xu, C.C.; Hao, X.M. Effects of climate change on water resources in Tarim
River Basin, Northwest China. J. Environ. Sci. 2007. 19, 488-493.
29. The statistical yearbook of Xinjiang Uygur Autonomous Region in Uygur Autonomous Region
2005-2012, China, 2006-2013.
30. Zeng, X. T.; Li, Y. P.; Huang, G. H.; Yu, L. Inexact Mathematical Modeling for the Identification
of Water Trading Policy under Uncertainty, Water., 2014, 6, 229-252.
© 2014 by the authors; licensee MDPI, Basel, Switzerland. This article is an open access article
distributed under the terms and conditions of the Creative Commons Attribution license.
Related Documents


