An Industry and Economy in Transition: Overview and Outlook for P/C Insurance Markets Phoenix, AZ June 6, 2012 Robert P. Hartwig, Ph.D., CPCU, President & Economist Insurance Information Institute 110 William Street New York, NY 10038 Tel: 212.346.5520 Cell: 917.453.1885 [email protected]

An Industry and Economy in Transition: Overview and Outlook for P/C Insurance Markets
Jan 21, 2016
An Industry and Economy in Transition: Overview and Outlook for P/C Insurance Markets. Phoenix, AZ June 6, 2012. Robert P. Hartwig, Ph.D., CPCU, President & Economist Insurance Information Institute 110 William Street New York, NY 10038 - PowerPoint PPT Presentation
Welcome message from author
This document is posted to help you gain knowledge. Please leave a comment to let me know what you think about it! Share it to your friends and learn new things together.
Transcript
An Industry and Economy in Transition:
Overview and Outlook for P/C Insurance Markets
Phoenix, AZJune 6, 2012
Robert P. Hartwig, Ph.D., CPCU, President & EconomistInsurance Information Institute 110 William Street New York, NY 10038
Tel: 212.346.5520 Cell: 917.453.1885 [email protected] www.iii.org

3
Economics 2012:
The World Is Changing2012 Is the First Year Since 2005 Where Economic Perceptions and Reality in the US Will Be Positive
Potentially Enormous Benefits for P/C Insurers
3
4
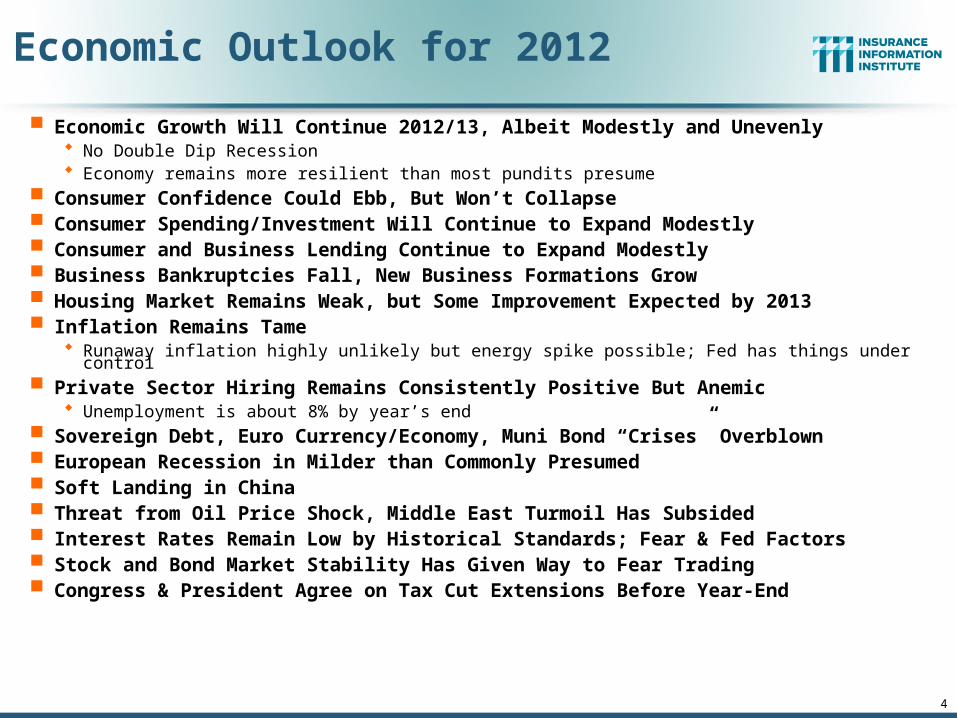
Economic Outlook for 2012
Economic Growth Will Continue 2012/13, Albeit Modestly and Unevenly No Double Dip Recession Economy remains more resilient than most pundits presume
Consumer Confidence Could Ebb, But Won’t Collapse Consumer Spending/Investment Will Continue to Expand Modestly Consumer and Business Lending Continue to Expand Modestly Business Bankruptcies Fall, New Business Formations Grow Housing Market Remains Weak, but Some Improvement Expected by 2013 Inflation Remains Tame
Runaway inflation highly unlikely but energy spike possible; Fed has things under control Private Sector Hiring Remains Consistently Positive But Anemic
Unemployment is about 8% by year’s end Sovereign Debt, Euro Currency/Economy, Muni Bond “Crises” Overblown European Recession in Milder than Commonly Presumed Soft Landing in China Threat from Oil Price Shock, Middle East Turmoil Has Subsided Interest Rates Remain Low by Historical Standards; Fear & Fed Factors Stock and Bond Market Stability Has Given Way to Fear Trading Congress & President Agree on Tax Cut Extensions Before Year-End

5
P/C Insurance Exposures Grow Robustly Personal and commercial exposure growth is certain in 2012; Strongest since 2004 But restoration of destroyed exposure will take until mid-decade
P/C Industry Growth in 2012 Will Be Strongest Since 2004 Growth likely to exceed A.M. Best projection of +3.8% for 2012 No traditional “hard market” emerges in 2012
Underwriting Fundamentals Deteriorate Modestly Some pressure from claim frequency, in some severity in key lines
Increasing Private Sector Hiring Will Drive Payrolls/WC Exposures Wage growth is also positive and could modestly accelerate WC will prove to be tough to fix from an underwriting perspective
Increase in Demand for Commercial Insurance Will Accelerate in 2012 Includes workers comp, property, marine, many liability coverages Laggards: inland marine, aviation, commercial auto, surety Personal Lines: Auto leads, homeowners lags (though HO leads in NPW growth due to rates)
Investment Environment Is/Remains More Favorable Return of realized capital gains as a profit driver Interest rates remain low; Some upward pressure if economic strength surprises
Industry Capacity Hits a New Record by Year-End 2012 (Barring Mega-CAT)
Insurance Industry Predictions for 2012
The Strength of the Economy Will Influence P/C Insurer
Growth Opportunities
6
Growth Will Expand Workers Comp Payroll Exposure Base
6
America’s Manufacturing Renaissance?Construction Activity Still Depressed?
7
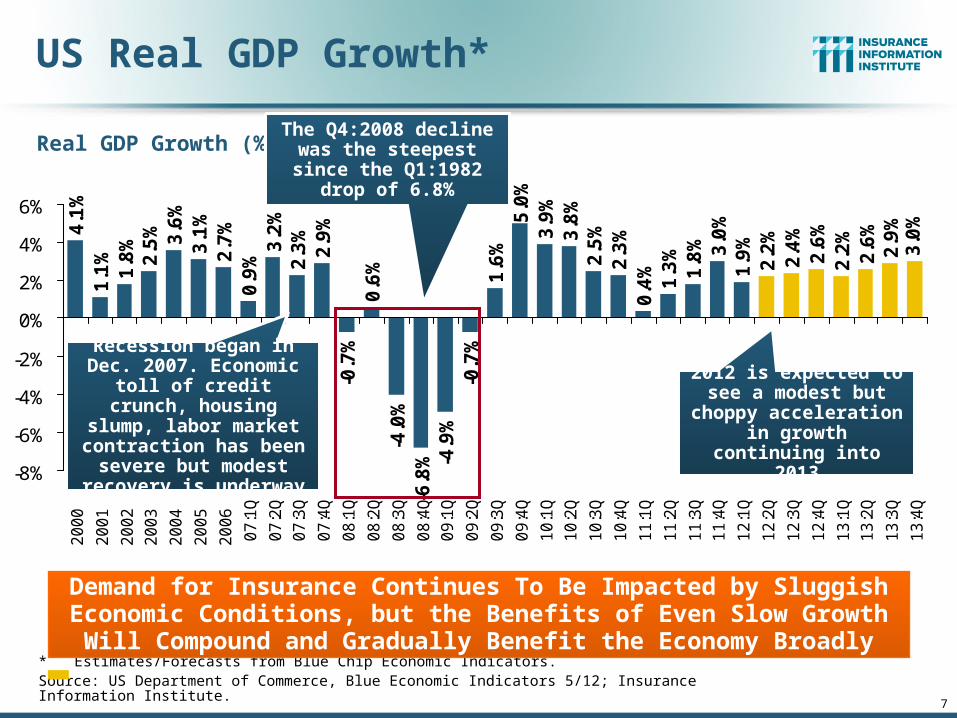
US Real GDP Growth*
* Estimates/Forecasts from Blue Chip Economic Indicators.Source: US Department of Commerce, Blue Economic Indicators 5/12; Insurance Information Institute.
2.7
%0
.9%
3.2
%2
.3%
2.9
%-0
.7%
0.6
%-4
.0%
-6.8
% -4.9
%-0
.7%
1.6
%5
.0%
3.9
%3
.8%
2.5
%2
.3%
0.4
%1
.3%
1.8
% 3.0
%1
.9%
2.2
%2
.4%
2.6
%2
.2%
2.6
%2
.9%
3.0
%4.1
%1
.1%
1.8
%2
.5% 3.6
%3
.1%
-8%
-6%
-4%
-2%
0%
2%
4%
6%
2
00
0
2
00
1
2
00
2
2
00
3
2
00
4
2
00
5
2
00
6
07
:1Q
07
:2Q
07
:3Q
07
:4Q
08
:1Q
08
:2Q
08
:3Q
08
:4Q
09
:1Q
09
:2Q
09
:3Q
09
:4Q
10
:1Q
10
:2Q
10
:3Q
10
:4Q
11
:1Q
11
:2Q
11
:3Q
11
:4Q
12
:1Q
12
:2Q
12
:3Q
12
:4Q
13
:1Q
13
:2Q
13
:3Q
13
:4Q
Demand for Insurance Continues To Be Impacted by Sluggish Economic Conditions, but the Benefits of Even Slow Growth Will Compound and
Gradually Benefit the Economy Broadly
Real GDP Growth (%)
Recession began in Dec. 2007. Economic toll of credit crunch, housing
slump, labor market contraction has been
severe but modest recovery is underway
The Q4:2008 decline was the steepest since the Q1:1982 drop of 6.8%
2012 is expected to see a modest but choppy
acceleration in growth continuing into 2013

Percent Change in Real GDPby State, 2011
Source: Bureau of Economic Analysis at http://www.bea.gov/newsreleases/regional/gdp_state/gsp_glance.htm ;Insurance Information Institute. 8
Growth varied considerably across states
but in total was weak in 2011
with US overall growth at just
1.7%

74
.4
73
.6
73
.6
72
.2
73
.6 76
67
.8
68
.9
68
.2
67
.7 71
.6 74
.5
74
.2 77
.5
67
.5 69
.8
74
.3
71
.5
63
.7
55
.7 59
.4
60
.9 64
.1
69
.9
75
.0
75
.3
76
.2
76
.4
77
.8
40
45
50
55
60
65
70
75
80
85
Jan
-10
Fe
b-1
0
Ma
r-1
0
Ap
r-1
0
Ma
y-1
0
Jun
-10
Jul-
10
Au
g-1
0
Se
p-1
0
Oct
-10
No
v-1
0
De
c-1
0
Jan
-11
Fe
b-1
1
Ma
r-1
1
Ap
r-1
1
Ma
y-1
1
Jun
-11
Jul-
11
Au
g-1
1
Se
p-1
1
Oct
-11
No
v-1
1
De
c-1
1
Jan
-12
Fe
b-1
2
Ma
r-1
2
Ap
r-1
2
Ma
y-1
2
Consumer Sentiment Survey (1966 = 100)
January 2010 through May 2012
Consumer confidence has been low for years amid high unemployment, falling home prices and other factors adversely impact
consumers, but improved substantially in late 2011 and early 2012
Source: University of Michigan; Insurance Information Institute
Optimism among consumers is recovering, in part due to an
improving jobs outlook, after plunging amid the debt debate debacle and S&P downgrade
9
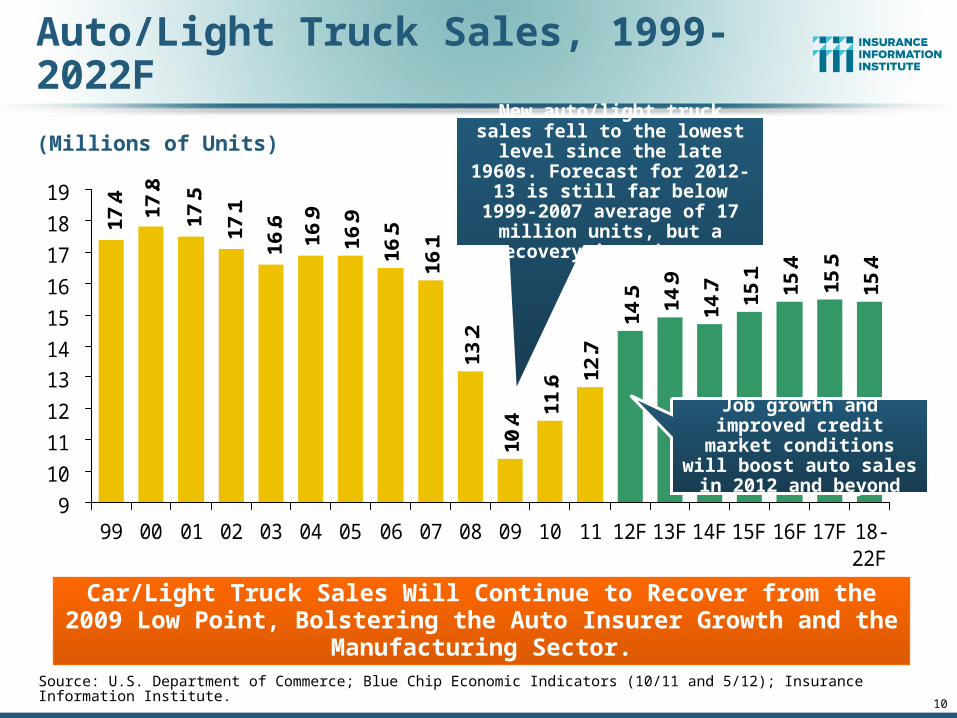
10
16.9
16.5
16.1
13.2
10.4
11.6 12
.7
14.5 14
.9
14.7 15
.1
15.4
15.5
15.4
16.9
16.617
.117.5
17.8
17.4
9
10
11
12
13
14
15
16
17
18
19
99 00 01 02 03 04 05 06 07 08 09 10 11 12F 13F 14F 15F 16F 17F 18-22F
(Millions of Units)
Auto/Light Truck Sales, 1999-2022F
Source: U.S. Department of Commerce; Blue Chip Economic Indicators (10/11 and 5/12); Insurance Information Institute.
Car/Light Truck Sales Will Continue to Recover from the 2009 Low Point, Bolstering the Auto Insurer Growth and the Manufacturing Sector.
New auto/light truck sales fell to the lowest level since the late 1960s. Forecast for 2012-13 is
still far below 1999-2007 average of 17 million units, but a recovery is underway.
Job growth and improved credit market conditions will boost auto sales in
2012 and beyond

11
Monthly Change* in Auto Insurance Prices, 1991–2012*
*Percentage change from same month in prior year; through April 2012; seasonally adjustedNote: Recessions indicated by gray shaded columns.Sources: US Bureau of Labor Statistics; National Bureau of Economic Research (recession dates); Insurance Information Institutes.
-2%
0%
2%
4%
6%
8%
10%
'90 '91 '92 '93 '94 '95 '96 '97 '98 '99 '00 '01 '02 '03 '04 '05 '06 '07 '08 '09 '10 '11 '12
Cyclical peaks in PP Auto tend to occur
approximately every 10 years (early 1990s, early
2000s and likely the early 2010s)
“Hard” markets tend to occur
during recessionary
periods
Pricing peak occurred in 2010 at
5.1%, falling to 2.8% by Mar. 2012
The Apr. 2012 reading of 2.9%
was the 3rd lowest since July 2008

12
(Millions of Units)
New Private Housing Starts, 1990-2022F
1.4
8
1.4
7 1.6
2
1.6
4
1.5
7
1.6
0 1.7
1 1.8
5 1.9
6 2.0
7
1.8
0
1.3
6
0.9
1
0.5
5
0.5
9
0.6
1 0.7
3 0.8
7
1.3
4
1.2
3
1.3
2
1.3
81
.42
1.3
51.4
6
1.2
9
1.2
0
1.0
11.1
9
0.3
0.5
0.7
0.9
1.1
1.3
1.5
1.7
1.9
2.1
90 91 92 93 94 95 96 97 98 99 00 01 02 03 04 05 06 07 08 09 10 11 12F13F14F15F16F17F 18-22F
Source: U.S. Department of Commerce; Blue Chip Economic Indicators (10/11 and 5/12); Insurance Information Institute.
Little Exposure Growth Likely for Homeowners Insurers Until at least 2014. Also Affects Commercial Insurers with Construction Risk Exposure, Surety
New home starts plunged
72% from 2005-2009; A
net annual decline of 1.49 million units, lowest since
records began in 1959
The plunge and lack of recovery in homebuilding and in construction in general
is holding back payroll exposure growth
Job growth, improved credit
market conditions and demographics
will eventually boost home construction

13
Construction Employment,Jan. 2010—May 2012*
*Seasonally adjustedSources: US Bureau of Labor Statistics at http://data.bls.gov; Insurance Information Institute.
5,59
3
5,52
9 5,55
2
5,55
9
5,51
8
5,50
7
5,49
1 5,51
1
5,49
2
5,49
9
5,48
8
5,47
7
5,45
6
5,48
9
5,49
6
5,49
5
5,49
8
5,49
5
5,50
8
5,49
8
5,52
8
5,51
9
5,52
0 5,54
6 5,56
4
5,56
3
5,54
9
5,54
4
5,51
6
5,400
5,450
5,500
5,550
5,600
5,650
Jan-
10
Feb
-10
Mar
-10
Apr
-10
May
-10
Jun-
10
Jul-1
0
Aug
-10
Sep
-10
Oct
-10
Nov
-10
Dec
-10
Jan-
11
Feb
-11
Mar
-11
Apr
-11
May
-11
Jun-
11
Jul-1
1
Aug
-11
Sep
-11
Oct
-11
Nov
-11
Dec
-11
Jan-
12
2/30
/210
2
Mar
-12
Apr
-12
May
-12
Construction employment is still below where it was in
Jan. 2010. In a normal recovery, construction employment would be
growing robustly
(Thousands)
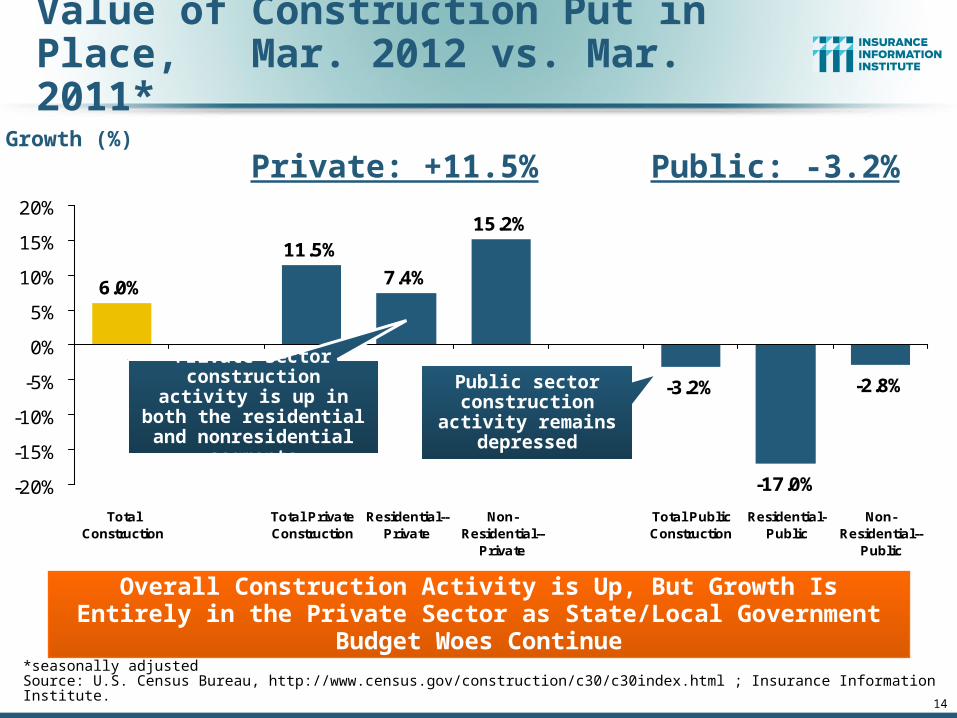
14
Value of Construction Put in Place, Mar. 2012 vs. Mar. 2011*
-3.2%
-17.0%
-2.8%
6.0%
11.5%
7.4%
15.2%
-20%
-15%
-10%
-5%
0%
5%
10%
15%
20%
TotalConstruction
Total PrivateConstruction
Residential--Private
Non-Residential--
Private
Total PublicConstruction
Residential-Public
Non-Residential--
Public
Overall Construction Activity is Up, But Growth Is Entirely in the Private Sector as State/Local Government Budget Woes Continue
Growth (%)
Private sector construction activity is up in both the residential and nonresidential segments
*seasonally adjustedSource: U.S. Census Bureau, http://www.census.gov/construction/c30/c30index.html ; Insurance Information Institute.
Private: +11.5% Public: -3.2%
Public sector construction activity remains depressed
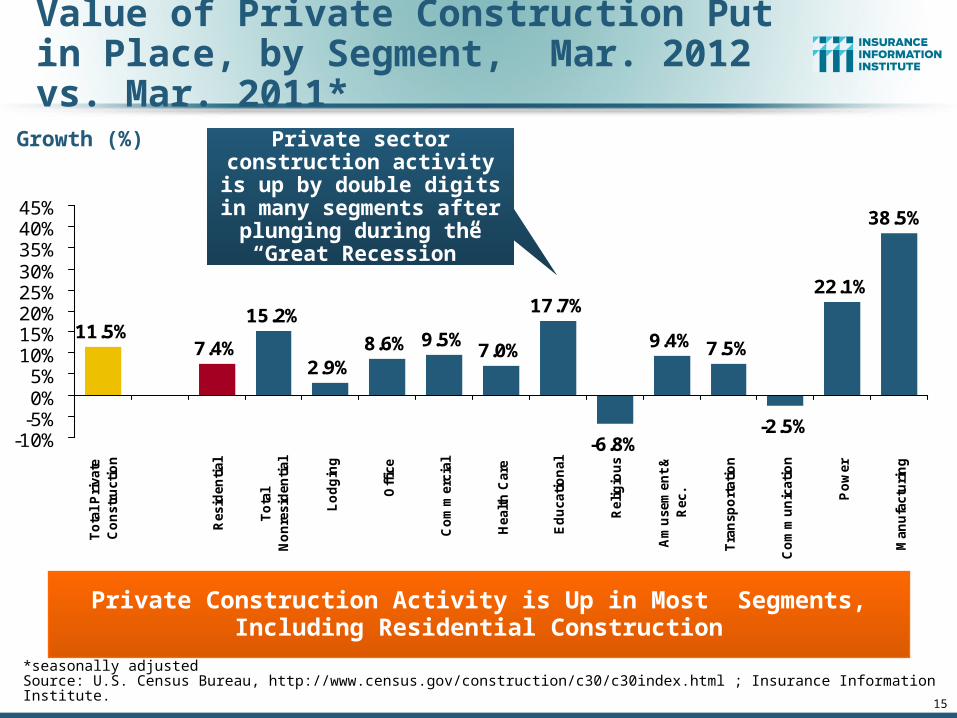
15
Value of Private Construction Put in Place, by Segment, Mar. 2012 vs. Mar. 2011*
9.5%7.0%
17.7%
-6.8%
9.4% 7.5%
-2.5%
22.1%
38.5%
11.5%7.4%
15.2%
2.9%8.6%
-10%-5%0%5%
10%15%20%25%30%35%40%45%
To
tal
Pri
vate
Co
nst
ruct
ion
Res
iden
tial
To
tal
No
nre
sid
enti
al
Lo
dg
ing
Off
ice
Co
mm
erci
al
Hea
lth
Car
e
Ed
uca
tio
nal
Rel
igio
us
Am
use
men
t &
Rec
.
Tra
nsp
ort
atio
n
Co
mm
un
icat
ion
Po
wer
Man
ufa
ctu
rin
g
Private Construction Activity is Up in Most Segments, Including Residential Construction
Growth (%) Private sector construction activity is up by double
digits in many segments after plunging during the
“Great Recession”
*seasonally adjustedSource: U.S. Census Bureau, http://www.census.gov/construction/c30/c30index.html ; Insurance Information Institute.

58
.3
57
.1
60
.4
59
.6
57
.8
55
.3
55
.1
55
.2
55
.3 56
.9 58
.2
58
.5 60
.8
61
.4
59
.7
59
.7
54
.2 55
.8
51
.4 52
.5
52
.5
51
.8
52
.2 53
.1 54
.1
52
.4 53
.4 54
.8
53
.5
40
45
50
55
60
65
Jan
-10
Fe
b-1
0
Ma
r-1
0
Ap
r-1
0
Ma
y-1
0
Jun
-10
Jul-
10
Au
g-1
0
Se
p-1
0
Oct
-10
No
v-1
0
De
c-1
0
Jan
-11
Fe
b-1
1
Ma
r-1
1
Ap
r-1
1
Ma
y-1
1
Jun
-11
Jul-
11
Au
g-1
1
Se
p-1
1
Oct
-11
No
v-1
1
De
c-1
1
Jan
-12
Fe
b-1
2
Ma
r-1
2
Ap
r-1
2
Ma
y-1
2
ISM Manufacturing Index(Values > 50 Indicate Expansion)
January 2010 through May 2012
The manufacturing sector has been expanding for 34 consecutive months and adding jobs. The question is whether this will continue.
Source: Institute for Supply Management at http://www.ism.ws/ismreport/mfgrob.cfm; Insurance Information Institute.
Optimism among manufacturers was
increasing in late 2011 and into early 2012
17
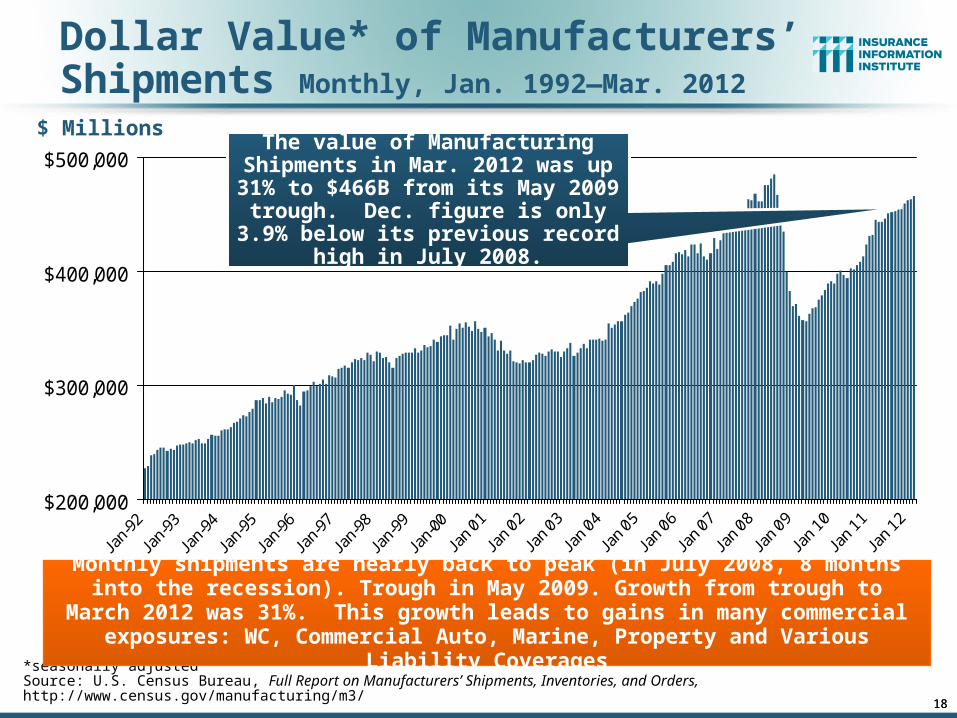
18
$200,000
$300,000
$400,000
$500,000
Dollar Value* of Manufacturers’ Shipments Monthly, Jan. 1992—Mar. 2012
*seasonally adjustedSource: U.S. Census Bureau, Full Report on Manufacturers’ Shipments, Inventories, and Orders, http://www.census.gov/manufacturing/m3/
Monthly shipments are nearly back to peak (in July 2008, 8 months into the recession). Trough in May 2009. Growth from trough to March 2012 was 31%. This
growth leads to gains in many commercial exposures: WC, Commercial Auto, Marine, Property and Various Liability Coverages
The value of Manufacturing Shipments in Mar. 2012 was up 31% to $466B from its May 2009 trough.
Dec. figure is only 3.9% below its previous record high in July 2008.
$ Millions
18

19
Manufacturing Growth for Selected Sectors, 2012 vs. 2011*
7.2%
12.7%
6.1%4.5%
13.5%
4.0%
9.0%5.8%
9.8% 11.4%
7.1%
31.4%
13.5%
0%
5%
10%
15%
20%
25%
30%
35%
All
Ma
nu
fact
uri
ng
Du
rab
le M
fg.
Wo
od
Pro
du
cts
Pri
ma
ryM
eta
ls
Ma
chin
ery
Ele
ctri
cal
Eq
uip
.
Tra
nsp
ort
atio
nE
qu
ip.
No
n-D
ura
ble
Mfg
.
Fo
od
Pro
du
cts
Pe
tro
leu
m &
Co
al
Ch
em
ica
l
Pla
stic
s &
Ru
bb
er
Te
xtile
Pro
du
cts
Manufacturing Is Expanding Across a Wide Range of Sectors that Will Contribute to Growth in Insurable Exposures Including: WC, Commercial
Property, Commercial Auto and Many Liability Coverages
Growth (%)
Manufacturing of durable goods has been
especially strong
*Seasonally adjusted; Date are YTD comparing data through March 2012 to the same period in 2011.Source: U.S. Census Bureau, Full Report on Manufacturers’ Shipments, Inventories, and Orders, http://www.census.gov/manufacturing/m3/
Durables: +11.4% Non-Durables: +8.5%
50
.7 52
.7 54
.1
54
.6
54
.8
53
.5
53
.7
52
.8 53
.9
54
.6 56 5
7.1 5
9.4
59
.7
56
.3
54
.4
53
.3
53
.4
53
.8
52
.6
52
.6
52
.6
52
.6
53
.0
56
.8
57
.3
56
.0
53
.5
53
.7
40
45
50
55
60
65
Jan
-10
Fe
b-1
0
Ma
r-1
0
Ap
r-1
0
Ma
y-1
0
Jun
-10
Jul-
10
Au
g-1
0
Se
p-1
0
Oct
-10
No
v-1
0
De
c-1
0
Jan
-11
Fe
b-1
1
Ma
r-1
1
Ap
r-1
1
Ma
y-1
1
Jun
-11
Jul-
11
Au
g-1
1
Se
p-1
1
Oct
-11
No
v-1
1
De
c-1
1
Jan
-12
Fe
b-1
2
Ma
r-1
2
Ap
r-1
2
Ma
y-1
2
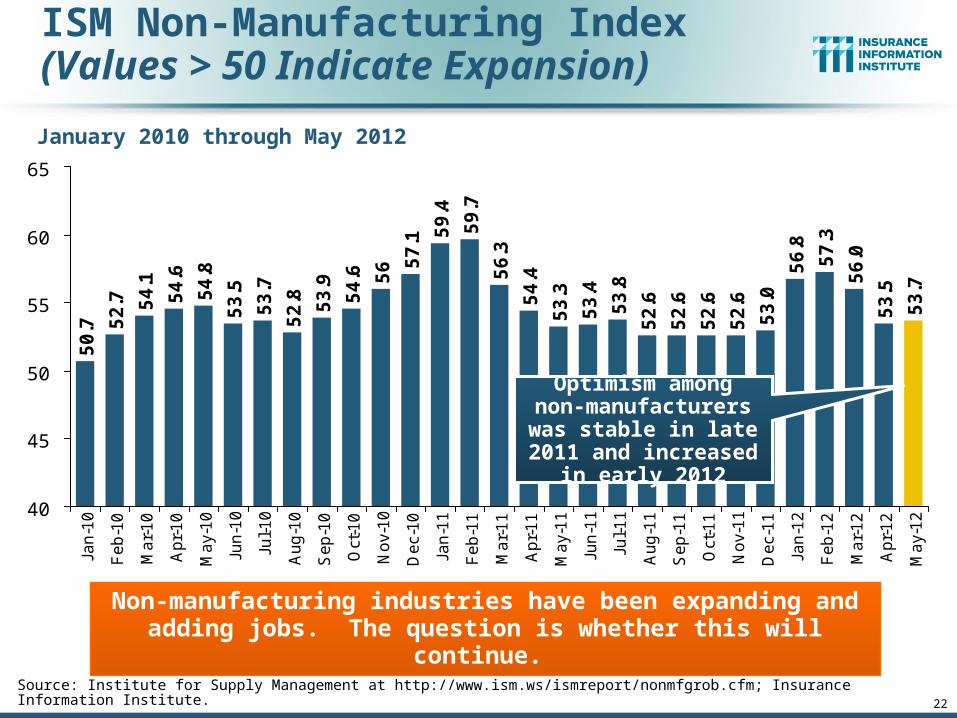
ISM Non-Manufacturing Index(Values > 50 Indicate Expansion)
January 2010 through May 2012
Non-manufacturing industries have been expanding and adding jobs. The question is whether this will continue.
Source: Institute for Supply Management at http://www.ism.ws/ismreport/nonmfgrob.cfm; Insurance Information Institute.
Optimism among non-manufacturers was
stable in late 2011 and increased in early 2012
22
23
43,6
9448
,125
69,3
0062
,436
64,0
04 71,2
77 81,2
3582
,446
63,8
5363
,235
64,8
5371
,549
70,6
4362
,304
52,3
7451
,959
53,5
4954
,027
44,3
6737
,884
35,4
7240
,099
38,5
4035
,037
34,3
1739
,201
19,6
95 28,3
2243
,546
60,8
3756
,282
47,8
0610
,998
0
10,000
20,000
30,000
40,000
50,000
60,000
70,000
80,000
90,000
80 81 82 83 84 85 86 87 88 89 90 91 92 93 94 95 96 97 98 99 00 01 02 03 04 05 06 07 08 09 10 1112
:Q1
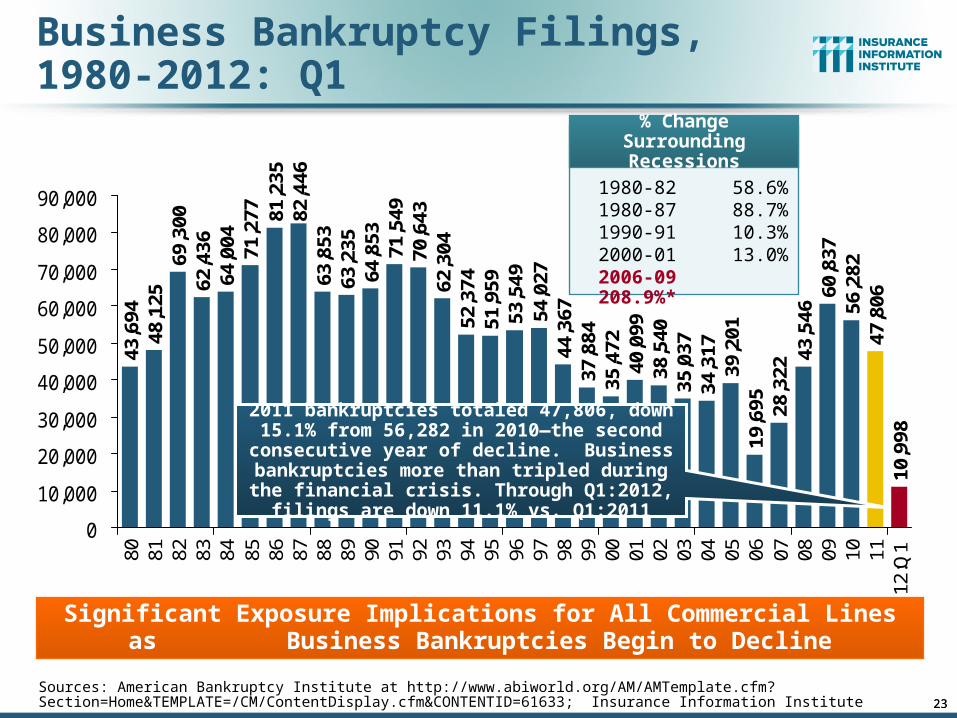
Business Bankruptcy Filings,1980-2012: Q1
Sources: American Bankruptcy Institute at http://www.abiworld.org/AM/AMTemplate.cfm?Section=Home&TEMPLATE=/CM/ContentDisplay.cfm&CONTENTID=61633; Insurance Information Institute
Significant Exposure Implications for All Commercial Lines as Business Bankruptcies Begin to Decline
2011 bankruptcies totaled 47,806, down 15.1% from 56,282 in 2010—the second consecutive year of decline. Business bankruptcies more
than tripled during the financial crisis. Through Q1:2012, filings are down 11.1% vs. Q1:2011
% Change Surrounding Recessions
1980-82 58.6%1980-87 88.7%1990-91 10.3%2000-01 13.0%2006-09 208.9%*
23

24
Private Sector Business Starts, 1993:Q2 – 2011:Q3*
175
186
174
180
186
192
188
187 18
918
6 190 19
419
119
9 204
202
195
196
196
206
206
201
192
198
206
206
203
211
205
212
200 20
520
420
419
720
320
920
119
219
219
320
1 204
202
210 21
220
921
6 220 22
322
022
021
022
121
220
421
820
920
720
719
919
1 193
172 17
616
918
417
5 179
188
200
183 18
7 191
203
150
160
170
180
190
200
210
220
230
93 94 95 96 97 98 99 00 01 02 03 04 05 06 07 08 09 10 11
Business Starts Were Down Nearly 20% in the Recession, Holding Back Most Types of Commercial Insurance Exposure, But
Are Recovering Slowly* Data through June 30, 2011 are the latest available as of May 21, 2012; Seasonally adjusted. **Annualized based on data through Q3:2011.Source: Bureau of Labor Statistics, http://www.bls.gov/news.release/cewbd.t08.htm.
(Thousands)
Business starts were up 3.5% to 561,000 in the first 9 months of 2011 vs. first 9
months of 2011. 722,000 new business starts were recorded in 2010, up 3.6% from
697,000 in 2009, which was the slowest year for new business starts since 1993
Business Starts2006: 872,0002007: 843,0002008: 790,0002009: 697,000 2010: 722,000 2011: 748,000**
24

NFIB Small Business Optimism Index
January 1985 through April 2012
Source: National Federation of Independent Business at http://www.advisorperspectives.com/dshort/charts/indicators/Sentiment.html?NFIB-optimism-index.gif ; Insurance Information Institute. 25
Small business optimism has increased but is still only at
the level it was when the Financial Crisis began
26
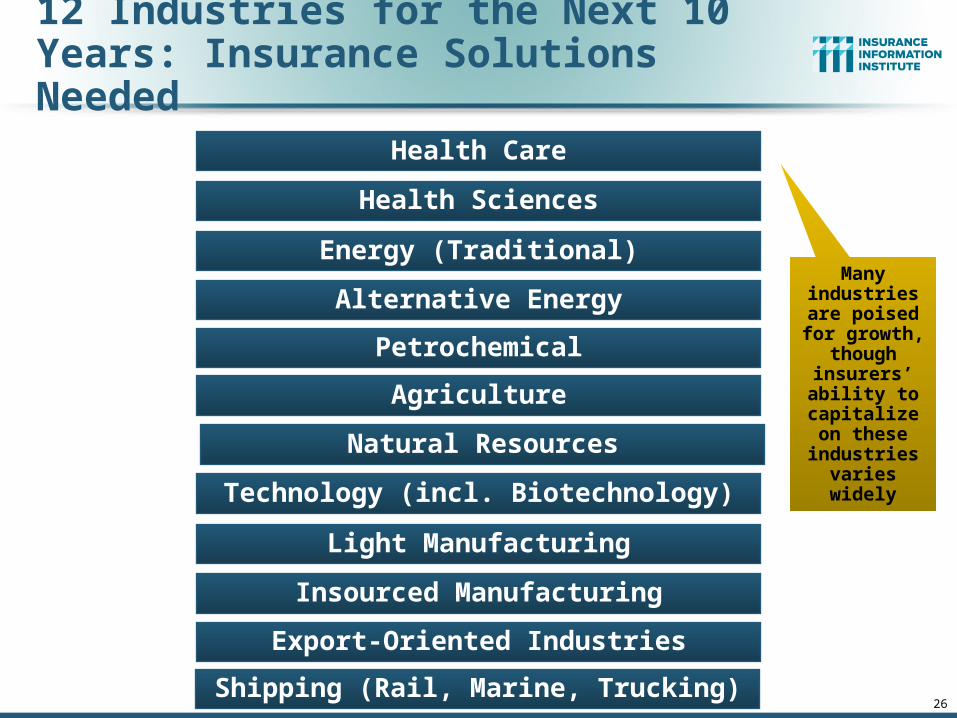
12 Industries for the Next 10 Years: Insurance Solutions Needed
Export-Oriented Industries
Health Sciences
Health Care
Energy (Traditional)
Alternative Energy
Petrochemical
Agriculture
Natural Resources
Technology (incl. Biotechnology)
Light Manufacturing
Insourced Manufacturing
Many industries are
poised for growth, though
insurers’ ability to
capitalize on these
industries varies widely
Shipping (Rail, Marine, Trucking)

27
Presidential Politics & the P/C Insurance Industry
How Is Profitability Affected by the President’s Political Party?
27
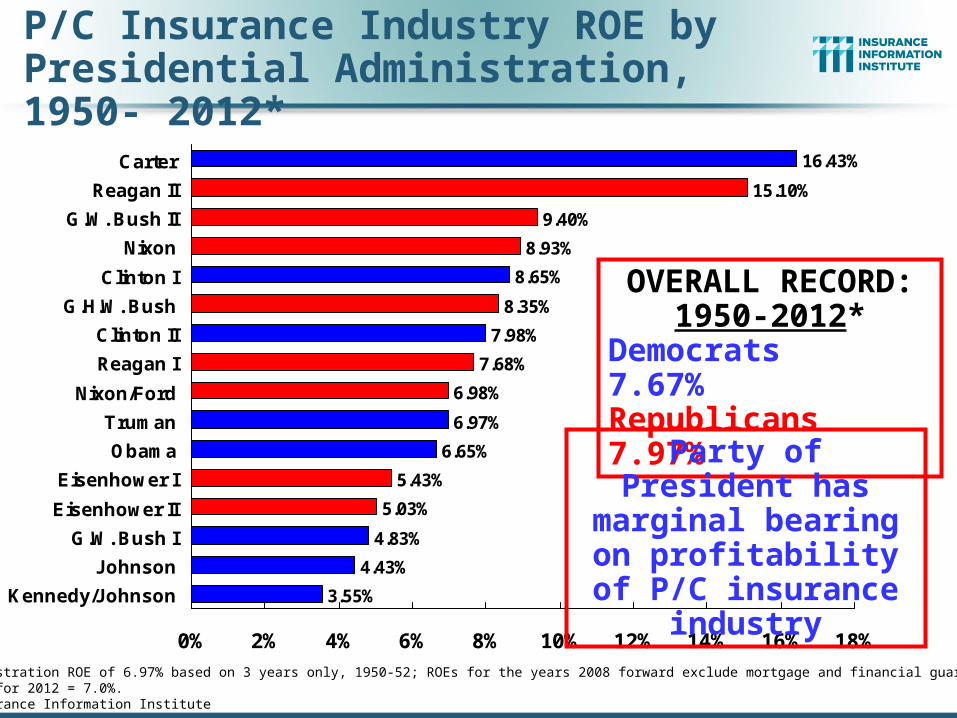
15.10%
9.40%
8.93%
8.65%
8.35%
7.98%
7.68%
6.98%
6.97%
6.65%
5.43%
5.03%
4.83%
4.43%
3.55%
16.43%
0% 2% 4% 6% 8% 10% 12% 14% 16% 18%
Carter
Reagan II
G.W. Bush II
Nixon
Clinton I
G.H.W. Bush
Clinton II
Reagan I
Nixon/Ford
Truman
Obama
Eisenhower I
Eisenhower II
G.W. Bush I
Johnson
Kennedy/Johnson
*Truman administration ROE of 6.97% based on 3 years only, 1950-52; ROEs for the years 2008 forward exclude mortgage and financial guaranty segments.Estimated ROE for 2012 = 7.0%. Source: Insurance Information Institute
OVERALL RECORD: 1950-2012*
Democrats 7.67%Republicans 7.97%
Party of President has marginal bearing on profitability of P/C insurance industry
P/C Insurance Industry ROE by Presidential Administration, 1950- 2012*

-5%
0%
5%
10%
15%
20%
25%
50
52
54
56
58
60
62
64
66
68
70
72
74
76
78
80
82
84
86
88
90
92
94
96
98
00
02
04
06
08
10
12
E
BLUE = Democratic President RED = Republican President
Tru
man Nixon/Ford
Ken
ned
y/
Joh
nso
n
Eis
enh
ow
er
Car
ter
Reagan/Bush I Clinton Bush II
P/C insurance Industry ROE by Presidential Party Affiliation, 1950- 2012*
*ROEs for the years 2008 forward exclude mortgage and financial guaranty segments; Estimated 2012 ROE = 7.0%Source: Insurance Information Institute
Ob
ama

30
Labor Market Trends
Massive Job Losses Sapped the Economy and Commercial/Personal
Lines Exposure, But Trend is Improving
30

31
Unemployment and Underemployment Rates: Stubbornly High in 2012, But Falling
2
4
6
8
10
12
14
16
18
Jan00
Jan01
Jan02
Jan03
Jan04
Jan05
Jan06
Jan07
Jan08
Jan09
Jan10
Jan11
Jan12
Traditional Unemployment Rate U-3
Unemployment + Underemployment Rate U-6
Unemployment stood at 8.2% in
May 2012
Unemployment peaked at 10.1% in October 2009, highest monthly rate since 1983.
Peak rate in the last 30 years:
10.8% in November -
December 1982
Source: US Bureau of Labor Statistics; Insurance Information Institute.
U-6 went from 8.0% in March
2007 to 17.5% in October 2009; Stood at 14.8%
in Apr. 2012
January 2000 through May 2012, Seasonally Adjusted (%)
Recession ended in
November 2001
Unemployment kept rising for
19 more months
Recession began in
December 2007
Stubbornly high unemployment and underemployment constrain overall economic growth, but the job market is now clearly improving
31
May 12

186
7921
365
127
42 15-1
09-1
465
9723
-12
-85 -58
-161
-253 -230
-257
-347
-456
-547
-734 -6
67-8
06-7
07-7
44-6
49-3
34-4
52-2
97-2
15 -186
-262
75-8
316
62
229
51 6111
714
311
2 193
128 16
711
925
726
126
410
810
2 175
5221
613
9 178 23
4 277
254
147
87 82
144
(1,000)
(800)
(600)
(400)
(200)
0
200
400
Jan-
07F
eb-0
7M
ar-0
7A
pr-0
7M
ay-0
7Ju
n-07
Jul-0
7A
ug-0
7S
ep-0
7O
ct-0
7N
ov-0
7D
ec-0
7Ja
n-08
Feb
-08
Mar
-08
Apr
-08
May
-08
Jun-
08Ju
l-08
Aug
-08
Sep
-08
Oct
-08
Nov
-08
Dec
-08
Jan-
09F
eb-0
9M
ar-0
9A
pr-0
9M
ay-0
9Ju
n-09
Jul-0
9A
ug-0
9S
ep-0
9O
ct-0
9N
ov-0
9D
ec-0
9Ja
n-10
Feb
-10
Mar
-10
Apr
-10
May
-10
Jun-
10Ju
l-10
Aug
-10
Sep
-10
Oct
-10
Nov
-10
Dec
-10
Jan-
11F
eb-1
1M
ar-1
1A
pr-1
1M
ay-1
1Ju
n-11
Jul-1
1A
ug-1
1S
ep-1
1O
ct-1
1N
ov-1
1D
ec-1
1Ja
n-12
Feb
-12
Mar
-12
Apr
-12
May
-12
Monthly Change in Private Employment
January 2008 through May 2012 (Thousands)
Private Employers Added 4.38 million Jobs Since Jan. 2010 After Having Shed 4.66 Million Jobs in 2009 and 3.81 Million in 2008 (State and Local Governments Have Shed Hundreds of Thousands of Jobs)
Source: US Bureau of Labor Statistics: http://www.bls.gov/ces/home.htm; Insurance Information Institute
Monthly Losses in Dec. 08–Mar. 09 Were
the Largest in the Post-WW II Period
82,000 private sector jobs were created in May
32

0.02
30.
011
-0.0
74-0
.132
-0.2
93-0
.546
-0.7
76-1
.033
-1.3
80-1
.836
-2.3
83-3
.117
-3.7
84-4
.590
-5.2
97-6
.041
-6.6
90-7
.024
-7.4
76-7
.773
-7.9
88-8
.174
-8.4
36-8
.361
-8.4
44-8
.428
-8.3
66-8
.222
-7.9
93-7
.942
-7.8
81-7
.764
-7.6
21-7
.509
-7.3
16-7
.188
-7.0
21-6
.902 -6.3
84-6
.120
-6.0
12-5
.910
-5.7
35-5
.683
-5.4
67-5
.328
-5.1
50-4
.916
-4.6
39-4
.385
-4.2
38-4
.151
-4.0
69
-6.6
45
-10
-8
-6
-4
-2
0
2
Dec
-07
Jan-
08F
eb-0
8M
ar-0
8A
pr-0
8M
ay-
Jun-
08Ju
l-08
Aug
-08
Sep
-08
Oct
-08
Nov
-08
Dec
-08
Jan-
09F
eb-0
9M
ar-0
9A
pr-0
9M
ay-
Jun-
09Ju
l-09
Aug
-09
Sep
-09
Oct
-09
Nov
-09
Dec
-09
Jan-
10F
eb-1
0M
ar-1
0A
pr-1
0M
ay-
Jun-
10Ju
l-10
Aug
-10
Sep
-10
Oct
-10
Nov
-10
Dec
-10
Jan-
11F
eb-1
1M
ar-1
1A
pr-1
1M
ay-
Jun-
11Ju
l-11
Aug
-11
Sep
-11
Oct
-11
Nov
-11
Dec
-11
Jan-
12F
eb-1
2M
ar-1
2A
pr-1
2M
ay-
Mill
ion
sCumulative Change in Private Employment: Dec. 2007—May 2012
December 2007 through May 2012 (Millions)
Source: US Bureau of Labor Statistics: http://www.bls.gov/ces/home.htm; Insurance Information Institute
Cumulative job losses peaked at 8.444 million
in December 2009
Cumulative job losses as of May 2012 totaled
4.069 million
33
All of the jobs “lost” since President
Obama took office in Jan. 2009 have
been recouped
Private Employers Added 4.38 million Jobs Since Jan. 2010 After Having Shed 4.66 Million Jobs in 2009 and 3.81 Million in 2008 (State and Local Governments Have Shed Hundreds of Thousands of Jobs)
0
-8
40
86
518
259
109
-70
-212 -188
-201
-221
-230
-267
-282
-295
-349
-367
-446 -4
13
-427
-454
-475
-486
-488
-483
-487
-497
-510
-600
-400
-200
0
200
400
600
Jan-
10
Feb
-10
Mar
-10
Apr
-10
May
-10
Jun-
10
Jul-1
0
Aug
-10
Sep
-10
Oct
-10
Nov
-10
Dec
-10
Jan-
11
Feb
-11
Mar
-11
Apr
-11
May
-11
Jun-
11
Jul-1
1
Aug
-11
Sep
-11
Oct
-11
Nov
-11
Dec
-11
Jan-
12
Feb
-12
Mar
-12
Apr
-12
May
-12
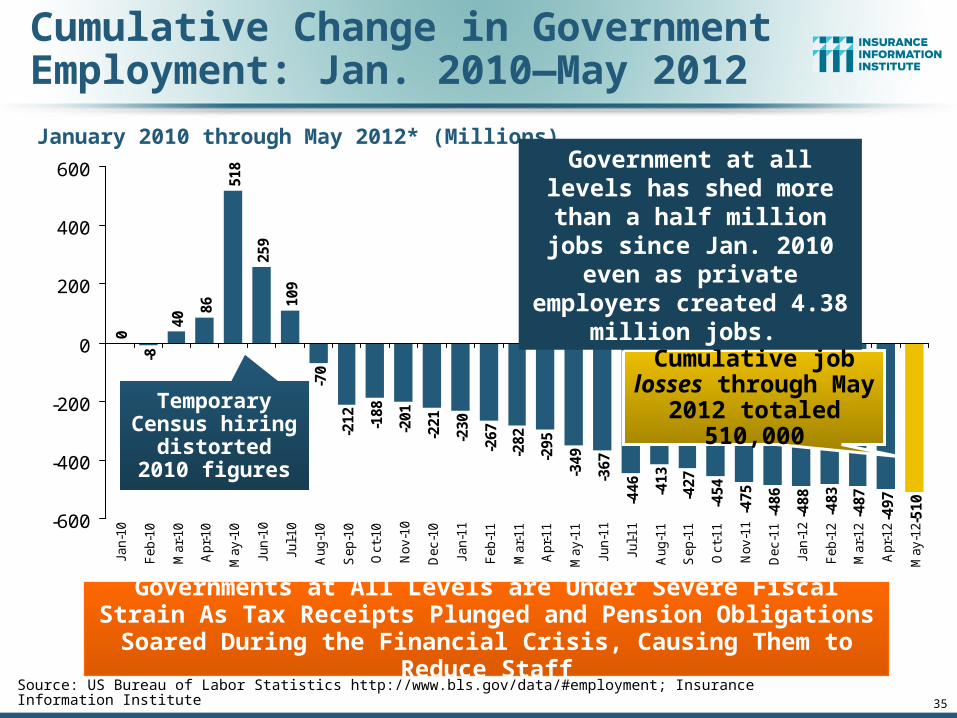
Cumulative Change in Government Employment: Jan. 2010—May 2012
January 2010 through May 2012* (Millions)
Source: US Bureau of Labor Statistics http://www.bls.gov/data/#employment; Insurance Information Institute
Cumulative job losses through May 2012 totaled 510,000
35
Governments at All Levels are Under Severe Fiscal Strain As Tax Receipts Plunged and Pension Obligations Soared During the
Financial Crisis, Causing Them to Reduce Staff
Government at all levels has shed more than a half
million jobs since Jan. 2010 even as private employers created 4.38 million jobs.
Temporary Census hiring distorted 2010
figures

37
Unemployment Rates by State, April 2012:Highest 25 States*
11
.7
11
.2
10
.9
9.5
9.4
9.1
8.9
8.8
8.7
8.7
8.7
8.5
8.5
8.3
8.3
8.2
8.1
8.1
7.9
7.9
7.8
7.7
7.7
7.4
7.4
7.3
0
2
4
6
8
10
12
14
NV RI CA DC NC NJ GA SC FL IL MS NY OR KY MI AZ US WA CO IN TN CT ID OH PA MO
Un
em
plo
ym
en
t R
ate
(%
)
*Provisional figures for April 2012, seasonally adjusted.
Sources: US Bureau of Labor Statistics; Insurance Information Institute.
In April, 37 states and the District of Columbia reported over-the-month
unemployment rate decreases, 5 had increases, and 8 had no change.

38
7.2
7.2
7.2
7.1
6.9
6.9
6.9
6.8
6.7
6.7
6.7
6.3
6.3
6.1
6.1
6.0
5.6
5.6
5.3
5.1
5.0
5.0
4.6
4.3
3.9
3.0
0
2
4
6
8
AL AR ME LA AK NM TX DE MD WV WI HI MA KS MT UT MN VA WY IA NH OK VT SD NE ND
Un
em
plo
ym
en
t R
ate
(%
)
Unemployment Rates By State, April 2012: Lowest 25 States*
*Provisional figures for April 2012, seasonally adjusted.Sources: US Bureau of Labor Statistics; Insurance Information Institute.
In April, 37 states and the District of Columbia reported over-the-month
unemployment rate decreases, 5 had increases, and 8 had no change.
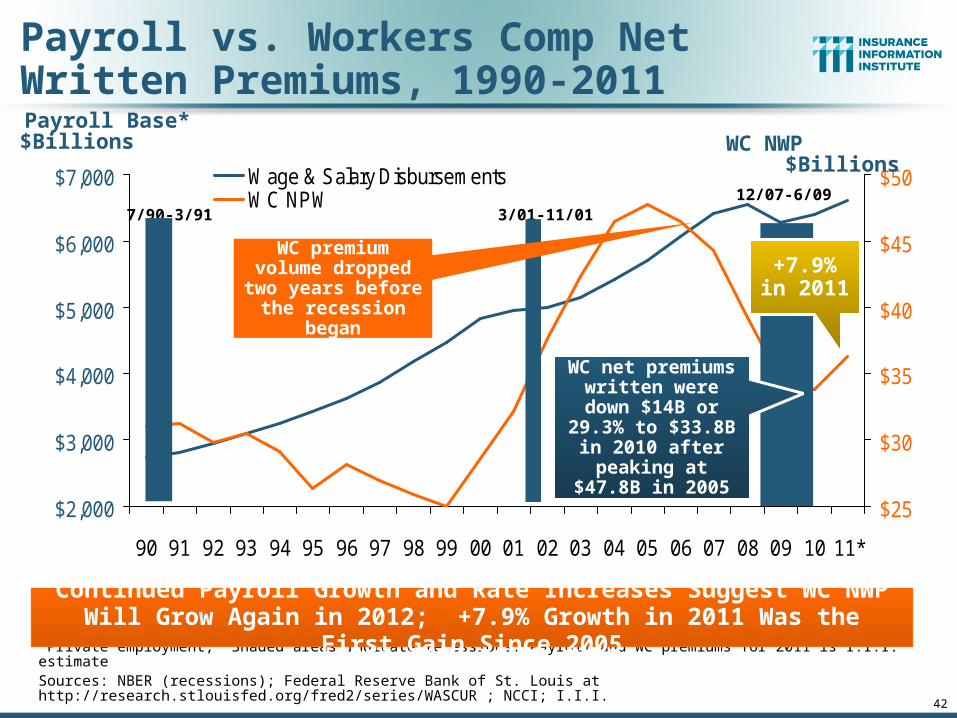
$2,000
$3,000
$4,000
$5,000
$6,000
$7,000
90 91 92 93 94 95 96 97 98 99 00 01 02 03 04 05 06 07 08 09 10 11*
$25
$30
$35
$40
$45
$50Wage & Salary DisbursementsWC NPW
42
Payroll Base* WC NWP
Payroll vs. Workers Comp Net Written Premiums, 1990-2011
*Private employment; Shaded areas indicate recessions. Payroll and WC premiums for 2011 is I.I.I. estimateSources: NBER (recessions); Federal Reserve Bank of St. Louis at http://research.stlouisfed.org/fred2/series/WASCUR ; NCCI; I.I.I.
Continued Payroll Growth and Rate Increases Suggest WC NWP Will Grow Again in 2012; +7.9% Growth in 2011 Was the First Gain Since 2005
7/90-3/91 3/01-11/0112/07-6/09
$Billions $Billions
WC premium volume dropped two years before
the recession began
WC net premiums written were down $14B or 29.3% to
$33.8B in 2010 after peaking at $47.8B
in 2005
+7.9% in 2011
53
P/C Insurance Industry Financial Overview
Profit Recovery Was Set Back in 2011 by High Catastrophe
Loss & Other Factors
53

P/C Net Income After Taxes1991–2011 ($ Millions)
$1
4,1
78
$5
,84
0
$1
9,3
16
$1
0,8
70
$2
0,5
98
$2
4,4
04 $
36
,81
9
$3
0,7
73
$2
1,8
65
$3
,04
6
$3
0,0
29
$6
2,4
96
$3
,04
3
$3
5,2
04
$1
9,1
50$2
8,6
72
-$6,970
$6
5,7
77
$4
4,1
55
$2
0,5
59
$3
8,5
01
-$10,000
$0
$10,000
$20,000
$30,000
$40,000
$50,000
$60,000
$70,000
$80,000
91 92 93 94 95 96 97 98 99 00 01 02 03 04 05 06 07 08 09 10 11*
2005 ROE*= 9.6% 2006 ROE = 12.7% 2007 ROE = 10.9% 2008 ROE = 0.1% 2009 ROE = 5.0% 2010 ROE = 6.6% 2011:Q3 ROAS1 = 3.5%
P-C Industry 2011 profits were down 46% to $19.2B vs. 2010, due
primarily to high catastrophe losses and as non-cat
underwriting results deteriorated
* ROE figures are GAAP; 1Return on avg. surplus. Excluding Mortgage & Financial Guaranty insurers yields a 4.6% ROAS for 2011, 7.6% for 2010 and 7.4% for 2009.Sources: A.M. Best, ISO, Insurance Information Institute

A 100 Combined Ratio Isn’t What ItOnce Was: Investment Impact on ROEs
Combined Ratio / ROE
* 2008 -2011 figures are return on average surplus and exclude mortgage and financial guaranty insurers. 2011 combined ratio including M&FG insurers is 108.2, ROAS = 3.5%. Source: Insurance Information Institute from A.M. Best and ISO data.
97.5
100.6 100.1 100.8
92.7
101.099.3
100.9
106.4
95.7
4.6%
7.6%7.4%4.4%
9.6%
15.9%
14.3%
12.7% 10.9%
8.8%
80
85
90
95
100
105
110
1978 1979 2003 2005 2006 2007 2008 2009 2010 20110%
3%
6%
9%
12%
15%
18%
Combined Ratio ROE*
Combined Ratios Must Be Lower in Today’s DepressedInvestment Environment to Generate Risk Appropriate ROEs
A combined ratio of about 100 generated ~5.5% ROE in 2009/10,
10% in 2005 and 16% in 1979

-5%
0%
5%
10%
15%
20%
25%
75
76
77
78
79
80
81
82
83
84
85
86
87
88
89
90
91
92
93
94
95
96
97
98
99
00
01
02
03
04
05
06
07
08
09
10
11
*
Profitability Peaks & Troughs in the P/C Insurance Industry, 1975 – 2011*
*Profitability = P/C insurer ROEs are I.I.I. estimates. 2011 figure is an estimate based on ROAS data. Note: Data for 2008-2011 exclude mortgage and financial guaranty insurers. For 2011:Q3 ROAS = 3.5% including M&FG.Source: Insurance Information Institute; NAIC, ISO, A.M. Best.
1977:19.0% 1987:17.3%
1997:11.6%2006:12.7%
1984: 1.8% 1992: 4.5% 2001: -1.2%
10 Years
10 Years9 Years
2011:4.6%*
History suggests next ROE peak will be in 2016-2017
ROE
1975: 2.4%
60
Profitability and Growth in California, Washington, Oregon, Texas, Louisiana, Mississippi, Colorado, New Mexico, and
Arizona P/C Insurance Markets
Analysis by Line and Nearby State Comparisons

All Lines: 10-Year Average RNW CA, WA, OR, TX, LA, MS, CO, NM, AZ vs. U.S.
-9.2%
7.1%7.2%
9.2%9.3%
10.2%
10.5%10.6%
-11.5%
4.9%
-15% -10% -5% 0% 5% 10% 15%
Washington
New Mexico
Oregon
Colorado
California
Arizona
U.S.
Texas
Mississippi
Louisiana
Source: NAIC, Insurance Information Institute
2001-2010
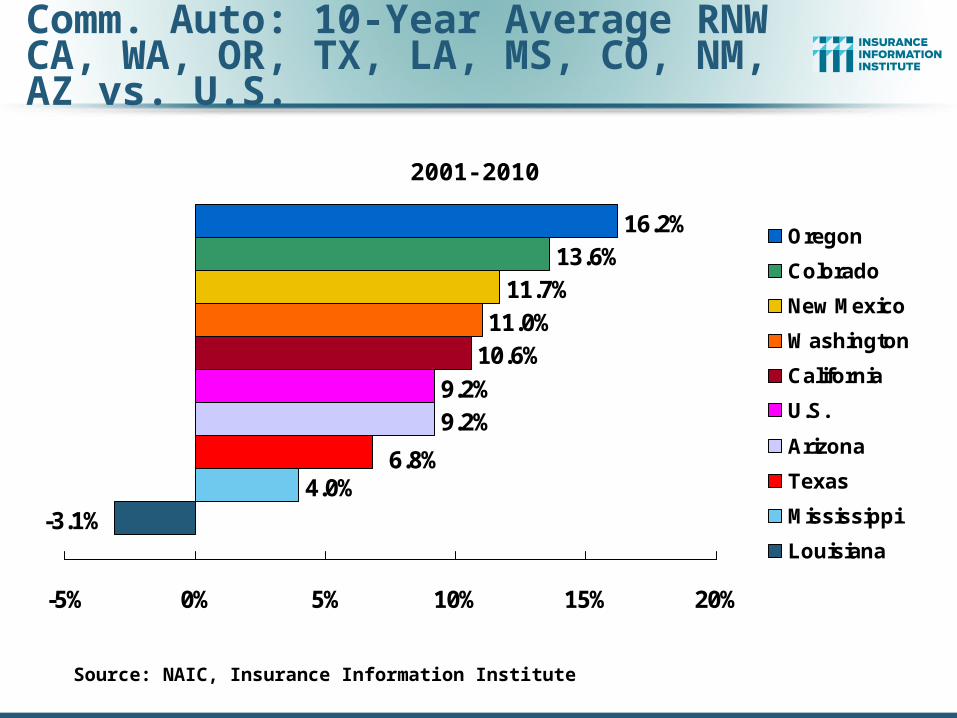
Comm. Auto: 10-Year Average RNW CA, WA, OR, TX, LA, MS, CO, NM, AZ vs. U.S.
4.0%
9.2%9.2%
10.6%11.0%
11.7%13.6%
16.2%
-3.1%
6.8%
-5% 0% 5% 10% 15% 20%
Oregon
Colorado
New Mexico
Washington
California
U.S.
Arizona
Texas
Mississippi
Louisiana
Source: NAIC, Insurance Information Institute
2001-2010

Comm. M-P: 10-Year Average RNW CA, WA, OR, TX, LA, MS, CO, NM, AZ vs. U.S.
-8.7%
5.6%6.7%
8.3%8.6%
9.6%
11.9%13.6%
-18.1%
2.2%
-20% -10% 0% 10% 20%
New Mexico
California
Oregon
Colorado
U.S.
Washington
Arizona
Texas
Mississippi
Louisiana
Source: NAIC, Insurance Information Institute
2001-2010
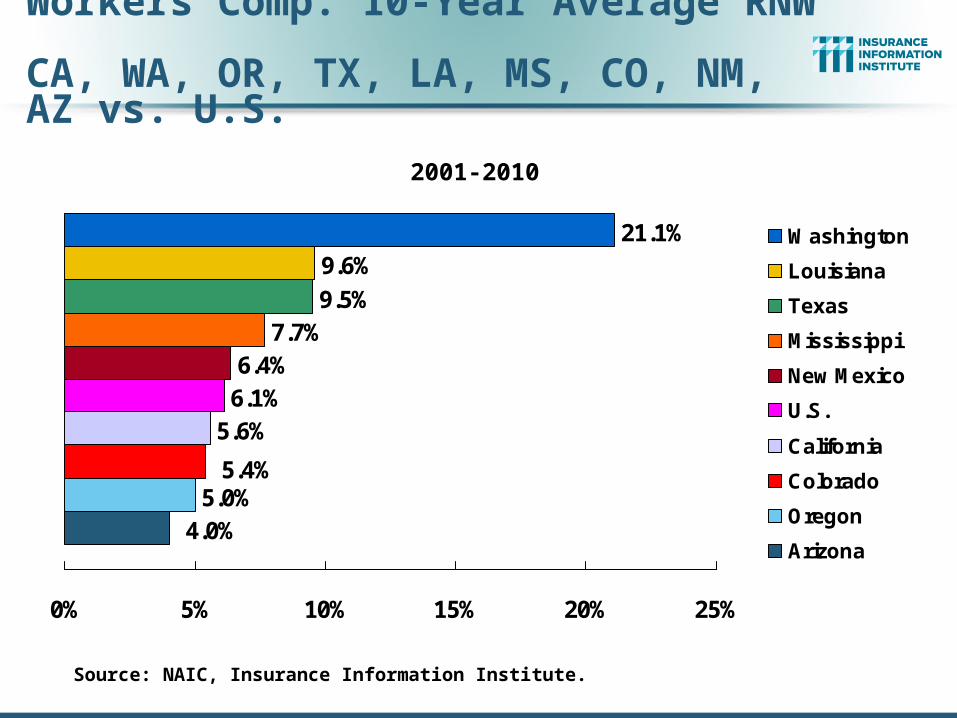
Workers Comp: 10-Year Average RNW CA, WA, OR, TX, LA, MS, CO, NM, AZ vs. U.S.
5.0%
5.6%6.1%6.4%
7.7%9.5%
9.6%21.1%
4.0%
5.4%
0% 5% 10% 15% 20% 25%
Washington
Louisiana
Texas
Mississippi
New Mexico
U.S.
California
Colorado
Oregon
Arizona
Source: NAIC, Insurance Information Institute.
2001-2010
Global Catastrophe Loss Developments and Trends
65
2011 Rewrote Catastrophe Loss and Insurance History
But Will Losses Turn the Market?
65

Geophysical events(earthquake, tsunami, volcanic activity)
Meteorological events (storm)
Hydrological events(flood, mass movement)
Selection of significant loss events (see table)
Natural catastrophes
Earthquake, tsunami Japan, 11 March
EarthquakeNew Zealand, 22 Feb.
Cyclone Yasi Australia, 2–7 Feb.
Landslides, flash floodsBrazil, 12/16 Jan.
Floods, flash floods Australia, Dec. 2010–Jan. 2011
Severe storms, tornadoesUSA, 22–28 April
Severe storms, tornadoesUSA, 20–27 May
WildfiresUSA, April/Sept.
EarthquakeNew Zealand, 13 June
FloodsUSA, April–May
Climatological events(extreme temperature, drought, wildfire)
Number of Events: 820Number of Events: 820
DroughtUSA, Oct. 2010– ongoing
Hurricane IreneUSA, Caribbean22 Aug.–2 Sept.
WildfiresCanada, 14–22 May
DroughtSomaliaOct. 2010–Sept. 2011
FloodsPakistanAug.–Sept.
FloodsThailandAug.–Nov.
Earthquake Turkey23 Oct.
Flash floods, floodsItaly, France, Spain4–9 Nov.
Floods, landslidesGuatemala, El Salvador11–19 Oct.
Tropical Storm WashiPhilippines, 16–18 Dec.
Winter Storm JoachimFrance, Switzerland, Germany, 15–17 Dec.
67Source: MR NatCatSERVICE
Natural Loss Events, 2011
World Map
76
U.S. Insured Catastrophe Loss Update
2011 Was One of the Most Expensive Years on Record
76

77
Top 14 Most Costly Disastersin U.S. History
(Insured Losses, 2011 Dollars, $ Billions)
*Losses will actually be broken down into several “events” as determined by PCS. Includes losses for the period April 1 – June 30.Sources: PCS; Insurance Information Institute inflation adjustments.
$9.0$11.9 $13.1
$19.1$21.3
$24.0 $25.0
$47.6
$8.5$7.7$6.5$5.5$4.4$4.3
$0$5
$10$15$20$25$30$35$40$45$50
Irene(2011)
Jeanne(2004)
Frances(2004)
Rita (2005)
Hugo (1989)
Ivan (2004)
Charley(2004)
Wilma(2005)
Ike (2008)
Northridge(1994)
SpringTornadoes& Storms*
(2011)
9/11Attack(2001)
Andrew(1992)
Katrina(2005)
Taken as a single event, the Spring 2011 tornado and storm season are
is the 4th costliest event in US insurance history
Hurricane Irene became the 11th most expense
hurricane in US history

Nu
mb
er
Geophysical (earthquake, tsunami, volcanic activity)
Climatological (temperature extremes, drought, wildfire)
Meteorological (storm)
Hydrological (flood, mass movement)
Natural Disasters in the United States, 1980 – 2011Number of Events (Annual Totals 1980 – 2011)
Source: MR NatCatSERVICE 78
37
8
51
2
50
100
150
200
250
300
1980 1982 1984 1986 1988 1990 1992 1994 1996 1998 2000 2002 2004 2006 2008 2010
There were 117 natural disaster events in 2011

80
$1
2.3
$1
0.7
$3
.7 $1
4.0
$1
1.3
$6
.0
$3
3.9
$7
.4 $1
5.9 $
32
.9
$7
1.7
$1
0.3
$7
.3
$2
8.5
$1
1.2
$1
4.1
$3
2.3
$1
00
.0
$1
3.7
$4
.7
$7
.8
$3
6.9
$8
.6
$2
5.8
$0
$20
$40
$60
$80
$100
$120
89 90 91 92 93 94 95 96 97 98 99 00 01 02 03 04 05 06 07 08 09 10 11*20??
US Insured Catastrophe Losses
*PCS figure as of April 6, 2012.Note: 2001 figure includes $20.3B for 9/11 losses reported through 12/31/01 ($25.9B 2011 dollars). Includes only business and personal property claims, business interruption and auto claims. Non-prop/BI losses = $12.2B ($15.6B in 2011 dollars.) Sources: Property Claims Service/ISO; Insurance Information Institute.
US CAT Losses in 2011 Were the 5th Highest in US History on An Inflation Adjusted Basis
$100 Billion CAT Year is Coming Eventually
Record Tornado Losses Caused
2011 CAT Losses to Surge
($ Billions, 2011 Dollars)
80
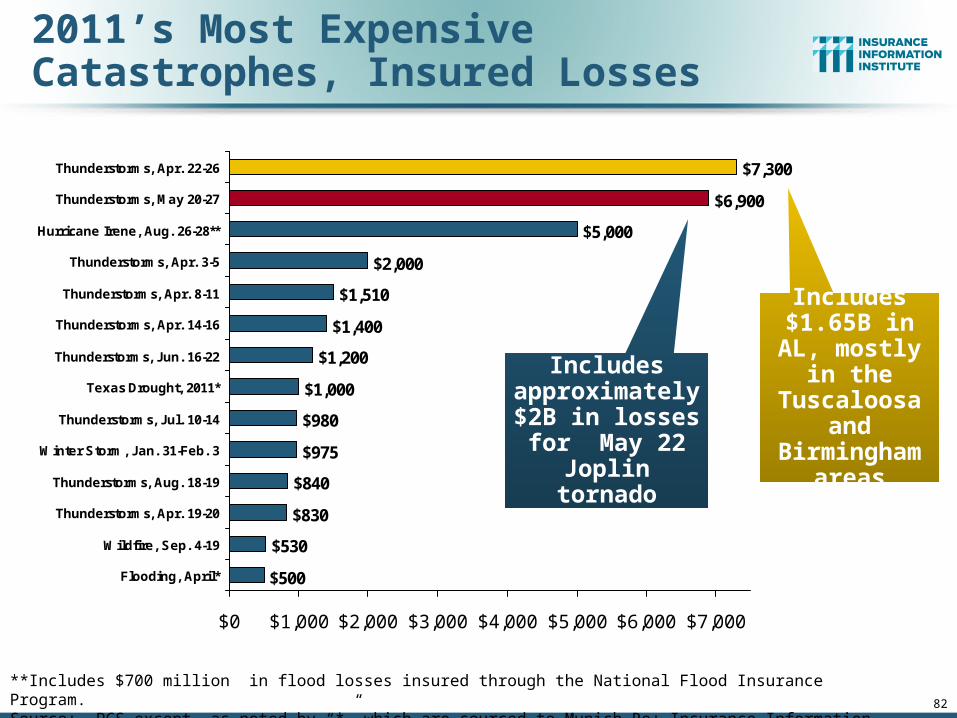
$500
$530
$830
$975
$980
$1,000
$1,200
$1,400
$1,510
$2,000
$5,000
$6,900
$7,300
$840
$0 $1,000 $2,000 $3,000 $4,000 $5,000 $6,000 $7,000
Flooding, April*
Wildfire, Sep. 4-19
Thunderstorms, Apr. 19-20
Thunderstorms, Aug. 18-19
Winter Storm, Jan. 31-Feb. 3
Thunderstorms, Jul. 10-14
Texas Drought, 2011*
Thunderstorms, Jun. 16-22
Thunderstorms, Apr. 14-16
Thunderstorms, Apr. 8-11
Thunderstorms, Apr. 3-5
Hurricane Irene, Aug. 26-28**
Thunderstorms, May 20-27
Thunderstorms, Apr. 22-26
**Includes $700 million in flood losses insured through the National Flood Insurance Program.Source: PCS except as noted by “*” which are sourced to Munich Re; Insurance Information Institute.
2011’s Most Expensive Catastrophes, Insured Losses
Includes $1.65B in AL, mostly in the Tuscaloosa
and Birmingham
areas
Includes approximately $2B in losses
for May 22 Joplin tornado
82

Claim Payments to Policyholders, by State, for the May 20-27 Storms (Joplin)
$2,160
$1,050$975
$485 $460$340
$255 $225$161 $155 $110 $75 $65 $54 $50 $50 $40 $35
$115
$0
$500
$1,000
$1,500
$2,000
$2,500
MO OH TX TN IN OK KS PA MN IL WI AR GA NC NE KY VA IA NY
Missouri Claim Payout Accounted for 32% of the $6.9 Billion US Total for the May 20-27 Tornado and Storm Event, Which Affected 19 States
83
At $2.16 billion, MO suffered, by far, the largest losses from
the May 20-27 storms
TOTAL = $6.9 BILLION
Sources: Catastrophe loss data is for Catastrophe Serial No. 48 (May 22 – 27, 2011) from PCS as of May 10, 2012; Insurance Information Institute .
($ Thousands)

Claim Payments to Policyholders, by State, for the April 22-28 Storms (Tuscaloosa)
$2,925
$2,000
$590$435 $338 $305
$169 $112 $111 $90 $79 $66$80
$0
$500
$1,000
$1,500
$2,000
$2,500
$3,000
$3,500
AL TN TX GA AR MO MS KY OH VA LA IL OK
Alabama Claim Payout Accounted for 40% of the $7.3 Billion US Total for the April 22-28 Tornado and Storm Event, Which Affected 13 States
86Sources: Catastrophe loss data is for Catastrophe Serial No. 46 (April 22 – 28, 2011) from PCS as of April 13, 2012; Insurance Information Institute .
At $2.925 billion, AL suffered, by far, the largest losses from
the Apr. 22-28 storms
TOTAL = $7.3 BILLION

87
Combined Ratio Points Associated with Catastrophe Losses: 1960 – 2011*
*Insurance Information Institute estimates for 2010 and 2011 based on A.M. Best data.Notes: Private carrier losses only. Excludes loss adjustment expenses and reinsurance reinstatement premiums. Figures are adjusted for losses ultimately paid by foreign insurers and reinsurers.Source: ISO; Insurance Information Institute.
0.4
1.2
0.4 0.
8 1.3
0.3 0.4 0.
71.
51.
00.
40.
4 0.7
1.8
1.1
0.6
1.4 2.
01.
3 2.0
0.5
0.5 0.7
3.0
1.2
2.1
8.8
2.3
5.9
3.3
2.8
1.0
3.6
2.9
1.6
5.4
1.6
3.3
3.3
8.1
2.7
1.6
5.0
2.6
4.4
8.0
3.6
0.9
0.1
1.1
1.1
0.8
0
1
2
3
4
5
6
7
8
9
10
1960
1962
1964
1966
1968
1970
1972
1974
1976
1978
1980
1982
1984
1986
1988
1990
1992
1994
1996
1998
2000
2002
2004
2006
2008
2010
The Catastrophe Loss Component of Private Insurer Losses Has Increased Sharply in Recent Decades
Avg. CAT Loss Component of the Combined Ratio
by Decade
1960s: 1.04 1970s: 0.85 1980s: 1.31 1990s: 3.39 2000s: 3.52 2010s: 6.20*
Combined Ratio Points
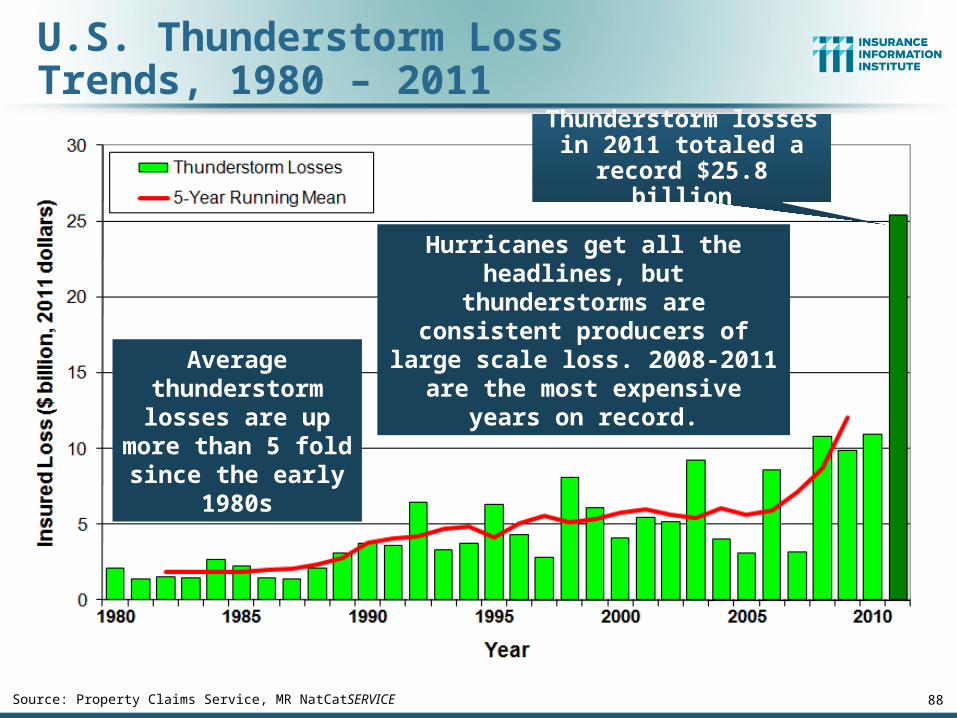
U.S. Thunderstorm Loss Trends, 1980 – 2011
88Source: Property Claims Service, MR NatCatSERVICE
Average thunderstorm
losses are up more than 5 fold since the early 1980s
Hurricanes get all the headlines, but thunderstorms are consistent
producers of large scale loss. 2008-2011 are the most expensive
years on record.
Thunderstorm losses in 2011 totaled a record
$25.8 billion

Source: Property Claims Service, MR NatCatSERVICE
U.S. Winter Storm Loss Trends, 1980 – 2011
89
Insured winter storm losses in 2011 totaled $2.0 billion. Average winter storm losses have nearly doubled
since the early 1980s
Slide 89
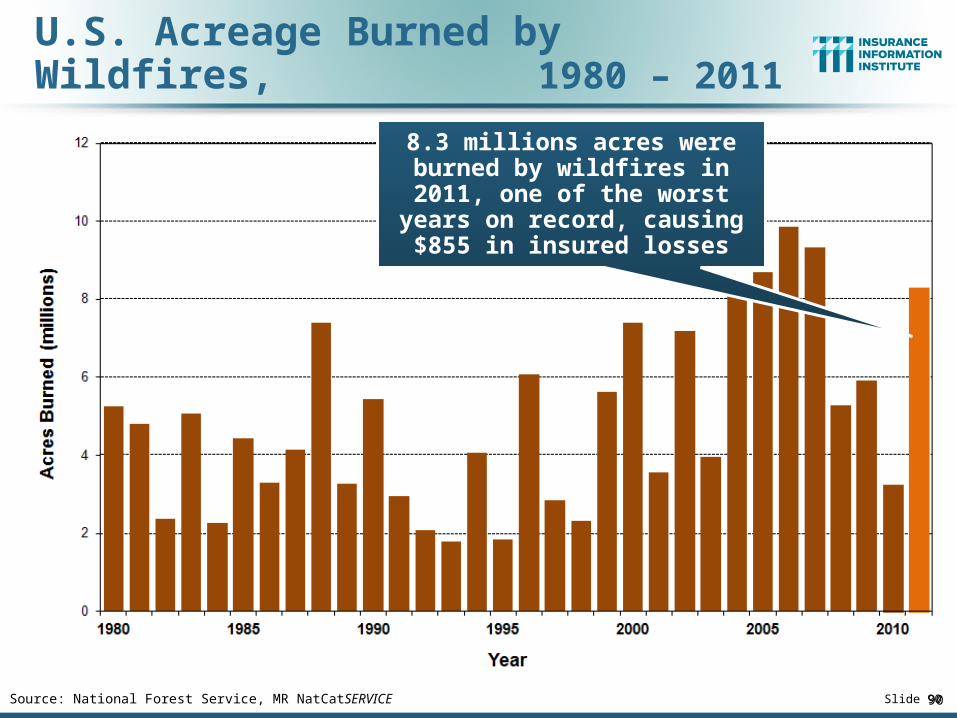
Source: National Forest Service, MR NatCatSERVICE
U.S. Acreage Burned by Wildfires, 1980 – 2011
90
8.3 millions acres were burned by wildfires in 2011, one of the worst years on record, causing
$855 in insured losses
Slide 90

94
Federal Disaster Declarations Patterns:
1953-2012
94
Records Were Set for Federal Disaster Declarations in 2010 and
2011—Most Declarations Were Unrelated to Tropical Activity

Number of Federal Disaster Declarations, 1953-2012*
13 1
7 18
16
16
7 71
21
22
22
0 25
25
11
11
19
29
17
17
48
46
46
38
30
22 2
54
22
31
52
42
13
42
7 28
23
11
31
38
45
32 3
63
27
54
46
55
04
54
5 49
56
69
48 5
26
37
55
98
19
91
3
43
0
20
40
60
80
100
120
53
54
55
56
57
58
59
60
61
62
63
64
65
66
67
68
69
70
71
72
73
74
75
76
77
78
79
80
81
82
83
84
85
86
87
88
89
90
91
92
93
94
95
96
97
98
99
00
01
02
03
04
05
06
07
08
09
10
11
12
*Through June 3, 2012.Source: Federal Emergency Management Administration: http://www.fema.gov/news/disaster_totals_annual.fema ; Insurance Information Institute.
The Number of Federal Disaster Declarations Is Rising and Set New Records in 2010 and 2011
The number of federal disaster declarations set a
new record in 2011, with 99, shattering 2010’s record 81
declarations.
There have been 2,058 federal disaster
declarations since 1953. The average
number of declarations per year is 34 from
1953-2010, though that few haven’t been
recorded since 1995.
13 federal disasters were declared
through June 3, 2012
95

96
Federal Disasters Declarations by State, 1953 – 2012: Highest 25 States*
86
78
70
65
63
58
56
56
53
53
51
51
50
48
48
48
48
47
47
45
45
45
42
40
39
0
10
20
30
40
50
60
70
80
90
100
TX CA OK NY FL LA AL KY AR MO IL TN MS IA MN WV KS NE PA OH VA WA ND NC IN
Dis
as
ter
De
cla
rati
on
s
*Through June 3, 2012.
Source: FEMA: http://www.fema.gov/news/disaster_totals_annual.fema; Insurance Information Institute.
Over the past nearly 60 years,
Texas has had the highest number of Federal Disaster
Declarations
97
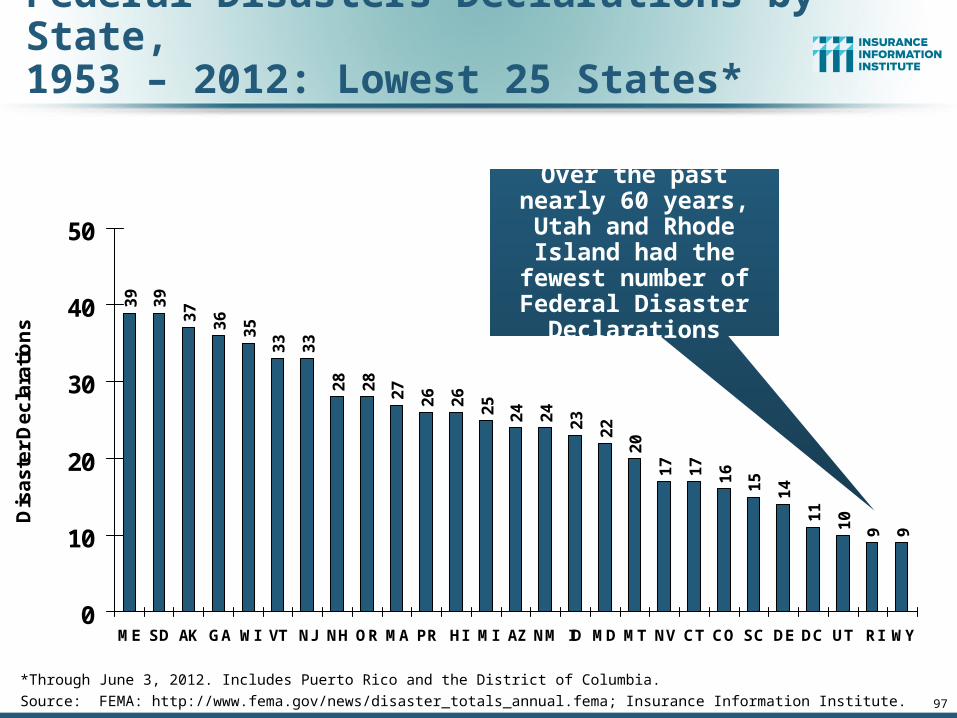
Federal Disasters Declarations by State, 1953 – 2012: Lowest 25 States*
39
39
37
36
35
33
33
28
28
27
26
26
25
24
24
23
22
20
17
17
16
15
14
11
10
9 9
0
10
20
30
40
50
ME SD AK GA WI VT NJ NH OR MA PR HI MI AZ NM ID MD MT NV CT CO SC DE DC UT RI WY
Dis
as
ter
De
cla
rati
on
s
*Through June 3, 2012. Includes Puerto Rico and the District of Columbia.
Source: FEMA: http://www.fema.gov/news/disaster_totals_annual.fema; Insurance Information Institute.
Over the past nearly 60 years, Utah and Rhode Island had the fewest
number of Federal Disaster Declarations

98
SPRING 2012 TORNADO & SEVERE STORM OUTBREAK
2012 Got Off to a Worrisome Start, But Is No Repeat of 2011
98
99
1,1
33
1,1
32 1
,29
7
1,1
73
1,0
82 1,2
34
1,1
73
1,1
48
1,4
24
1,3
45
1,0
71 1,2
16
94
1
1,3
76
1,2
64
1,1
03
1,0
98
1,6
92
1,1
46 1,2
82
74
0
1,819
1,6
91
553
0
200
400
600
800
1,000
1,200
1,400
1,600
1,800
2,000
90 91 92 93 94 95 96 97 98 99 00 01 02 03 04 05 06 07 08 09 10 11 12*
Nu
mb
er
of
To
rna
do
es
0
100
200
300
400
500
600
Nu
mb
er o
f De
ath
s
Number of Tornadoes
Number of Deaths
*Through May 26, 2012.Source: U.S. Department of Commerce, Storm Prediction Center, National Weather Service at http://www.spc.noaa.gov/climo/online/monthly/newm.html
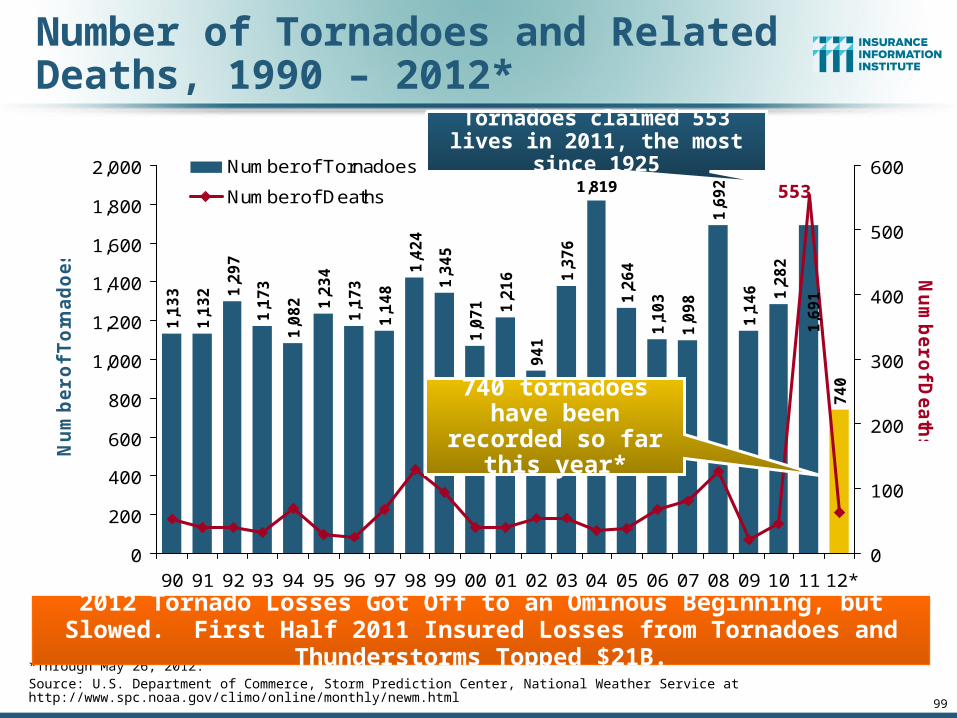
Number of Tornadoes and Related Deaths, 1990 – 2012*
Tornadoes claimed 553 lives in 2011, the most since 1925
740 tornadoes have been recorded so far
this year*
2012 Tornado Losses Got Off to an Ominous Beginning, but Slowed. First Half 2011 Insured Losses from Tornadoes and Thunderstorms Topped $21B.

U.S. Tornado Count, 2005-2012*
100
*Through June 2, 2012.Source: http://www.spc.noaa.gov/wcm/
There were 1,897 tornadoes in the US in 2011 far above
average, but well below 2008’s record
2012 count is running well behind 2011
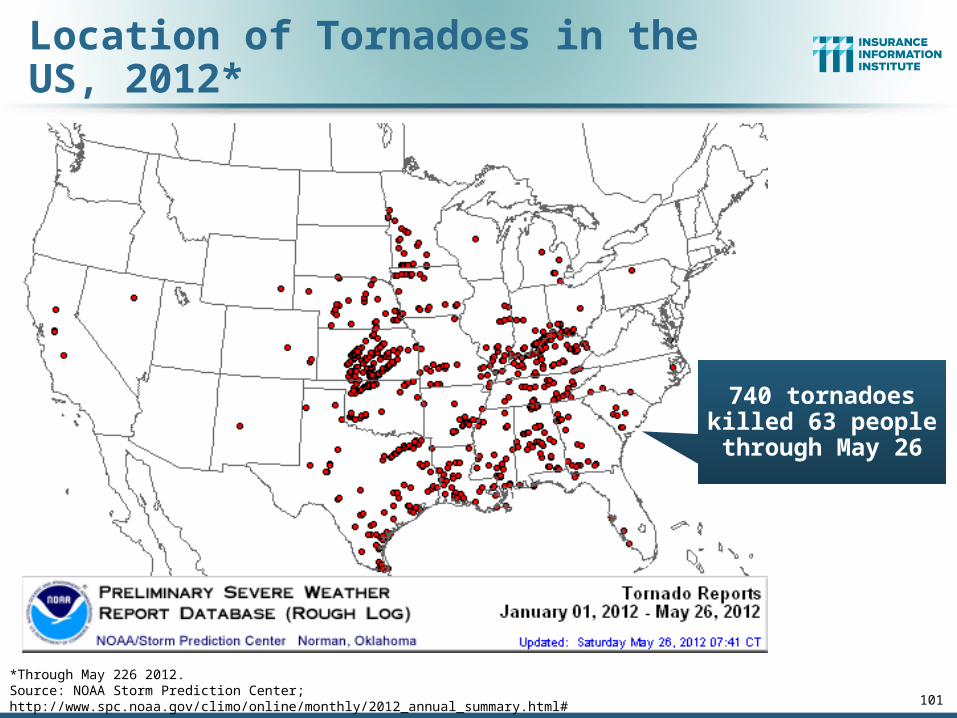
Location of Tornadoes in the US, 2012*
*Through May 226 2012.Source: NOAA Storm Prediction Center; http://www.spc.noaa.gov/climo/online/monthly/2012_annual_summary.html# 101
740 tornadoes killed 63 people through
May 26
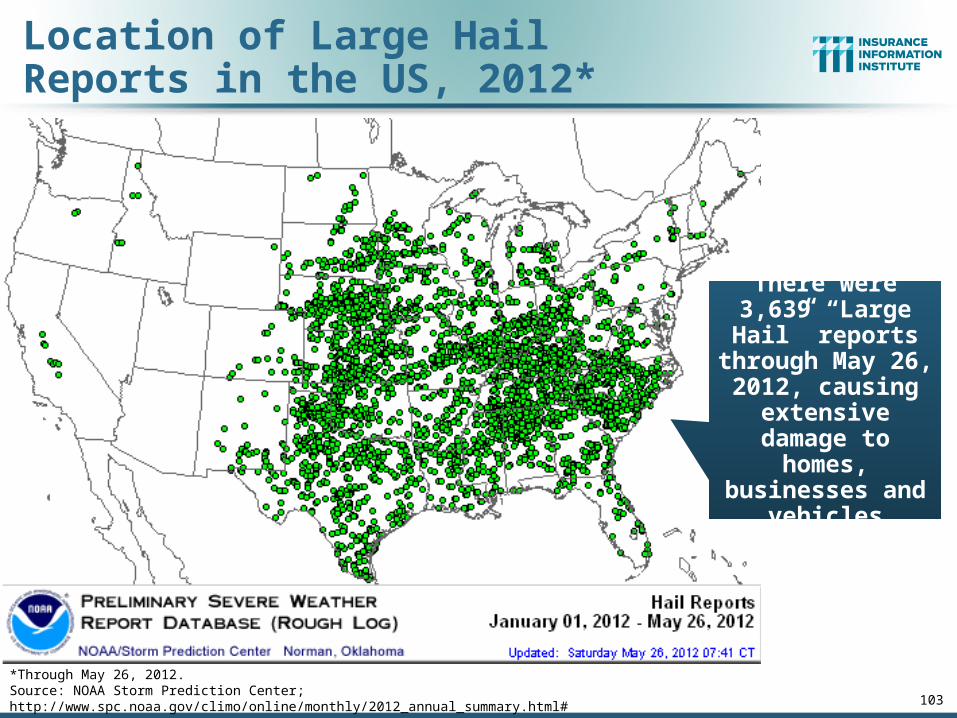
Location of Large Hail Reports in the US, 2012*
103*Through May 26, 2012.Source: NOAA Storm Prediction Center; http://www.spc.noaa.gov/climo/online/monthly/2012_annual_summary.html#
There were 3,639 “Large Hail”
reports through May 26, 2012,
causing extensive damage to homes,
businesses and vehicles

Location of Wind Damage Reports in the US, 2012*
105*Through May 26, 2012.Source: NOAA Storm Prediction Center; http://www.spc.noaa.gov/climo/online/monthly/2012_annual_summary.html#
There were 2,901 “Wind Damage” reports through May 26, causing
extensive damage to homes and,
businesses
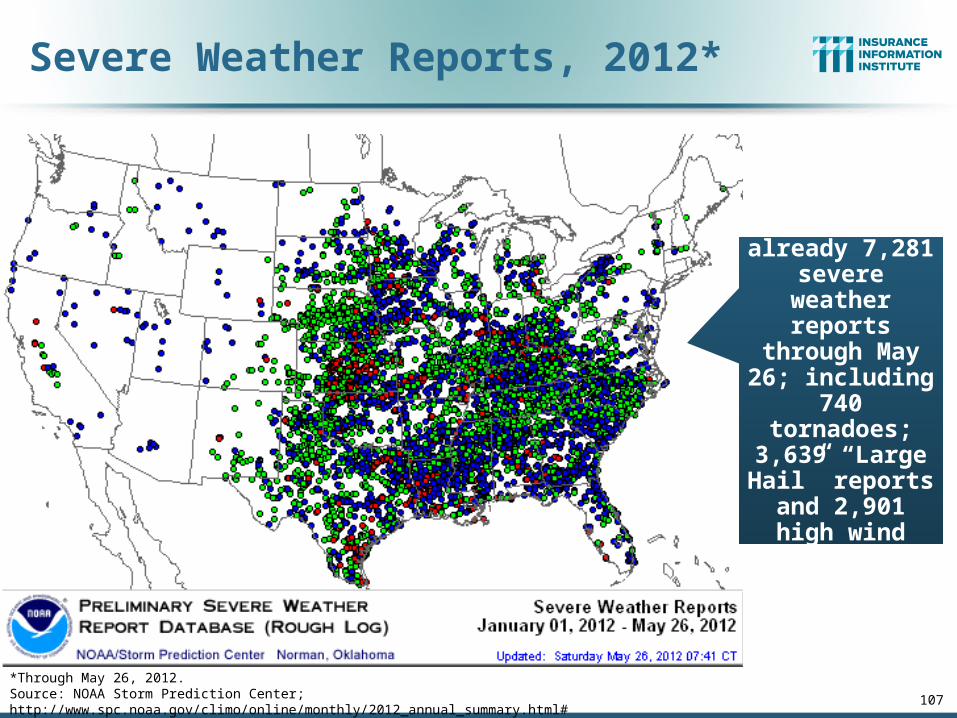
Severe Weather Reports, 2012*
107*Through May 26, 2012.Source: NOAA Storm Prediction Center; http://www.spc.noaa.gov/climo/online/monthly/2012_annual_summary.html#
There were already 7,281
severe weather reports through
May 26; including 740
tornadoes; 3,639 “Large Hail” reports
and 2,901 high wind events
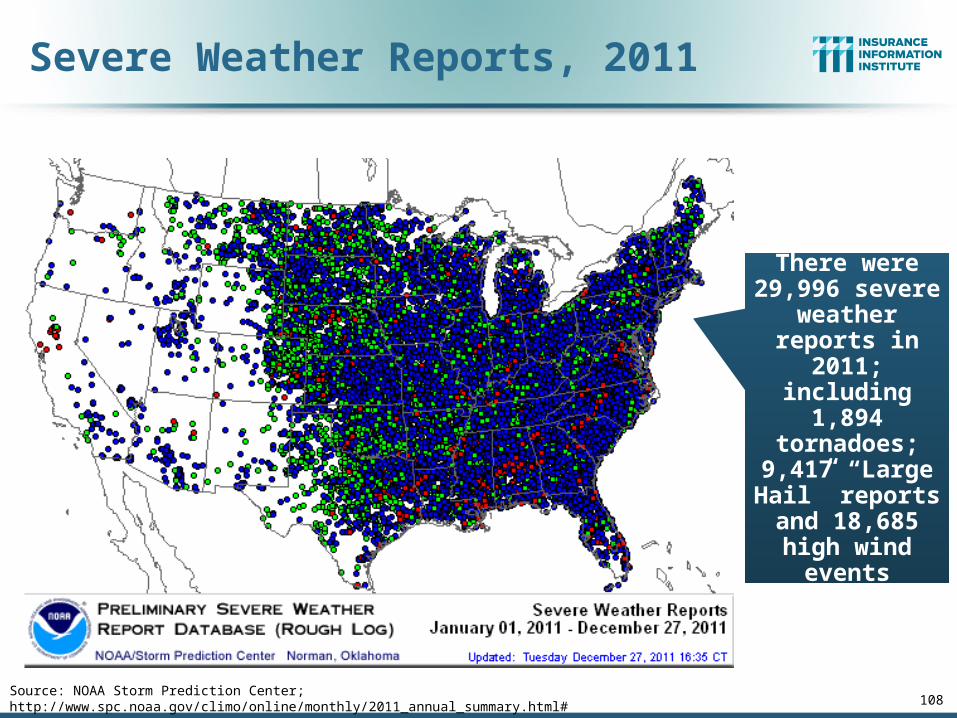
Severe Weather Reports, 2011
108Source: NOAA Storm Prediction Center; http://www.spc.noaa.gov/climo/online/monthly/2011_annual_summary.html#
There were 29,996 severe
weather reports in 2011;
including 1,894 tornadoes;
9,417 “Large Hail” reports
and 18,685 high wind events

The BIG Question:When Will the Market Turn?
110
Are Catastrophes and Other Factors Pressuring Insurance Markets?
110

111
Criteria Necessary for a “Market Turn”:All Four Criteria Must Be Met
Criteria Status Comments
Sustained Period of
Large Underwriting
LossesEarly Stage,
Inevitable
•Apart from 2011 CAT losses, overall p/c underwriting losses remain modest•Combined ratios (ex-CATs) still in low 100s (vs. 110+ at onset of last hard market)•Prior-year reserve releases continue to reduce u/w losses, boost ROEs, though more modestly
Material Decline in Surplus/ Capacity
Entered 2011 At Record High; Only
Small Decline
•Surplus hit a record $565B as of 3/31/11•Fell just 1.6% through 12/31/11 from 12/31/10•Will likely see new record in 2012•Little excess capacity remains in reinsurance markets•Modest growth in demand for insurance is insufficient to absorb much excess capacity
Tight Reinsurance
MarketSomewhat in
Place
•Much of the global “excess capacity” was eroded by cats•Higher prices in Asia/Pacific•Modestly higher pricing for US risks
Renewed Underwriting
& Pricing Discipline
Some Firming esp. in
Property, WC
•Commercial lines pricing trends have turned from negative to flat and now positive, esp. Property & WC; •Competition remains intense as many seek to maintain market share
Sources: Barclays Capital; Insurance Information Institute.

1. UNDERWRITING
112
Have Underwriting Losses Been Large Enough for Long Enough to Turn the Market?
112

113
P/C Insurance Industry Combined Ratio, 2001–2011*
* Excludes Mortgage & Financial Guaranty insurers 2008--2011. Including M&FG, 2008=105.1, 2009=100.7, 2010=102.4, 2011=106.4 Sources: A.M. Best, ISO.
95.7
99.3100.8
106.4
101.0
92.6
100.898.4
100.1
107.5
115.8
90
100
110
120
2001 2002 2003 2004 2005 2006 2007 2008 2009 2010 2011*
Best Combined
Ratio Since 1949 (87.6)
As Recently as 2001, Insurers Paid Out
Nearly $1.16 for Every $1 in Earned
Premiums
Relatively Low CAT Losses, Reserve Releases
Cyclical Deterioration
Heavy Use of Reinsurance Lowered Net
Losses
Relatively Low CAT Losses, Reserve Releases
Avg. CAT Losses,
More Reserve Releases
Higher CAT
Losses, Shrinking Reserve
Releases, Toll of Soft
Market

Underwriting Gain (Loss)1975–2011E*
* Includes mortgage and financial guaranty insurers in all yearsSources: A.M. Best, ISO; Insurance Information Institute.
Large Underwriting Losses Are NOT Sustainable in Current Investment Environment
-$55
-$45
-$35
-$25
-$15
-$5
$5
$15
$25
$35
75 76 77 78 79 80 81 82 83 84 85 86 87 88 89 90 91 92 93 94 95 96 97 98 99 00 01 02 03 04 05 06 07 08 09 1011*
Cumulative underwriting deficit from 1975 through
2011 is $479B
($ Billions) Underwriting losses in
2011 totaled $36.5B, the
largest since 2001

116
2
(2)
(8)
(3)
(7)(10) (10)
(4)
(0)
11
24
15
119
(5)
(9)
(14)
(10) (11)(7)
(5)(2)
-$20
-$15
-$10
-$5
$0
$5
$10
$15
$20
$25
$309
2
93
94
95
96
97
98
99
00
01
02
03
04
05
06
07
08
09
10
11
E
12
F
13
F
Pri
or
Yr.
Re
se
rve
Re
lea
se
($
B)
-6
-4
-2
0
2
4
6
8 Imp
ac
t on
Co
mb
ine
d R
atio
(Po
ints
)
Prior Yr. ReserveDevelopment ($B)
Impact onCombined Ratio(Points)
P/C Reserve Development, 1992–2013F
Reserve Releases Remained Strong in 2010 But Tapered Off in 2011. Releases Are Expected to
Further Diminish in 2012 and 2103Note: 2005 reserve development excludes a $6 billion loss portfolio transfer between American Re and Munich Re. Including this transaction, total prior year adverse development in 2005 was $7 billion. The data from 2000 and subsequent years excludes development from financial guaranty and mortgage insurance. Sources: Barclays Capital; A.M. Best.
Prior year reserve releases totaled $8.8
billion in the first half of 2010, up from
$7.1 billion in the first half of 2009

125
Performance by Segment
125

Private Passenger Auto Combined Ratio: 1993–2012P
10
1.7
10
1.3
10
1.3
10
1.0
10
9.5
10
7.9
10
4.2
98
.4
94
.3
95
.1
95
.5 98
.3 10
0.2
10
1.3
10
1.0
10
0.8
10
0.3
99
.5 10
1.1
10
3.5
80
85
90
95
100
105
110
115
93 94 95 96 97 98 99 00 01 02 03 04 05 06 07 08 09 10 11E 12F
Private Passenger Auto Accounts for 34% of Industry Premiums and Remains the Profit Juggernaut of the P/C Insurance Industry
Sources: A.M. Best (1990-2012F); Insurance Information Institute. 127

Homeowners Insurance Combined Ratio: 1990–2012F
11
3.0
11
7.7
15
8.4
11
3.6
10
1.0 10
9.4
10
8.2
11
1.4 1
21
.7
10
9.3
98
.2
94
.4 10
0.3
88
.9 95
.6
11
6.8
10
5.7
10
6.7
12
3.7
10
5.0
11
8.4
11
2.7 12
1.7
80
90
100
110
120
130
140
150
160
170
90 91 92 93 94 95 96 97 98 99 00 01 02 03 04 05 06 07 08 09 10 11E12F
Homeowners Performance Deteriorated in 2011 Due to Large Cat Losses. Extreme Regional Variation Can Be Expected
Due to Local Catastrophe Loss Activity
Sources: A.M. Best (1990-2012E); Insurance Information Institute. 128

109.4110.2
118.8
109.5
112.5
110.2
107.6
104.1
109.7 110.2
102.5
105.4
91.2
94.8
101.299.5
101.0
107.5
102.0102.0
111.1112.3
122.3
90
95
100
105
110
115
120
125
90
91
92
93
94
95
96
97
98
99
00
01
02
03
04
05
06
07
08
09
10
11
P
12
F
Co
mm
erc
ial L
ine
s C
om
bin
ed
Ra
tio
*2007-2012 figures exclude mortgage and financial guaranty segments.Source: A.M. Best; Insurance Information Institute
Commercial Lines Combined Ratio, 1990-2012F*
Commercial lines underwriting
performance in 2011 was the worst since 2002
131

Commercial Auto Combined Ratio: 1993–2012F
11
2.1
11
2.0
11
3.0
11
5.9
10
2.7
95
.2
92
.9
92
.1
92
.4 94
.3 96
.8 99
.4
98
.0 10
2.6
10
2.1
11
8.1
11
5.7
11
6.2
80
85
90
95
100
105
110
115
120
125
95 96 97 98 99 00 01 02 03 04 05 06 07 08 09 10 11P 12F
Commercial Auto is Expected to Deteriorate as Loss Frequency and Severity Trends Deteriorate 2011-2012
Sources: A.M. Best Insurance Information Institute. 132

Commercial Multi-Peril Combined Ratio: 1995–2012F
119.
0
119.
8
108.
5
125.
0
116.
2
116.
1
104.
9
101.
9
105.
4
95.4 97
.7
94.2 96
.2100.
7
116.
8
113.
6
115.
3 122.
4
115.
0
117.
0
97.3
89.0
97.7
93.8
83.8
89.8
108.
4
98.6 10
2.5
113.
0
102.
1
113.
1
115.
0 121.
0
80
85
90
95
100105
110
115
120
125
130
95 96 97 98 99 00 01 02 03 04 05 06 07 08 09 10 11E* 12F
CMP-Liability CMP-Non-Liability
Commercial Multi-Peril Underwriting Performance is Expected to Improve in 2012 Assuming Normal
Catastrophe Loss Activity
*2012 figures are A.M. Best estimate/forecast for the combined liability and non-liability components.Sources: A.M. Best; Insurance Information Institute. 133
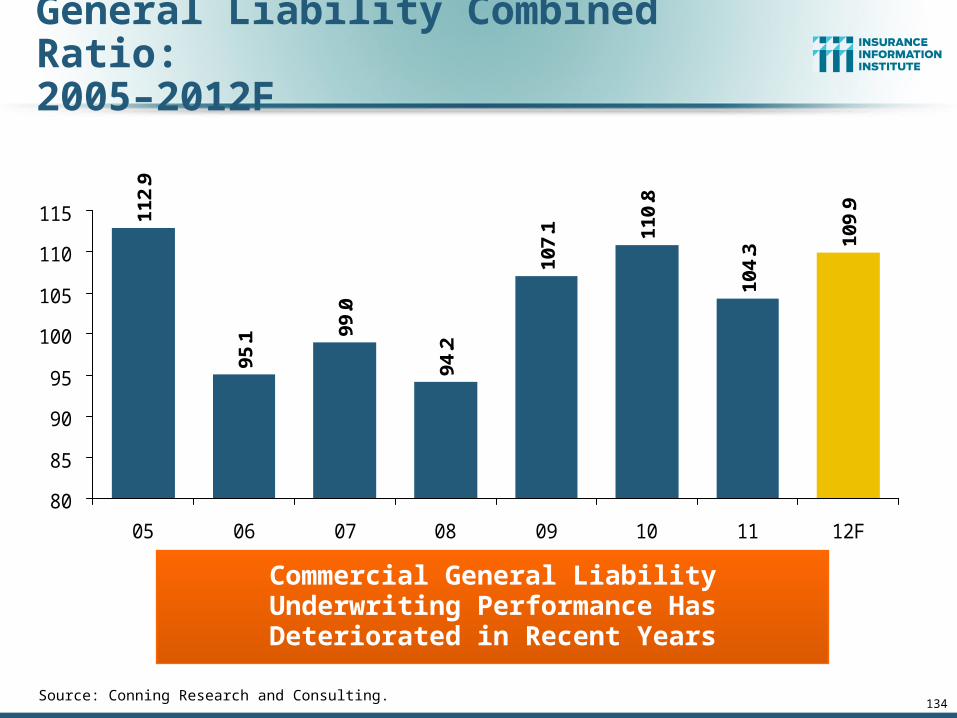
General Liability Combined Ratio: 2005–2012F
112.
9
95.1 99
.0
94.2
109.
9
107.
1 110.
8
104.
3
80
85
90
95
100
105
110
115
05 06 07 08 09 10 11 12F
Commercial General Liability Underwriting Performance Has Deteriorated in Recent Years
Source: Conning Research and Consulting. 134

Workers Compensation Combined Ratio: 1994–2012F
10
2.0
97
.0 10
0.0
10
1.0
11
0.9
11
0.0
10
7.0
10
2.7
98
.4 10
3.6
10
4.4 1
10
.6 11
6.8
11
5.0
11
6.01
21
.7
10
7.0
11
5.3
11
8.2
80
85
90
95
100
105
110
115
120
125
130
94 95 96 97 98 99 00 01 02 03 04 05 06 07 08 09 10 11P 12F
Workers Comp Underwriting Results Are Deteriorating Markedly and the Worst They
Have Been in a DecadeSources: A.M. Best (1994-2010 all carriers); NCCI for 2011 (Private carriers only); 2012 (All Carriers) Insurance Information Institute. 138

2. SURPLUS/CAPITAL/CAPACITY
149
Have Large Global Losses Reduced Capacity in the Industry, Setting
the Stage for a Market Turn?
149

151
Policyholder Surplus, 2006:Q4–2011:Q4
Sources: ISO, A.M .Best.
($ Billions)
$487.1$496.6
$512.8$521.8
$478.5
$455.6
$437.1
$463.0
$490.8
$511.5
$540.7$530.5
$544.8
$559.2 $559.1
$538.6
$550.3
$564.7
$505.0$515.6$517.9
$420
$440
$460
$480
$500
$520
$540
$560
$580
06:Q4 07:Q1 07:Q2 07:Q3 07:Q4 08:Q1 08:Q2 08:Q3 08:Q4 09:Q1 09:Q2 09:Q3 09:Q4 10:Q1 10:Q2 10:Q3 10:Q4 11:Q1 11:Q2 11:Q3 11:Q4
2007:Q3Previous Surplus Peak
Quarterly Surplus Changes Since 2011:Q1 Peak
11:Q2: -$5.6B (-1.0%)11:Q3: -$26.1B (-4.6%)11:Q4: -$14.3B (-2.5%)
Surplus as of 12/31/11 was down 2.5% below its all
time record high of $564.7B set as of 3/31/11. A new record high in 2012 is
possible.
*Includes $22.5B of paid-in capital from a holding company parent for one insurer’s investment in a non-insurance business in early 2010.
The Industry now has $1 of surplus for every $0.80 of NPW, close to the strongest claims-
paying status in its history.

158
3. REINSURANCE MARKET CONDITIONS
Record Global Catastrophes Activity is
Pressuring Pricing
158
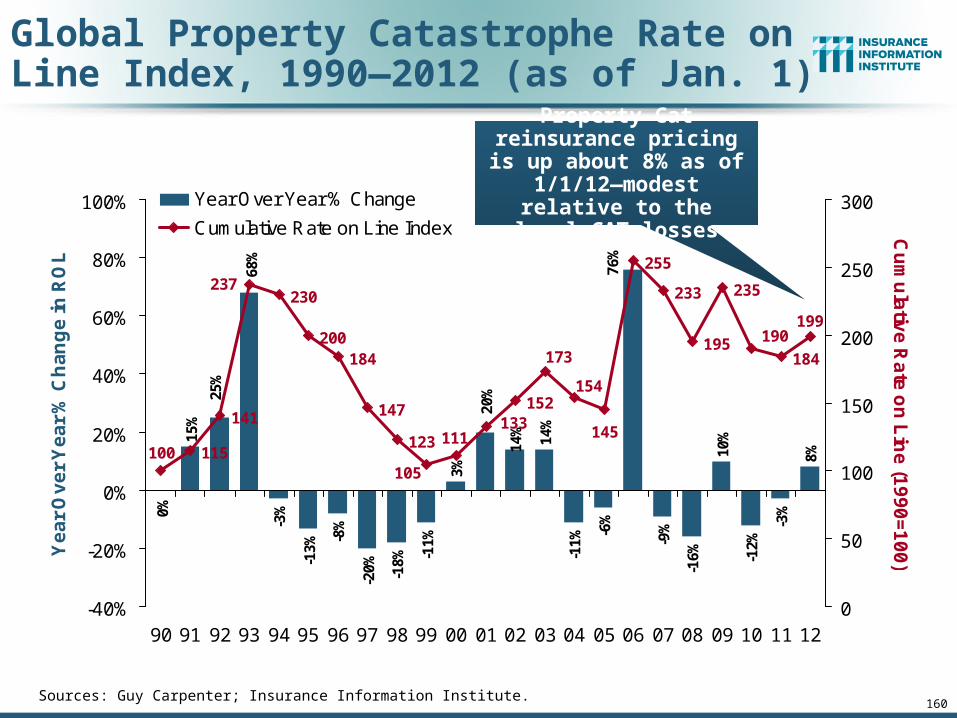
160
Global Property Catastrophe Rate on Line Index, 1990—2012 (as of Jan. 1)
15%
-3%
-13%
-8%
-20% -18% -1
1%
3%
14%
-11%
-6%
-9%
-16%
10%
-12%
-3%
8%
14%
76%
68%
25%
20%
0%
115
141
230
200184
147
123
152
255
233
195
235
184
199
133111
105
237
100
154
173
145
190
-40%
-20%
0%
20%
40%
60%
80%
100%
90 91 92 93 94 95 96 97 98 99 00 01 02 03 04 05 06 07 08 09 10 11 12
Ye
ar
Ov
er
Ye
ar
% C
ha
ng
e in
RO
L
0
50
100
150
200
250
300
Cu
mu
lativ
e R
ate
on
Lin
e (1
99
0=
10
0)
Year Over Year % Change
Cumulative Rate on Line Index
Sources: Guy Carpenter; Insurance Information Institute.
Property-Cat reinsurance pricing is up about 8% as of 1/1/12—modest relative
to the level CAT losses

4. RENEWED PRICING DISCIPLINE
162
Is There Evidence of a Broad and Sustained Shift in Pricing?
162
164
-5%
0%
5%
10%
15%
20%
25%
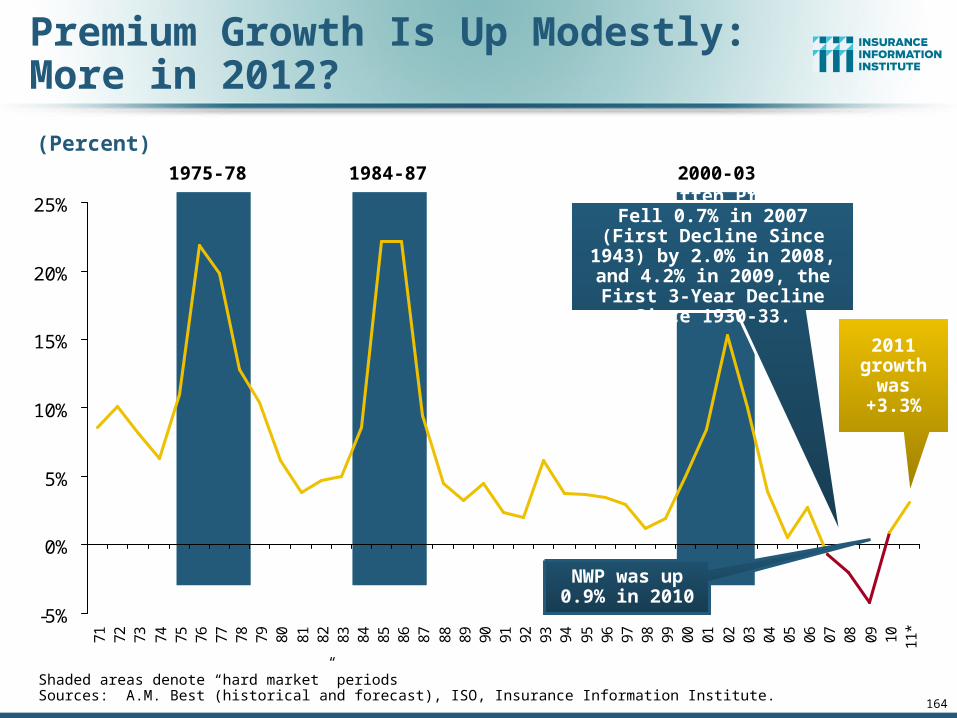
71 72 73 74 75 76 77 78 79 80 81 82 83 84 85 86 87 88 89 90 91 92 93 94 95 96 97 98 99 00 01 02 03 04 05 06 07 08 09 10 11*
Premium Growth Is Up Modestly: More in 2012?
(Percent)1975-78 1984-87 2000-03
Shaded areas denote “hard market” periodsSources: A.M. Best (historical and forecast), ISO, Insurance Information Institute.
Net Written Premiums Fell 0.7% in 2007 (First Decline
Since 1943) by 2.0% in 2008, and 4.2% in 2009, the First 3-Year Decline Since 1930-33.
NWP was up 0.9% in 2010
2011 growth
was +3.3%
165
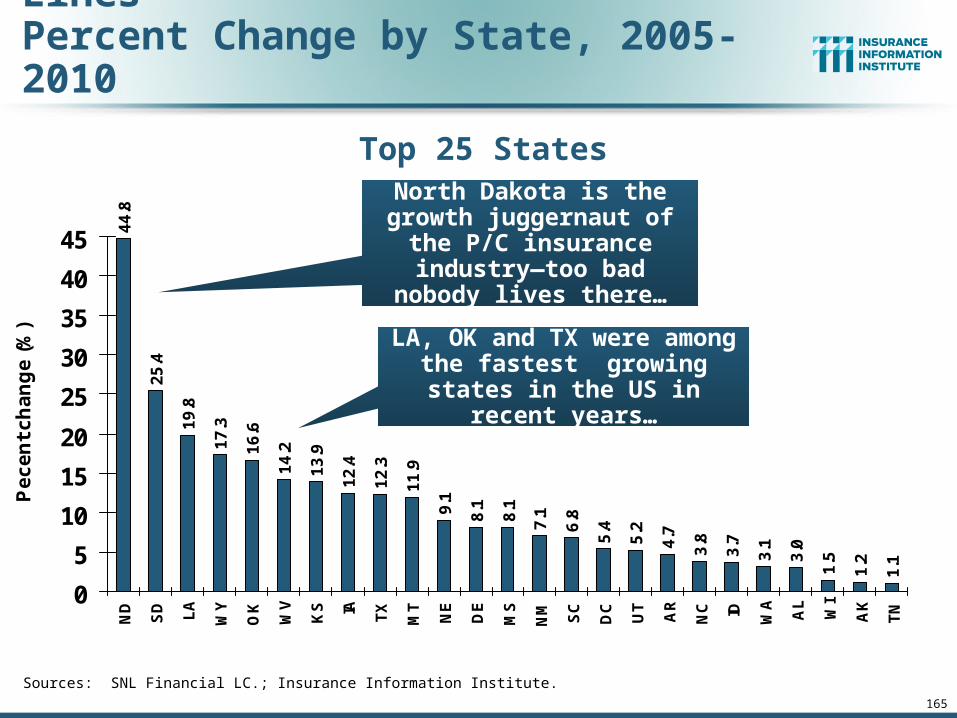
Direct Premiums Written: All P/C Lines Percent Change by State, 2005-2010
44
.8
25
.4
19
.8
17
.3
16
.6
14
.2
13
.9
12
.4
12
.3
11
.9
9.1
8.1
8.1
7.1
6.8
5.4
5.2
4.7
3.8
3.7
3.1
3.0
1.5
1.2
1.1
0
5
10
15
20
25
30
35
40
45
ND
SD LA
WY
OK
WV
KS IA TX
MT
NE
DE
MS
NM SC
DC
UT
AR
NC ID WA
AL
WI
AK
TN
Pe
ce
nt
ch
an
ge
(%
)
Sources: SNL Financial LC.; Insurance Information Institute.
Top 25 States
North Dakota is the growth juggernaut of the P/C
insurance industry—too bad nobody lives there…
LA, OK and TX were among the fastest growing states in
the US in recent years…
166
0.7
0.6
0.1
-0.1
-0.3
-0.5
-0.8
-1.4
-1.6
-1.7
-2.5
-2.8
-2.9
-3.4
-3.6
-4.1
-4.5
-4.7
-4.8
-5.7
-5.8
-8
-8.2
-8.3
-13
.5
-14
.2
-15
.5
-20
-15
-10
-5
0
5M
D
MO
KY IN NY
GA
MN
VA
US
PA
OR FL IL CT
VT
OH RI
CO
NJ HI
ME
NH
MA
AZ
NV MI
CA
Pe
ce
nt
ch
an
ge
(%
)
Sources: SNL Financial LC; Insurance Information Institute.
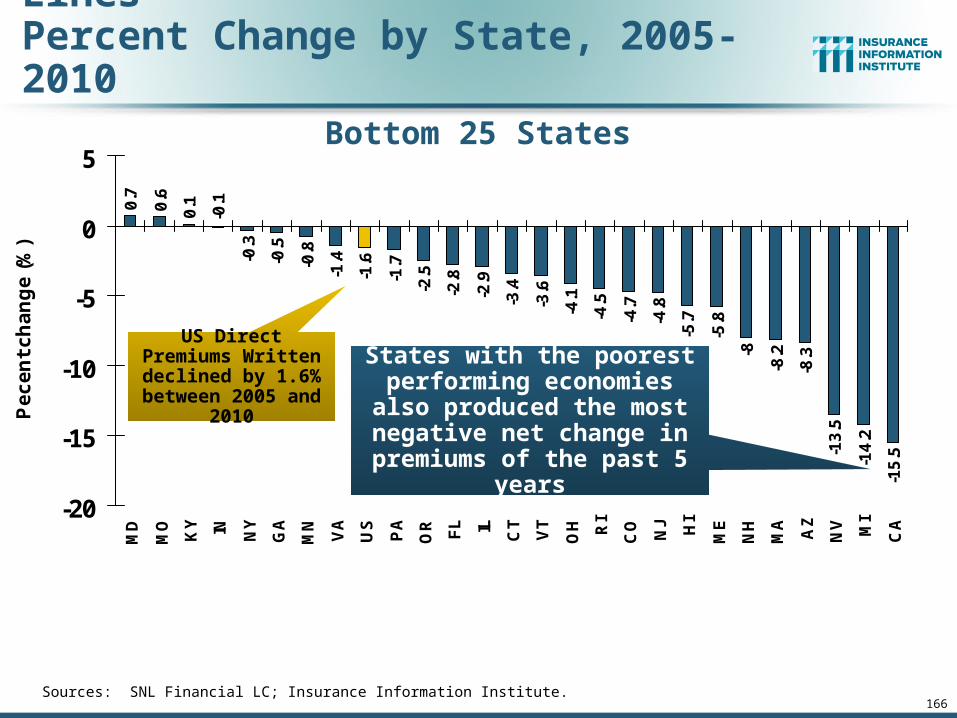
Bottom 25 States
States with the poorest performing economies also produced the most negative net change in premiums of
the past 5 years
Direct Premiums Written: All P/C Lines Percent Change by State, 2005-2010
US Direct Premiums Written declined by 1.6% between 2005
and 2010

170
Average Commercial Rate Change,All Lines, (1Q:2004–1Q:2012)
-3.2
%-5
.9%
-7.0
%-9
.4%
-9.7
%-8
.2%
-4.6
% -2.7
%-3
.0%
-5.3
%-9
.6%
-11
.3%
-11
.8%
-13
.3%
-12
.0%
-13
.5%
-12
.9%
-11
.0%
-6.4
%-5
.1%
-4.9
%-5
.8%
-5.6
%-5
.3%
-6.4
%-5
.2%
-5.4
% -2.9
%
2.7
% 4.4
%
-0.1
% 0.9
%
-0.1
%
-16%
-11%
-6%
-1%
4%
9%
1Q
04
2Q
04
3Q
04
4Q
04
1Q
05
2Q
05
3Q
05
4Q
05
1Q
06
2Q
06
3Q
06
4Q
06
1Q
07
2Q
07
3Q
07
4Q
07
1Q
08
2Q
08
3Q
08
4Q
08
1Q
09
2Q
09
3Q
09
4Q
09
1Q
10
2Q
10
3Q
10
4Q
10
1Q
11
2Q
11
3Q
11
4Q
11
1Q
12
Source: Council of Insurance Agents & Brokers (1Q04-4Q11); Insurance Information Institute
KRW Effect
Pricing as of Q1:2012 was positive for only the third time since 2003. Slightly
stronger gains in Q4.
(Percent)
Q2 2011 marked the 30th consecutive quarter of price
declines

171
Change in Commercial Rate Renewals, by Account Size: 1999:Q4 to 2012:Q1
Source: Council of Insurance Agents and Brokers; Barclay’s Capital; Insurance Information Institute.
Percentage Change (%)
Trough = 2007:Q3 -13.6%
Pricing Turned Negative in Early
2004 and Remained that
way for 7 ½ years
Peak = 2001:Q4 +28.5%
KRW : No Lasting Impact
Pricing turned positive in Q3:2011, the first increase in
nearly 8 years; Q1:2012 renewals were up 4.4%

173
Change in Commercial Rate Renewals, by Line: 2012:Q1
Source: Council of Insurance Agents and Brokers; Insurance Information Institute.
Major Commercial Lines Renewed Uniformly Upward in Q1:2012 for Only the Third Time Since 2003; Property Lines &
Workers Comp Leading the Way
Percentage Change (%)
3.8% 4.0% 4.0%
6.5%
7.4%
0.8%
2.0%
3.1% 3.1% 3.3% 3.6%
0.0%
1.0%
2.0%
3.0%
4.0%
5.0%
6.0%
7.0%
8.0%
Su
rety
EP
L
Co
mm
l Au
to
Ge
ne
ral
Lia
bili
ty
Um
bre
lla
D&
O
Co
nst
ruct
ion
EP
L
Bu
s.In
terr
up
tion
Co
mm
erc
ial
Pro
pe
rty
Wo
rke
rsC
om
p
Workers Comp rate increases are large than any other line, followed
by Property lines

INVESTMENTS: THE NEW REALITY
192
Investment Performance is a Key Driver of Profitability
Does It Influence Underwriting or Cyclicality?
192

Property/Casualty Insurance Industry Investment Income: 2000–2013F1
$38.9$37.1 $36.7
$38.7
$54.6
$51.2
$47.1 $47.6$49.0
$45.5$46.4
$39.6
$49.5
$52.3
$30
$40
$50
$60
00 01 02 03 04 05 06 07 08 09 10 11 12F 13F
Investment Income in 2011 Was Surprisingly Strong, Though Investment Income Is Likely to Weaken in 2012 Due to Persistently Low Interest Rates
1 Investment gains consist primarily of interest and stock dividends.*2012F-201F based on Conning projections.Sources: ISO; Conning Research & Consulting; Insurance Information Institute.
($ Billions)
Investment earnings in 2011 were 10.3% below
their 2007 pre-crisis peak
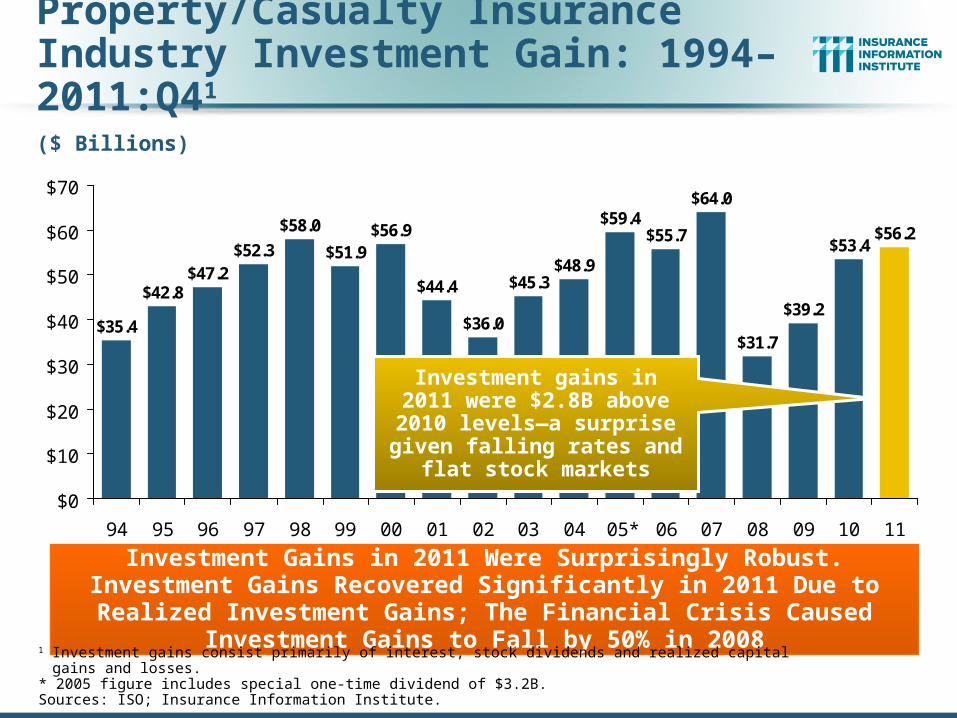
Property/Casualty Insurance Industry Investment Gain: 1994–2011:Q41
$35.4
$42.8$47.2
$52.3
$44.4
$36.0
$45.3$48.9
$59.4$55.7
$64.0
$31.7
$39.2
$53.4$56.2$58.0
$51.9$56.9
$0
$10
$20
$30
$40
$50
$60
$70
94 95 96 97 98 99 00 01 02 03 04 05* 06 07 08 09 10 11
Investment Gains in 2011 Were Surprisingly Robust. Investment Gains Recovered Significantly in 2011 Due to Realized Investment Gains; The
Financial Crisis Caused Investment Gains to Fall by 50% in 2008
1 Investment gains consist primarily of interest, stock dividends and realized capital gains and losses.* 2005 figure includes special one-time dividend of $3.2B.Sources: ISO; Insurance Information Institute.
($ Billions)
Investment gains in 2011 were $2.8B above 2010 levels—a surprise given falling rates
and flat stock markets

197
U.S. 10-Year Treasury Note Yields:A Long Downward Trend, 1990–2012*
*Monthly, through May 25, 2012. Note: Recessions indicated by gray shaded columns.Sources: Federal Reserve Bank at http://www.federalreserve.gov/releases/h15/data.htm. National Bureau of Economic Research (recession dates); Insurance Information Institutes.
1%
2%
3%
4%
5%
6%
7%
8%
9%
'90 '91 '92 '93 '94 '95 '96 '97 '98 '99 '00 '01 '02 '03 '04 '05 '06 '07 '08 '09 '10 '11 '12
Yields on 10-Year U.S. Treasury Notes have been essentially
below 5% for nearly a decade.
Since roughly 80% of P/C bond/cash investments are in 10-year or shorter durations, most P/C insurer portfolios will have low-yielding bonds for years to come.
Yields on 10-Year U.S. Treasury Notes have
been essentially below 4% since January 2008.
197

199
-1.8
%
-1.8
%
-2.0
%
-3.6
%
-3.3
%
-3.3
%
-3.7
%
-4.3
%
-5.2
%
-5.7
%
-7.3%
-1.9
%
-2.1
%
-3.1
%
-8%-7%-6%-5%-4%-3%-2%-1%0%
Perso
nal L
ines
Pvt Pass
Aut
o
Pers P
rop
Comm
ercia
l
Comm
l Auto
Credit
Comm
Pro
p
Comm
Cas
Fidelity
/Sure
ty
Warra
nty
Surplu
s Line
s
Med
Mal
WC
Reinsu
rance
**
Lower Investment Earnings Place a Greater Burden on Underwriting and Pricing Discipline
*Based on 2008 Invested Assets and Earned Premiums**US domestic reinsurance onlySource: A.M. Best; Insurance Information Institute.
Reduction in Combined Ratio Necessary to Offset 1% Decline in Investment Yield to Maintain Constant ROE, by Line*
199

Inflation
206
Is it a Threat to Claim Cost Severities
206
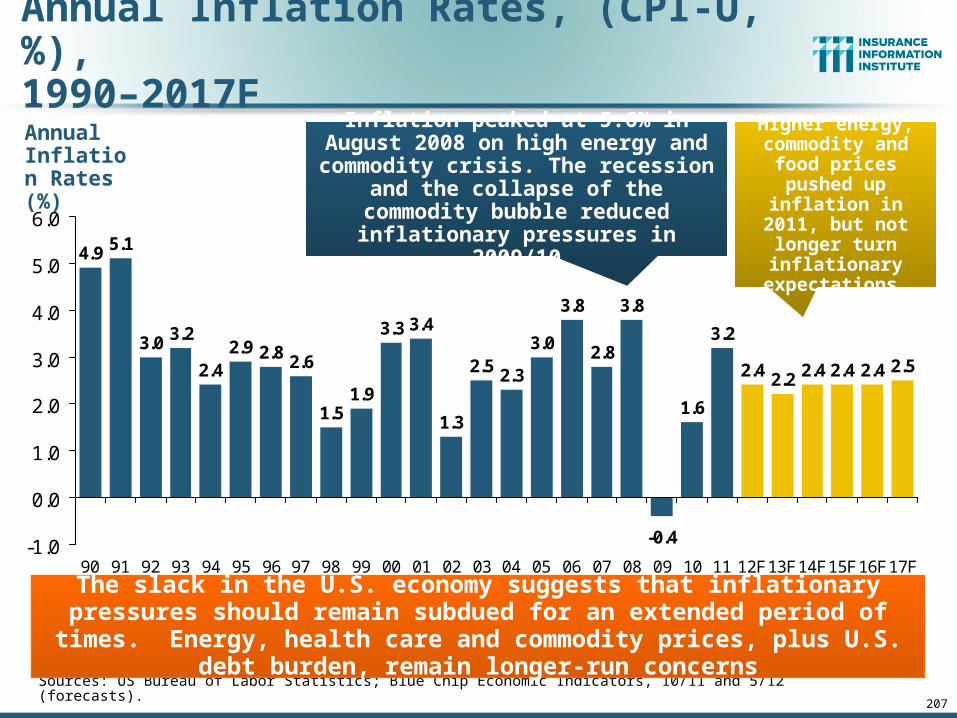
207
Annual Inflation Rates, (CPI-U, %),1990–2017F
2.8 2.6
1.51.9
3.3 3.4
1.3
2.5 2.3
3.0
3.8
2.8
3.8
-0.4
1.6
3.2
2.4 2.2 2.4 2.4 2.4 2.52.9
2.4
3.23.0
5.14.9
-1.0
0.0
1.0
2.0
3.0
4.0
5.0
6.0
90 91 92 93 94 95 96 97 98 99 00 01 02 03 04 05 06 07 08 09 10 11 12F13F14F15F16F17F
Sources: US Bureau of Labor Statistics; Blue Chip Economic Indicators, 10/11 and 5/12 (forecasts).
The slack in the U.S. economy suggests that inflationary pressures should remain subdued for an extended period of times. Energy, health care and
commodity prices, plus U.S. debt burden, remain longer-run concerns
Annual Inflation Rates (%)
Inflation peaked at 5.6% in August 2008 on high energy and commodity crisis. The recession and the collapse of the
commodity bubble reduced inflationary pressures in 2009/10
Higher energy, commodity and food
prices pushed up inflation in 2011, but
not longer turn inflationary
expectations.

P/C Personal Insurance Claim Cost Drivers Grow Faster Than the Core CPI Suggests
Sources: Bureau of Labor Statistics; Insurance Information Institute.
3.2%
1.7%
6.8%
5.1%
4.2%
3.0% 3.2%
5.0%
7.1%
0%
2%
4%
6%
8%
Overall CPI "Core" CPI InpatientHospitalServices
OutpatientHospitalServices
PrescriptionDrugs
Medical CareCommodities
LegalServices
Motor VehicleParts &
Equipment
ResidentialMaint. &Repair
Healthcare costs are a major liability, med pay, and PIP claim cost driver. They are likely to grow faster than the CPI for the next few years, at least
208
Excludes Food and Energy
Price Level Change: 2011 vs. 2010
208

www.iii.org
Thank you for your timeand your attention!
Twitter: twitter.com/bob_hartwigDownload at www.iii.org/presentations
Insurance Information Institute Online:
211
Related Documents