This article appeared in a journal published by Elsevier. The attached copy is furnished to the author for internal non-commercial research and education use, including for instruction at the authors institution and sharing with colleagues. Other uses, including reproduction and distribution, or selling or licensing copies, or posting to personal, institutional or third party websites are prohibited. In most cases authors are permitted to post their version of the article (e.g. in Word or Tex form) to their personal website or institutional repository. Authors requiring further information regarding Elsevier’s archiving and manuscript policies are encouraged to visit: http://www.elsevier.com/copyright

Welcome message from author
This document is posted to help you gain knowledge. Please leave a comment to let me know what you think about it! Share it to your friends and learn new things together.
Transcript
This article appeared in a journal published by Elsevier. The attachedcopy is furnished to the author for internal non-commercial researchand education use, including for instruction at the authors institution
and sharing with colleagues.
Other uses, including reproduction and distribution, or selling orlicensing copies, or posting to personal, institutional or third party
websites are prohibited.
In most cases authors are permitted to post their version of thearticle (e.g. in Word or Tex form) to their personal website orinstitutional repository. Authors requiring further information
regarding Elsevier’s archiving and manuscript policies areencouraged to visit:
http://www.elsevier.com/copyright
Author's personal copy
An in situ small angle neutron scattering study of expandedgraphite under a uniaxial stress
Felix Balima a, Vittoria Pischedda a, Sylvie Le Floch a, Annie Brulet b, Peter Lindner c,Laurent Duclaux d, Alfonso San-Miguel a,*
a Institut Lumiere Matiere, UMR5306 Universite Lyon 1-CNRS, Universite de Lyon, 69622 Villeurbanne Cedex, Franceb Laboratoire Leon Brillouin, UMR12 CEA-CNRS, CEA-Saclay, 91191 Gif-sur-Yvette Cedex, Francec Institut Max von Laue–Paul Langevin, 38042 Grenoble Cedex, Franced LCME, Universite de Savoie, 73376 Le Bourget du Lac Cedex, France
A R T I C L E I N F O
Article history:
Received 18 September 2012
Accepted 5 February 2013
Available online 12 February 2013
A B S T R A C T
The present article studies the in situ evolution of the pore structure of compressed
expanded graphite under a uniaxial stress up to 1000 bar using small-angle neutron scat-
tering (SANS). The uniaxial stress was applied in the direction of the average c-axis of
the graphite crystallites composing the sample. Ex situ characterization by electrical resis-
tivity and mercury intrusion porosimetry was performed on the compressed samples. The
anisotropic SANS pattern indicates the presence of spheroidal pores in the 4–100 nm
detectable range. The stress dependence of the different extractable parameters (fractal
dimension, apparent specific surface area and apparent porosity) was related to the meso
and macro pore structure evolution. In particular, the fractal dimension increases irrevers-
ibly with the applied stress. We propose a model of evolution under uniaxial load in which
the irreversible collapse and splitting of larger pores into smaller size ones provides a
coherent description of the experimental observations.
� 2013 Elsevier Ltd. All rights reserved.
1. Introduction
Expanded graphite is obtained by submitting intercalated
graphite to a thermal shock [1]. This shock leads to the sud-
den volatilization of the intercalated compounds, forcing
apart the lattice graphite planes. A kind of black snow made
of pure graphite worms is recovered. Expanded graphite is
therefore characterized by long-range disorder, preserving
nevertheless an important degree of crystallinity, and a high
degree of porosity at the meso and macro scale (from a few
to hundreds nanometres). Expanded graphite retains the
lamellar structure of graphite and can exhibit high porosity
(up to 99%) [1].
Expanded graphite is often used in its compressed form,
obtained from a binderless compression of expanded graphite
worm-like particles and known as flexible graphite. Flexible
graphite has a higher degree of preferentially oriented crystal-
lites and lower porosity (less than 70%) than raw expanded
graphite. Flexible graphite of density 1 g cm�3 shows a large
asymmetric distribution of pore size, with its peak at
250 nm [2]. The high and controllable porosity of flexible
graphite confers many interesting mechanical properties:
resilience, high compressibility and elastic recovery as well
as chemical resistance and good thermal and electrical con-
duction in the in-plane direction. This has led to numerous
industrial uses such as sealing gaskets, heating elements,
adsorbents, lubricants or electrochemical support in a wide
range of applicative domains as diverse as the nuclear indus-
try and food processing [1,3–6].
Several theoretical and experimental studies have exam-
ined the correlation of such parameters as pore distribution
or the fractal dimension of the pore–matrix interface, to mac-
0008-6223/$ - see front matter � 2013 Elsevier Ltd. All rights reserved.http://dx.doi.org/10.1016/j.carbon.2013.02.019
* Corresponding author: Fax: +33 472432648.E-mail addresses: [email protected], [email protected] (A. San-Miguel).
C A R B O N 5 7 ( 2 0 1 3 ) 4 6 0 – 4 6 9
Avai lab le at www.sc iencedi rect .com
journal homepage: www.elsev ier .com/ locate /carbon
Author's personal copy
roscopic features such as permeability [7,8], mechanical or
electrochemical properties [9,10].
As many industrial applications entail static or dynamic stress
(sealing, vibration damping or absorption in pressurized media),
the effect of mechanical stress on porosity is a topical subject.
The change in porosity after compaction and release, and the
influence of this change on sample properties, were studied by
Celzard [5]. However, the evolution of macro–meso pore structure
during the application of stress conditions was not examined.
In this work we study compressed expanded graphite un-
der uniaxial mechanical load by small angle neutron scatter-
ing to probe the in situ evolution of its pore structure under
compression.
Among the methods used to investigate porous materials,
small angle neutron scattering (SANS) is a well-established
non-destructive technique [11–13]. It is well adapted for prob-
ing both open and closed porosity [14], and for characterizing
pore morphology as well as the fractal nature of the pore-ma-
trix interface [12,14–16]. SANS has been used to investigate
the porous structure of raw expanded graphite [6] and flexible
graphite [17] with the fractal dimension being a key parame-
ter for data interpretation [18].
The aim of our study is to further the understanding of the
relationship between the evolution of porosity under
mechanical load on one hand, and the macroscopic proper-
ties of the material such as elastic parameters on the other
hand. From an applied point of view, the knowledge gained
of the relationship between pore structure and physical
parameters should help to optimize the design of new mate-
rials, surpassing for instance the current thermodynamic or
elastic conditions of use of expanded graphite.
2. Sample description and compression
Our Compressed Expanded Graphite (CEG) samples were made
by stacking several flexible graphite sheets 1 mm thick of
0.9 g cm�3 density and 60% porosity. Flexible graphite (pur-
chased from MERSEN France) is obtained from a mixture of nat-
ural flakes of graphite mixed with concentrated nitric and
sulphuric acids, leading to the formation of a graphite interca-
lation compound. After washing and drying, the intercalated
system is exfoliated by thermal shock at 900–1000 �C. The exfo-
liated graphite is then compressed to reach the desired porosity
(about 60%) by taking a skeletal density of 2.23 g cm�3. Mea-
surements of open porosity by mercury intrusion on our sam-
ples give a mean pore size of 270 ± 30 nm.
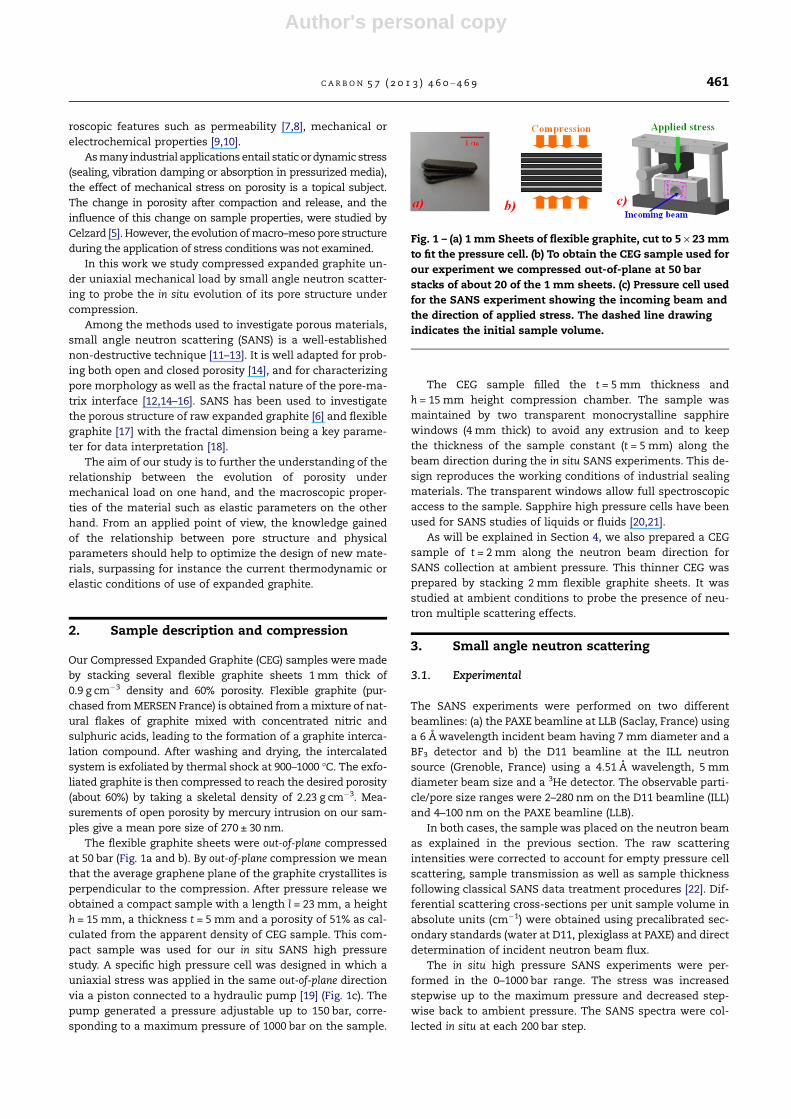
The flexible graphite sheets were out-of-plane compressed
at 50 bar (Fig. 1a and b). By out-of-plane compression we mean
that the average graphene plane of the graphite crystallites is
perpendicular to the compression. After pressure release we
obtained a compact sample with a length l = 23 mm, a height
h = 15 mm, a thickness t = 5 mm and a porosity of 51% as cal-
culated from the apparent density of CEG sample. This com-
pact sample was used for our in situ SANS high pressure
study. A specific high pressure cell was designed in which a
uniaxial stress was applied in the same out-of-plane direction
via a piston connected to a hydraulic pump [19] (Fig. 1c). The
pump generated a pressure adjustable up to 150 bar, corre-
sponding to a maximum pressure of 1000 bar on the sample.
The CEG sample filled the t = 5 mm thickness and
h = 15 mm height compression chamber. The sample was
maintained by two transparent monocrystalline sapphire
windows (4 mm thick) to avoid any extrusion and to keep
the thickness of the sample constant (t = 5 mm) along the
beam direction during the in situ SANS experiments. This de-
sign reproduces the working conditions of industrial sealing
materials. The transparent windows allow full spectroscopic
access to the sample. Sapphire high pressure cells have been
used for SANS studies of liquids or fluids [20,21].
As will be explained in Section 4, we also prepared a CEG
sample of t = 2 mm along the neutron beam direction for
SANS collection at ambient pressure. This thinner CEG was
prepared by stacking 2 mm flexible graphite sheets. It was
studied at ambient conditions to probe the presence of neu-
tron multiple scattering effects.
3. Small angle neutron scattering
3.1. Experimental
The SANS experiments were performed on two different
beamlines: (a) the PAXE beamline at LLB (Saclay, France) using
a 6 A wavelength incident beam having 7 mm diameter and a
BF3 detector and b) the D11 beamline at the ILL neutron
source (Grenoble, France) using a 4.51 A wavelength, 5 mm
diameter beam size and a 3He detector. The observable parti-
cle/pore size ranges were 2–280 nm on the D11 beamline (ILL)
and 4–100 nm on the PAXE beamline (LLB).
In both cases, the sample was placed on the neutron beam
as explained in the previous section. The raw scattering
intensities were corrected to account for empty pressure cell
scattering, sample transmission as well as sample thickness
following classical SANS data treatment procedures [22]. Dif-
ferential scattering cross-sections per unit sample volume in
absolute units (cm�1) were obtained using precalibrated sec-
ondary standards (water at D11, plexiglass at PAXE) and direct
determination of incident neutron beam flux.
The in situ high pressure SANS experiments were per-
formed in the 0–1000 bar range. The stress was increased
stepwise up to the maximum pressure and decreased step-
wise back to ambient pressure. The SANS spectra were col-
lected in situ at each 200 bar step.
Fig. 1 – (a) 1 mm Sheets of flexible graphite, cut to 5 · 23 mm
to fit the pressure cell. (b) To obtain the CEG sample used for
our experiment we compressed out-of-plane at 50 bar
stacks of about 20 of the 1 mm sheets. (c) Pressure cell used
for the SANS experiment showing the incoming beam and
the direction of applied stress. The dashed line drawing
indicates the initial sample volume.
C A R B O N 5 7 ( 2 0 1 3 ) 4 6 0 – 4 6 9 461
Author's personal copy
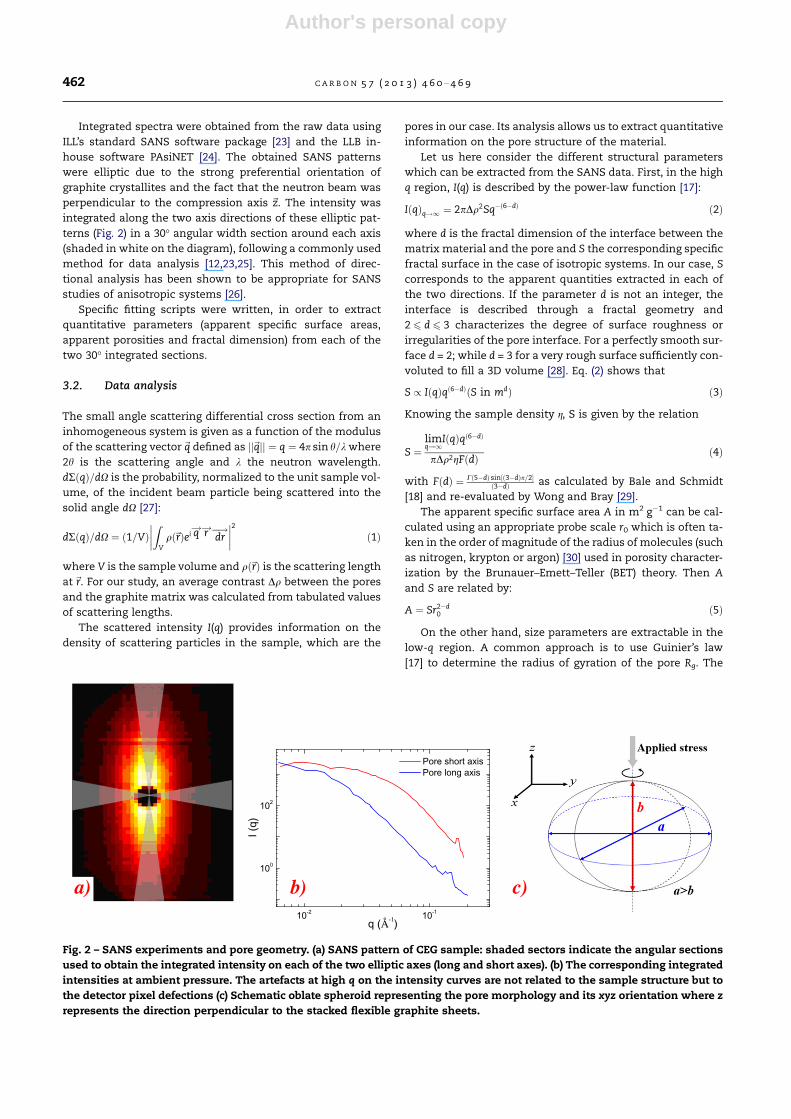
Integrated spectra were obtained from the raw data using
ILL’s standard SANS software package [23] and the LLB in-
house software PAsiNET [24]. The obtained SANS patterns
were elliptic due to the strong preferential orientation of
graphite crystallites and the fact that the neutron beam was
perpendicular to the compression axis ~z. The intensity was
integrated along the two axis directions of these elliptic pat-
terns (Fig. 2) in a 30� angular width section around each axis
(shaded in white on the diagram), following a commonly used
method for data analysis [12,23,25]. This method of direc-
tional analysis has been shown to be appropriate for SANS
studies of anisotropic systems [26].
Specific fitting scripts were written, in order to extract
quantitative parameters (apparent specific surface areas,
apparent porosities and fractal dimension) from each of the
two 30� integrated sections.
3.2. Data analysis
The small angle scattering differential cross section from an
inhomogeneous system is given as a function of the modulus
of the scattering vector~q defined as jj~qjj ¼ q ¼ 4p sin h=k where
2h is the scattering angle and k the neutron wavelength.
dRðqÞ=dX is the probability, normalized to the unit sample vol-
ume, of the incident beam particle being scattered into the
solid angle dX [27]:
dRðqÞ=dX ¼ ð1=VÞZ
V
qð~rÞei q! r! dr�!��������2
ð1Þ
where V is the sample volume and qð~rÞ is the scattering length
at~r. For our study, an average contrast Dq between the pores
and the graphite matrix was calculated from tabulated values
of scattering lengths.
The scattered intensity I(q) provides information on the
density of scattering particles in the sample, which are the
pores in our case. Its analysis allows us to extract quantitative
information on the pore structure of the material.
Let us here consider the different structural parameters
which can be extracted from the SANS data. First, in the high
q region, I(q) is described by the power-law function [17]:
IðqÞq!1 ¼ 2pDq2Sq�ð6�dÞ ð2Þ
where d is the fractal dimension of the interface between the
matrix material and the pore and S the corresponding specific
fractal surface in the case of isotropic systems. In our case, S
corresponds to the apparent quantities extracted in each of
the two directions. If the parameter d is not an integer, the
interface is described through a fractal geometry and
2 6 d 6 3 characterizes the degree of surface roughness or
irregularities of the pore interface. For a perfectly smooth sur-
face d = 2; while d = 3 for a very rough surface sufficiently con-
voluted to fill a 3D volume [28]. Eq. (2) shows that
S / IðqÞqð6�dÞðS in mdÞ ð3Þ
Knowing the sample density g, S is given by the relation
S ¼limq!1
IðqÞqð6�dÞ
pDq2gFðdÞ ð4Þ
with FðdÞ ¼ Cð5�dÞ sin½ð3�dÞp=2�ð3�dÞ as calculated by Bale and Schmidt
[18] and re-evaluated by Wong and Bray [29].
The apparent specific surface area A in m2 g�1 can be cal-
culated using an appropriate probe scale r0 which is often ta-
ken in the order of magnitude of the radius of molecules (such
as nitrogen, krypton or argon) [30] used in porosity character-
ization by the Brunauer–Emett–Teller (BET) theory. Then A
and S are related by:
A ¼ Sr2�d0 ð5Þ
On the other hand, size parameters are extractable in the
low-q region. A common approach is to use Guinier’s law
[17] to determine the radius of gyration of the pore Rg. The
10-2 10-1
100
102
Pore short axis Pore long axis
I (q)
q (Å-1)
a) b) c)
Fig. 2 – SANS experiments and pore geometry. (a) SANS pattern of CEG sample: shaded sectors indicate the angular sections
used to obtain the integrated intensity on each of the two elliptic axes (long and short axes). (b) The corresponding integrated
intensities at ambient pressure. The artefacts at high q on the intensity curves are not related to the sample structure but to
the detector pixel defections (c) Schematic oblate spheroid representing the pore morphology and its xyz orientation where z
represents the direction perpendicular to the stacked flexible graphite sheets.
462 C A R B O N 5 7 ( 2 0 1 3 ) 4 6 0 – 4 6 9
Author's personal copy
condition qRg�1 should be valid in the experimental low-q
domain. For a random two-phase system, the Debye model
[31] is adapted to determine the correlation length n in the
intermediate q domain. Obviously, our system is not random
due to its anisotropy. However, we may use this model by
introducing different correlation lengths for each of the two
axes [32].
Finally, the void volume fraction u (porosity) for a random
two-phase system can be determined by integrating the
quantity I(q)q2 over the whole range of q, leading to the Por-
od’s invariant:
Q ¼Z 1
0
q2IðqÞdq ¼ 2p2Dq2uð1� uÞ ð6Þ
The apparent Porod’s invariants were calculated using the
integrated intensities on the two axis directions.
In the case of huge scattering, the multiple scattering phe-
nomenon (MS) likely occurs. While single scattering can be
treated as a random phenomenon, MS is usually more deter-
ministic. The models proposed above cannot be applied if MS
dominates the total scattering data. As will be discussed later,
MS was present in our data, but it was still possible to extract
reliable information from the SANS data.
4. Results and discussion
The experimental anisotropic SANS patterns of CEG sample
suggests the presence of non spherical pores within the
graphite matrix at ambient pressure. Thus, we modelled the
pores with a spheroid, whose axes are inverted compared to
the 2D pattern in the reciprocal space. Fig. 2c describes the
pore shape in a ~x ~y ~z basis where z is the direction of the ap-
plied load, x or y the direction of the incident beam. The short
axis, b, of the oblate spheroid coincides with the ~z direction
and the long axis, a, belongs to the xy plane. Following the
averaging method explained in Section 3, the spheroid sur-
face corresponding to a 30� solid angle around each axis
was assumed to be spherical. As in previous studies on aniso-
tropic materials [33,34] we observe a partial internal pore sur-
face (the extracted apparent surface).
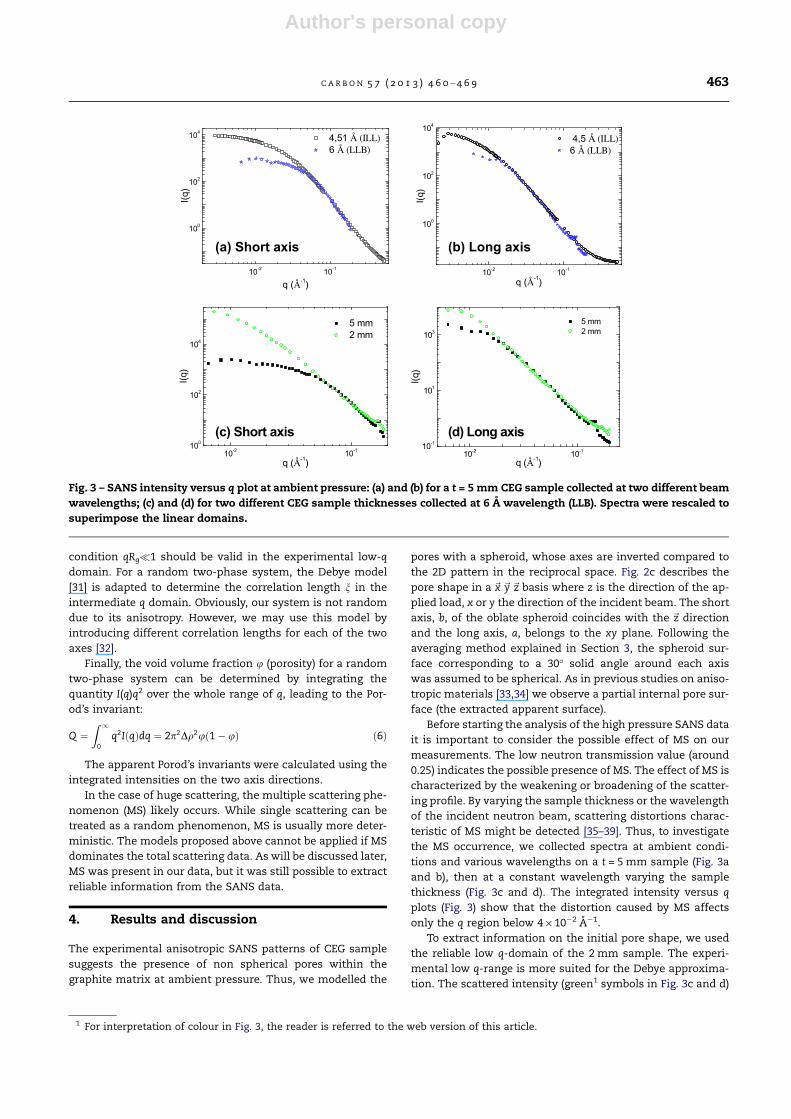
Before starting the analysis of the high pressure SANS data
it is important to consider the possible effect of MS on our
measurements. The low neutron transmission value (around
0.25) indicates the possible presence of MS. The effect of MS is
characterized by the weakening or broadening of the scatter-
ing profile. By varying the sample thickness or the wavelength
of the incident neutron beam, scattering distortions charac-
teristic of MS might be detected [35–39]. Thus, to investigate
the MS occurrence, we collected spectra at ambient condi-
tions and various wavelengths on a t = 5 mm sample (Fig. 3a
and b), then at a constant wavelength varying the sample
thickness (Fig. 3c and d). The integrated intensity versus q
plots (Fig. 3) show that the distortion caused by MS affects
only the q region below 4 · 10�2 A�1.
To extract information on the initial pore shape, we used
the reliable low q-domain of the 2 mm sample. The experi-
mental low q-range is more suited for the Debye approxima-
tion. The scattered intensity (green1 symbols in Fig. 3c and d)
10-2 10-110-1
101
103
5 mm 2 mm
I(q)
q (Å-1)
(d) Long axis10-2 10-1
100
102
104
5 mm 2 mm
I(q)
q (Å-1)
(c) Short axis
10-2 10-1
100
102
104 4,51 Å (ILL) 6 Å (LLB)
I(q)
q (Å-1)
(a) Short axis
10-2 10-1
100
102
104
4,5 Å (ILL)6 Å (LLB)
I(q)
q (Å-1)
(b) Long axis
Fig. 3 – SANS intensity versus q plot at ambient pressure: (a) and (b) for a t = 5 mm CEG sample collected at two different beam
wavelengths; (c) and (d) for two different CEG sample thicknesses collected at 6 A wavelength (LLB). Spectra were rescaled to
superimpose the linear domains.
1 For interpretation of colour in Fig. 3, the reader is referred to the web version of this article.
C A R B O N 5 7 ( 2 0 1 3 ) 4 6 0 – 4 6 9 463
Author's personal copy
can be fitted by the equation IðqÞ ¼ I0ð1þ q2n2Þ2. From the lin-
ear slope of I(q)�1/2 versus q2 plot, the correlation length was
estimated to be 105 ± 5 A along the short axis and 138 ± 5 A
along the long axis. This indicates a spheroid pore shape.
The low aspect ratio is probably due to the fact that the flex-
ible graphite sheets in the 2 mm sample were not pre-com-
pressed to 50 bar.
Let us consider now the effects of MS on the determination
both of the fractal dimension and of the pore volume fraction.
Fig. 4 shows the evolution of the integrated intensity versus q
for our CEG sample along the two pore axes at ambient pres-
sure, at 1000 bar and again at ambient pressure after
decompression.
The fractal dimension is extracted from the linear domain.
Fractal systems characterized by small angle scattering are
found to show a power law behaviour over at least one decade
in length scale [40–44,45]. However, Fig. 4 shows that the lin-
ear domain of our spectra for the t = 5 mm sample does not
exceed a decade. Nonetheless, the fractal nature of our sam-
ple is demonstrated by the fact that the linear domain for the
t = 2 mm sample (or for lower neutron wavelengths) extends
beyond one decade. The reduction of linear q-domain exten-
sion for the t = 5 mm samples must then be due to the effects
of MS. MS effects do not however alter the slope of the linear
domain from where the value of the fractal dimension is ob-
tained [36–38]. Due to the different preparation of the two
samples (the t = 5 mm sample was pre-compressed at 50 bar
whereas the t = 2 mm sample was not pre-compressed) a di-
rect confrontation of the fractal dimension values is not
possible.
To conclude the above discussion, the analysis of the lin-
ear q-domain of the t = 5 mm samples, even if restricted to
less than one decade, does allow us to extract reliable values
of the sample fractal dimension.
Let us now turn to the apparent porosity that can be ex-
tracted from Porod’s invariant Eq. (6). Given our data are af-
fected by MS from q = 0 to the highest measured value
(0.5 A�1), reliable absolute values in the 4–100 nm size range
cannot be extracted. We analyse only the partial and relative
evolution of the apparent porosity with stress. The volume
fraction is calculated from the two angular sections of Fig. 2
as mentioned above.
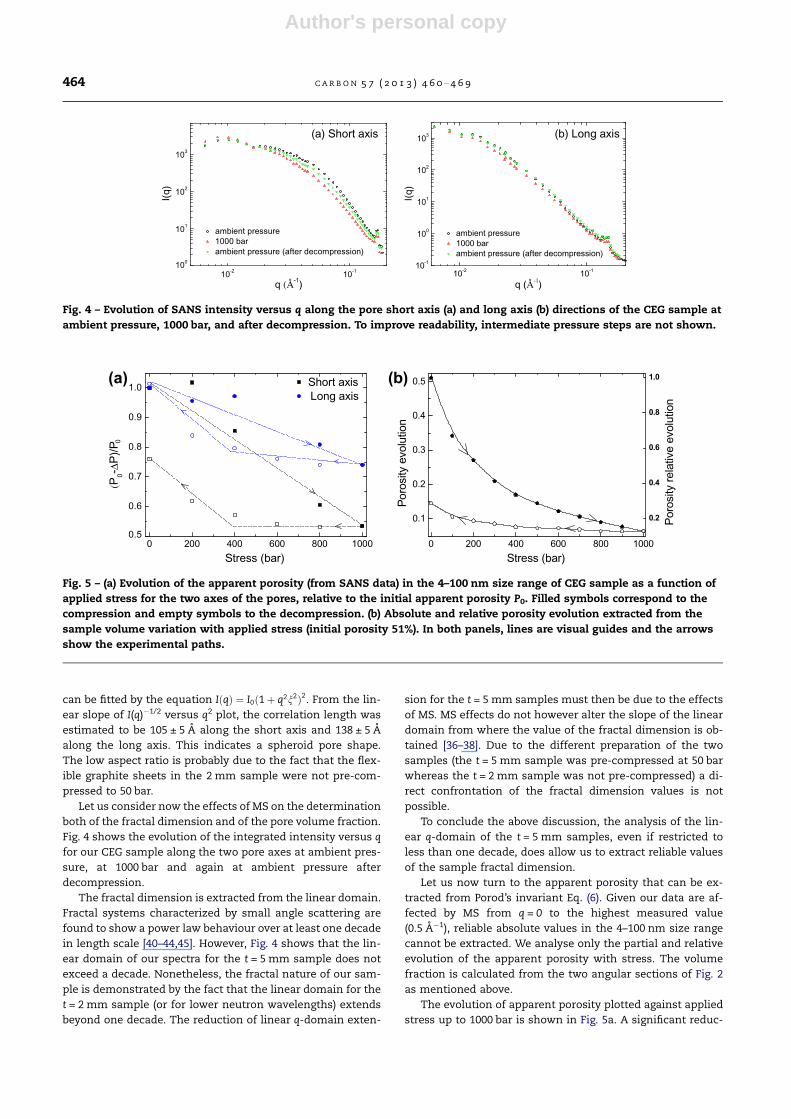
The evolution of apparent porosity plotted against applied
stress up to 1000 bar is shown in Fig. 5a. A significant reduc-
10-2 10-1100
101
102
103
ambient pressure 1000 bar ambient pressure (after decompression)
I(q)
q (Å-1)
(a) Short axis
10-2 10-110-1
100
101
102
103
ambient pressure 1000 bar ambient pressure (after decompression)
I(q)
q (Å-1)
(b) Long axis
Fig. 4 – Evolution of SANS intensity versus q along the pore short axis (a) and long axis (b) directions of the CEG sample at
ambient pressure, 1000 bar, and after decompression. To improve readability, intermediate pressure steps are not shown.
0 200 400 600 800 1000
0.1
0.2
0.3
0.4
0.5
0.2
0.4
0.6
0.8
1.0
Poro
sity
evo
lutio
n
Stress (bar)
Por
osity
rela
tive
evol
utio
n
(b)
0 200 400 600 800 10000.5
0.6
0.7
0.8
0.9
1.0 Short axis Long axis
(P0-Δ
P)/P
0
Stress (bar)
(a)
Fig. 5 – (a) Evolution of the apparent porosity (from SANS data) in the 4–100 nm size range of CEG sample as a function of
applied stress for the two axes of the pores, relative to the initial apparent porosity P0. Filled symbols correspond to the
compression and empty symbols to the decompression. (b) Absolute and relative porosity evolution extracted from the
sample volume variation with applied stress (initial porosity 51%). In both panels, lines are visual guides and the arrows
show the experimental paths.
464 C A R B O N 5 7 ( 2 0 1 3 ) 4 6 0 – 4 6 9
Author's personal copy
tion in porosity, close to 50%, is observed along the short pore
axis at 1000 bar. This loss is not fully recovered after the stress
is released (25% loss). Along the long pore axis, the reduction
in porosity is approximately 25% at 1000 bar but it is fully
recovered after the pressure cycle.
The evolution of total porosity under stress (Fig. 5b) was
obtained from the sample volume variation (calculated from
the piston displacement) under compression and during
decompression. The loss of total porosity is about 80% at
1000 bar and 70% after decompression. The comparison of
Fig. 5a and b shows that the global porosity reduction under
stress is higher than that in the 4–100 nm detectable range.
This could be due to a higher proportion of pores falling into
the detectable range with applied stress.
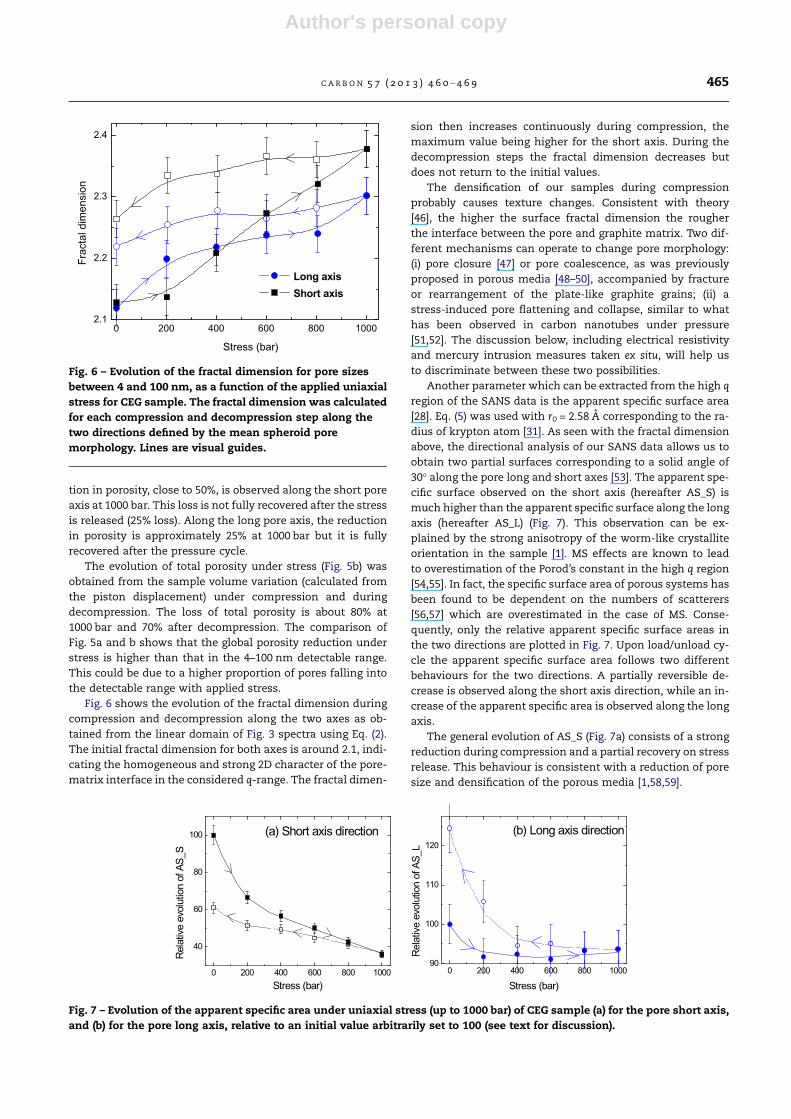
Fig. 6 shows the evolution of the fractal dimension during
compression and decompression along the two axes as ob-
tained from the linear domain of Fig. 3 spectra using Eq. (2).
The initial fractal dimension for both axes is around 2.1, indi-
cating the homogeneous and strong 2D character of the pore-
matrix interface in the considered q-range. The fractal dimen-
sion then increases continuously during compression, the
maximum value being higher for the short axis. During the
decompression steps the fractal dimension decreases but
does not return to the initial values.
The densification of our samples during compression
probably causes texture changes. Consistent with theory
[46], the higher the surface fractal dimension the rougher
the interface between the pore and graphite matrix. Two dif-
ferent mechanisms can operate to change pore morphology:
(i) pore closure [47] or pore coalescence, as was previously
proposed in porous media [48–50], accompanied by fracture
or rearrangement of the plate-like graphite grains; (ii) a
stress-induced pore flattening and collapse, similar to what
has been observed in carbon nanotubes under pressure
[51,52]. The discussion below, including electrical resistivity
and mercury intrusion measures taken ex situ, will help us
to discriminate between these two possibilities.
Another parameter which can be extracted from the high q
region of the SANS data is the apparent specific surface area
[28]. Eq. (5) was used with r0 = 2.58 A corresponding to the ra-
dius of krypton atom [31]. As seen with the fractal dimension
above, the directional analysis of our SANS data allows us to
obtain two partial surfaces corresponding to a solid angle of
30� along the pore long and short axes [53]. The apparent spe-
cific surface observed on the short axis (hereafter AS_S) is
much higher than the apparent specific surface along the long
axis (hereafter AS_L) (Fig. 7). This observation can be ex-
plained by the strong anisotropy of the worm-like crystallite
orientation in the sample [1]. MS effects are known to lead
to overestimation of the Porod’s constant in the high q region
[54,55]. In fact, the specific surface area of porous systems has
been found to be dependent on the numbers of scatterers
[56,57] which are overestimated in the case of MS. Conse-
quently, only the relative apparent specific surface areas in
the two directions are plotted in Fig. 7. Upon load/unload cy-
cle the apparent specific surface area follows two different
behaviours for the two directions. A partially reversible de-
crease is observed along the short axis direction, while an in-
crease of the apparent specific area is observed along the long
axis.
The general evolution of AS_S (Fig. 7a) consists of a strong
reduction during compression and a partial recovery on stress
release. This behaviour is consistent with a reduction of pore
size and densification of the porous media [1,58,59].
0 200 400 600 800 10002.1
2.2
2.3
2.4
Long axisShort axis
Frac
tal d
imen
sion
Stress (bar)
Fig. 6 – Evolution of the fractal dimension for pore sizes
between 4 and 100 nm, as a function of the applied uniaxial
stress for CEG sample. The fractal dimension was calculated
for each compression and decompression step along the
two directions defined by the mean spheroid pore
morphology. Lines are visual guides.
0 200 400 600 800 100090
100
110
120(b) Long axis direction
Rela
tive
evol
utio
n of
AS_
L
Stress (bar)0 200 400 600 800 1000
40
60
80
100
Rela
tive
evol
utio
n of
AS_
S
Stress (bar)
(a) Short axis direction
Fig. 7 – Evolution of the apparent specific area under uniaxial stress (up to 1000 bar) of CEG sample (a) for the pore short axis,
and (b) for the pore long axis, relative to an initial value arbitrarily set to 100 (see text for discussion).
C A R B O N 5 7 ( 2 0 1 3 ) 4 6 0 – 4 6 9 465
Author's personal copy
The evolution of AS_L (Fig. 7b) is more surprising: the area
remains practically constant under compression and in-
creases during decompression. The stability of AS_L during
compression suggests an additional contribution. In agree-
ment with our discussion of apparent porosity evolution
(Fig. 5a), this contribution can be due to a transfer of larger
pores inside the observable SANS size range. Its increase after
decompression indicates clearly the creation of new void-ma-
trix interfaces on the long axis.
A simple pore closure [47] or pore coalescence mechanism
under uniaxial compression as suggested by Bustin et al. [50]
are incompatible with the AS_L evolution (Fig. 7a).
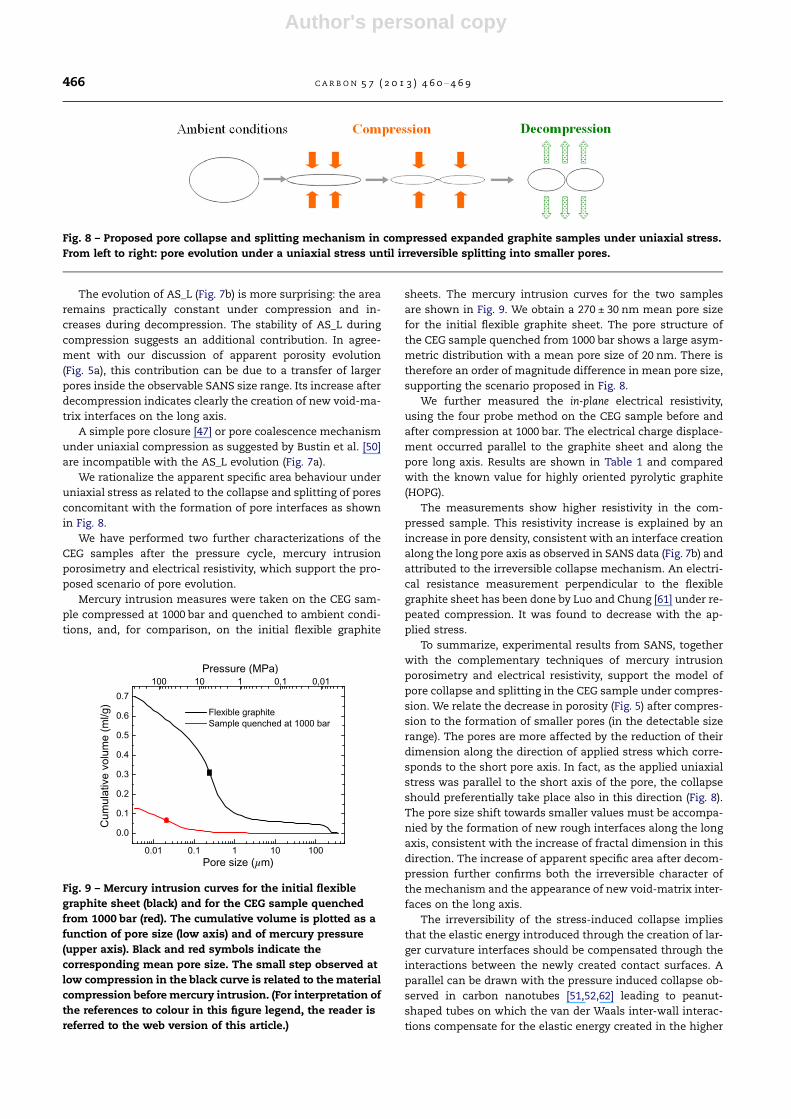
We rationalize the apparent specific area behaviour under
uniaxial stress as related to the collapse and splitting of pores
concomitant with the formation of pore interfaces as shown
in Fig. 8.
We have performed two further characterizations of the
CEG samples after the pressure cycle, mercury intrusion
porosimetry and electrical resistivity, which support the pro-
posed scenario of pore evolution.
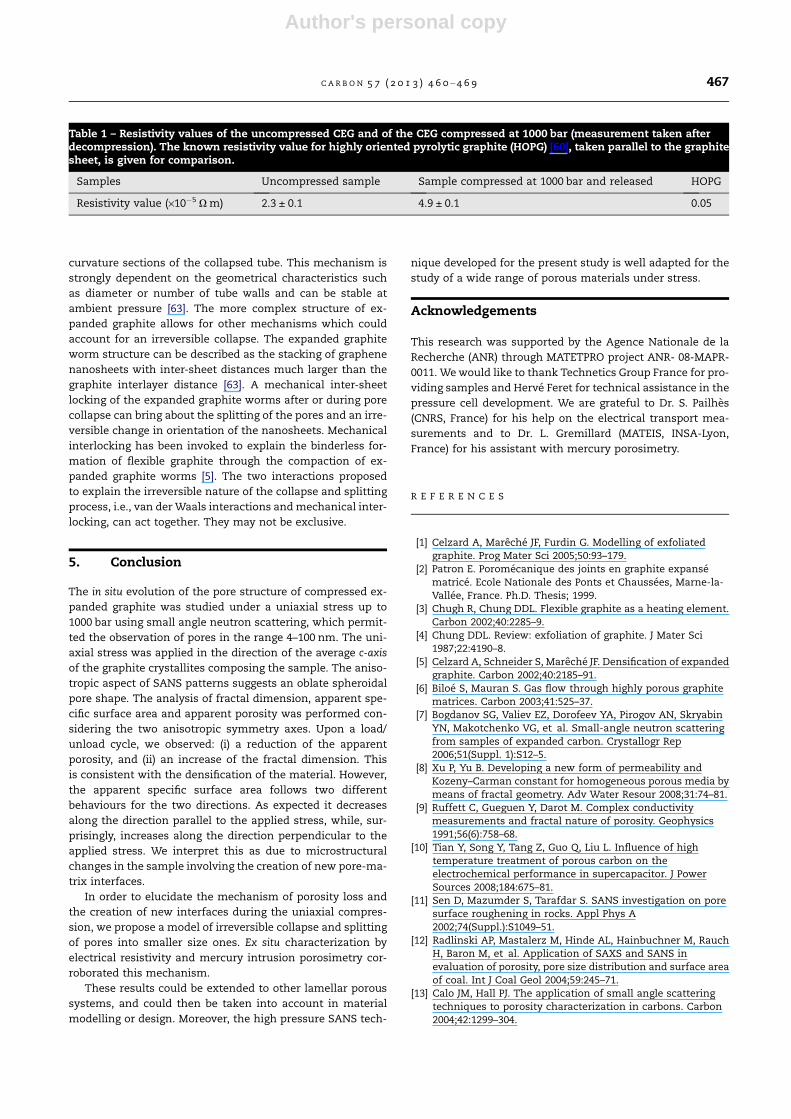
Mercury intrusion measures were taken on the CEG sam-
ple compressed at 1000 bar and quenched to ambient condi-
tions, and, for comparison, on the initial flexible graphite
sheets. The mercury intrusion curves for the two samples
are shown in Fig. 9. We obtain a 270 ± 30 nm mean pore size
for the initial flexible graphite sheet. The pore structure of
the CEG sample quenched from 1000 bar shows a large asym-
metric distribution with a mean pore size of 20 nm. There is
therefore an order of magnitude difference in mean pore size,
supporting the scenario proposed in Fig. 8.
We further measured the in-plane electrical resistivity,
using the four probe method on the CEG sample before and
after compression at 1000 bar. The electrical charge displace-
ment occurred parallel to the graphite sheet and along the
pore long axis. Results are shown in Table 1 and compared
with the known value for highly oriented pyrolytic graphite
(HOPG).
The measurements show higher resistivity in the com-
pressed sample. This resistivity increase is explained by an
increase in pore density, consistent with an interface creation
along the long pore axis as observed in SANS data (Fig. 7b) and
attributed to the irreversible collapse mechanism. An electri-
cal resistance measurement perpendicular to the flexible
graphite sheet has been done by Luo and Chung [61] under re-
peated compression. It was found to decrease with the ap-
plied stress.
To summarize, experimental results from SANS, together
with the complementary techniques of mercury intrusion
porosimetry and electrical resistivity, support the model of
pore collapse and splitting in the CEG sample under compres-
sion. We relate the decrease in porosity (Fig. 5) after compres-
sion to the formation of smaller pores (in the detectable size
range). The pores are more affected by the reduction of their
dimension along the direction of applied stress which corre-
sponds to the short pore axis. In fact, as the applied uniaxial
stress was parallel to the short axis of the pore, the collapse
should preferentially take place also in this direction (Fig. 8).
The pore size shift towards smaller values must be accompa-
nied by the formation of new rough interfaces along the long
axis, consistent with the increase of fractal dimension in this
direction. The increase of apparent specific area after decom-
pression further confirms both the irreversible character of
the mechanism and the appearance of new void-matrix inter-
faces on the long axis.
The irreversibility of the stress-induced collapse implies
that the elastic energy introduced through the creation of lar-
ger curvature interfaces should be compensated through the
interactions between the newly created contact surfaces. A
parallel can be drawn with the pressure induced collapse ob-
served in carbon nanotubes [51,52,62] leading to peanut-
shaped tubes on which the van der Waals inter-wall interac-
tions compensate for the elastic energy created in the higher
Fig. 8 – Proposed pore collapse and splitting mechanism in compressed expanded graphite samples under uniaxial stress.
From left to right: pore evolution under a uniaxial stress until irreversible splitting into smaller pores.
0.01 0.1 1 10 100
0.0
0.1
0.2
0.3
0.4
0.5
0.6
0.7100 10 1 0,1 0,01
Flexible graphite Sample quenched at 1000 bar
Cum
ulat
ive
volu
me
(ml/g
)
Pore size (µm)
Pressure (MPa)
Fig. 9 – Mercury intrusion curves for the initial flexible
graphite sheet (black) and for the CEG sample quenched
from 1000 bar (red). The cumulative volume is plotted as a
function of pore size (low axis) and of mercury pressure
(upper axis). Black and red symbols indicate the
corresponding mean pore size. The small step observed at
low compression in the black curve is related to the material
compression before mercury intrusion. (For interpretation of
the references to colour in this figure legend, the reader is
referred to the web version of this article.)
466 C A R B O N 5 7 ( 2 0 1 3 ) 4 6 0 – 4 6 9
Author's personal copy
curvature sections of the collapsed tube. This mechanism is
strongly dependent on the geometrical characteristics such
as diameter or number of tube walls and can be stable at
ambient pressure [63]. The more complex structure of ex-
panded graphite allows for other mechanisms which could
account for an irreversible collapse. The expanded graphite
worm structure can be described as the stacking of graphene
nanosheets with inter-sheet distances much larger than the
graphite interlayer distance [63]. A mechanical inter-sheet
locking of the expanded graphite worms after or during pore
collapse can bring about the splitting of the pores and an irre-
versible change in orientation of the nanosheets. Mechanical
interlocking has been invoked to explain the binderless for-
mation of flexible graphite through the compaction of ex-
panded graphite worms [5]. The two interactions proposed
to explain the irreversible nature of the collapse and splitting
process, i.e., van der Waals interactions and mechanical inter-
locking, can act together. They may not be exclusive.
5. Conclusion
The in situ evolution of the pore structure of compressed ex-
panded graphite was studied under a uniaxial stress up to
1000 bar using small angle neutron scattering, which permit-
ted the observation of pores in the range 4–100 nm. The uni-
axial stress was applied in the direction of the average c-axis
of the graphite crystallites composing the sample. The aniso-
tropic aspect of SANS patterns suggests an oblate spheroidal
pore shape. The analysis of fractal dimension, apparent spe-
cific surface area and apparent porosity was performed con-
sidering the two anisotropic symmetry axes. Upon a load/
unload cycle, we observed: (i) a reduction of the apparent
porosity, and (ii) an increase of the fractal dimension. This
is consistent with the densification of the material. However,
the apparent specific surface area follows two different
behaviours for the two directions. As expected it decreases
along the direction parallel to the applied stress, while, sur-
prisingly, increases along the direction perpendicular to the
applied stress. We interpret this as due to microstructural
changes in the sample involving the creation of new pore-ma-
trix interfaces.
In order to elucidate the mechanism of porosity loss and
the creation of new interfaces during the uniaxial compres-
sion, we propose a model of irreversible collapse and splitting
of pores into smaller size ones. Ex situ characterization by
electrical resistivity and mercury intrusion porosimetry cor-
roborated this mechanism.
These results could be extended to other lamellar porous
systems, and could then be taken into account in material
modelling or design. Moreover, the high pressure SANS tech-
nique developed for the present study is well adapted for the
study of a wide range of porous materials under stress.
Acknowledgements
This research was supported by the Agence Nationale de la
Recherche (ANR) through MATETPRO project ANR- 08-MAPR-
0011. We would like to thank Technetics Group France for pro-
viding samples and Herve Feret for technical assistance in the
pressure cell development. We are grateful to Dr. S. Pailhes
(CNRS, France) for his help on the electrical transport mea-
surements and to Dr. L. Gremillard (MATEIS, INSA-Lyon,
France) for his assistant with mercury porosimetry.
R E F E R E N C E S
[1] Celzard A, Mareche JF, Furdin G. Modelling of exfoliatedgraphite. Prog Mater Sci 2005;50:93–179.
[2] Patron E. Poromecanique des joints en graphite expansematrice. Ecole Nationale des Ponts et Chaussees, Marne-la-Vallee, France. Ph.D. Thesis; 1999.
[3] Chugh R, Chung DDL. Flexible graphite as a heating element.Carbon 2002;40:2285–9.
[4] Chung DDL. Review: exfoliation of graphite. J Mater Sci1987;22:4190–8.
[5] Celzard A, Schneider S, Mareche JF. Densification of expandedgraphite. Carbon 2002;40:2185–91.
[6] Biloe S, Mauran S. Gas flow through highly porous graphitematrices. Carbon 2003;41:525–37.
[7] Bogdanov SG, Valiev EZ, Dorofeev YA, Pirogov AN, SkryabinYN, Makotchenko VG, et al. Small-angle neutron scatteringfrom samples of expanded carbon. Crystallogr Rep2006;51(Suppl. 1):S12–5.
[8] Xu P, Yu B. Developing a new form of permeability andKozeny–Carman constant for homogeneous porous media bymeans of fractal geometry. Adv Water Resour 2008;31:74–81.
[9] Ruffett C, Gueguen Y, Darot M. Complex conductivitymeasurements and fractal nature of porosity. Geophysics1991;56(6):758–68.
[10] Tian Y, Song Y, Tang Z, Guo Q, Liu L. Influence of hightemperature treatment of porous carbon on theelectrochemical performance in supercapacitor. J PowerSources 2008;184:675–81.
[11] Sen D, Mazumder S, Tarafdar S. SANS investigation on poresurface roughening in rocks. Appl Phys A2002;74(Suppl.):S1049–51.
[12] Radlinski AP, Mastalerz M, Hinde AL, Hainbuchner M, RauchH, Baron M, et al. Application of SAXS and SANS inevaluation of porosity, pore size distribution and surface areaof coal. Int J Coal Geol 2004;59:245–71.
[13] Calo JM, Hall PJ. The application of small angle scatteringtechniques to porosity characterization in carbons. Carbon2004;42:1299–304.
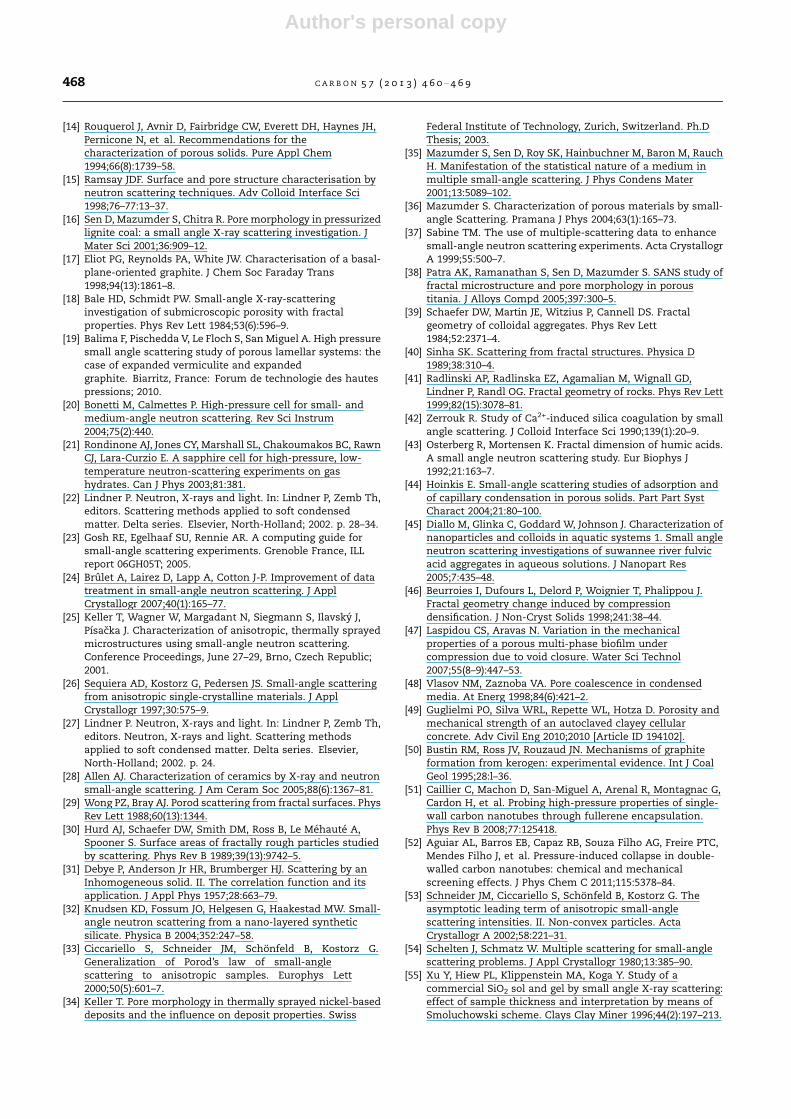
Table 1 – Resistivity values of the uncompressed CEG and of the CEG compressed at 1000 bar (measurement taken afterdecompression). The known resistivity value for highly oriented pyrolytic graphite (HOPG) [60], taken parallel to the graphitesheet, is given for comparison.
Samples Uncompressed sample Sample compressed at 1000 bar and released HOPG
Resistivity value (·10�5 X m) 2.3 ± 0.1 4.9 ± 0.1 0.05
C A R B O N 5 7 ( 2 0 1 3 ) 4 6 0 – 4 6 9 467
Author's personal copy
[14] Rouquerol J, Avnir D, Fairbridge CW, Everett DH, Haynes JH,Pernicone N, et al. Recommendations for thecharacterization of porous solids. Pure Appl Chem1994;66(8):1739–58.
[15] Ramsay JDF. Surface and pore structure characterisation byneutron scattering techniques. Adv Colloid Interface Sci1998;76–77:13–37.
[16] Sen D, Mazumder S, Chitra R. Pore morphology in pressurizedlignite coal: a small angle X-ray scattering investigation. JMater Sci 2001;36:909–12.
[17] Eliot PG, Reynolds PA, White JW. Characterisation of a basal-plane-oriented graphite. J Chem Soc Faraday Trans1998;94(13):1861–8.
[18] Bale HD, Schmidt PW. Small-angle X-ray-scatteringinvestigation of submicroscopic porosity with fractalproperties. Phys Rev Lett 1984;53(6):596–9.
[19] Balima F, Pischedda V, Le Floch S, San Miguel A. High pressuresmall angle scattering study of porous lamellar systems: thecase of expanded vermiculite and expandedgraphite. Biarritz, France: Forum de technologie des hautespressions; 2010.
[20] Bonetti M, Calmettes P. High-pressure cell for small- andmedium-angle neutron scattering. Rev Sci Instrum2004;75(2):440.
[21] Rondinone AJ, Jones CY, Marshall SL, Chakoumakos BC, RawnCJ, Lara-Curzio E. A sapphire cell for high-pressure, low-temperature neutron-scattering experiments on gashydrates. Can J Phys 2003;81:381.
[22] Lindner P. Neutron, X-rays and light. In: Lindner P, Zemb Th,editors. Scattering methods applied to soft condensedmatter. Delta series. Elsevier, North-Holland; 2002. p. 28–34.
[23] Gosh RE, Egelhaaf SU, Rennie AR. A computing guide forsmall-angle scattering experiments. Grenoble France, ILLreport 06GH05T; 2005.
[24] Brulet A, Lairez D, Lapp A, Cotton J-P. Improvement of datatreatment in small-angle neutron scattering. J ApplCrystallogr 2007;40(1):165–77.
[25] Keller T, Wagner W, Margadant N, Siegmann S, Ilavsky J,Pısacka J. Characterization of anisotropic, thermally sprayedmicrostructures using small-angle neutron scattering.Conference Proceedings, June 27–29, Brno, Czech Republic;2001.
[26] Sequiera AD, Kostorz G, Pedersen JS. Small-angle scatteringfrom anisotropic single-crystalline materials. J ApplCrystallogr 1997;30:575–9.
[27] Lindner P. Neutron, X-rays and light. In: Lindner P, Zemb Th,editors. Neutron, X-rays and light. Scattering methodsapplied to soft condensed matter. Delta series. Elsevier,North-Holland; 2002. p. 24.
[28] Allen AJ. Characterization of ceramics by X-ray and neutronsmall-angle scattering. J Am Ceram Soc 2005;88(6):1367–81.
[29] Wong PZ, Bray AJ. Porod scattering from fractal surfaces. PhysRev Lett 1988;60(13):1344.
[30] Hurd AJ, Schaefer DW, Smith DM, Ross B, Le Mehaute A,Spooner S. Surface areas of fractally rough particles studiedby scattering. Phys Rev B 1989;39(13):9742–5.
[31] Debye P, Anderson Jr HR, Brumberger HJ. Scattering by anInhomogeneous solid. II. The correlation function and itsapplication. J Appl Phys 1957;28:663–79.
[32] Knudsen KD, Fossum JO, Helgesen G, Haakestad MW. Small-angle neutron scattering from a nano-layered syntheticsilicate. Physica B 2004;352:247–58.
[33] Ciccariello S, Schneider JM, Schonfeld B, Kostorz G.Generalization of Porod’s law of small-anglescattering to anisotropic samples. Europhys Lett2000;50(5):601–7.
[34] Keller T. Pore morphology in thermally sprayed nickel-baseddeposits and the influence on deposit properties. Swiss
Federal Institute of Technology, Zurich, Switzerland. Ph.DThesis; 2003.
[35] Mazumder S, Sen D, Roy SK, Hainbuchner M, Baron M, RauchH. Manifestation of the statistical nature of a medium inmultiple small-angle scattering. J Phys Condens Mater2001;13:5089–102.
[36] Mazumder S. Characterization of porous materials by small-angle Scattering. Pramana J Phys 2004;63(1):165–73.
[37] Sabine TM. The use of multiple-scattering data to enhancesmall-angle neutron scattering experiments. Acta CrystallogrA 1999;55:500–7.
[38] Patra AK, Ramanathan S, Sen D, Mazumder S. SANS study offractal microstructure and pore morphology in poroustitania. J Alloys Compd 2005;397:300–5.
[39] Schaefer DW, Martin JE, Witzius P, Cannell DS. Fractalgeometry of colloidal aggregates. Phys Rev Lett1984;52:2371–4.
[40] Sinha SK. Scattering from fractal structures. Physica D1989;38:310–4.
[41] Radlinski AP, Radlinska EZ, Agamalian M, Wignall GD,Lindner P, Randl OG. Fractal geometry of rocks. Phys Rev Lett1999;82(15):3078–81.
[42] Zerrouk R. Study of Ca2+-induced silica coagulation by smallangle scattering. J Colloid Interface Sci 1990;139(1):20–9.
[43] Osterberg R, Mortensen K. Fractal dimension of humic acids.A small angle neutron scattering study. Eur Biophys J1992;21:163–7.
[44] Hoinkis E. Small-angle scattering studies of adsorption andof capillary condensation in porous solids. Part Part SystCharact 2004;21:80–100.
[45] Diallo M, Glinka C, Goddard W, Johnson J. Characterization ofnanoparticles and colloids in aquatic systems 1. Small angleneutron scattering investigations of suwannee river fulvicacid aggregates in aqueous solutions. J Nanopart Res2005;7:435–48.
[46] Beurroies I, Dufours L, Delord P, Woignier T, Phalippou J.Fractal geometry change induced by compressiondensification. J Non-Cryst Solids 1998;241:38–44.
[47] Laspidou CS, Aravas N. Variation in the mechanicalproperties of a porous multi-phase biofilm undercompression due to void closure. Water Sci Technol2007;55(8–9):447–53.
[48] Vlasov NM, Zaznoba VA. Pore coalescence in condensedmedia. At Energ 1998;84(6):421–2.
[49] Guglielmi PO, Silva WRL, Repette WL, Hotza D. Porosity andmechanical strength of an autoclaved clayey cellularconcrete. Adv Civil Eng 2010;2010 [Article ID 194102].
[50] Bustin RM, Ross JV, Rouzaud JN. Mechanisms of graphiteformation from kerogen: experimental evidence. Int J CoalGeol 1995;28:l–36.
[51] Caillier C, Machon D, San-Miguel A, Arenal R, Montagnac G,Cardon H, et al. Probing high-pressure properties of single-wall carbon nanotubes through fullerene encapsulation.Phys Rev B 2008;77:125418.
[52] Aguiar AL, Barros EB, Capaz RB, Souza Filho AG, Freire PTC,Mendes Filho J, et al. Pressure-induced collapse in double-walled carbon nanotubes: chemical and mechanicalscreening effects. J Phys Chem C 2011;115:5378–84.
[53] Schneider JM, Ciccariello S, Schonfeld B, Kostorz G. Theasymptotic leading term of anisotropic small-anglescattering intensities. II. Non-convex particles. ActaCrystallogr A 2002;58:221–31.
[54] Schelten J, Schmatz W. Multiple scattering for small-anglescattering problems. J Appl Crystallogr 1980;13:385–90.
[55] Xu Y, Hiew PL, Klippenstein MA, Koga Y. Study of acommercial SiO2 sol and gel by small angle X-ray scattering:effect of sample thickness and interpretation by means ofSmoluchowski scheme. Clays Clay Miner 1996;44(2):197–213.
468 C A R B O N 5 7 ( 2 0 1 3 ) 4 6 0 – 4 6 9

Author's personal copy
[56] Berk NF, Hardman-Rhyne KA. Characterization of aluminapowder using multiple small-angle neutron scattering I.Theory. J Appl Crystallogr 1985;18:467–72.
[57] Hardman-Rhyne KA, Berk NF. Characterization of aluminapowder using multiple small-angle neutron scattering. II.Experiment. J Appl Crystallogr 1985;18:473–9.
[58] Purewal JJ, Liu D, Yang J, Sudik A, Siegel DJ, Maurer S, et al.Increased volumetric hydrogen uptake of MOF-5 by powderdensification. Int J Hydrogen Energy 2012;37(3):2723–7.
[59] Calas S, Sempere R. Textural properties of densified aerogels.J Non-Cryst Solids 1998;225:215–9.
[60] Sengupta R, Bhattacharya M, Bandyopadhyay S, BhowmickAK. A review on the mechanical and electrical properties of
graphite and modified graphite reinforced polymercomposites. Prog Polym Sci 2011;36:638–70.
[61] Luo X, Chung DLL. Flexible graphite under repeatedcompression studied by electrical resistance measurements.Carbon 2001;39:985–90.
[62] Aguiar AL, Rodrigo B, Capaz RB, Souza Filho AG, San-MiguelA. Structural and phonon properties of bundled single- anddouble-wall carbon nanotubes under pressure. J Phys ChemC 2012;116(42):22637–45.
[63] Gu W, Zhang W, Li X, Zhu H, Wei J, Li Z, et al. Graphenesheets from worm-like exfoliated graphite. J Mater Chem2009;19:3367–9.
C A R B O N 5 7 ( 2 0 1 3 ) 4 6 0 – 4 6 9 469
Related Documents