AN IN-DEPTH LOOK AT CLICK! FINANCIALS May 20, 2015

Welcome message from author
This document is posted to help you gain knowledge. Please leave a comment to let me know what you think about it! Share it to your friends and learn new things together.
Transcript

AN IN-DEPTH LOOK AT CLICK! FINANCIALS
May 20, 2015

• Background and 1997 Telecommunications Study (Bob Mack)
• What has changed? (Bob Mack)
• Smart meter technology (Joe Tellez)
• Click! financials: Cost allocation (Bill Berry)
• Moss Adams, LLC review (Julie Desimone)
• Click!’s revenues do not cover its costs (Bill Berry)
• Summary (Chris Robinson)
AGENDA
2

Section 1 Bob Mack Deputy Director for Government Affairs How Click! got its start, and how the 1997 telecommunications study used to launch Click! compares to actual growth
• Some objectives reached (competition, enhanced services). Others were not (# of cable customers, revenues, profits)
• Always anticipated Click! would recover its costs, including Click!’s share of original capital investment

• By 1996, TCI was the only cable TV provider, with 36 channels
• No other viable provider of Internet or TV
• No viable provider of high-speed data service for Tacoma Power’s (City Light) system control
BACKGROUND
4

• Cable TV competition, with upgraded system
• Broader and greater Internet service for businesses and residences (Frank Russell, et al.)
• Tacoma Power (City Light) system improvements and system control, reliability and efficiency
• Two-way communications with Power customers
TACOMA’S IDENTIFIED NEEDS
5
• Prepared by outside team, with TPU staff assistance
• Report included: • Review of the telecommunications industry • Survey of other cities • Local communications business plan • “The Residential Market” - Market Data Research Corp. • “The Current Business Market” - Market data Research Corp. • “Future Market to Serve” - APEX Business Solutions • “Telecommunications and Economic Development” - Bruce
Mann and Sue Heath • “Economic Development in the Greater Tacoma/Pierce County
Area” - APEX Business Solutions Project Team
1997 TELECOMMUNICATIONS STUDY
6

Residential customer survey - 606 households • 78% of Tacoma households have cable TV • 44% would pick Click! Cable TV – if options and
prices were similar. • More would switch if Click! Cable TV had more
options and lower prices
Business and Internet Survey • 200 businesses surveyed – 61% use Internet
(limited access) • 18% of households online
CUSTOMER RESEARCH - 1996
7

Identified benefits to “City Light” • System “control and outage reporting” • Performance “monitoring and preventive
maintenance” • Cost estimate for the two items above - $15
million • Interactive “communication link to customers” • Better services than competitors • High-speed, low-cost Internet • Regional economic development • Additional revenue to City Light and City
1997 PUB/COUNCIL PRESENTATIONS
8

• “Fail to gain market share”
• Non-competitive product
• “Construction and O&M costs substantially exceed estimates”
IDENTIFIED RISK FACTORS
9

“The Telecommunications Project … shall be an integral Light Division operating responsibility and function.”
• City Light operates Click! • ISPs solicited to provide Internet service
Financing
• After considering both bond issuances and Light Division investment, determination was to finance with Light Division advances
• “Expenses” list presented to Council included “Debt Service”
• “Pro Forma Income Statement” projected “Income Available for Plant Service, Debt Retirements” at $1.4 million for 1999-3rd year of operation ($14 million in 2015)
ORGANIZATION OF TELECOMMUNICATIONS UTILITY
10

• Project “shall be operated in a business-like manner…” (Council presentation)
• Assumed net profit by 1998 – 2nd year of operation
• If operated “in a business like manner, the system would generate sufficient revenues to make the system self sustaining.” (Council presentation)
• Only “customers who choose to buy” cable TV “would be charged for them. No tax money would be used and your electric rates would not increase because of this new system…” (Council presentation)
CROSS-SUBSIDY ISSUES
11
• June 1996: $45-55 million
• September 1997: $96 million
• October 1997: $99.4 million
ORIGINAL COST ESTIMATES
12

- 5,000
10,000 15,000 20,000 25,000 30,000 35,000 40,000 45,000 50,000
Actual CATV Subscribers Projected CATV Subscribers
Fewer cable customers than projected
1997 PROJECTIONS VS. ACTUAL
$-
$10
$20
$30
$40
$50
$60
$70
$/ A
vera
ge M
onth
ly B
ill
Actual CATV Programming Cost Projected CATV Programming Cost
Higher programming costs
The projections are from an appendix to the 1997 financial statements The 1997 projection brought to current dollar values using core CPI from the Bureau of Labor Statistics
$0
$10
$20
$30
$40
$50
$60
Mill
ions
Actual Revenue Projected Revenue
Lower revenues than projected
13
-
5,000
10,000
15,000
20,000
25,000
30,000
Actual ISP Customers Projected ISP Customers
ISP customers vs. projected

Section 2 Bob Mack
What has changed in 20 years? • Did not anticipate decline in cable TV use • Advent of broadband Internet, social media, mobile
devices, over-the-top content amid rising cable costs have accelerated change
• Hybrid business model prevents Click! bundling and benefitting from margin on broadband Internet

TELECOMMUNICATIONS GROWTH TRENDS 1998 TO 2016
15
Cable TV & ISP Customer Counts
0
5,000
10,000
15,000
20,000
25,000
30,000
1998 1999 2000 2001 2002 2003 2004 2005 2006 2007 2008 2009 2010 2011 2012 2013 2014 2015 2016
Cable TV ISP
Cust
omer
Cou
nts

Click! Cable TV introduced in 1998 to stimulate competition, improve cable & telecom services locally, and build foundation for smart grid
1998-2000: CABLE TV GROWTH MODE
16
• Decision made to employ hybrid business model: Click! Cable TV and private Internet – no bundling
• Tacoma City Light believes cable to the home is the best way to establish the smart grid
• ISPs begin offering Internet to stimulate competition locally • Roughly 36% of Americans report using the Internet in 1998
(Pew Research Center) • Nearly 70% of U.S. household subscribe
to cable TV (Nielson)

2001-2003: INTERNET, ISP GROWTH MODE
17
Both Click! Cable TV and ISP customer bases grow as Internet becomes mainstream
• August 2000 – 50% of people use Internet
• Broadband begins in 2000 with 3% adoption
• Dial-up access peaks in 2001 with 41% of Internet users
• By 2003, dial up in permanent decline as broadband grows • Google becomes popular as a search engine • Video on demand (VOD) & Digital Video Recorders (DVRs)
introduced • Industry first move to bundled packages

2004-2006: CABLE COMPETITION PROLIFERATES
18
• By 2006, 73% of American adults use Internet • 42% use broadband;
23% dial up • YouTube begins operations,
online video use soars • Facebook commercially available in 2006 • Satellite TV gains 29% share in the marketplace nationally • Bundling options aggressively marketed - double & triple play • Click! first pays retransmission consent fees in 2006
Non-traditional competitors to cable TV enter market, demand for faster Internet grows

2007-2009: CABLE COSTS SOAR, BUNDLES BECOME NORM
19
• Netflix introduces streaming video
• Hulu, Roku, and Amazon Prime Instant Video begin operations
• iPhone & Android smartphones introduced
• Pew Center reports more things connected to Internet than people on Earth
• Consumers begin to buy video content separately
New technology and birth of social media drive Internet adoption while Click! Cable TV costs increase

2010-2012: ALTERNATIVE FORMS OF STREAMING BECOME POPULAR
20
• Cable TV continues cost increase amid poor economy, fueling “Cord Cutters” and “Cord Nevers”
• 2009 FCC digital TV switchover
• The tablet is first introduced • Click! customer count begins downward trend as the ISP
customer counts rise • Click! Strategic Plan recognizes issues with two business
models • Build out of TPU network stops
Consumer content consumption preferences change as streaming becomes mainstream, mobile devices proliferate and cable costs grow

2013-2015: INTERNET ECLIPSES CABLE
21
• Click! retransmission consent fees grow over 825% since ’06; programming costs up 123% since ’03
• 87% of Americans report using the Internet; 70% of American adults have broadband at home
• 74% of American adults use social media • Facebook reports 1.44 billion active users • More video is uploaded to YouTube in 1 month than the 3 major
U.S. networks created in 60 years • 64% of American adults own a smartphone
with Internet
Internet emerges as leader – both Click! and Comcast now experience more ISP customers than cable TV as cable costs continue to rise

CLICK! MANAGEMENT TIMELINE
22
2009 2010 2011 2012 2014 2015
Further build-out of Click! network
halted – proposed new build areas do not meet
financial return requirements
Click! headcount and capital budget
significantly reduced.
Introduced retail Internet
concept (change hybrid
model) to Public Utility
Board and City Council
Click! provision of retail Internet service (Plan A)
proposed, but not approved.
Cooperative approach
with ISPs directed by policymakers
(Plan B). Customer growth
targets are accepted and
modest revenue increases result.
Approached by Wave
Broadband. Negotiated proposal.
Proposed leasing Click! Network to
private operator.
Would eliminate Click!
financial losses, provide
improved customer products, continue
competitive open-access
network.
2013
Click! financials and customers
continue to decline.
Consultant re-engaged to
examine alternatives to
Plan B. Consultant developed
other options. Leasing to
private operator was determined best option.
Click! financial challenges are
growing. Consultant engaged to
examine potential future Click!
business models.
Update on strategy to
Public Utility Board
members.

SUMMARY
Original Click! business plan vs. current situation
• Proved to be overly optimistic in terms of network build-out costs, programming costs, market share, revenues
• Assumed recovery of all related costs, including Click!’s share of the original capital investment
• Did not foresee the industry evolution to wireless power metering systems
• Did/could not foresee the significant increase in broadband internet utilization, and decline in cable television utilization
• “Hybrid” model involving private ISPs prevents product “bundling” to match competition
• “Hybrid” model involving ISPs prevents Click from enjoying the retail margin available from broadband Internet
23

Section 3 Joe Tellez Chief Technology Officer How smart meter technology (called advanced metering infrastructure, or AMI) has changed since Tacoma Power launched the Gateway project • Tacoma Power was ahead of its time • Industry-wide adoption of wireless technology for AMI • Tacoma Power doesn’t need a wired telecommunications
network for metering

AMI TECHNOLOGY INDUSTRY
2000 2014 2002 2004 2006 2009 2012
Competing technologies
(wired vs. wireless) in
varying states of maturity AMI entrants
considered very early adopters
Deployment costs between
$500-$600 per Smart
Meter (power only)
Wireless solutions dominate new AMI
deployments and focus on
meter reading benefits
Smart Grid Investment
Grant drives more
AMI growth and
vendors flood the market
Smart Grid Investment
Grant period ends, vendors
begin to consolidate
and offer more ‘out of the box’
solutions
AMI deployment costs now between
$180 - $200 per meter –
benefits extend to
utility operations
2010
Web technologies & mobile devices offer ‘two-way’ communication
over wireless
and replace in-home displays
2008
In home displays for billing and
consumption notifications considered high cost
5-6% 25-30% Market Penetration:
25

AMI TECHNOLOGY AT TPU
1998 2015 2002 2004 2006 2009 2012
Vision of Electricom
AMI over HFC Network
development begins
Pilot Gateway
meter deployment
begins
Pay-As-You-Go pilot with
in-home displays
leveraging Click!
Network Pilot deployment stops due to
high deployment
and maintenance
costs associated
with custom wired meter technology
Smart Utility Plan:
Continue to operate
Gateway until end of life
AMI business case
evaluating go forward options
leveraging wireless
technology
2000
Fiber network supports
substation connectivity
and automation
26
GATEWAY METERS NOW OBSOLETE
• Ongoing meter reliability issues and higher-than-expected internal support costs
• No supplier available to sustain Gateway meters
• Alternative suppliers of coax wired smart meters nonexistent
• Wireless smart meter price points dropping for both power and water
Gateway end-of-life factors contributed to the overall decline in the use of Click! Network to serve Tacoma Power’s AMI needs 27

Section 4 Bill Berry Rates, Analysis and Planning Manager A closer look at how Tacoma Power allocates costs to Click! Network • Click! Cable and Internet services rely on the
telecommunications network far more than the electrical system
• Click! should be responsible for 94% of all telecommunication costs based on review of actual usage
ALLOCATION SCENARIOS
29
• 2013/14 financials, budgets and rates reflect approximately 75/25 allocation between Click! and Electric
• The Click! financial trend presented on 3/31 with the Wave Broadband proposal showed 100% of the telecommunication expenses as an approximation of the new cost allocation
• Based on refined analysis and a third-party review, the cost allocation moving forward is 94/6

$ in millions 2009/10 2011/12 2013/14
(Projected) 2015/16 (Budget)
2015 (Budget)
Revenue $46.2 $49.1 $53.5 $59.5 $29.8
O&M ($57.6) ($58.3) ($60.0) ($67.0) ($33.5)
Cash flow after O&M ($11.4) ($9.2) ($6.5) ($7.5) ($3.8)
A&R and capital ($25.8) ($7.4) ($5.4) ($7.6) ($3.8)
Cash flow after A&R and capital
($37.2) ($16.6) ($11.9) ($15.1) ($7.6)
Debt service ($3.9) ($3.9) ($3.9) ($3.9) ($2.0)
Net cash flow ($41.1) ($20.5) ($15.8) ($19.0) ($9.5)
FINANCIAL TREND - OVERALL
30
Numbers rounded, may not add up

TOTAL TELECOMMUNICATIONS O&M COSTS
•Programming Fees • ISP Advantage •Customers Sales & Service
Programming / Marketing
•Physical Maintenance of Fiber Network
HFC Network Support
• Installation of Service Drops
Customer Installation Support
•Network Engineering •Broadband Services •Network Service Assurance
Network Services
•Click! General Management •Business Support Systems •Sales & Marketing Administration
Admin/IT Cost
Total: $33.5 Million 31
HFC Network Support
$3 Customer Installation
Support $3
Network Services
$3
Admin/IT Cost $4
Programming & Marketing,
$21
All Telecommunication O&M Costs 2015/16 Average
($Millions)

WHY DO WE ALLOCATE?
32
• Click! is part of Tacoma Power
• Telecommunications operations are supported by 17 workgroups (cost centers), 10 of which provide some support to electric systems
• Costs should be allocated in a reasonable manner to understand Click! financial performance and make sound business decisions
• Power rates should not be higher than value of services rendered

COST ALLOCATION HISTORY
33
2000 • Price Waterhouse Coopers recommended that telecommunication costs be allocated
between Click! services and electric services 2002-2003
• Staff determined that allocation should be approximately 75/25 between Click! and electric
• Projected usage based on build-out to support AMI • A 2003 study by Virchow Krause & Co. confirmed the 75/25 allocation is reasonable • Allocation is used for financials , budgets and rates (currently, as well)
2012-2013 • Staff conducted a new internal cost allocation analysis • Results showed allocations should be 96/4 between Click! and electric • New allocations have been used for planning, but not formally adopted for financials ,
budgets & rates 2015
• Moss Adams, LLC engaged to review new allocation methodology • As part of their analysis Moss Adams interviewed staff and recommended updating the
2013 study with current financial information • Staff updated the study which resulted in 94/6 allocation factor between Click! and
electric

NETWORK SUPPORT & ASSURANCE COST ALLOCATIONS
•555300, 562700, 562800, 555600
Cost Centers
•Maintain the operations of the HFC network: engineering, design, conversion work, safety equipment, repairs, and operating supplies in order to keep the fiber and coaxial assets performing as intended.
Work Description
•100% to Electric
Current Allocation
•Allocated costs based on total number of customer meter connections. All connections to a customer meter allocated to electric. All remaining drops allocated to Click! commercial.
Changes to Allocation
34
Click! Electric Click! ElectricAllocation 0% 100% 51% 49%Average 2015/16 Expenses $0 $3,601,365 $1,851,698 $1,749,666
Current Proposed

SERVICE INSTALLATION COST ALLOCATION
•553500
Cost Center
•Installation and removal of coaxial service drops
Work Description
•50/50 allocation between Click! and Electric
Current Allocation
•Based on the proportion of work orders related to wired AMI meters relative to all other work orders
Changes to Allocation
35
Click! Electric Click! ElectricAllocation 50% 50% 98% 2%Average 2015/16 Expenses $1,302,156 $1,302,156 $2,552,226 $52,086
Current Proposed

DISPATCH COST ALLOCATION
•553600
Cost Center
•Manages workload and scheduling of the service and installation technicians
Work Description
•100% allocation to Click!
Current Allocation
•Based on time spent working on wired AMI meter orders relative to other activities
Changes to Allocation
36
Click! Electric Click! ElectricAllocation 100% 0% 93% 7%Average 2015/16 Expenses $486,143 $0 $452,113 $34,030
Current Proposed
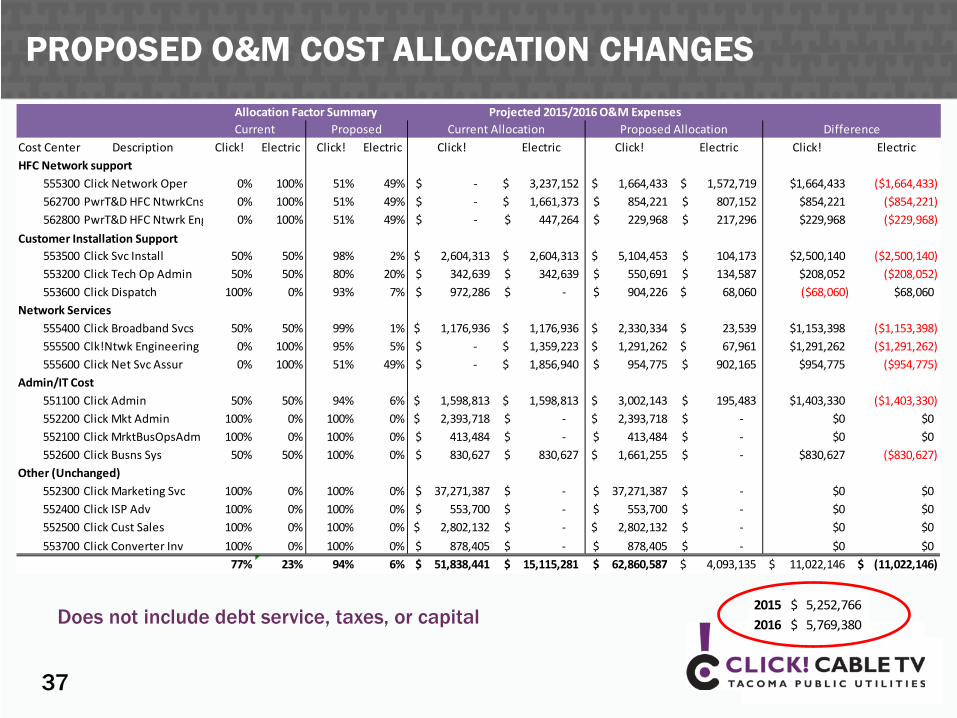
PROPOSED O&M COST ALLOCATION CHANGES
37
2015 5,252,766$ 2016 5,769,380$ Does not include debt service, taxes, or capital
Cost Center Description Click! Electric Click! Electric Click! Electric Click! Electric Click! ElectricHFC Network support
555300 Click Network Oper 0% 100% 51% 49% -$ 3,237,152$ 1,664,433$ 1,572,719$ $1,664,433 ($1,664,433)562700 PwrT&D HFC NtwrkCns 0% 100% 51% 49% -$ 1,661,373$ 854,221$ 807,152$ $854,221 ($854,221)562800 PwrT&D HFC Ntwrk Eng 0% 100% 51% 49% -$ 447,264$ 229,968$ 217,296$ $229,968 ($229,968)
Customer Installation Support553500 Click Svc Install 50% 50% 98% 2% 2,604,313$ 2,604,313$ 5,104,453$ 104,173$ $2,500,140 ($2,500,140)553200 Click Tech Op Admin 50% 50% 80% 20% 342,639$ 342,639$ 550,691$ 134,587$ $208,052 ($208,052)553600 Click Dispatch 100% 0% 93% 7% 972,286$ -$ 904,226$ 68,060$ ($68,060) $68,060
Network Services555400 Click Broadband Svcs 50% 50% 99% 1% 1,176,936$ 1,176,936$ 2,330,334$ 23,539$ $1,153,398 ($1,153,398)555500 Clk!Ntwk Engineering 0% 100% 95% 5% -$ 1,359,223$ 1,291,262$ 67,961$ $1,291,262 ($1,291,262)555600 Click Net Svc Assur 0% 100% 51% 49% -$ 1,856,940$ 954,775$ 902,165$ $954,775 ($954,775)
Admin/IT Cost551100 Click Admin 50% 50% 94% 6% 1,598,813$ 1,598,813$ 3,002,143$ 195,483$ $1,403,330 ($1,403,330)552200 Click Mkt Admin 100% 0% 100% 0% 2,393,718$ -$ 2,393,718$ -$ $0 $0552100 Click MrktBusOpsAdm 100% 0% 100% 0% 413,484$ -$ 413,484$ -$ $0 $0552600 Click Busns Sys 50% 50% 100% 0% 830,627$ 830,627$ 1,661,255$ -$ $830,627 ($830,627)
Other (Unchanged)552300 Click Marketing Svc 100% 0% 100% 0% 37,271,387$ -$ 37,271,387$ -$ $0 $0552400 Click ISP Adv 100% 0% 100% 0% 553,700$ -$ 553,700$ -$ $0 $0552500 Click Cust Sales 100% 0% 100% 0% 2,802,132$ -$ 2,802,132$ -$ $0 $0553700 Click Converter Inv 100% 0% 100% 0% 878,405$ -$ 878,405$ -$ $0 $0
77% 23% 94% 6% 51,838,441$ 15,115,281$ 62,860,587$ 4,093,135$ 11,022,146$ (11,022,146)$
DifferenceAllocation Factor Summary Projected 2015/2016 O&M ExpensesCurrent Proposed Current Allocation Proposed Allocation

MOSS ADAMS LLP | 38
Tacoma Public Utilities Click! Cost Allocation Consulting Report May 20, 2015 Julie Desimone, Partner Jennifer Chu, Manager

MOSS ADAMS LLP | 39
SCOPE
• Review of the allocation method as described in TPU’s 2013 Click! allocation change draft document dated March 18, 2013
• Gain an understanding of the changes made to the allocations from an earlier 2003 allocation study.
MOSS ADAMS LLP | 40
PROCESS
• Read and gain an understanding of the 2013 Allocation Memo
• Requested supporting documentation • Interviewed key employees and stakeholders • Developed recommendations to 2013 allocation
memo

MOSS ADAMS LLP | 41
ANALYSIS
• Recommended a few changes to the 2013 allocation memo
• Read the 2015 allocation memo noting our recommendations were incorporated
• Full details of our analysis can be found in our report dated May 20, 2015
MOSS ADAMS LLP | 42
CONCLUSION
• The 2015 memo outlines an updated proposed methodology to be used in determining the allocation of telecommunications capital investment and operating expenses between Electric and Click! commercial applications.
• The overall conclusion of this consultation is that this methodology as applied is consistent with current uses of the telecommunications network.

MOSS ADAMS LLP | 43
THANK YOU!

Section 6 Bill Berry Click! revenues do not cover its costs • Operating revenues do not fully cover operating
expenses and taxes • Operating revenues do not cover any of the annual
capital requirements • Operating revenues do not cover imputed debt
service • Even if imputed debt service were not included,
Click! would still run at a deficit and the business model would still need to change

45
RECONCILIATION TO FINANCIAL SCENARIOS
45
2015/16 Average –$ in millions
* Assumes 17.5% cable TV rate increase in 2015 and 10% cable TV rate increase in 2016, and 10% ISP rate increase in August 2016
100% Telecom O&M
94% Telecom O&M Allocation
to Click!Revenue
Current Revenue $27.4 $27.4Revenue from Rate Increases* $2.3 $2.3 Total Revenue $29.7 $29.7
O&M Expense + TaxesClick! $32.4 $30.5HFC $1.1 $1.0 Total O&M + Taxes $33.5 $31.5
Cashflow after O&M + Taxes ($3.8) ($1.8)A&R + Capital $3.8 $3.8
Net Cashflow after A&R + Capital ($7.6) ($5.6)Imputed Debt Service $2.0 $2.0
Net Cash Flow ($9.6) ($7.6)

IMPUTED DEBT SERVICE
46
• The Virchow Krause in 2003 allocation studies determined that 27.4% of the original Tacoma Power capital investment in telecommunications plant is used by and allocable to Click!
• Tacoma Power financed with cash rather than bonds • Intention from the beginning was for Click! to be self-
sustaining, and repay its share of the capital investment • That has not happened, so Tacoma Power has used imputed
debt service assumptions in its financial analyses - original investment repaid by Click! over 20 years at a 5.5% interest rate
• Whether or not debt service is included, Click! revenues do not cover the costs for Click! services

CLICK! REVENUES & EXPENSES 94/6 COST ALLOCATION
47
($15,000,000)
($10,000,000)
($5,000,000)
$0
$5,000,000
$10,000,000
$15,000,000
$20,000,000
$25,000,000
$30,000,000
$35,000,000
$40,000,000
$45,000,000
2013 2014 2015 2016
Imputed Debt Service
Capital
Taxes
O&M
Gross Revenues
Net Cash
• Includes imputed debt service • Assumes 17.5% cable TV rate increase in 2015 and 10% cable TV
rate increase in 2016, and 10% ISP rate increase in August 2016 • Numbers may not add up due to rounding

Section 7 Chris Robinson Tacoma Power Superintendent Summary
48

SUMMARY
49
• Original vision for Click! was optimistic, placed emphasis on cable TV and committed to an unsustainable hybrid business model
• The hybrid business model has not been able to withstand business environment and consumer consumption changes
• Wired network no longer needed to support AMI – industry shifted to wireless, as will Tacoma Power
• A recent review of network use indicates that Tacoma Power should be responsible for 6% of total telecommunications costs
• Moss Adams confirms that the utility’s allocation methodology is consistent with the current use of network
• Under the current business model, Click! revenues do not cover the cost of Click! services – whether factoring in debt service or not
Related Documents