Journal of Physics: Conference Series OPEN ACCESS An Improved Tumour Temperature Measurement and Control Method for Superficial Tumour Ultrasound Hyperthermia Therapeutic System To cite this article: G F Shen1 et al 2006 J. Phys.: Conf. Ser. 48 122 View the article online for updates and enhancements. You may also like Suitability of a tumour-mimicking material for the evaluation of high-intensity focused ultrasound ablation under magnetic resonance guidance S Pichardo, J Kivinen, D Melodelima et al. - An imaging-based computational model for simulating angiogenesis and tumour oxygenation dynamics Vikram Adhikarla and Robert Jeraj - Magnetic particle hyperthermia—a promising tumour therapy? Silvio Dutz and Rudolf Hergt - Recent citations Nichtinvasive Temperaturüberwachung in Gewebephantomen durch ortsaufgelöste Messung der Longitudinalwellengeschwindigkeit mittels Ultraschall-Annular-Arrays Mario Wolf et al - This content was downloaded from IP address 182.171.216.114 on 27/12/2021 at 05:45

Welcome message from author
This document is posted to help you gain knowledge. Please leave a comment to let me know what you think about it! Share it to your friends and learn new things together.
Transcript

Journal of Physics Conference Series
OPEN ACCESS
An Improved Tumour Temperature Measurementand Control Method for Superficial TumourUltrasound Hyperthermia Therapeutic SystemTo cite this article G F Shen1 et al 2006 J Phys Conf Ser 48 122
View the article online for updates and enhancements
You may also likeSuitability of a tumour-mimicking materialfor the evaluation of high-intensity focusedultrasound ablation under magneticresonance guidanceS Pichardo J Kivinen D Melodelima et al
-
An imaging-based computational model forsimulating angiogenesis and tumouroxygenation dynamicsVikram Adhikarla and Robert Jeraj
-
Magnetic particle hyperthermiamdashapromising tumour therapySilvio Dutz and Rudolf Hergt
-
Recent citationsNichtinvasive Temperaturuumlberwachung inGewebephantomen durch ortsaufgeloumlsteMessung derLongitudinalwellengeschwindigkeit mittelsUltraschall-Annular-ArraysMario Wolf et al
-
This content was downloaded from IP address 182171216114 on 27122021 at 0545
An Improved Tumour Temperature Measurement and Control Method for Superficial Tumour Ultrasound Hyperthermia Therapeutic System
G F Shen1 Y Z Chen and G X Ren
Biomedical Instrument Institute Shanghai Jiao Tong University Shanghai 200030 China
E-mail shenguofengsjtueducn
Abstract In tumour hyperthermia therapy the research on measurement and control of tumour temperature is very important Based on the hardware platform of superficial tumour ultrasound hyperthermia therapeutic system an improved tumour temperature measurement and control method is presented in this paper The experiment process data and results are discussed in detail The improved method will greatly reduce the pain and dread of the patients during the therapy period on the tumour temperature measurement and control by using the pinhead sensor
1 Introduction Cancer is a kind of disease that seriously threatens peoples health and lives It has been a long time for human being to struggle with cancer In recently hyperthermia has become a kind of new cancer therapy method after operation therapy radiopharmaceutical therapy and biology therapy [1-3]
Because cancer hyperthermia therapy have the high requirement of temperature measurement and control accuracy the research on characteristic of temperature measurement and control methods is required Based on the hardware platform of superficial tumour ultrasound hyperthermia therapeutic system an improved temperature measurement and control method will be discussed in this paper
2 Principles of superficial tumour ultrasound hyperthermia therapeutic system According to the theory of hyperthermia therapeusis the temperature of target tumour should be heated to 42 centigrade degree and kept it during the whole therapeutic process [45] The tumour will be withered after a long timersquos heating
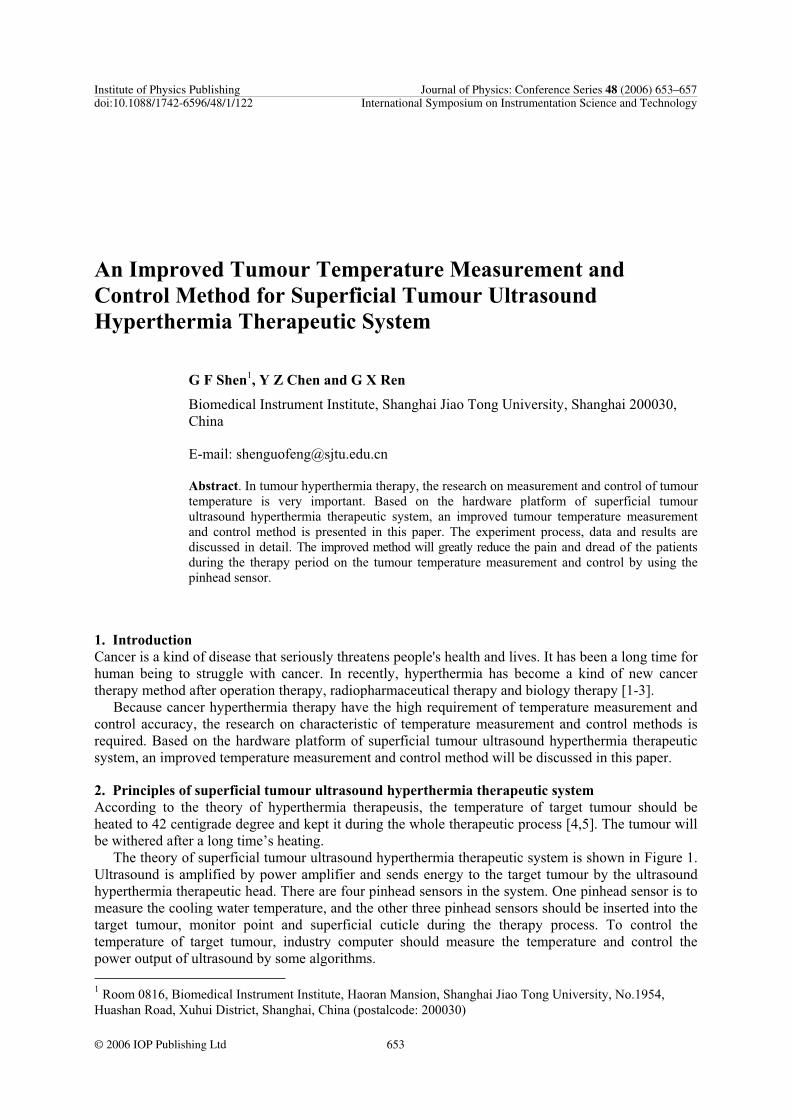
The theory of superficial tumour ultrasound hyperthermia therapeutic system is shown in Figure 1 Ultrasound is amplified by power amplifier and sends energy to the target tumour by the ultrasound hyperthermia therapeutic head There are four pinhead sensors in the system One pinhead sensor is to measure the cooling water temperature and the other three pinhead sensors should be inserted into the target tumour monitor point and superficial cuticle during the therapy process To control the temperature of target tumour industry computer should measure the temperature and control the power output of ultrasound by some algorithms 1 Room 0816 Biomedical Instrument Institute Haoran Mansion Shanghai Jiao Tong University No1954 Huashan Road Xuhui District Shanghai China (postalcode 200030)
Institute of Physics Publishing Journal of Physics Conference Series 48 (2006) 653ndash657doi1010881742-6596481122 International Symposium on Instrumentation Science and Technology
653copy 2006 IOP Publishing Ltd
Figure 1 Theory of superficial tumour ultrasound hyperthermia therapeutic system
3 Description of improved method
31 Base of the improved method The discussion above shows that the measurement and control of target tumour temperature are the key techniques Because at least one pinhead sensor should be inserted into the target tumour the temperature measurement is light scathe Some of the other scatheless temperature measurement ways can not be used in this system for precision size and mechanical structure problems [67] The ultrasound hyperthermia therapeusis is a long period and the insertion of the pinhead sensor may bring the pain and dread to the patients So an improved temperature measurement and control method for superficial tumour ultrasound hyperthermia therapeutic system is advanced
One ultrasound hyperthermia therapeutic period is about 4 to 6 times and one patient should have 2 to 3 times therapy per week according to the respective status The shape and the size may not change a lot after each therapy process It means that the distribution of tumour thermal field will not change a lot after each therapy process We should record the ultrasound power output of the therapy process in the first time of each therapy period and use the recorded data to control the rest therapy processes in the same therapy period It is to say that the pinhead sensor will not be inserted into the patient body and the rest therapy processes in the same therapy period are scatheless The improved method will greatly reduce the pain and dread of the patients The following part will verify the correctness and validity of the improved method
32 testify of the improved method The tissue-equivalent material experiments are designed to verify the correctness and validity of the improved method First of all choose one tissue-equivalent material with 8cm length 8cm width and 8cm height Insert the pinhead sensor into the middle of the tissue-equivalent material To simulate the tumour therapy process the pinhead sensor should be in the same position in each experiment Set the target temperature to the 350 380 400 420 separately and adjust the original temperature of the tissue-equivalent material After setting the target and original temperature add the ultrasound on the tissue-equivalent material and record the 60 minutes control voltage data that control the power of ultrasound output in a database Adjust the original temperature and use the recorded database to control the ultrasound outputs of the following experiments A lot of experiments have been done to verify the correctness and validity of the improved method To specify the result 2 temperature curves as shown in figure 2 are chosen
654
(a)
(b)original temperature curve
temperature curve when initial temperature is same to the original temperature of the first experiment
temperature curve when initial temperature is higher than the original temperature of the first experiment
temperature curve when initial temperature is smaller than the original temperature of the first experiment
(a) therapeutic time 60 minutes Target temperature 350 room temperature 20 original tissue-equivalent material temperature 243 set the tissue-equivalent material temperature higher than original temperature(258 )set the tissue-equivalent material temperature lower than original temperature(228 )
(b) therapeutic time 60 minutes Target temperature 420 room temperature 20 original tissue-equivalent material temperature 243 set the tissue-equivalent material temperature higher than original temperature(258 )set the tissue-equivalent material temperature lower than original temperature(228 )
Figure 2 Temperature curve of tissue-equivalent material experiments
655
Therapeutic period in temperature curve (a) and (b) of figure 2 is 60 minutes There are 3 temperature curves in each figure In figure 2(a) the original tissue-equivalent material temperature is 243 In the following experiments when the tissue-equivalent material temperature is same to the original temperature of the first experiment the temperature curve of monitor point is almost superposed with the original temperature curve under the control of the voltage data recorded in the database When the tissue-equivalent material temperature is 258 which is higher than original temperature of 243 the temperature of monitor point will exceed the target temperature during the therapy process But with the progress proceeding the temperature of monitor point will tend to the target temperature and superposed with the original temperature curve finally Furthermore If the tissue-equivalent material temperature is not much higher than the original temperature which is generally in 2 range the exceed temperature will also be in the therapy range When the tissue-equivalent material temperature is 228 which is lower than original temperature of 243 the temperature risen speed of monitor point will be slower than the original temperature curve But with the progress proceeding the temperature of monitor point will tend to the target temperature and superposed with the original temperature curve finally Adjust the parameters of the original temperature and the target temperature and do the same experiments as is described above temperature curves of figure 2(b) is got which have the same trend with the figure 2(a) The results of above experiments show that if the initial temperature of the following therapy process is quite near to the original temperature of the first therapy process the temperature curve is quite similar to the first therapy process
The following animal experiment is designed to verify the correctness and validity of the improved method
original temperature curve temperature curve when initial temperature is same to the
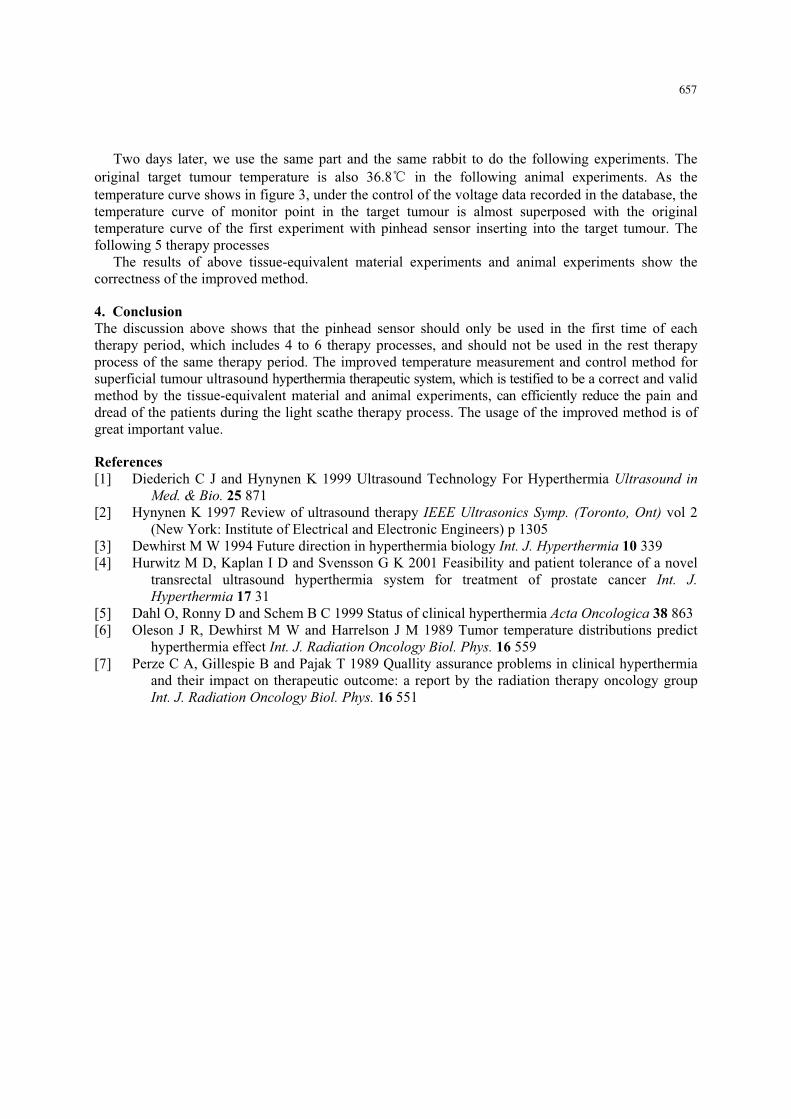
original temperature therapeutic time 60 min Target temperature 420 room temperature 20 original target tumour temperature of the first therapeutic process with inserting the pinhead sensor 368 original target tumour temperature of the second therapeutic process withoutinserting the pinhead sensor 368
Figure 3 Temperature curve of animal experiment
The rabbit with tumour in the back leg is chosen for the animal experiment Insert the pinhead sensor into the middle of the target tumour and set the target temperature to 420 The original target tumour temperature is 368 After setting the target temperature add the ultrasound on the tissue-equivalent material and record the 60 minutes control voltage data that control the power of ultrasound output in a database The temperature curve is shown in figure 3
656
Two days later we use the same part and the same rabbit to do the following experiments The original target tumour temperature is also 368 in the following animal experiments As the temperature curve shows in figure 3 under the control of the voltage data recorded in the database the temperature curve of monitor point in the target tumour is almost superposed with the original temperature curve of the first experiment with pinhead sensor inserting into the target tumour The following 5 therapy processes
The results of above tissue-equivalent material experiments and animal experiments show the correctness of the improved method
4 Conclusion The discussion above shows that the pinhead sensor should only be used in the first time of each therapy period which includes 4 to 6 therapy processes and should not be used in the rest therapy process of the same therapy period The improved temperature measurement and control method for superficial tumour ultrasound hyperthermia therapeutic system which is testified to be a correct and valid method by the tissue-equivalent material and animal experiments can efficiently reduce the pain and dread of the patients during the light scathe therapy process The usage of the improved method is of great important value
References [1] Diederich C J and Hynynen K 1999 Ultrasound Technology For Hyperthermia Ultrasound in
Med amp Bio 25 871 [2] Hynynen K 1997 Review of ultrasound therapy IEEE Ultrasonics Symp (Toronto Ont) vol 2
(New York Institute of Electrical and Electronic Engineers) p 1305 [3] Dewhirst M W 1994 Future direction in hyperthermia biology Int J Hyperthermia 10 339 [4] Hurwitz M D Kaplan I D and Svensson G K 2001 Feasibility and patient tolerance of a novel
transrectal ultrasound hyperthermia system for treatment of prostate cancer Int J Hyperthermia 17 31
[5] Dahl O Ronny D and Schem B C 1999 Status of clinical hyperthermia Acta Oncologica 38 863 [6] Oleson J R Dewhirst M W and Harrelson J M 1989 Tumor temperature distributions predict
hyperthermia effect Int J Radiation Oncology Biol Phys 16 559 [7] Perze C A Gillespie B and Pajak T 1989 Quallity assurance problems in clinical hyperthermia
and their impact on therapeutic outcome a report by the radiation therapy oncology group Int J Radiation Oncology Biol Phys 16 551
657
An Improved Tumour Temperature Measurement and Control Method for Superficial Tumour Ultrasound Hyperthermia Therapeutic System
G F Shen1 Y Z Chen and G X Ren
Biomedical Instrument Institute Shanghai Jiao Tong University Shanghai 200030 China
E-mail shenguofengsjtueducn
Abstract In tumour hyperthermia therapy the research on measurement and control of tumour temperature is very important Based on the hardware platform of superficial tumour ultrasound hyperthermia therapeutic system an improved tumour temperature measurement and control method is presented in this paper The experiment process data and results are discussed in detail The improved method will greatly reduce the pain and dread of the patients during the therapy period on the tumour temperature measurement and control by using the pinhead sensor
1 Introduction Cancer is a kind of disease that seriously threatens peoples health and lives It has been a long time for human being to struggle with cancer In recently hyperthermia has become a kind of new cancer therapy method after operation therapy radiopharmaceutical therapy and biology therapy [1-3]
Because cancer hyperthermia therapy have the high requirement of temperature measurement and control accuracy the research on characteristic of temperature measurement and control methods is required Based on the hardware platform of superficial tumour ultrasound hyperthermia therapeutic system an improved temperature measurement and control method will be discussed in this paper
2 Principles of superficial tumour ultrasound hyperthermia therapeutic system According to the theory of hyperthermia therapeusis the temperature of target tumour should be heated to 42 centigrade degree and kept it during the whole therapeutic process [45] The tumour will be withered after a long timersquos heating
The theory of superficial tumour ultrasound hyperthermia therapeutic system is shown in Figure 1 Ultrasound is amplified by power amplifier and sends energy to the target tumour by the ultrasound hyperthermia therapeutic head There are four pinhead sensors in the system One pinhead sensor is to measure the cooling water temperature and the other three pinhead sensors should be inserted into the target tumour monitor point and superficial cuticle during the therapy process To control the temperature of target tumour industry computer should measure the temperature and control the power output of ultrasound by some algorithms 1 Room 0816 Biomedical Instrument Institute Haoran Mansion Shanghai Jiao Tong University No1954 Huashan Road Xuhui District Shanghai China (postalcode 200030)
Institute of Physics Publishing Journal of Physics Conference Series 48 (2006) 653ndash657doi1010881742-6596481122 International Symposium on Instrumentation Science and Technology
653copy 2006 IOP Publishing Ltd
Figure 1 Theory of superficial tumour ultrasound hyperthermia therapeutic system
3 Description of improved method
31 Base of the improved method The discussion above shows that the measurement and control of target tumour temperature are the key techniques Because at least one pinhead sensor should be inserted into the target tumour the temperature measurement is light scathe Some of the other scatheless temperature measurement ways can not be used in this system for precision size and mechanical structure problems [67] The ultrasound hyperthermia therapeusis is a long period and the insertion of the pinhead sensor may bring the pain and dread to the patients So an improved temperature measurement and control method for superficial tumour ultrasound hyperthermia therapeutic system is advanced
One ultrasound hyperthermia therapeutic period is about 4 to 6 times and one patient should have 2 to 3 times therapy per week according to the respective status The shape and the size may not change a lot after each therapy process It means that the distribution of tumour thermal field will not change a lot after each therapy process We should record the ultrasound power output of the therapy process in the first time of each therapy period and use the recorded data to control the rest therapy processes in the same therapy period It is to say that the pinhead sensor will not be inserted into the patient body and the rest therapy processes in the same therapy period are scatheless The improved method will greatly reduce the pain and dread of the patients The following part will verify the correctness and validity of the improved method
32 testify of the improved method The tissue-equivalent material experiments are designed to verify the correctness and validity of the improved method First of all choose one tissue-equivalent material with 8cm length 8cm width and 8cm height Insert the pinhead sensor into the middle of the tissue-equivalent material To simulate the tumour therapy process the pinhead sensor should be in the same position in each experiment Set the target temperature to the 350 380 400 420 separately and adjust the original temperature of the tissue-equivalent material After setting the target and original temperature add the ultrasound on the tissue-equivalent material and record the 60 minutes control voltage data that control the power of ultrasound output in a database Adjust the original temperature and use the recorded database to control the ultrasound outputs of the following experiments A lot of experiments have been done to verify the correctness and validity of the improved method To specify the result 2 temperature curves as shown in figure 2 are chosen
654
(a)
(b)original temperature curve
temperature curve when initial temperature is same to the original temperature of the first experiment
temperature curve when initial temperature is higher than the original temperature of the first experiment
temperature curve when initial temperature is smaller than the original temperature of the first experiment
(a) therapeutic time 60 minutes Target temperature 350 room temperature 20 original tissue-equivalent material temperature 243 set the tissue-equivalent material temperature higher than original temperature(258 )set the tissue-equivalent material temperature lower than original temperature(228 )
(b) therapeutic time 60 minutes Target temperature 420 room temperature 20 original tissue-equivalent material temperature 243 set the tissue-equivalent material temperature higher than original temperature(258 )set the tissue-equivalent material temperature lower than original temperature(228 )
Figure 2 Temperature curve of tissue-equivalent material experiments
655
Therapeutic period in temperature curve (a) and (b) of figure 2 is 60 minutes There are 3 temperature curves in each figure In figure 2(a) the original tissue-equivalent material temperature is 243 In the following experiments when the tissue-equivalent material temperature is same to the original temperature of the first experiment the temperature curve of monitor point is almost superposed with the original temperature curve under the control of the voltage data recorded in the database When the tissue-equivalent material temperature is 258 which is higher than original temperature of 243 the temperature of monitor point will exceed the target temperature during the therapy process But with the progress proceeding the temperature of monitor point will tend to the target temperature and superposed with the original temperature curve finally Furthermore If the tissue-equivalent material temperature is not much higher than the original temperature which is generally in 2 range the exceed temperature will also be in the therapy range When the tissue-equivalent material temperature is 228 which is lower than original temperature of 243 the temperature risen speed of monitor point will be slower than the original temperature curve But with the progress proceeding the temperature of monitor point will tend to the target temperature and superposed with the original temperature curve finally Adjust the parameters of the original temperature and the target temperature and do the same experiments as is described above temperature curves of figure 2(b) is got which have the same trend with the figure 2(a) The results of above experiments show that if the initial temperature of the following therapy process is quite near to the original temperature of the first therapy process the temperature curve is quite similar to the first therapy process
The following animal experiment is designed to verify the correctness and validity of the improved method
original temperature curve temperature curve when initial temperature is same to the
original temperature therapeutic time 60 min Target temperature 420 room temperature 20 original target tumour temperature of the first therapeutic process with inserting the pinhead sensor 368 original target tumour temperature of the second therapeutic process withoutinserting the pinhead sensor 368
Figure 3 Temperature curve of animal experiment
The rabbit with tumour in the back leg is chosen for the animal experiment Insert the pinhead sensor into the middle of the target tumour and set the target temperature to 420 The original target tumour temperature is 368 After setting the target temperature add the ultrasound on the tissue-equivalent material and record the 60 minutes control voltage data that control the power of ultrasound output in a database The temperature curve is shown in figure 3
656
Two days later we use the same part and the same rabbit to do the following experiments The original target tumour temperature is also 368 in the following animal experiments As the temperature curve shows in figure 3 under the control of the voltage data recorded in the database the temperature curve of monitor point in the target tumour is almost superposed with the original temperature curve of the first experiment with pinhead sensor inserting into the target tumour The following 5 therapy processes
The results of above tissue-equivalent material experiments and animal experiments show the correctness of the improved method
4 Conclusion The discussion above shows that the pinhead sensor should only be used in the first time of each therapy period which includes 4 to 6 therapy processes and should not be used in the rest therapy process of the same therapy period The improved temperature measurement and control method for superficial tumour ultrasound hyperthermia therapeutic system which is testified to be a correct and valid method by the tissue-equivalent material and animal experiments can efficiently reduce the pain and dread of the patients during the light scathe therapy process The usage of the improved method is of great important value
References [1] Diederich C J and Hynynen K 1999 Ultrasound Technology For Hyperthermia Ultrasound in
Med amp Bio 25 871 [2] Hynynen K 1997 Review of ultrasound therapy IEEE Ultrasonics Symp (Toronto Ont) vol 2
(New York Institute of Electrical and Electronic Engineers) p 1305 [3] Dewhirst M W 1994 Future direction in hyperthermia biology Int J Hyperthermia 10 339 [4] Hurwitz M D Kaplan I D and Svensson G K 2001 Feasibility and patient tolerance of a novel
transrectal ultrasound hyperthermia system for treatment of prostate cancer Int J Hyperthermia 17 31
[5] Dahl O Ronny D and Schem B C 1999 Status of clinical hyperthermia Acta Oncologica 38 863 [6] Oleson J R Dewhirst M W and Harrelson J M 1989 Tumor temperature distributions predict
hyperthermia effect Int J Radiation Oncology Biol Phys 16 559 [7] Perze C A Gillespie B and Pajak T 1989 Quallity assurance problems in clinical hyperthermia
and their impact on therapeutic outcome a report by the radiation therapy oncology group Int J Radiation Oncology Biol Phys 16 551
657
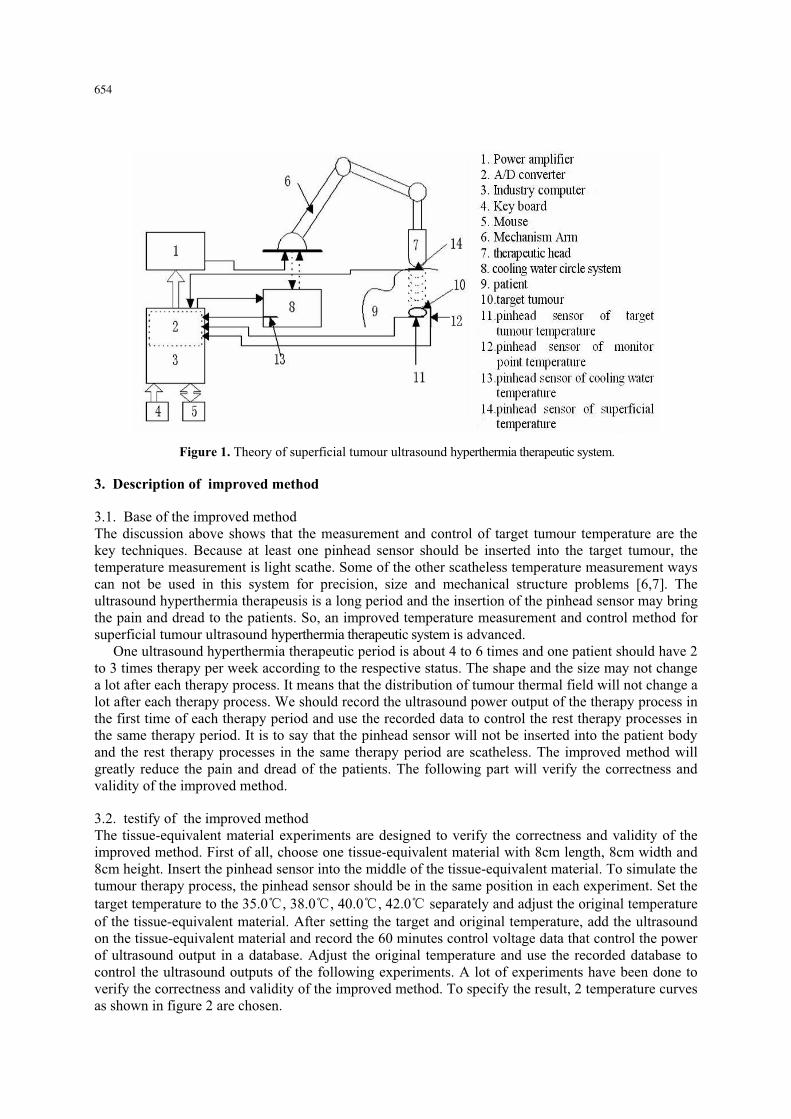
Related Documents