Tian et al.: An Impro©ed Optically Based PD Detection System for Continuous On-line Monitoring of HV Cables 1222 An Improved Optically Based PD Detection System for Continuous On-line Monitoring of HV Cables Y. Tian, P. L. Lewin The Tony Davies High Voltage Laboratory University of Southampton Southampton, Hampshire SO17 1BJ, UK J. S. Wilkinson Optoelectronics Research Centre University of Southampton Southampton, UK G. Schroeder Sudkabel GmbH ¨ Mannheim, Germany S. J. Sutton National Grid Transco plc Warwickshire, UK and S. G. Swingler The Tony Davies High Voltage Laboratory University of Southampton Southampton, Hampshire SO17 1BJ, UK ABSTRACT An optically-based remote sensing technique using a laser source, polarization ( ) scrambler, standard single mode fibers, fiber polarizer, electro-optic EO modula- tor and optical receiver, for continuous on-line monitoring of partial discharges ( ) PD in high voltage cable joints is proposed. Both the fiber polarizer and EO modulator, which are placed near cable joints, are passive without any power re- quirements. An EO modulator with no electrical bias, which operates close to the half-intensity point, was used and proved to have much better light transmission performance and higher measurement sensitivity than the bias modulator ap- proach investigated earlier. Various multiplexing techniques including optical switches and a fused fiber coupler have been investigated in order to implement multi-channel monitoring so that one laser source can be used to provide light to several fibers. The revised PD optical remote sensing technique has been applied to practical PD measurements on both 132 kV cable joint at the University of Southampton in the UK and 400 kV cable joints at Sudkabel GmbH in Germany. ¨ Obtained results have verified the principle and demonstrated the effectiveness of the developed technique. Index Terms — Partial discharge, electro-optic modulator, optical remote sensing, continuous on-line monitoring, high voltage cable joints, capacitive cou- pler. 1 INTRODUCTION Ž . ARTIAL discharge PD activity is a P prominent indicator of insulation defects. PD conven- Manuscript recei®ed on 23 No®ember 2004, in final form 24 May 2005. tional electrical measurement has been used for many years as a non-destructive off-line testing technique for insulation evaluation. Conventional PD measurement can detect the permissible discharge quantity expressed as an apparent charge, but it is not suitable for online applica- tions due to its requirements for a coupling capacitor etc. 1070-9878 r 05 r $20.00 2005 IEEE Authorized licensed use limited to: UNIVERSITY OF SOUTHAMPTON. Downloaded on July 22, 2009 at 09:44 from IEEE Xplore. Restrictions apply.

Welcome message from author
This document is posted to help you gain knowledge. Please leave a comment to let me know what you think about it! Share it to your friends and learn new things together.
Transcript
Tian et al.: An Impro©ed Optically Based PD Detection System for Continuous On-line Monitoring of HV Cables1222
An Improved Optically Based PD Detection System forContinuous On-line Monitoring of HV Cables
Y. Tian, P. L. LewinThe Tony Davies High Voltage Laboratory
University of SouthamptonSouthampton, Hampshire SO17 1BJ, UK
J. S. WilkinsonOptoelectronics Research Centre
University of SouthamptonSouthampton, UK
G. SchroederSudkabel GmbH¨
Mannheim, Germany
S. J. SuttonNational Grid Transco plc
Warwickshire, UK
and S. G. SwinglerThe Tony Davies High Voltage Laboratory
University of SouthamptonSouthampton, Hampshire SO17 1BJ, UK
ABSTRACTAn optically-based remote sensing technique using a laser source, polarization
( )scrambler, standard single mode fibers, fiber polarizer, electro-optic EO modula-tor and optical receiver, for continuous on-line monitoring of partial discharges( )PD in high voltage cable joints is proposed. Both the fiber polarizer and EOmodulator, which are placed near cable joints, are passive without any power re-quirements. An EO modulator with no electrical bias, which operates close to thehalf-intensity point, was used and proved to have much better light transmissionperformance and higher measurement sensitivity than the bias modulator ap-proach investigated earlier. Various multiplexing techniques including opticalswitches and a fused fiber coupler have been investigated in order to implementmulti-channel monitoring so that one laser source can be used to provide light toseveral fibers. The revised PD optical remote sensing technique has been appliedto practical PD measurements on both 132 kV cable joint at the University ofSouthampton in the UK and 400 kV cable joints at Sudkabel GmbH in Germany.¨Obtained results have verified the principle and demonstrated the effectiveness ofthe developed technique.
Index Terms — Partial discharge, electro-optic modulator, optical remotesensing, continuous on-line monitoring, high voltage cable joints, capacitive cou-pler.
1 INTRODUCTIONŽ .A R T IA L d isc h a rg e P D a c tiv ity is aPprominent indicator of insulation defects. PD conven-
Manuscript recei®ed on 23 No®ember 2004, in final form 24 May 2005.
tional electrical measurement has been used for manyyears as a non-destructive off-line testing technique forinsulation evaluation. Conventional PD measurement candetect the permissible discharge quantity expressed as anapparent charge, but it is not suitable for online applica-tions due to its requirements for a coupling capacitor etc.
1070-9878rrrrr05rrrrr$20.00 � 2005 IEEE
Authorized licensed use limited to: UNIVERSITY OF SOUTHAMPTON. Downloaded on July 22, 2009 at 09:44 from IEEE Xplore. Restrictions apply.

IEEE Transactions on Dielectrics and Electrical Insulation Vol. 12, No. 6; December 2005 1223
Online PD measurements provide information about insu-lation faults under operational stress or defects intro-duced during transportation or installation. XLPE cableitself has undergone manufacturing quality control as wellas PD testing at the factory before delivery. Defects suchas particles and voids have been removed. For this reasonon-line PD monitoring systems for cables should predomi-nantly cover the accessories, which are more prone toproblems due to the installation procedure and subse-quent operational stresses.
The likelihood of a fault occurring within a HV trans-mission cable system can be described as the ‘bath-tub’effect. Initially, fault likelihood is high mainly due toproblems associated with installation. This can be mini-mized and removed by performing a series of after-layingtests. Then for many years there is minimal likelihood offault, mainly because of the strict production and qualitycontrols of cable manufacturers. After many years in ser-vice, i.e. 30-40 years, the likelihood of a cable fault risesagain, due to factors such as dielectric ageing, over-volt-age operations, repetitive thermal cycling, growth of elec-trical trees and water trees. Continuous on-line monitor-ing can provide information about progressing degrada-tion or deterioration under normal operational stresses,thus reducing the likelihood of an occurrence of break-down. Breakdown of a cable circuit can lead to severeeconomic losses for the system operator and severe dis-ruption for customers. Therefore even for the period oflow fault likelihood it is still advisable to have continuouson-line monitoring in order to detect any spontaneousfault condition that may cause the occurrence of break-down. Additionally, the measured data and experienceobtained over this time will be valuable for condition as-sessment of the system as it ages. Considering that manyHV cable circuits are buried, it is advantageous to installdata transmission links such as optic fibers and compactpassive sensors for continuous on-line monitoring, at thetime the cables are buried, ensuring that on-line PD mon-itoring is available during the whole of the system life-time.
It is important to establish the data acquisition, trans-mission and processing methodologies for continuous on-
w xline PD monitoring 1 . Data acquisition for PD detectionin cable systems usually involves non-conventional electri-
w xcal coupling techniques including capacitive couplers 2-6 ;w xscreen interruptions 6 ; inductive high frequency current
Ž . w xtransformers HFCT either around the cable itself 7 orw x w xthe earth connection 3 ; directional couplers 8 ; and foil
w xelectrodes on cable joints 9 ; as well as acoustic emissionŽ . w xAE techniques 3, 10 . Electrical coupling techniqueswork across various frequency ranges from a few MHz toseveral hundred MHz. An effective PD sensor should becompact and easy to install, with a good signal to noiseratio and sensitive to PDs of a few pC, and potentiallycapable of expressing discharge quantity in pC. The
acoustic emission technique has the advantage of beingimmune from electrical interference. However, acousticemission attenuation within HV cables significantly re-duces measurement sensitivity and makes it impossible tocalibrate. AE techniques are more suited for PD monitor-ing in power transformers, switchgear or GIS, where theyare immune to the excessive electrical noise that may existat the measurement site. The capacitive coupling tech-nique has been extensively investigated by the authors andhas proved to be an effective PD detection sensor for HV
w xcables 2, 3, 5, 6 .
High frequency components of PD signals are rapidlyattenuated as they propagate along a HV cable. Sensorsmust be placed near to a PD source in order to obtain agood sensitivity. The detected PD signals from cable jointsneed to be transmitted over a long distance to the substa-tion for further signal processing and analysis. Comparedwith transmission via coaxial electrical cables, data trans-
Žmission via optical fiber has minimal attenuation 0.2.dBrkm and is immune from electrical interference. The
optical fiber also provides electrical isolation of the mea-suring equipment. Generally, measured electrical signalsare fed into an optical transmitter or an acquisition unitwith digitizer and communication port, to be convertedinto optical signals, which are then transmitted over thetypical optical fibre or digital fibre. However, either theoptical transmitter or acquisition unit, which are placednearby the PD sensors and cable joints, require a powersupply to operate, although they can operate using batterypower for a limited period of time. Consequently such sys-tems are suitable for commissioning PD tests after cablelaying, and are not really suitable for continuous onlinemonitoring of PD activities in situations where there areno local power sources, for example buried cable circuits.
A novel PD continuous monitoring technique has beenw xproposed by the authors 11 . The measurement mecha-
nism applies capacitive coupler measured PD signalsŽ .across a Lithium Niobate LiNbO electro-optic modula-3
Ž .tor EOM , which modulates the intensity of the transmit-ted laser light as an approximately linear function of thevoltage applied across it. This technique does not requirea power supply near to the cable joints as the EO modula-tor is passive. In this system a fiber laser provides linearlypolarized light output via an optical fiber to the EOMinput, and monitors the optical output from the EOM us-ing an optical receiver. The EO modulator is polarizationdependent and by nature laser diodes give polarized lightoutput. This system was developed to suit the concept ofremote monitoring of PD activity in a cable system. Hence,a very long optical fiber is used as a means of data trans-mission from the laser source to the EO modulator andfrom the EO modulator to the optical receiver. If the ca-bles were directly buried, the fiber optics could be in-stalled at the same time. The installation of the fiber wouldbe easier in tunnel installations, which are becoming more
Authorized licensed use limited to: UNIVERSITY OF SOUTHAMPTON. Downloaded on July 22, 2009 at 09:44 from IEEE Xplore. Restrictions apply.

Tian et al.: An Impro©ed Optically Based PD Detection System for Continuous On-line Monitoring of HV Cables1224
widely used. Any polarized light will become randomly po-larized after travelling a long distance and consequentlythe EO modulator may not function properly and mightbe totally unresponsive to any electrical modulation sig-nals. A polarization controller has therefore been in-cluded to control the polarization state of input light tothe polarization dependent EO modulator. This must betuned by hand to ensure that the modulator functions ef-ficiently. However this is not convenient for continuouson-line monitoring as automatic data acquisition is desir-able.
This paper investigates the further development of thePD optical remote sensing technique. Alternative ap-proaches to replace the polarization controller, such as
Ž .polarization maintaining PM fiber, polarization indepen-Ž .dent PI modulator, and polarization scrambler com-
bined with fiber polarizer have been investigated. The useof a bias-free EO modulator for replacement of the mod-ulator with an electrical bias port has also been investi-gated. The bias-free modulator is a device in which thebias point of the EO modulator is set to operate at aboutthe half-intensity point. Considering a practical three-phase cable circuit of several kilometers, there are manycable joints along the line. Each individual joint needs tobe monitored for PD activity. Consequently a continuousPD on-line monitoring system for cable systems requires amulti-channel monitoring system. Based on this consider-ation various optical multiplexing techniques including us-ing an optical switch or a fused fibre coupler have beeninvestigated, so that one laser source can be used to pro-vide light to several optical modulators. Finally the im-proved PD optical remote sensing technique has been ap-plied to practical PD measurements on both a 132 kV ca-ble joint in the HV lab at the University of Southampton,UK and 400 kV cable joints at Sudkabel GmbH in¨Mannheim, Germany. Both the EO modulator and theoptical receiver are broadband with frequency bandwidthof 2.5 GHz and 1 GHz respectively. Consequently the fre-quency response of the optical measurement system is de-termined by the PD sensor, which generally operates in amaximal frequency range of several hundred MHz. Previ-ous investigation has also indicated that the optical mea-surement system itself does not cause measurable changes
w xin the signal frequency characteristics 11 . Therefore inthis paper, measurements and signal processing are onlydiscussed in the time domain. Obtained results are veryencouraging and indicate the viability of this technique forcontinuous on-line PD monitoring applications. Overallthe proposed PD optical remote sensing technique has thefollowing advantages: it is immune to any electromagneticinterference; there is very little signal transmission attenu-ation; it has high detection sensitivity; it is passive withouta power supply requirement; it can be buried under-ground; it provides electrical isolation and protection toboth personnel and measurement equipment; it is com-pact and convenient to use.
2 THE OPTICAL REMOTE SENSINGTECHNIQUE
2.1 IMPLEMENTATION OF AUTOMATICOPTICAL REMOTE SENSING
Readily available, low-cost, electro-optic modulators arenormally strongly polarization dependent. For remotemonitoring of PD activity in a cable system, a long opticalfiber must be used as a means of data transmission fromthe laser source to the EO modulator and from the EOmodulator to the optical receiver. Any polarized light willbecome randomly polarized after travelling a long dis-tance in conventional fiber and in such case the EO mod-ulator would not function properly and might be totallyunresponsive to any electrical modulation signals. Toovercome this problem a polarization controller has beenincluded to control the polarization state of the laser lightto match the polarization sensitive EO modulator, asshown in Figure 1a. This must be tuned by hand to ensurethat the modulator functions efficiently. However this isnot convenient for continuous online monitoring as auto-matic data acquisition is desirable. In this section, ap-proaches for removing this manually operated device areconsidered.
2.1.1 POLARIZATION MAINTAINING FIBER
Various approaches were considered to replace the po-larization controller. One option is to use polarization
Ž .maintaining PM fiber instead of standard single modeŽ .SM fibre between the laser source and the EO modula-tor, as shown in Figure 1b. PM fiber is a type of singlemode fiber that preserves the polarization of light as ittravels through the fiber’s length. For a very long cableroute, very long optical fibers are needed from the lasersource in the substation to the EO modulator in the cabletunnel and equally from the EO modulator to the opticalreceiver in the substation. The typical price of PM fiberŽ .�US$13,000rkm is over 30 times more expensive than
Ž .SM fiber �US$400rkm . In addition, the attenuation forŽthe standard SMF-28 fiber of 0.2 dBrkm at 1550 nm
.wavelength is much less than the attenuation for the PMŽ .fiber of 2 dBrkm at 1550 nm wavelength . Therefore the
use of PM fiber is both uneconomical and would result indegraded signal to noise ratio when compared with theuse of single mode fiber.
2.1.2 POLARIZATION INDEPENDENTELECTRO-OPTIC MODULATOR
Ž .Another option is to use polarization independent PIEO modulators, which would allow SM fiber to be appliedbetween the laser source and the modulator, as shown inFigure 1c. However, although feasibility studies were car-ried out regarding polarization independent EO modula-tors, so far there are very few functioning modulators ofthis type available on the commercial market. A polariza-
Authorized licensed use limited to: UNIVERSITY OF SOUTHAMPTON. Downloaded on July 22, 2009 at 09:44 from IEEE Xplore. Restrictions apply.

IEEE Transactions on Dielectrics and Electrical Insulation Vol. 12, No. 6; December 2005 1225
Figure 1. Optical remote sensing techniques. a, using polarization controller; b, using polarization maintaining fiber; c, using polarizationindependent electro-optic modulator; d, using scrambler combined with in-line polarizer.
tion independent EOM was found with price of about US$20,000, which is ten times more expensive than a stan-
Ž .dard EOM typically less than US $2000 . For a three-phase cable circuit of tens of kilometres, there would be alarge number of cable joints. If a PI-EOM were requiredfor each PD sensor at each cable joint, this option wouldprove prohibitively expensive.
2.1.3 SCRAMBLER COMBINED WITH IN-LINEPOLARIZER
A revised PD remote optical sensing system is proposedin this paper, as shown in Figure 1d. For this research anelectrically driven scrambler was applied. A polarizationscrambler is a device which actively changes the state ofpolarization using the polarization modulation method.The scrambler manipulates the state of polarization withina single mode fiber by employing a magnetically drivenfiber squeezing technique, which produces mechanicalpressure sufficient to introduce a phase change in the po-larization over 360� in scale. The input polarizationthrough the device can then be converted into any desiredoutput polarization. This method also has low activation
loss and no intrinsic back reflection. The scrambler is con-trolled by three �5 V input voltages each set to a uniquefrequency of either 11 Hz, or 31 Hz or 71 Hz.
The scrambler scrambles the linearly polarized lightfrom the laser source and the resultant unpolarized lightis then transmitted over standard SM fiber to an in-linepolarizer. The polarizer is used to polarize the light andcouple it into a second fiber. In principle the polarizerconsists of a fiber collimator at the input end, a polarizingplate, and focusing optics on the output end. The outputpolarization state of the polarizer has been aligned withthe input polarization requirement of the EO modulator.The polarizer has a short 0.5m long polarization maintain-ing output fiber which is connected to the normal polar-ization dependent EO modulator. Both the polarizer andthe EO modulator are placed close to the cable joint. Theinput fiber of the polarizer does not require PM fiber;therefore a long SM fiber can be used between the polar-izer and the scrambler. The polarizer has a 0.8 dB of in-sertion loss. The typical price for the scrambler and thepolarizer is US$900 and US$400 respectively. Conse-quently the cost of the revised optical remote sensing sys-
Authorized licensed use limited to: UNIVERSITY OF SOUTHAMPTON. Downloaded on July 22, 2009 at 09:44 from IEEE Xplore. Restrictions apply.

Tian et al.: An Impro©ed Optically Based PD Detection System for Continuous On-line Monitoring of HV Cables1226
Figure 2. Optical receiver output with the pulse generator outputused as the EOM input signal. a, using ‘scrambler q polarizer’ ar-rangement; b, using ‘controller’ arrangement; c, pulse generator out-put pulse.
tem is significantly reduced compared with either usingpolarization maintaining fiber or a polarization indepen-dent EO modulator.
Experiments were carried out to investigate the feasibil-ity and performance of the proposed PD optical remotesensing system. Initially a pulse generator was used toprovide the electrical signal input into the EO modulator.Figure 2 shows the pulse generator output pulse and theoptical receiver measured pulses. Figure 2a shows the op-tical receiver measured pulse using experimental arrange-ment using scrambler and polarizer, as shown in Figure1d; Figure 2b shows the optical receiver measured pulseusing experimental arrangement shown in Figure 1a, inthis case the polarization controller was tuned to obtainthe optimally polarized light for the EO modulator; Fig-ure 2c is the relevant electrical pulse from the pulse gen-erator. Obtained result indicates that there is about 10%of signal loss when the scrambler and polarizer are usedinstead of the polarization controller. This experiment in-dicates the feasibility of the proposed automatic opticalremote sensing system.
2.2 COMPARISON BETWEEN WITH-BIASAND BIAS-FREE EO MODULATORS
The with-bias electro-optic modulator used was a 2.5Ž .Gbrs LiNbO modulator Aeroflex-Trilink Corp. USA . At3
1550 nm wavelength and 25�C, the modulator has an ex-tinction ratio of 22 dB, an insertion loss of 2.6 dB, andmaximal RF input voltage of 2.6 V. It has a PM fibre in-put and single-mode fiber output. The modulator package
Ž 3.has dimensions of 80�10�10 mm .
The modulator has a dc bias port and a V value of 6 V.�
V is the voltage required to switch the modulator from�
fully off to fully on. The effect of the applied dc bias volt-age on the transmitted laser light has been investigated
Figure 3. EOM dc bias voltage vs. photoreceiver dc bias offsetŽ .transmitted light power .
using an experimental arrangement similar to Figure 1a.In this case no signals are connected to the modulator’sRF input port. The photoreceiver has a responsivity of1ArW at a wavelength of 1550 nm, and the gain of the dccomponent monitor is 10 VrmA. Consequently the pho-toreceiver dc component monitor has a responsivity of 10VrmW. Obtained experimental results are shown in Fig-ure 3. It should be noted that the phase is not balanced at0 V, so that V occurred at 5.5 V rather than 6 V. Conse-�
quently the optimum bias point is at around 2.5 V and 8.5V in such case.
A narrow pulse from the pulse generator with a risetime of 1ns was then injected into the modulator’s RF in-put port, with different dc voltages applied to the modula-tor dc bias port. The modulated signal was measured us-ing the RF output port of the photoreceiver, as shown inFigure 4. Pulses of highest magnitude were obtained whenbias voltages of around either 2.5 V or 8.5 V were appliedto the modulator, and pulses of lowest magnitude wereobtained when bias voltages of either 5.5 V or 11.5 V wereapplied. These agree with the results shown in Figure 3. Adifferent polarity was obtained when the dc bias voltage isin the range of 0-5 V compared with the dc bias voltage inthe range of 6-11 V. At 5.5 V and 11.5 V the measuredpulse shows both positive and negative polarities. Ob-tained results indicate that the modulator should be suit-ably biased to operate at about the half-intensity point,where a linear modulation response can be achieved andmaximal sensitivity obtained.
Most commercial electro-optic modulators have a dcbias port. However, a 2.5 Gbrs bias-free JDS Uniphase�
modulator was found to replace the with-bias modulator.The bias point of the interferometer is set to operate atthe half-intensity point using physical imbalance ratherthan an electrical bias signal. Therefore a bias control cir-cuit is not required. The modulator has an extinction ratioof greater than 20 dB, an insertion loss of less than 4.5dB, maximal RF input voltage of 3.5 V, and operatingwavelength between 1535 to 1565 nm. It has a PM fiberinput and single-mode SMF-28 fiber output. The pack-aged modulator has smaller dimensions of 45�10�7 mm3.
Authorized licensed use limited to: UNIVERSITY OF SOUTHAMPTON. Downloaded on July 22, 2009 at 09:44 from IEEE Xplore. Restrictions apply.

IEEE Transactions on Dielectrics and Electrical Insulation Vol. 12, No. 6; December 2005 1227
Figure 4. Effect of the dc bias voltage on the modulator performance.
Experiments were carried out to compare the perfor-mance of the bias-free modulator and the with-bias modu-lator. For this experiment the PM input fiber of bothmodulators were directly connected to the laser source.The arrangement is similar to Figure 1a except that in thiscase the polarization controller was removed. When thelaser controller current is 200 mA, the laser source pro-vides an output light power of around 9 mW, the dc moni-tor bias output of the photo receiver is 2V for the with-biasmodulator and 15V for the bias-free modulator. In thiscase there is no RF signal input to the modulator and nodc bias input for the with-bias modulator. Therefore, thewith-bias modulator and the bias-free modulator transmit-ted 0.2 mW and 1.5 mW respectively for a light input of 9mW, indicating that the bias-free modulator has muchbetter light transmission performance than the with-biasmodulator without applied DC bias voltage. A pulse fromthe pulse generator was used as the same input to the twomodulator RF input ports, and subsequently measuredfrom the photoreceiver RF output port. Figure 5 indicatesthat the bias-free modulator provides a signal with magni-
Žtude four times higher than the with-bias modulator when.no voltage is applied to the bias port .
2.3 OPTICAL MULTIPLEXINGTECHNIQUES
A continuous PD on-line monitoring system for HV ca-ble circuits must be a multi-channel monitoring system.While the principle of the optical remote sensing tech-
Figure 5. Comparison between the with-bias and bias-free modula-tor.
nique has been established, significant challenges remainin how to implement data acquisition and transmission fora multi-channel system.
The laser source used in the optical remote sensingtechnique is a compact single wavelength distributed feed-back fiber laser designed to provide narrow line width,
Ž .low relative intensity noise RIN and phase noise, andvery good wavelength stabilization. It is suitable for use inoptical sensing. However, this fiber laser source is expen-sive. If a multi-channel system simply consisted of manyindividual monitoring circuits with each circuit requiring a
Authorized licensed use limited to: UNIVERSITY OF SOUTHAMPTON. Downloaded on July 22, 2009 at 09:44 from IEEE Xplore. Restrictions apply.

Tian et al.: An Impro©ed Optically Based PD Detection System for Continuous On-line Monitoring of HV Cables1228
fiber laser, the whole system would be very costly. Thusvarious optical multiplexing techniques have been consid-ered such that one laser source can be used to providelight to several modulators.
2.3.1 MULTIPLEXING USING AN OPTICALSWITCH
An optical switch is a device that transfers light fromone or multiple input ports to one or multiple output ports.In a fiber optic network, the optical switch’s ability tochange between light paths makes it an indispensable ba-sic component in network construction. There are a vari-ety of optical switches commercially available in the in-dustry using different switching techniques, namely theopto-mechanical switch, the thermo-optic switch and theelectro-optic switch. Opto-mechanical switches are theoldest type of optical switch and currently are the mostwidely deployed. These devices achieve switching by mov-ing fiber or other bulk optic elements by means of steppermotors or relay arms. This causes them to be relativelyslow with switching times in the 10-100 ms range. Theycan achieve excellent reliability, minimal insertion loss,and minimal crosstalk. These devices are more bulky thanother alternatives, although new micro-mechanical de-vices overcome this. Thermo-optic switches are normallybased on waveguides made in polymers or silica. For op-eration, they rely on the change of refractive index withtemperature created by a resistive heater placed above thewaveguide. Electro-optic switches are typically ferroelec-tric, and their operation depends on the change of refrac-tive index with electric field. This characteristic makesthem intrinsically high-speed devices with low power con-sumption. However, neither the electro-optic northermo-optic optical switches can yet match performanceof opto-mechanical designs in term of the insertion loss,back reflection, and long-term stability.
Figure 6 details a multi-channel monitoring system us-ing an optical switch. For this arrangement only one lasersource is required. The optical switch acts as an opticalmultiplexer to enable the laser light to transmit over dif-
ferent optic fibers to EO modulators. Channel selectioncan be performed using an external electronic control cir-cuit attached to the switch.
The capacitive coupler works in the very high frequencyrange up to 300 MHz, consequently the sampling rate mustbe at least 600 MSrs. For two capacitive couplers workingat the same time, a sampling of more than 1200 MSrs isrequired. Therefore, the optical switch used needs to becapable of operating at a very high speed i.e. 1200 MHz inorder to capture all of the measured signals from partialdischarge activities in two cable joints. Such high-speedoptical switches are difficult to source. One ultra-highspeed 1�2 switch was found with a switching time of lessthan 100 ps, insertion loss less than 3.5 dB and crosstalkless than y20 dB, at a price of US$7000. For a similarswitch with slower switching time of 10 to 100 ns, the priceis US$4000. An additional electronic control circuit needsto be designed to work with the optical switch.
Indeed most optical switches are the opto-mechanicaltypes having much slower switching time range of 5 to 30ms, though with lower prices. If such switches are used,there will be some ‘lock-out’ time for any of the monitor-ing channels. This means that any monitors relating to ca-ble joints are not practically operating continuously but at
Ž .a time interval tens of ms . This methodology would stillbe able to detect insulation faults within the cable jointsdue to long-term degradation and prevent the occurrenceof such kinds of breakdown, but it may not be able todetect faults that cause spontaneous breakdown.
2.3.2 FUSED FIBRE OPTIC COUPLER
Given the problems associated with using an opticalswitch a fused fiber optic coupler has been used to realizeoptical multiplexing. A fiber coupler splits optical light be-tween two fibers, or combines optical signals from twofibers into one fiber. The fiber coupler is constructed byfusing and tapering two fibers together. This method pro-vides a simple, rugged and compact method of splittingand combining optical signals. The used fiber coupler hasa typical excess loss as low as 0.2 dB, directivity better
Figure 6. A multi-channel monitoring system using an optical switch.
Authorized licensed use limited to: UNIVERSITY OF SOUTHAMPTON. Downloaded on July 22, 2009 at 09:44 from IEEE Xplore. Restrictions apply.

IEEE Transactions on Dielectrics and Electrical Insulation Vol. 12, No. 6; December 2005 1229
Figure 7. Arrangement to investigate the performance of the fusedfiber coupler.
Žthan 50 dB, and splitting ratio the ratio of power between.the two output fibers accurate to within �3 percent at
the design wavelength. The limitation of the fused fiberoptic coupler lies in the fact that it is highly wavelengthdependent. A difference in wavelength of only 10nm cancause a significant change in the splitting ratio. As a resultit is important to specify the exact wavelength at whichthe fused coupler will be used. This is not a problem forthis research as the current laser source used has very goodwavelength stabilization. Furthermore, for a fiber couplermade from polarization maintaining fiber, there is an ad-ditional limitation of not maintaining polarization well atthe fusion point, making it sensitive to temperature or vi-bration. As a result it is not well suited for polarizationapplications. Again this is not a problem for the proposedmeasurement system, as the fiber coupler is fed with un-polarized light from the scrambler.
Experiments were carried out to investigate the perfor-mance of the fused fiber optic coupler, as shown in Figure7. The PD signal is simulated by injecting a step wave withmagnitude of 1 V and rise time of 1ns from the pulsegenerator into a XLPE cable section via a 10 pF capaci-tor. In theory the injected charge is equivalent to 10 pC,which is then measured by a capacitive coupler installedonto the cable section. The experiments were carried out
Ž .in three steps: 1 the laser source was directly connectedŽ .to the EOM; 2 the laser source was connected to the
Ž .scrambler and then to the polarizer and EOM; 3 thelaser source was connected to the scrambler, then to thefiber coupler, and finally to the polarizer and EOM. TheEOM RF input is the same signal from the capacitive cou-pler.
Figure 8 shows the results for the three experimentalarrangements. In this case, using a scrambler and polar-izer reduces the signal magnitude by about 20-25% com-pared with the laser light being directly input into theEOM. The fibre coupler halves the light power, which re-sults in 50% of signal magnitude measured by the opticalreceiver, as shown in Figures 8b and 8c.
The fused fiber coupler can be in the form of 1�N.Obviously the laser source should provide enough powerto drive multiple paths. It is estimated that a laser sourcewith output power of 100 mW may be able to drive 30
Figure 8. Simulation results using three experimental arrange-ments. a, laser-EOM; b, laser-scrambler-polarizer-EOM; c, laser-scrambler-coupler-polarizer-EOM.
optical paths, which would correspond to 10 three-phasecable joints, if each joint is monitored using one PD sen-sor.
3 PD MEASUREMENTS ON A 132 KVCABLE JOINT
The optical remote sensing technique has been appliedto detect partial discharges produced at a 132 kVcablerjoint loop. The test arrangement is shown in Figure9. Two 132 kV XLPE cable sections are connected by aprefabricated cable joint. The main insulation material of
Ž .the cable joint is ethylene propylene rubber EPR ,whereas the cable insulation is XLPE. The cable ends areconnected to oil-filled terminations. Conventional PDelectrical detection was also applied to provide the appar-ent discharge quantity. Conducting paint in the shape of‘v’ was installed on top of the cable XLPE between the
Ž .cable joint stress cone conductor and the cable joint outersemiconducting layer. This acted as the PD source withinthe cable joint. The capacitive couplers were installed onthe cable section close to the cable joint.
Figure 9. Application of the optical remote sensing technique todetect PDs within a 132 kV cable joint.
Authorized licensed use limited to: UNIVERSITY OF SOUTHAMPTON. Downloaded on July 22, 2009 at 09:44 from IEEE Xplore. Restrictions apply.

Tian et al.: An Impro©ed Optically Based PD Detection System for Continuous On-line Monitoring of HV Cables1230
Figure 10. Practical PD signals measured using the laser - con-troller - ‘with-bias’ EOM arrangement, at different applied voltagesand laser controller currents. a, 40 kV, 150 mA; b, 40 kV, 190 mA; c,60 kV, 150 mA; d, 60 kV, 190 mA.
Initially the with-bias modulator was used and the ex-perimental arrangement is as shown in Figure 1a. The lasersource was connected to the polarisation controller andthen to the EO modulator. PD measurements were car-ried out at test voltages of 40 kV and 60 kV, with lasercontrolling currents of 150 mA and 190 mA respectively.Obtained results are shown in Figure 10. Concurrent PDmeasurements from the Robinson� PD detector revealsthat the PD level is around 100 - 130 pC at 40 kV, and 250y 280 pC at 60 kV. The laser controlling current has asignificant effect on the measured signals. The larger thecontroller current, the higher the output light power fromthe laser source, and this in turn leads to larger measuredsignals from the optical receiver.
PD measurements were then carried out using thebias-free EOM instead of the with-bias EOM, while other
Figure 11. PD signals measured using the laser - controller - ‘bias-free’ EOM arrangement, at different applied voltages and laser con-troller currents. a, 40 kV, 150 mA; b, 40 kV, 190 mA; c, 60 kV, 150mA; d, 60 kV, 190 mA.
Figure 12. A capacitive coupler measured PD signal at 60 kV.
Figure 13. PD signals measured using the laser - scrambler - polar-izer - ‘bias-free’ EOM arrangement. a, 40 kV, 120 mA; b, 40 kV, 150mA; c, 40 kV, 190 mA.
Žarrangements were unchanged. The obtained results Fig-.ure 11 confirmed that the bias-free EOM has much higher
measurement sensitivity than the with-bias EOM. Forcomparison Figure 12 shows a PD signal measured di-rectly by the capacitive coupler at a test voltage of 60 kV.Practical PD measurements on the 132 kV cable joint wasthen carried out using the scrambler combined with polar-izer arrangement, as shown in Figure 1d. In this case theEOM used is the bias-free modulator. The obtained re-sults are shown in Figure 13. Again concurrent PD mea-surements from the Robinson� PD detector reveals thatthe PD level is around 100 y 130 pC at 40 kV. In thiscase the use of scrambler and polarizer also reduces themeasured PD signal. Since PD is a stochastic process, it isdifficult to establish an accurate reduction percentage forpractical PD measurements. However, analysis of the sig-nal to noise ratio indicates that the measurement sensitiv-ity is still very good, around 5 y 10 pC in this case.
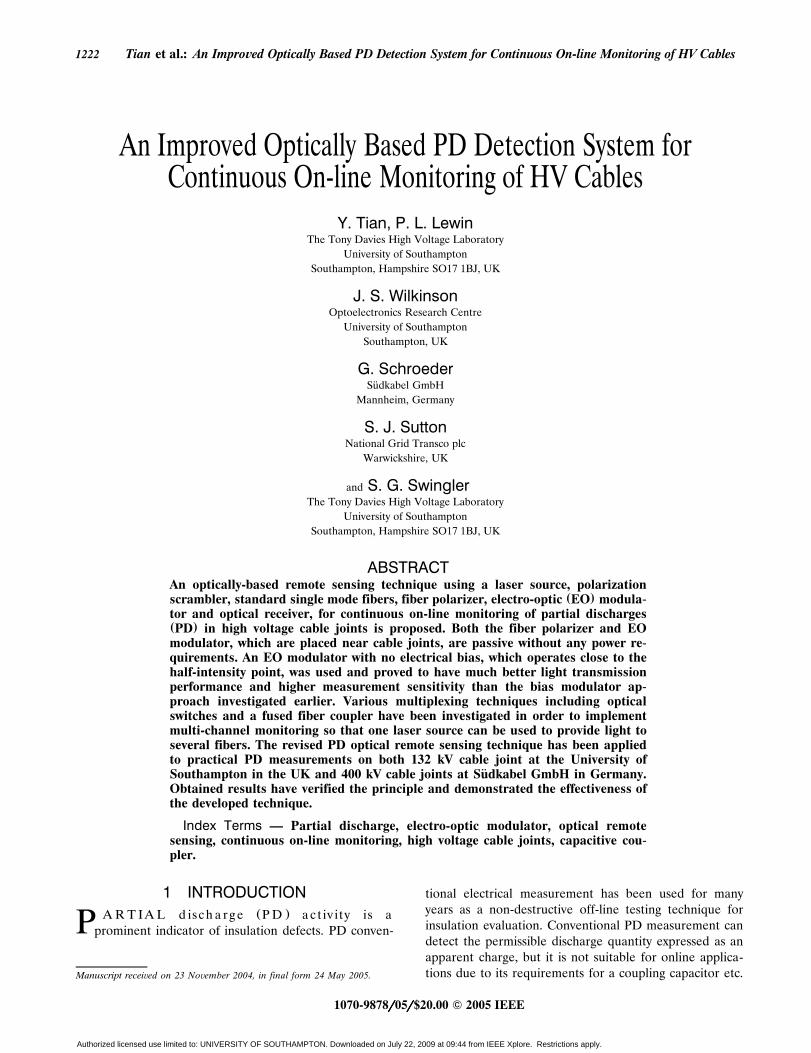
Figure 14 shows the PD signal measured by the opticalreceiver and the PD conventional detector respectively, ata test voltage of 40 kV, using the laser - scrambler - polar-
Authorized licensed use limited to: UNIVERSITY OF SOUTHAMPTON. Downloaded on July 22, 2009 at 09:44 from IEEE Xplore. Restrictions apply.
IEEE Transactions on Dielectrics and Electrical Insulation Vol. 12, No. 6; December 2005 1231
Figure 14. PD signals measured by the optical receiver, conven-tional PD detector, and the 50 pC calibration pulse.
izer - bias free EOM arrangement. In this case the sam-Ž .pling rate is 500 MSrs 25,000 points on 50 �s time scale .
The 50 pC calibration pulse from the conventional PDdetector is also provided. Obtained results indicate thatthe discharge quantity is around 120 pC. The PD signal ispresented as a sharp pulse from the optical receiver, butas an extended integrated waveform from the PD conven-tional detector, which only works in the frequency rangeup to several hundred kHz.
The fused fiber optic coupler was then included intothe system. The measurement arrangement is similar tothat shown in Figure 7, except that in this case practicalPD signals from the 132 kV cable joint were fed into theEOM RF input port. Obtained measurement results areshown in Figure 15. Compared with Figure 13, obtainedresults confirm that the fused fiber optic coupler generallysplits the light power equally, and this in turn results in a
Figure 15. PD signals measured using the laser - scrambler - fibrecoupler - polarizer - ‘bias-free’ EOM arrangement. a, 40 kV, 120 mA;b, 40 kV, 150 mA; c, 40 kV, 190 mA.
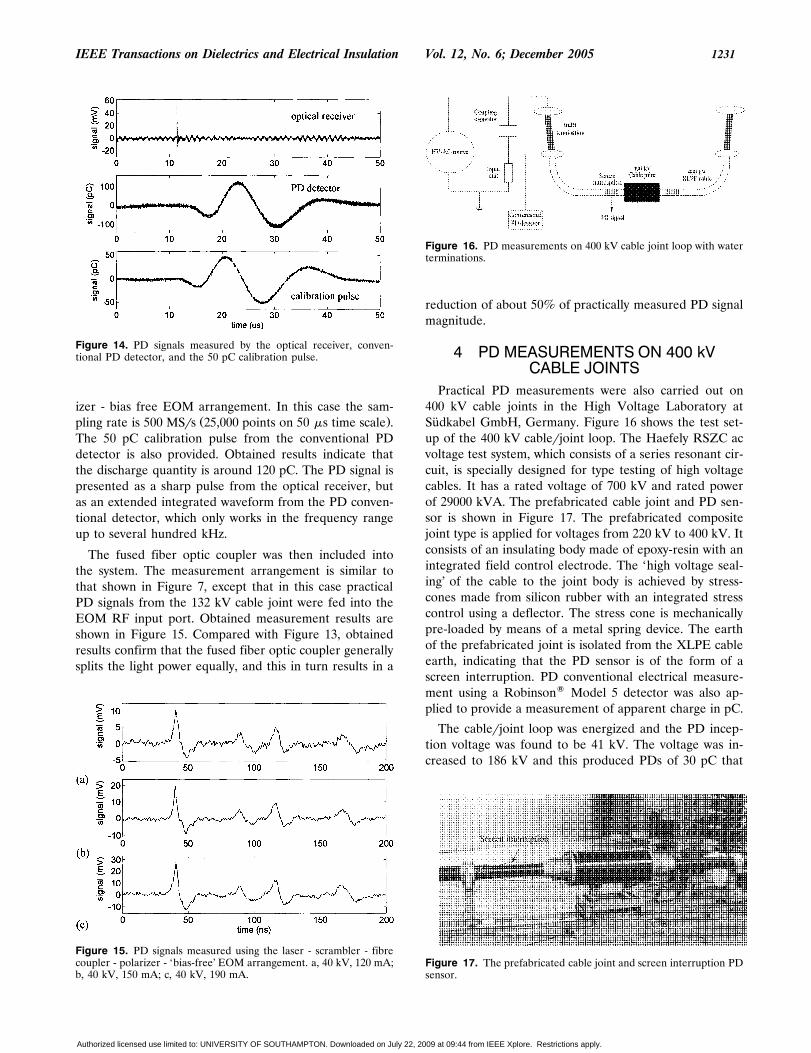
Figure 16. PD measurements on 400 kV cable joint loop with waterterminations.
reduction of about 50% of practically measured PD signalmagnitude.
4 PD MEASUREMENTS ON 400 kVCABLE JOINTS
Practical PD measurements were also carried out on400 kV cable joints in the High Voltage Laboratory atSudkabel GmbH, Germany. Figure 16 shows the test set-¨up of the 400 kV cablerjoint loop. The Haefely RSZC acvoltage test system, which consists of a series resonant cir-cuit, is specially designed for type testing of high voltagecables. It has a rated voltage of 700 kV and rated powerof 29000 kVA. The prefabricated cable joint and PD sen-sor is shown in Figure 17. The prefabricated compositejoint type is applied for voltages from 220 kV to 400 kV. Itconsists of an insulating body made of epoxy-resin with anintegrated field control electrode. The ‘high voltage seal-ing’ of the cable to the joint body is achieved by stress-cones made from silicon rubber with an integrated stresscontrol using a deflector. The stress cone is mechanicallypre-loaded by means of a metal spring device. The earthof the prefabricated joint is isolated from the XLPE cableearth, indicating that the PD sensor is of the form of ascreen interruption. PD conventional electrical measure-ment using a Robinson� Model 5 detector was also ap-plied to provide a measurement of apparent charge in pC.
The cablerjoint loop was energized and the PD incep-tion voltage was found to be 41 kV. The voltage was in-creased to 186 kV and this produced PDs of 30 pC that
Figure 17. The prefabricated cable joint and screen interruption PDsensor.
Authorized licensed use limited to: UNIVERSITY OF SOUTHAMPTON. Downloaded on July 22, 2009 at 09:44 from IEEE Xplore. Restrictions apply.

Tian et al.: An Impro©ed Optically Based PD Detection System for Continuous On-line Monitoring of HV Cables1232
Ž .Figure 18. PD signal due to a real production defect void be-tween stress shield and epoxy resin within the cable joint, measuredusing the laser - controller - ‘bias-free’ EOM arrangement.
were detected using the measuring arrangement includingŽ .laser-controller-EOM-photoreceiver Figure 1a . The ob-
tained result is shown in Figure 18. After-test inspectionindicated that the PD activity was due to a practical pro-
Ž .duction defect void between the cable conductor and theepoxy resin within the cable joint.
The 400 kV cable joint was replaced with an alternativeone of the same type and the loop was re-energized. Itwas PD free for an applied voltage of 250 kV. Four metalwires were then placed on the surface of the stress conenear to the cable conductor, as shown in Figure 19 andthe joint reassembled. PD measurements were then car-ried out using the laser-scrambler-polarizer-EOM ar-
Ž .rangement Figure 1d . High voltage was applied to the
Figure 19. Metal wires on the stress relief cone within the cablejoint as PD source.
Figure 20. PD signal due to metal wires within the cable joint, mea-sured using the laser - scrambler - polarizer - ‘bias-free’ EOM ar-rangement.
loop and in this case the PD inception voltage was foundto be 13 kV. The voltage was further increased and mea-surement was carried out at 70 kV, as shown in Figure 20.The conventional PD detector indicates that in this casethe PD level was 20 y 30 pC.
The wires were then removed and copper filings wereplaced about halfway along the stress cone, as shown inFigure 21. PD measurements were also carried out usingthe laser-scrambler-polarizer-EOM arrangement. In thiscase the PD inception voltage was found to be 180 kV andat 480 kV PDs of 10-12 pC were generated and conse-quently measured, as shown in Figure 22. Further analysisof the measurement data revealed that the backgroundnoise is caused by the optical system itself having a reso-nant frequency up to 1 MHz. Therefore measurementsensitivity could be increased by using a high pass filter toattenuate lower frequency signals.
Figure 21. Copper filings on the stress relief cone within the cablejoint as PD source.
Authorized licensed use limited to: UNIVERSITY OF SOUTHAMPTON. Downloaded on July 22, 2009 at 09:44 from IEEE Xplore. Restrictions apply.

IEEE Transactions on Dielectrics and Electrical Insulation Vol. 12, No. 6; December 2005 1233
Figure 22. PD signal due to copper filings within the cable joint,measured using the laser - scrambler - polarizer - ‘bias-free’ EOMarrangement.
5 CONCLUSIONSThis paper has described the continued development of
the electro-optic modulator based PD detection tech-nique. Based on considerations of overall cost, feasibilityand convenience, the revised measuring system requires alaser source, polarization scrambler, standard single modefibers, in-line fibre polarizer, bias-free EO modulator andoptical receiver. Both the polarizer and bias-free EOmodulator, which are placed near cable joints, are passivewithout any additional power requirements. The bias-freeEO modulator, which operates near the half-intensitypoint, has proved to have better light transmission perfor-mance and higher measurement sensitivity than the previ-ously used with-bias modulator. A fused fiber optic cou-pler was used to allow optical multiplexing by splittinglaser light equally to several optical paths, and the feasi-bility and effectiveness of this approach have been veri-fied. In this way the number of required laser sourcescould be reduced to implement multi-channel monitoring.Practical PD measurements on both a 132 kV cable jointat the University of Southampton, UK, and 400 kV cablejoints at Sudkabel GmbH, Germany, have verified the¨principle and demonstrated the effectiveness of the devel-oped technique. Obtained results indicate that partial dis-charges of 10-15 pC can be clearly measured using theoptical remote sensing technique. The developed tech-nique can also be used to monitor cable terminationswithin substations. However, as mains supply in a substa-tion is easily available, the biggest advantage of this tech-nique, i.e. the nature of being ‘passive’, is not fully uti-lized. The measurement sensitivity of this technique couldbe further increased by applying suitable filters and am-plifiers to process the optical receiver output signals andremove any inherent noise of the measuring system. Ap-plication of passive amplifiers such as radio frequency
transformers to amplify the PD sensor-measured signalbefore feeding into the electro-optic modulator could alsohelp to increase the signal to noise ratio of the measuringsystem.
For practical applications the optical measuring systemmay need to be calibrated to relate the measured signal inmV to a discharge apparent quantity in pC. In this paperthe sensitivity check of the measurement system is carriedout by comparing with the conventional PD detector whichprovides a discharge quantity in pC. However, this wouldnot be practical for on-line applications. It might be verydifficult to have an accurate calibration but the capabilityto estimate the discharge level, i.e. 10s or 100s of pC, wouldbe valuable for continuous monitoring applications wheretrends are important rather than absolute discharge val-ues. Finally it would also be valuable to investigate thefeasibility of implementing non-linear polymeric materialsacting as optical modulators designed into the fabric ofthe cable joint itself.
ACKNOWLEDGEMENTSThe authors would like to thank Sudkabel GmbH, Ger-¨
many for the permission to carry out PD measurementson the 400 kV cable joints. In particular we would like tothank Mrs. Astrid Taernhuvud and Dr. Johannes Kau-manns for their help. We would also like to thank Prof.Peter Smith and Dr. Trevor Newson of the Optoelectron-ics Research Centre at the University of Southampton, UKfor technical advice. The financial support from NationalGrid Transco plc, UK for this project is gratefully ac-knowledged.
REFERENCESw x1 Y. Tian, P. L. Lewin, J. S. Wilkinson, S. J. Sutton and S. G.
Swingler, ‘‘Continuous Online Monitoring of Partial Dischargesin High Voltage Cables’’, IEEE Intern. Sympos. Electr. Insul.Ž .ISEI , Indianapolis, USA, pp. 454�457, 2004.
w x2 Y. Tian, P. L. Lewin, A. E. Davies, S. J. Sutton and S. G.Swingler, ‘‘Partial Discharge Detection in Cables Using VHFCapacitive Couplers’’, IEEE Trans. Dielectr. Electr. Insul., Vol.10, pp. 343�353, 2003.
w x3 Y. Tian, P. L. Lewin, A. E. Davies, S. G. Swingler, S. J. Suttonand G. M. Hathaway, ‘‘Comparison of On-line Partial DischargeDetection Methods For HV Cable Joints’’, IEEE Trans. Di-electr. Electr. Insul., Vol. 9, pp. 604�615, 2002.
w x4 C. G. Henningsen, K. Polster, B. A. Fruth and D. W. Gross,‘‘Experience with an On-Line Monitoring System for 400 kVXLPE Cables’’, Record of IEEE T&D Conf., pp. 515�520, LosAngeles, USA, 1996.
w x5 Y. Tian, P. L. Lewin, M. Webb, S. J. Sutton and S. G. Swingler,‘‘Continuous Monitoring of Partial Discharges in Power Cablesusing Capacitive Couplers and Trend Analysis’’, Proc. of 13th
Ž .International Symposium on High Voltage Engineering ISH ,Delft, the Netherlands, 2003.
w x6 Y. Tian, P. L. Lewin, A. E. Davies, S. J. Sutton and S. G.Swingler, ‘‘Partial Discharge Detection in Cable Systems usingVery High Frequency Capacitive Coupler and Screen Interrup-tion Techniques’’, IEEE 14th Intern. Sympos. Electr. Insul.Ž .ISEI , Boston, USA, pp. 87�90, 2002.
w x7 N. H. Ahmed and N. N. Srinivas, ‘‘On-line Partial DischargeDetection in Cables’’, IEEE Trans. Dielectr. Electr. Insul., Vol.5, pp. 181�198, 1998.
Authorized licensed use limited to: UNIVERSITY OF SOUTHAMPTON. Downloaded on July 22, 2009 at 09:44 from IEEE Xplore. Restrictions apply.

Tian et al.: An Impro©ed Optically Based PD Detection System for Continuous On-line Monitoring of HV Cables1234
w x8 R. Plath, U. Herrmann, K. Polster, J. Spiegelberg and P. Coors,‘‘After Laying Tests of 400 kV XLPE Cable Systems for BewagBerlin’’, 11th International Symposium on High Voltage Engi-
Ž .neering ISH , Vol. 5, pp. 276�279, London, UK, 1999.w x9 H. Ota, M. Ichihara, N. Miyamoto, S. Kitai, Y. Maruyama, M.
Fukasawa and H. Takehana, ‘‘Application of Advanced After-laying Test to Long-distance 275 kV XLPE Cable Lines’’, IEEETrans. Power Delivery, Vol. 10, pp. 567�579, 1995.
w x10 Y. Tian, P. L. Lewin, A. E. Davies and G. Hathaway, ‘‘AcousticEmission Techniques for Partial Discharge Detection within Ca-ble Insulation’’, Proceedings of 8th International Conference on
Ž .Dielectric Materials, Measurements and Applications DMMA ,Edinburgh, UK, pp. 503�508, 2000.
w x11 Y. Tian, P. L. Lewin, D. Pommerenke, J. S. Wilkinson and S. J.Sutton, ‘‘Partial Discharge On-line Monitoring for HV CableSystems using Electrooptic Modulators’’, IEEE Trans. Dielectr.Electr. Insul., Vol. 11, pp. 861�869, 2004.
w x12 J. Wilson and J. Hawkes, Optoelectronics, Published by PrenticeHall Europe, 1998.
w x13 A. Yariv, ‘‘Optical Electronics in Modern Communications’’,Oxford University Press, 1997.
w x14 D. J. R. Harry, Understanding Optical Communications, Pub-lished by Prentice PTR, 1998.
Authorized licensed use limited to: UNIVERSITY OF SOUTHAMPTON. Downloaded on July 22, 2009 at 09:44 from IEEE Xplore. Restrictions apply.
Related Documents


