Journal of Digital Information Management Volume 13 Number 1 February 2015 15 An Improved Classification Scheme with Adaptive Region Growing and Wishart Classification Algorithm for Digital Images Journal of Digital Information Management ABSTRACT: This paper proposes a new ARG- Wishart(Adaptive Region Growing-Wishart) classification algorithm for digital images. It integrates the adaptive region growing algorithm and Wishart maximum likelihood classification algorithm for difficulties that arise from selecting training samples, and instability of the final classification accuracy on PolSAR(Polarimetric Synthetic Aperture Radar) image. At first, the main diagonal elements of the polarimetric coherency matrix are extracted from the image. A few are presentative and clear sample data are selected manually. An improved adaptive region growing algorithm is developed by introducing the OTSU method for the image. After this, we can obtain enhanced training samples by which each class center can be calculated. Then, unknown samples are classified by the Wishart maximum likelihood classification algorithm. Thus, we can finish the classification on the polarimetric SAR image. For comparison, we use PALSAR(Phased Array Type L-Band Synthetic Aperture Radar) and RADARSAT-2 images as data sources and apply SVM(Support Vector Machine), the Wishart supervised classifier, and the ARG-Wishart classifier to conduct comparative research on two experimental plots, namely, Lishui County in Jiangsu Province and Jiangning District in Nanjing City. The results show that the ARG-Wishart classifier can achieve better results than the SVM and the Wishart classifier in terms of overall classification accuracy and Kappa coefficient. Categories and Subject Descriptors C.2.1 [Network Architecture and Design]: WirelessCommunication; E.4 [Coding and Information Theory] General Terms: MAC Protocol Design ,Routing Protocol Design Keywords: Digital Image Classification, PolSAR; Region Growing Algorithm, Wishart Maximum likelihood Classification, OTSU Algorithm Received: 1 September 2014, Revised 9 October 2014, Accepted 15 October 2014 1. Introduction According to the number of training samples, digital image classification can be divided into three types: supervised, unsupervised, and semi-supervised classification. Supervised classification commonly needs to select a large number of training samples and can obtain Jun Chen 1 *, Peijun Du 2 , Kun Tan 1 , Borjer T.H. 3 1 Jiangsu Key Laboratory of Resources and Environmental Information Engineering China University of Mining and Technology 221116 Xuzhou, China 2 Jiangsu Provincial Key Laboratory of Geographic Information Science and Technology Nanjing University 210023 Nanjing, China 3 Information Institute for Geographic Engineering in ABB Communication Corporation Patras 112309, Greece [email protected]

Welcome message from author
This document is posted to help you gain knowledge. Please leave a comment to let me know what you think about it! Share it to your friends and learn new things together.
Transcript
Journal of Digital Information Management Volume 13 Number 1 February 2015 15
An Improved Classification Scheme with Adaptive Region Growing andWishart Classification Algorithm for Digital Images
Journal of DigitalInformation Management
ABSTRACT: This paper proposes a new ARG-Wishart(Adaptive Region Growing-Wishart) classificationalgorithm for digital images. It integrates the adaptiveregion growing algorithm and Wishart maximum likelihoodclassification algorithm for difficulties that arise fromselecting training samples, and instability of the finalclassification accuracy on PolSAR(Polarimetric SyntheticAperture Radar) image. At first, the main diagonalelements of the polarimetric coherency matrix are extractedfrom the image. A few are presentative and clear sampledata are selected manually. An improved adaptive regiongrowing algorithm is developed by introducing the OTSUmethod for the image. After this, we can obtain enhancedtraining samples by which each class center can becalculated. Then, unknown samples are classified by theWishart maximum likelihood classification algorithm.Thus, we can finish the classification on the polarimetricSAR image. For comparison, we use PALSAR(PhasedArray Type L-Band Synthetic Aperture Radar) andRADARSAT-2 images as data sources and applySVM(Support Vector Machine), the Wishart supervisedclassifier, and the ARG-Wishart classifier to conductcomparative research on two experimental plots, namely,Lishui County in Jiangsu Province and Jiangning Districtin Nanjing City. The results show that the ARG-Wishart
classifier can achieve better results than the SVM andthe Wishart classifier in terms of overall classificationaccuracy and Kappa coefficient.
Categories and Subject DescriptorsC.2.1 [Network Architecture and Design]:WirelessCommunication; E.4 [Coding and Information Theory]
General Terms: MAC Protocol Design ,Routing ProtocolDesign
Keywords: Digital Image Classification, PolSAR; RegionGrowing Algorithm, Wishart Maximum likelihood Classification,OTSU Algorithm
Received: 1 September 2014, Revised 9 October 2014, Accepted15 October 2014
1. Introduction
According to the number of training samples, digital imageclassification can be divided into three types: supervised,unsupervised, and semi-supervised classification.Supervised classification commonly needs to select alarge number of training samples and can obtain
Jun Chen1*, Peijun Du2, Kun Tan1, Borjer T.H.31Jiangsu Key Laboratory of Resources and Environmental Information EngineeringChina University of Mining and Technology221116 Xuzhou, China2Jiangsu Provincial Key Laboratory of Geographic Information Science and TechnologyNanjing University210023 Nanjing, China3Information Institute for Geographic Engineering in ABB Communication CorporationPatras 112309, [email protected]
16 Journal of Digital Information Management Volume 13 Number 1 February 2015
a robust classifier after a sufficient learning course. Onthe contrary, unsupervised classification requires none ofthe training samples and usually the classification courseis proceeded by a kind of clustering algorithm. Semi-supervised classification needs training samples betweensupervised and unsupervised classification. In other words,it simply requires a few training samples and a great dealof unlabeled data[1]. In the course of the supervisedclassification of the PolSAR image, large foundationalwork, which spends a lot of manpower and basicresources, is needed to conduct field reconnaissance andgather some land use information in the research areasin order to gain enough training samples. If the number oftraining samples is small, the accuracy of the supervisedclassification will be low. However, the interference fromspeckle noise is so strong that it is hard to select enoughtraining samples for supervised classification of the PolSARimage. Nowadays, the supervised classifier that iscommonly used for PolSAR images is the Wishartclassifier proposed by Lee et al. and requires a largenumber of training samples. They found that the finalclassification accuracy was worse when training sampleswere small[2].
For reasons mentioned above, unsupervised learning iswidely used for PolSAR image classification. Cloude etal. extracted H,Alpha from the H/Alpha decomposition,and then classified the image on the H/Alpha plane.However, since the regulations defined in the H/Alpha planeare not congruent with the real distribution of the groundobjects, the classification accuracy of this algorithm islow[3]. Later, Lee et al.combined the H/Alphadecomposition with the maximum likelihood classifierbased on the complex Wishart distribution by calculatingthe mean values of the H/Alpha clustering results andconsidering them as centers of all classes. Then, theyused the unsupervised iterative classification based onthe complex Wishart distribution to obtain the finalclassification result[4]. This classification algorithm obtainsits results by iteratively updating clustering centers, whichare created by a clustering course. This means that eachclass cannot correspond to real earth object, manualmethods are needed to unite the classes to check andfind the physical meaning of each class.
The supervised classifier runs on a large number of artificialselected samples. Even though its classification accuracyis higher, the reality is that it is hard to obtain such alarge number of training samples. Moreover, although theunsupervised classifier needs none of training samples,its accuracy is low. Thus, an important issue is how toutilize the strengths of both the supervised andunsupervised algorithm, which reduces manual work, usesas little training samples as possible, obtains a stableclassification accuracy like the supervised method, andguarantees classification results that correspond to realground objects. This question can be solved using a semi-supervised classification algorithm that can achieveaccurate results using only a small number of trainingsamples. Many scholars have conducted a number of
studies on classifying PolSAR images by the semi-supervised classification algorithm. Zhang et al. proposeda semi-supervised algorithm by combining the watershedalgorithm with the Laplacian normalization of the leastsquare method and applied it to identify objects from SARimages. They found that over segmentation, which causedlarge unlabeled data, could be avoided using the watershedalgorithm. Therefore, time complexity can be enhancedusing the watershed and LapSVM algorithms in turn onthe whole image[5]. Chen et al. introduced active learningbased on optimization and self-learning by placingconstraints on the SVM classifier for SAR imagesclassification[6]. This algorithm needs to set differentthreshold values on different images. If the threshold valuesare not selected properly, the results will be worse.
Therefore, this study focuses mainly on the issue ofhardness when selecting training samples and lowclassification accuracy in SAR images; research for theclassification scheme, which is similar to the semi-supervised algorithm carried out on PolSAR images; anda new classification scheme proposed by combining theimproved adaptive region growing algorithm with theWishart maximum likelihood classification algorithm. Thisscheme uses only tiny training samples to conduct highaccuracy classification.
2. ARG - Wishart Classification Scheme
2.1 Semi-supervised LearningSemi-supervised learning follows the state of PolSARimage classification. It only requires a small quantity oflabeled data and some unlabeled data to fulfill therequirements for precise classification. The labeled dataare utilized to mark the unlabeled data by certainalgorithms in order to enhance the number of trainingsamples.
Presently, semi-supervised learning algorithms are mainlydivided into the following categories[7,8,9,10]: First isclustering, which clusters data around some labeled dataand marks the unlabeled data with labeled data in thesame class; Second, is graphing, which uses the verticesof graphs to stand for the data, and the edges representthe similarity between the linked data. A graph is alsoestablished usingsimilarity measurements. Third is co-training or tri-training, which marks unlabeled data withthe results from other classifiers in order to expand thedimensions of labeled data. In these training algorithms,certain confidence measurements are used to select themost reliable unlabeled data. Finally, others, namelyalgorithms of improvements of the SVM algorithm, likeS2VM and S3VM, which are designed to adjust the borderof different classes to obtain their optimal hyper plane. Inall of these algorithms, the clustering method can fullyutilize some cheap unlabeled data to revise the clusteringcenters and is simpler than other methods. This meansthat its time complexity is lower than others[11].
2.2 ARG-Wishart Classification Algorithm
Journal of Digital Information Management Volume 13 Number 1 February 2015 17
The main idea of the ARG-Wishart classification algorithmis to use an improved adaptive region growing algorithmto conduct semi-supervised learning. In principle, itsupposes that objects having similar attributes one anothershare the same class and should be clustered together.Therefore, it uses some seed pixels to find neighbor pixelsthat belong to the same class. After selecting obvioustraining sample points within each class, the unlabeledsamples around them can be found and marked as labeleddata to enhance the number of training samples. Themethod to find and mark unlabeled data is an improvedOTSU-region growing algorithm.
A region growing algorithm gathers pixels having similarattributes to construct a region with maximumconsistency[12,13,14]. Its core techniques involve theselection of the seed point, threshold value, consistencyand similarity criterion, and terminal condition. Usually,the threshold value is determined by experience orstatistics of the whole image. However, the empiricalmethod is not universal for all images, and although thestatistical method has some advantages when used on awhole image, it is not fit for all regions. Therefore, animproved region growing method is proposed to confirmthat the proper threshold value adapts to different regionsby importing the OTSU algorithm.
Thus, an improved adaptive region growing algorithm tofulfill the requirements for semi-supervised learning isproposed to fulfill the requirements for semi-supervisedlearning by introducing the OTSU algorithm[15], which is
used to explore and determine appropriate threshold valuein every area. In detail, the improved algorithm designatesthe proper region around a selected point, and thenconsiders this point as the focal point for calculating thethreshold of this region by the OTSU algorithm. Thisthreshold value is regarded as the best value to segmentthis region. Next, the best threshold value used in theregion growing algorithm is calculated by the differencebetween the value obtained by the OTSU algorithm andthe gray value of the selected point. Using the bestthreshold value, the points belonging to similar classaround the selected point are found by the region growingalgorithm. The unlabeled points surrounding the selectedpoint can be labeled in this way and different clusters aregenerated around different selected points. The clustercenter is obtained by calculating the mean value withineach class. The Wishart distance is used to measure thedistance between each unknown pixel in the whole PolSARimage and each cluster center, the unknown pixel isassigned to the class with the smallest distance.
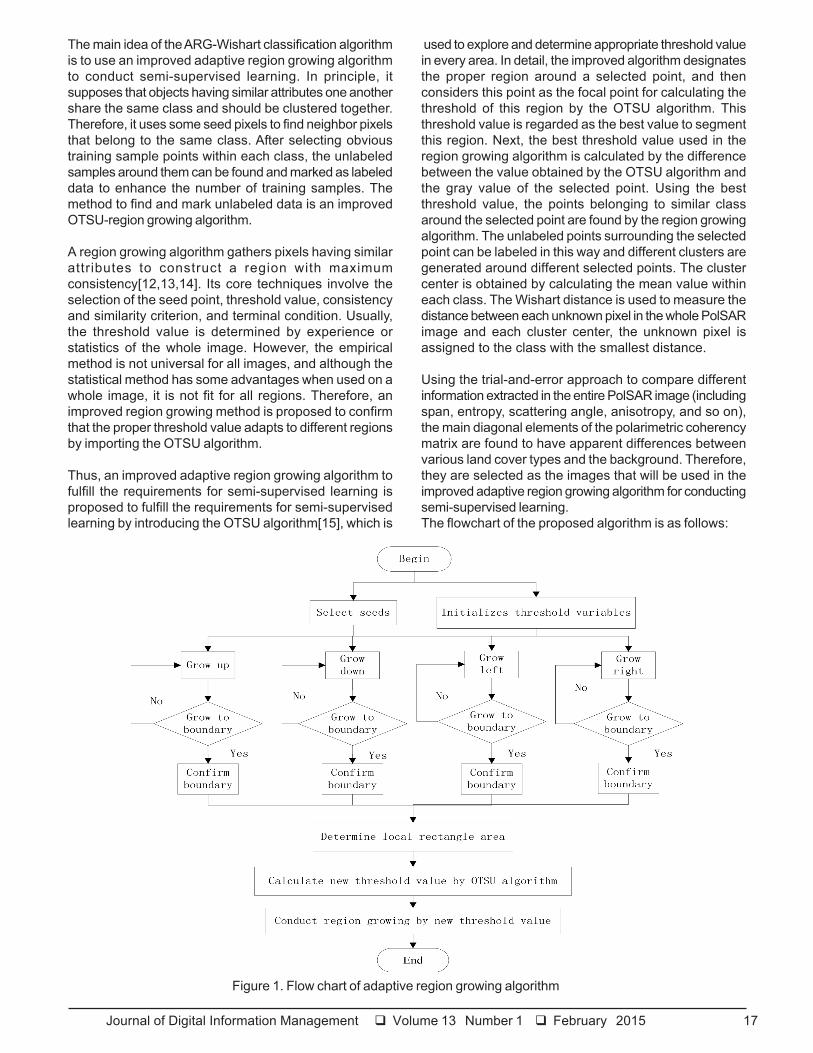
Using the trial-and-error approach to compare differentinformation extracted in the entire PolSAR image (includingspan, entropy, scattering angle, anisotropy, and so on),the main diagonal elements of the polarimetric coherencymatrix are found to have apparent differences betweenvarious land cover types and the background. Therefore,they are selected as the images that will be used in theimproved adaptive region growing algorithm for conductingsemi-supervised learning.The flowchart of the proposed algorithm is as follows:
Figure 1. Flow chart of adaptive region growing algorithm
18 Journal of Digital Information Management Volume 13 Number 1 February 2015
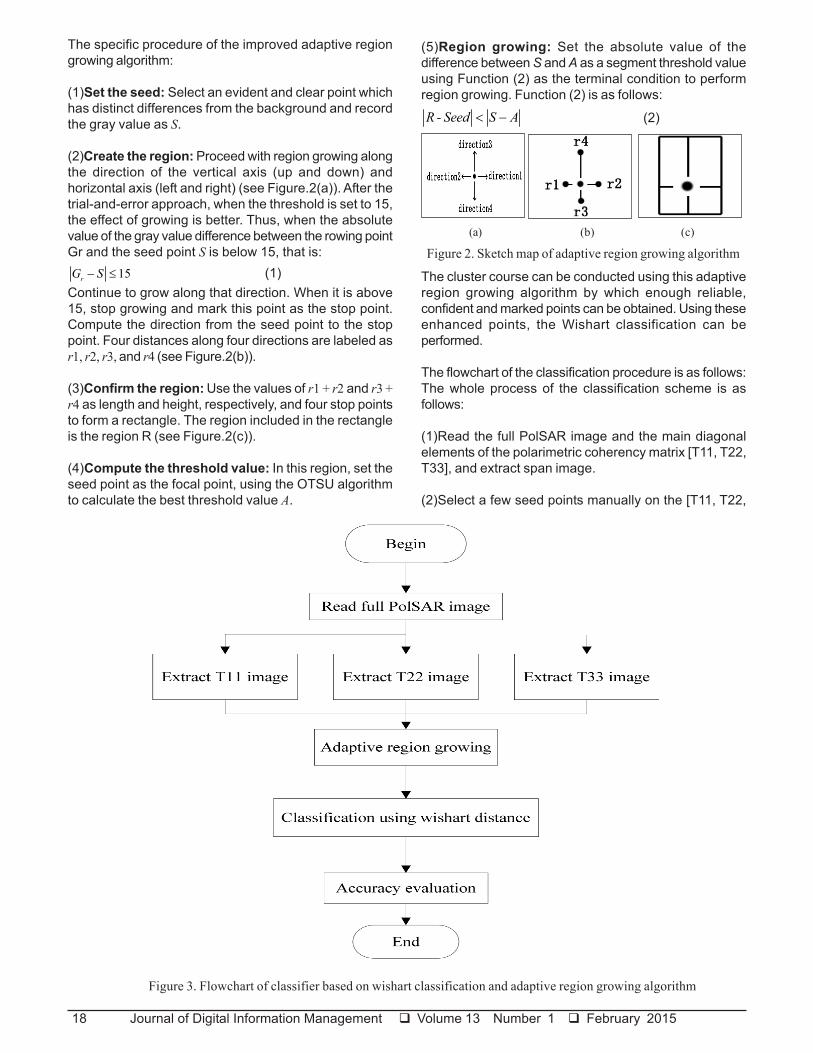
Figure 3. Flowchart of classifier based on wishart classification and adaptive region growing algorithm
The specific procedure of the improved adaptive regiongrowing algorithm:
(1)Set the seed: Select an evident and clear point whichhas distinct differences from the background and recordthe gray value as S.
(2)Create the region: Proceed with region growing alongthe direction of the vertical axis (up and down) andhorizontal axis (left and right) (see Figure.2(a)). After thetrial-and-error approach, when the threshold is set to 15,the effect of growing is better. Thus, when the absolutevalue of the gray value difference between the rowing pointGr and the seed point S is below 15, that is:
15− ≤rG S (1)Continue to grow along that direction. When it is above15, stop growing and mark this point as the stop point.Compute the direction from the seed point to the stoppoint. Four distances along four directions are labeled asr1, r2, r3, and r4 (see Figure.2(b)).
(3)Confirm the region: Use the values of r1 + r2 and r3 +r4 as length and height, respectively, and four stop pointsto form a rectangle. The region included in the rectangleis the region R (see Figure.2(c)).
(4)Compute the threshold value: In this region, set theseed point as the focal point, using the OTSU algorithmto calculate the best threshold value A.
(5)Region growing: Set the absolute value of thedifference between S and A as a segment threshold valueusing Function (2) as the terminal condition to performregion growing. Function (2) is as follows:
< −R - Seed S A (2)
The cluster course can be conducted using this adaptiveregion growing algorithm by which enough reliable,confident and marked points can be obtained. Using theseenhanced points, the Wishart classification can beperformed.
The flowchart of the classification procedure is as follows:The whole process of the classification scheme is asfollows:
(1)Read the full PolSAR image and the main diagonalelements of the polarimetric coherency matrix [T11, T22,T33], and extract span image.
(2)Select a few seed points manually on the [T11, T22,
(a) (b) (c)
Figure 2. Sketch map of adaptive region growing algorithm
Journal of Digital Information Management Volume 13 Number 1 February 2015 19
T33] images.These points should be clear and haveapparent characteristics and distribute equably within theimages. Three to eight seed points are needed for eachclass, and it is better to locate each point on a differentarea of the image, as this will be helpful during regionalgorithm procedures.
(3)Semi-supervised learning. Improved region growingalgorithm is used to cluster the points around the seedpoint and to mark them with the label of the seed point.
(4)Compute the cluster centers of all of the classes bycounting the mean values of all of the clusters and usethe Wishart distance formula to classify the unknownpoints within the PolSAR image. The formula is as follows[2,16]:
1([ ] | [ ]) ln | [ ] | ([ ] [ ])−= +∑ ∑ ∑i i idist T Tr T (3)
Here, [ ]∑ stands for the polarimetric coherency matrixof the cluster center i, [ ]T stands for the polarimetriccoherency matrix of the unknown point. According to themaximum likelihood criterion, when the condition (4) ismet:
([ ] | [ ]) ([ ] | [ ])>∑ ∑i jdist T dist T (4)The unknown point is labeled as j. Calculate the distancesbetween the known point and all the cluster centers andmark the unknown point with the label of the class havingthe minimum distance. Since all clusters are created by
the selected points, which are known to us, all of theclasses in the classification result correspond to the realdistribution of the land cover types, which is pertinent toour research.(5)Evaluate classification result using the real calculateddata.
3. Experiment and Analysis
The two images with a length of 1000 × 1000 pixels areused as data sources in this experiment. The former isthe 1.1 level PALSAR image from the ALOS satellite,capturing Lishui County, Jiangsu Province. Its image timeis March 22, 2011. The latter is RADARSAT-2 image,capturing Jiangning District in Nanjing City, JiangsuProvince. Its image time is March 27, 2008. The mainland cover types include building, tree, farmland, water,vegetation, and so on.
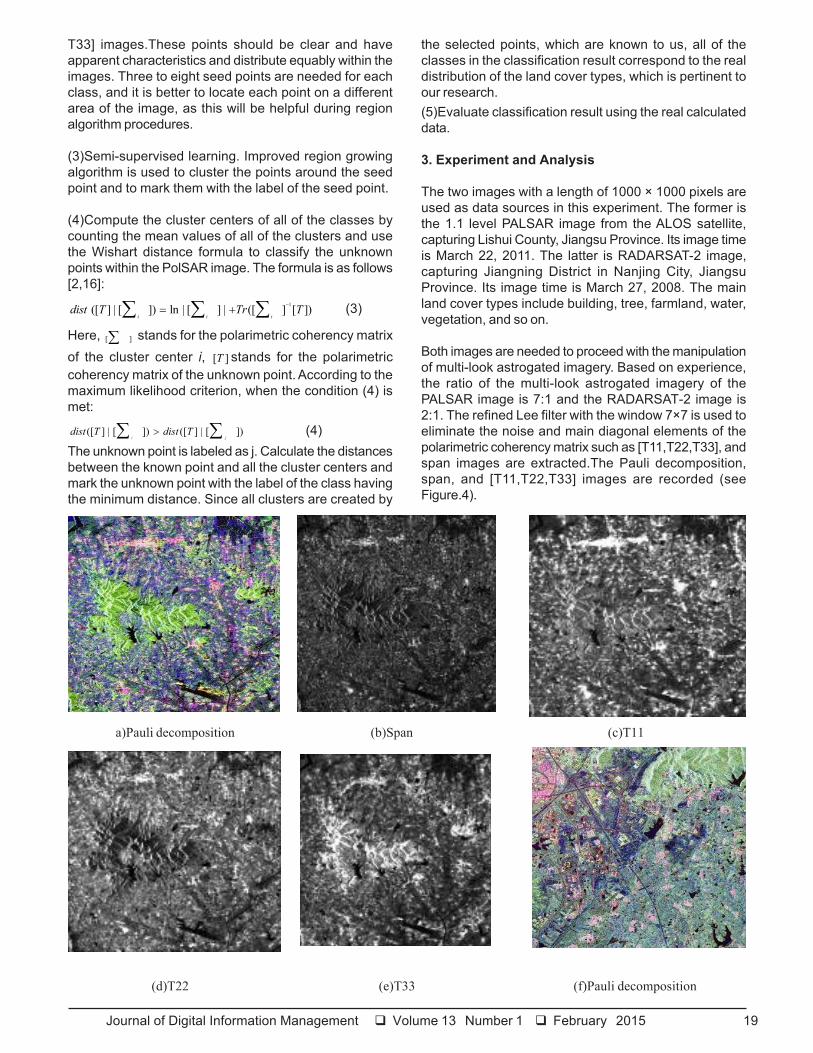
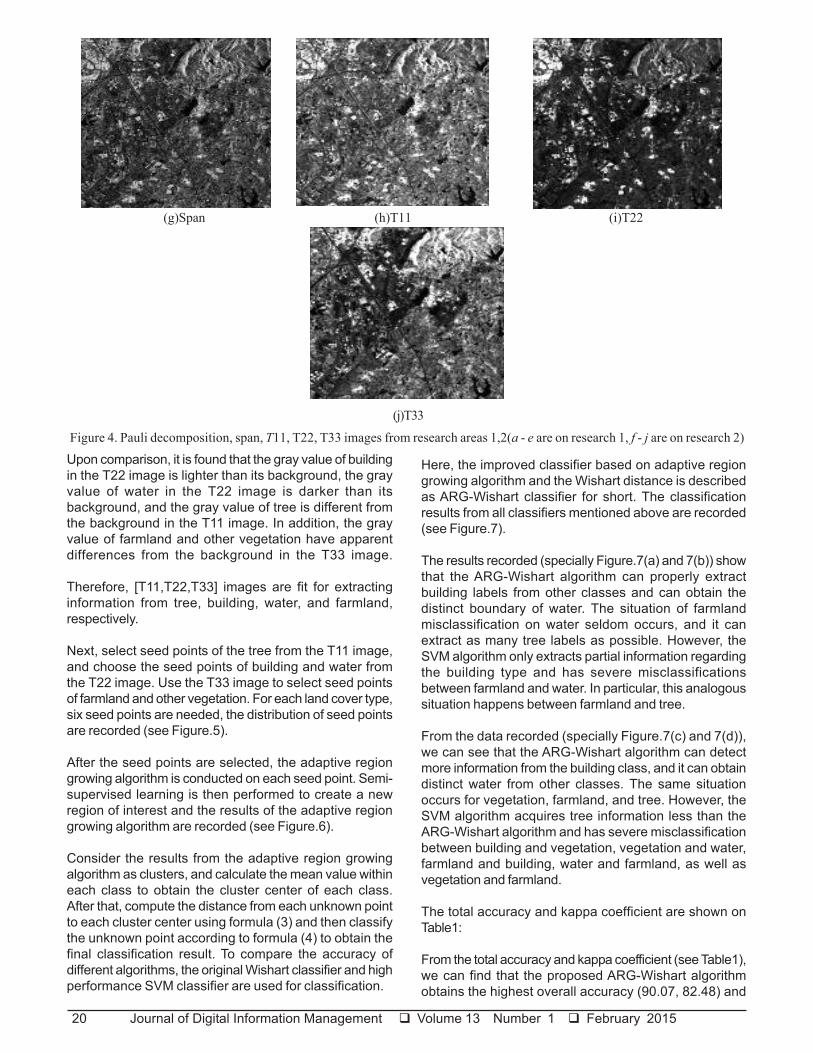
Both images are needed to proceed with the manipulationof multi-look astrogated imagery. Based on experience,the ratio of the multi-look astrogated imagery of thePALSAR image is 7:1 and the RADARSAT-2 image is2:1. The refined Lee filter with the window 7×7 is used toeliminate the noise and main diagonal elements of thepolarimetric coherency matrix such as [T11,T22,T33], andspan images are extracted.The Pauli decomposition,span, and [T11,T22,T33] images are recorded (seeFigure.4).
a)Pauli decomposition (b)Span (c)T11
(d)T22 (e)T33 (f)Pauli decomposition
20 Journal of Digital Information Management Volume 13 Number 1 February 2015
(g)Span (h)T11 (i)T22
(j)T33
Figure 4. Pauli decomposition, span, T11, T22, T33 images from research areas 1,2(a - e are on research 1, f - j are on research 2)
Upon comparison, it is found that the gray value of buildingin the T22 image is lighter than its background, the grayvalue of water in the T22 image is darker than itsbackground, and the gray value of tree is different fromthe background in the T11 image. In addition, the grayvalue of farmland and other vegetation have apparentdifferences from the background in the T33 image.
Therefore, [T11,T22,T33] images are fit for extractinginformation from tree, building, water, and farmland,respectively.
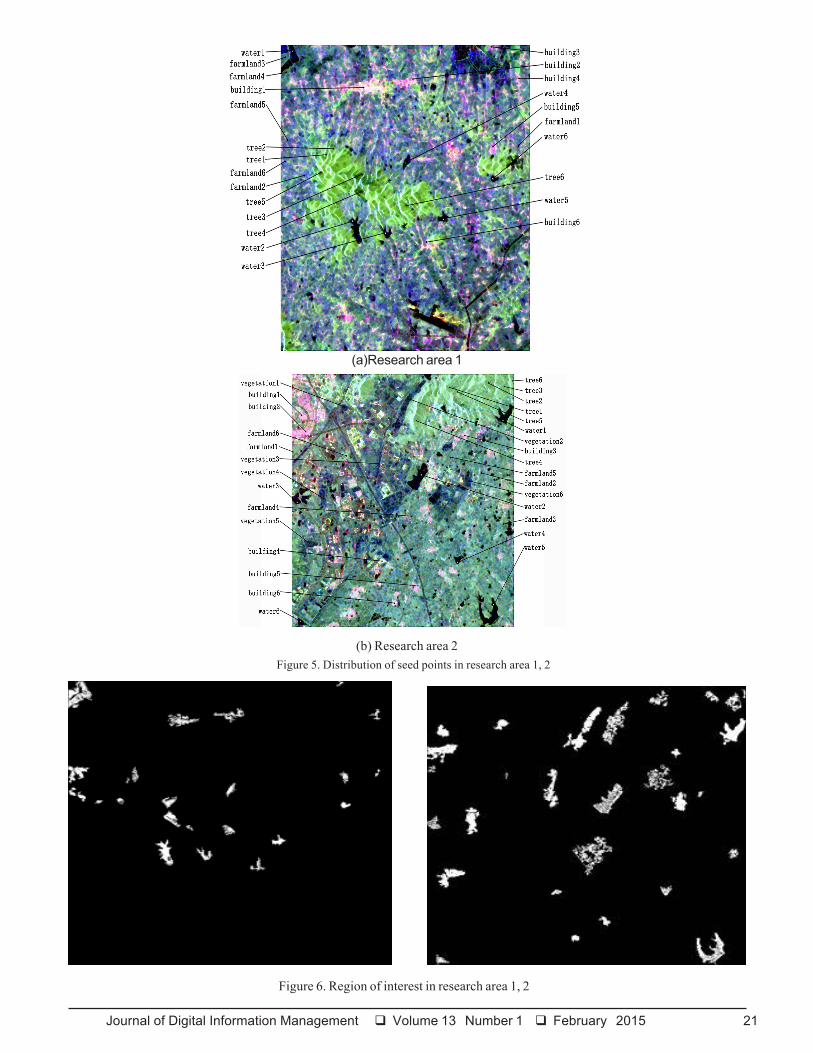
Next, select seed points of the tree from the T11 image,and choose the seed points of building and water fromthe T22 image. Use the T33 image to select seed pointsof farmland and other vegetation. For each land cover type,six seed points are needed, the distribution of seed pointsare recorded (see Figure.5).
After the seed points are selected, the adaptive regiongrowing algorithm is conducted on each seed point. Semi-supervised learning is then performed to create a newregion of interest and the results of the adaptive regiongrowing algorithm are recorded (see Figure.6).
Consider the results from the adaptive region growingalgorithm as clusters, and calculate the mean value withineach class to obtain the cluster center of each class.After that, compute the distance from each unknown pointto each cluster center using formula (3) and then classifythe unknown point according to formula (4) to obtain thefinal classification result. To compare the accuracy ofdifferent algorithms, the original Wishart classifier and highperformance SVM classifier are used for classification.
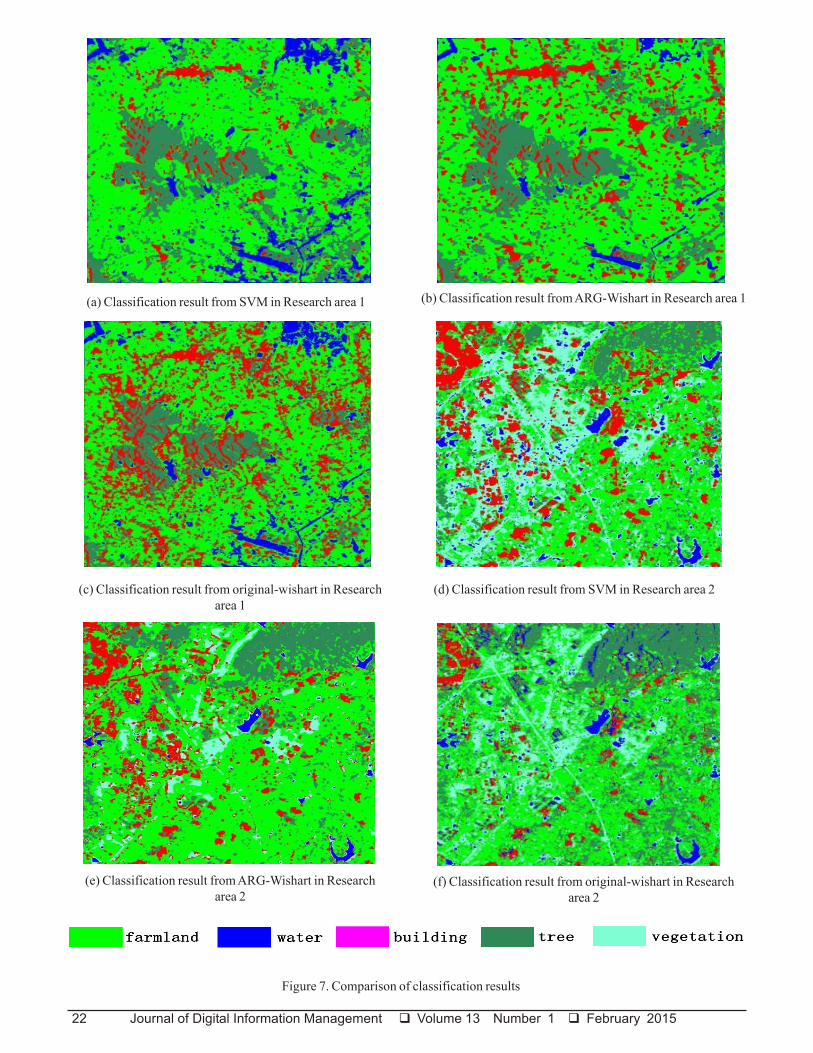
Here, the improved classifier based on adaptive regiongrowing algorithm and the Wishart distance is describedas ARG-Wishart classifier for short. The classificationresults from all classifiers mentioned above are recorded(see Figure.7).
The results recorded (specially Figure.7(a) and 7(b)) showthat the ARG-Wishart algorithm can properly extractbuilding labels from other classes and can obtain thedistinct boundary of water. The situation of farmlandmisclassification on water seldom occurs, and it canextract as many tree labels as possible. However, theSVM algorithm only extracts partial information regardingthe building type and has severe misclassificationsbetween farmland and water. In particular, this analogoussituation happens between farmland and tree.
From the data recorded (specially Figure.7(c) and 7(d)),we can see that the ARG-Wishart algorithm can detectmore information from the building class, and it can obtaindistinct water from other classes. The same situationoccurs for vegetation, farmland, and tree. However, theSVM algorithm acquires tree information less than theARG-Wishart algorithm and has severe misclassificationbetween building and vegetation, vegetation and water,farmland and building, water and farmland, as well asvegetation and farmland.
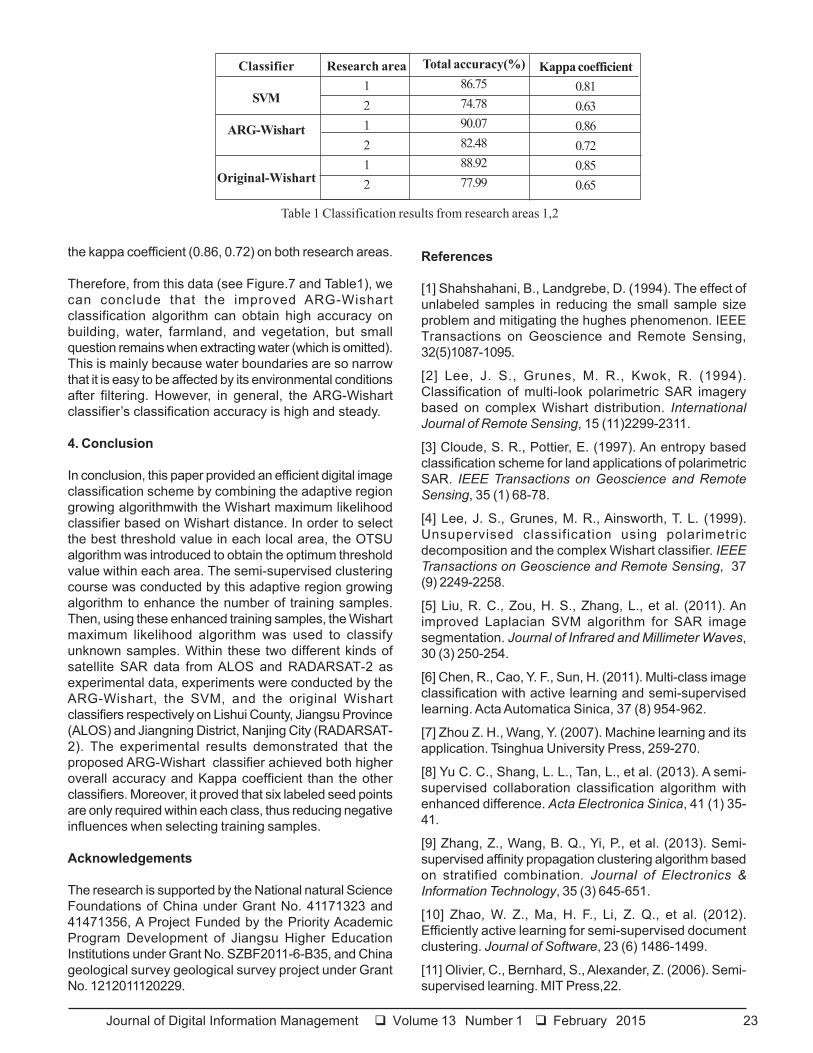
The total accuracy and kappa coefficient are shown onTable1:
From the total accuracy and kappa coefficient (see Table1),we can find that the proposed ARG-Wishart algorithmobtains the highest overall accuracy (90.07, 82.48) and
Journal of Digital Information Management Volume 13 Number 1 February 2015 21
(a)Research area 1
(b) Research area 2Figure 5. Distribution of seed points in research area 1, 2
Figure 6. Region of interest in research area 1, 2
22 Journal of Digital Information Management Volume 13 Number 1 February 2015
(a) Classification result from SVM in Research area 1 (b) Classification result from ARG-Wishart in Research area 1
(c) Classification result from original-wishart in Researcharea 1
(d) Classification result from SVM in Research area 2
(e) Classification result from ARG-Wishart in Researcharea 2
Figure 7. Comparison of classification results
(f) Classification result from original-wishart in Researcharea 2
Journal of Digital Information Management Volume 13 Number 1 February 2015 23
References
[1] Shahshahani, B., Landgrebe, D. (1994). The effect ofunlabeled samples in reducing the small sample sizeproblem and mitigating the hughes phenomenon. IEEETransactions on Geoscience and Remote Sensing,32(5)1087-1095.
[2] Lee, J. S., Grunes, M. R., Kwok, R. (1994).Classification of multi-look polarimetric SAR imagerybased on complex Wishart distribution. InternationalJournal of Remote Sensing, 15 (11)2299-2311.
[3] Cloude, S. R., Pottier, E. (1997). An entropy basedclassification scheme for land applications of polarimetricSAR. IEEE Transactions on Geoscience and RemoteSensing, 35 (1) 68-78.
[4] Lee, J. S., Grunes, M. R., Ainsworth, T. L. (1999).Unsupervised classification using polarimetricdecomposition and the complex Wishart classifier. IEEETransactions on Geoscience and Remote Sensing, 37(9) 2249-2258.
[5] Liu, R. C., Zou, H. S., Zhang, L., et al. (2011). Animproved Laplacian SVM algorithm for SAR imagesegmentation. Journal of Infrared and Millimeter Waves,30 (3) 250-254.
[6] Chen, R., Cao, Y. F., Sun, H. (2011). Multi-class imageclassification with active learning and semi-supervisedlearning. Acta Automatica Sinica, 37 (8) 954-962.
[7] Zhou Z. H., Wang, Y. (2007). Machine learning and itsapplication. Tsinghua University Press, 259-270.
[8] Yu C. C., Shang, L. L., Tan, L., et al. (2013). A semi-supervised collaboration classification algorithm withenhanced difference. Acta Electronica Sinica, 41 (1) 35-41.
[9] Zhang, Z., Wang, B. Q., Yi, P., et al. (2013). Semi-supervised affinity propagation clustering algorithm basedon stratified combination. Journal of Electronics &Information Technology, 35 (3) 645-651.
[10] Zhao, W. Z., Ma, H. F., Li, Z. Q., et al. (2012).Efficiently active learning for semi-supervised documentclustering. Journal of Software, 23 (6) 1486-1499.
[11] Olivier, C., Bernhard, S., Alexander, Z. (2006). Semi-supervised learning. MIT Press,22.
Classifier
SVM
ARG-Wishart
Original-Wishart
Research area121212
Total accuracy(%)86.7574.7890.0782.4888.9277.99
Kappa coefficient0.810.630.860.720.850.65
Table 1 Classification results from research areas 1,2
the kappa coefficient (0.86, 0.72) on both research areas.
Therefore, from this data (see Figure.7 and Table1), wecan conclude that the improved ARG-Wishartclassification algorithm can obtain high accuracy onbuilding, water, farmland, and vegetation, but smallquestion remains when extracting water (which is omitted).This is mainly because water boundaries are so narrowthat it is easy to be affected by its environmental conditionsafter filtering. However, in general, the ARG-Wishartclassifier’s classification accuracy is high and steady.
4. Conclusion
In conclusion, this paper provided an efficient digital imageclassification scheme by combining the adaptive regiongrowing algorithmwith the Wishart maximum likelihoodclassifier based on Wishart distance. In order to selectthe best threshold value in each local area, the OTSUalgorithm was introduced to obtain the optimum thresholdvalue within each area. The semi-supervised clusteringcourse was conducted by this adaptive region growingalgorithm to enhance the number of training samples.Then, using these enhanced training samples, the Wishartmaximum likelihood algorithm was used to classifyunknown samples. Within these two different kinds ofsatellite SAR data from ALOS and RADARSAT-2 asexperimental data, experiments were conducted by theARG-Wishart, the SVM, and the original Wishartclassifiers respectively on Lishui County, Jiangsu Province(ALOS) and Jiangning District, Nanjing City (RADARSAT-2). The experimental results demonstrated that theproposed ARG-Wishart classifier achieved both higheroverall accuracy and Kappa coefficient than the otherclassifiers. Moreover, it proved that six labeled seed pointsare only required within each class, thus reducing negativeinfluences when selecting training samples.
Acknowledgements
The research is supported by the National natural ScienceFoundations of China under Grant No. 41171323 and41471356, A Project Funded by the Priority AcademicProgram Development of Jiangsu Higher EducationInstitutions under Grant No. SZBF2011-6-B35, and Chinageological survey geological survey project under GrantNo. 1212011120229.

24 Journal of Digital Information Management Volume 13 Number 1 February 2015
method for extracting curved-polygon medial axis. ActaGeodaetica et Cartographica Sinica, 41 (2) 278-283.
[15] Nobuyuki, O. (1979). A threshold selection methodfrom gray level histograms. IEEE Transactions onSystems Man and Cybernetics, 9 (1) 62-69.
[16] Chen, J., Du, P. J., Tan, K. (2015). An improved AP-Wishart classifier for polarimetric SAR images byincorporating a textural feature. Telecommunication,Computing, Electronics and Control, 13 (1) in press.
[12] Chen, R. Y., Zheng, C., Wang, L. G., et al. (2011). Aregion growing model under the framework of MRF forurban detection. Acta Geodaetica et Cartographica Sinica,40 (2) 163-168.
[13] Li, H., Zhong, C., Huang, X. F., et al. (2012). Automaticoverpass detection with LIDAR and remote sensing image.Acta Geodaetica et Cartographica Sinica, 41 (3) 428-433.
[14] Pan, P., He, S. W., Wu, Y. L., et al. (2012). A newmethod for extracting curved-polygon medial axis. ActaGeodaetica et Cartographica Sinica, 41 (2) 278-283.
Related Documents