An improved automatic time-of-flight picker for medical ultrasound tomography Cuiping Li a, * , Lianjie Huang b , Nebojsa Duric a , Haijiang Zhang c , Charlotte Rowe d a Karmanos Cancer Institute, 110 East Warren, Hudson-Webber Cancer Research Center, Wayne State University, Detroit, MI 48201, United States b MS D443, Los Alamos National Laboratory, Los Alamos, NM 87545, United States c Department of Geology and Geophysics, University of Wisconsin-Madison, 1215 W. Dayton Street, Madison, WI 53706, United States d MS D408, Los Alamos National Laboratory, Los Alamos, NM 87545, United States article info Article history: Received 23 January 2008 Received in revised form 12 May 2008 Accepted 14 May 2008 Available online 7 June 2008 Keywords: Automatic time-of-flight picker Clinical ultrasound tomography Akaike information criterion Model inference abstract Objective and motivation Time-of-flight (TOF) tomography used by a clinical ultrasound tomography device can efficiently and reli- ably produce sound–speed images of the breast for cancer diagnosis. Accurate picking of TOFs of trans- mitted ultrasound signals is extremely important to ensure high-resolution and high-quality ultrasound sound–speed tomograms. Since manually picking is time-consuming for large datasets, we developed an improved automatic TOF picker based on the Akaike information criterion (AIC), as described in this paper. Methods We make use of an approach termed multi-model inference (model averaging), based on the calculated AIC values, to improve the accuracy of TOF picks. By using multi-model inference, our picking method incorporates all the information near the TOF of ultrasound signals. Median filtering and reciprocal pair comparison are also incorporated in our AIC picker to effectively remove outliers. Results We validate our AIC picker using synthetic ultrasound waveforms, and demonstrate that our automatic TOF picker can accurately pick TOFs in the presence of random noise with absolute amplitudes up to 80% of the maximum absolute signal amplitude. We apply the new method to 1160 in vivo breast ultrasound waveforms, and compare the picked TOFs with manual picks and amplitude threshold picks. The mean value and standard deviation between our TOF picker and manual picking are 0.4 ls and 0.29 ls, while for amplitude threshold picker the values are 1.02 ls and 0.9 ls, respectively. Tomograms for in vivo breast data with high signal-to-noise ratio (SNR) (25 dB) and low SNR (18 dB) clearly demonstrate that our AIC picker is much less sensitive to the SNRs of the data, compared to the amplitude threshold picker. Discussion and conclusions The picking routine developed here is aimed at determining reliable quantitative values, necessary for adding diagnostic information to our clinical ultrasound tomography device – CURE. It has been success- fully adopted into CURE, and allows us to generate such values reliably. We demonstrate that in vivo sound–speed tomograms with our TOF picks significantly improve the reconstruction accuracy and reduce image artifacts. Ó 2008 Elsevier B.V. All rights reserved. 1. Introduction Ultrasound sound–speed tomography has great potential to detect and diagnose breast cancer ([1–4]). A clinical prototype of ultrasound breast-imaging system with a ring array, termed the computed ultrasound risk evaluation (CURE), has been developed at the Karmanos Cancer Institute, Wayne State University in Detroit, MI for ultrasound tomography [5] (Fig. 1). In general, breast cancer has higher sound–speed than the surrounding breast tissue. A primary purpose of CURE is to efficiently and reliably pro- duce sound–speed images of the breast for cancer detection and diagnosis. A potential sound–speed reconstruction method for such a purpose is time-of-flight (TOF) ultrasound transmission tomography. Accurate picking of TOFs of ultrasound transmitted signals is an extremely important step to ensure high-resolution and high-quality reconstruction of the sound–speed distribution. For each 2D slice of ultrasound breast data, each element of the CURE device acts as a transmitter as well as a receiver, and all ele- ments receive the scattered sound waves when one element trans- mits. CURE acquires 70–80 slices of ultrasound data for whole breast imaging, resulting in a large volume of ultrasound data for 0041-624X/$ - see front matter Ó 2008 Elsevier B.V. All rights reserved. doi:10.1016/j.ultras.2008.05.005 * Corresponding author. Tel.: +1 313 5768768; fax: +1 313 5768767. E-mail address: [email protected] (C. Li). Ultrasonics 49 (2009) 61–72 Contents lists available at ScienceDirect Ultrasonics journal homepage: www.elsevier.com/locate/ultras

Welcome message from author
This document is posted to help you gain knowledge. Please leave a comment to let me know what you think about it! Share it to your friends and learn new things together.
Transcript
Ultrasonics 49 (2009) 61–72
Contents lists available at ScienceDirect
Ultrasonics
journal homepage: www.elsevier .com/locate /u l t ras
An improved automatic time-of-flight picker for medical ultrasound tomography
Cuiping Li a,*, Lianjie Huang b, Nebojsa Duric a, Haijiang Zhang c, Charlotte Rowe d
a Karmanos Cancer Institute, 110 East Warren, Hudson-Webber Cancer Research Center, Wayne State University, Detroit, MI 48201, United Statesb MS D443, Los Alamos National Laboratory, Los Alamos, NM 87545, United Statesc Department of Geology and Geophysics, University of Wisconsin-Madison, 1215 W. Dayton Street, Madison, WI 53706, United Statesd MS D408, Los Alamos National Laboratory, Los Alamos, NM 87545, United States
a r t i c l e i n f o
Article history:Received 23 January 2008Received in revised form 12 May 2008Accepted 14 May 2008Available online 7 June 2008
Keywords:Automatic time-of-flight pickerClinical ultrasound tomographyAkaike information criterionModel inference
0041-624X/$ - see front matter � 2008 Elsevier B.V.doi:10.1016/j.ultras.2008.05.005
* Corresponding author. Tel.: +1 313 5768768; fax:E-mail address: [email protected] (C. Li).
a b s t r a c t
Objective and motivationTime-of-flight (TOF) tomography used by a clinical ultrasound tomography device can efficiently and reli-ably produce sound–speed images of the breast for cancer diagnosis. Accurate picking of TOFs of trans-mitted ultrasound signals is extremely important to ensure high-resolution and high-quality ultrasoundsound–speed tomograms. Since manually picking is time-consuming for large datasets, we developed animproved automatic TOF picker based on the Akaike information criterion (AIC), as described in thispaper.MethodsWe make use of an approach termed multi-model inference (model averaging), based on the calculatedAIC values, to improve the accuracy of TOF picks. By using multi-model inference, our picking methodincorporates all the information near the TOF of ultrasound signals. Median filtering and reciprocal paircomparison are also incorporated in our AIC picker to effectively remove outliers.ResultsWe validate our AIC picker using synthetic ultrasound waveforms, and demonstrate that our automaticTOF picker can accurately pick TOFs in the presence of random noise with absolute amplitudes up to 80%of the maximum absolute signal amplitude. We apply the new method to 1160 in vivo breast ultrasoundwaveforms, and compare the picked TOFs with manual picks and amplitude threshold picks. The meanvalue and standard deviation between our TOF picker and manual picking are 0.4 ls and 0.29 ls, whilefor amplitude threshold picker the values are 1.02 ls and 0.9 ls, respectively. Tomograms for in vivobreast data with high signal-to-noise ratio (SNR) (�25 dB) and low SNR (�18 dB) clearly demonstratethat our AIC picker is much less sensitive to the SNRs of the data, compared to the amplitude thresholdpicker.Discussion and conclusionsThe picking routine developed here is aimed at determining reliable quantitative values, necessary foradding diagnostic information to our clinical ultrasound tomography device – CURE. It has been success-fully adopted into CURE, and allows us to generate such values reliably. We demonstrate that in vivosound–speed tomograms with our TOF picks significantly improve the reconstruction accuracy andreduce image artifacts.
� 2008 Elsevier B.V. All rights reserved.
1. Introduction
Ultrasound sound–speed tomography has great potential todetect and diagnose breast cancer ([1–4]). A clinical prototype ofultrasound breast-imaging system with a ring array, termed thecomputed ultrasound risk evaluation (CURE), has been developedat the Karmanos Cancer Institute, Wayne State University inDetroit, MI for ultrasound tomography [5] (Fig. 1). In general,breast cancer has higher sound–speed than the surrounding breast
All rights reserved.
+1 313 5768767.
tissue. A primary purpose of CURE is to efficiently and reliably pro-duce sound–speed images of the breast for cancer detection anddiagnosis. A potential sound–speed reconstruction method forsuch a purpose is time-of-flight (TOF) ultrasound transmissiontomography. Accurate picking of TOFs of ultrasound transmittedsignals is an extremely important step to ensure high-resolutionand high-quality reconstruction of the sound–speed distribution.
For each 2D slice of ultrasound breast data, each element of theCURE device acts as a transmitter as well as a receiver, and all ele-ments receive the scattered sound waves when one element trans-mits. CURE acquires 70–80 slices of ultrasound data for wholebreast imaging, resulting in a large volume of ultrasound data for
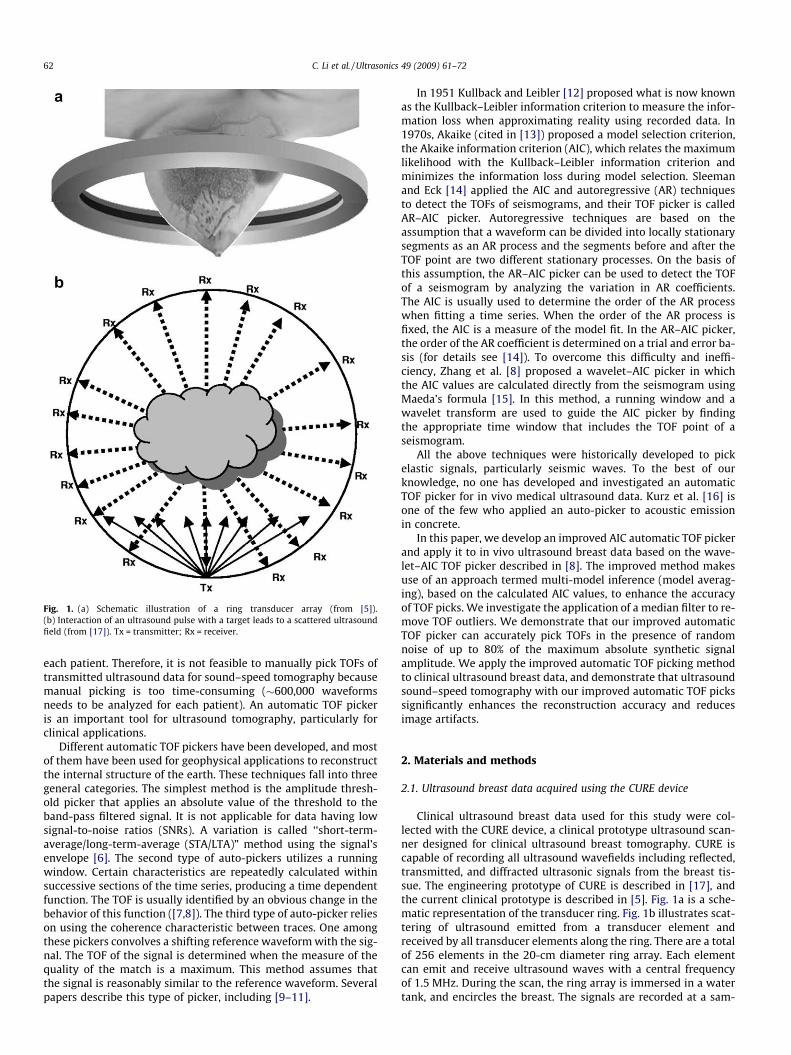
Fig. 1. (a) Schematic illustration of a ring transducer array (from [5]).(b) Interaction of an ultrasound pulse with a target leads to a scattered ultrasoundfield (from [17]). Tx = transmitter; Rx = receiver.
62 C. Li et al. / Ultrasonics 49 (2009) 61–72
each patient. Therefore, it is not feasible to manually pick TOFs oftransmitted ultrasound data for sound–speed tomography becausemanual picking is too time-consuming (�600,000 waveformsneeds to be analyzed for each patient). An automatic TOF pickeris an important tool for ultrasound tomography, particularly forclinical applications.
Different automatic TOF pickers have been developed, and mostof them have been used for geophysical applications to reconstructthe internal structure of the earth. These techniques fall into threegeneral categories. The simplest method is the amplitude thresh-old picker that applies an absolute value of the threshold to theband-pass filtered signal. It is not applicable for data having lowsignal-to-noise ratios (SNRs). A variation is called ‘‘short-term-average/long-term-average (STA/LTA)” method using the signal’senvelope [6]. The second type of auto-pickers utilizes a runningwindow. Certain characteristics are repeatedly calculated withinsuccessive sections of the time series, producing a time dependentfunction. The TOF is usually identified by an obvious change in thebehavior of this function ([7,8]). The third type of auto-picker relieson using the coherence characteristic between traces. One amongthese pickers convolves a shifting reference waveform with the sig-nal. The TOF of the signal is determined when the measure of thequality of the match is a maximum. This method assumes thatthe signal is reasonably similar to the reference waveform. Severalpapers describe this type of picker, including [9–11].
In 1951 Kullback and Leibler [12] proposed what is now knownas the Kullback–Leibler information criterion to measure the infor-mation loss when approximating reality using recorded data. In1970s, Akaike (cited in [13]) proposed a model selection criterion,the Akaike information criterion (AIC), which relates the maximumlikelihood with the Kullback–Leibler information criterion andminimizes the information loss during model selection. Sleemanand Eck [14] applied the AIC and autoregressive (AR) techniquesto detect the TOFs of seismograms, and their TOF picker is calledAR–AIC picker. Autoregressive techniques are based on theassumption that a waveform can be divided into locally stationarysegments as an AR process and the segments before and after theTOF point are two different stationary processes. On the basis ofthis assumption, the AR–AIC picker can be used to detect the TOFof a seismogram by analyzing the variation in AR coefficients.The AIC is usually used to determine the order of the AR processwhen fitting a time series. When the order of the AR process isfixed, the AIC is a measure of the model fit. In the AR–AIC picker,the order of the AR coefficient is determined on a trial and error ba-sis (for details see [14]). To overcome this difficulty and ineffi-ciency, Zhang et al. [8] proposed a wavelet–AIC picker in whichthe AIC values are calculated directly from the seismogram usingMaeda’s formula [15]. In this method, a running window and awavelet transform are used to guide the AIC picker by findingthe appropriate time window that includes the TOF point of aseismogram.
All the above techniques were historically developed to pickelastic signals, particularly seismic waves. To the best of ourknowledge, no one has developed and investigated an automaticTOF picker for in vivo medical ultrasound data. Kurz et al. [16] isone of the few who applied an auto-picker to acoustic emissionin concrete.
In this paper, we develop an improved AIC automatic TOF pickerand apply it to in vivo ultrasound breast data based on the wave-let–AIC TOF picker described in [8]. The improved method makesuse of an approach termed multi-model inference (model averag-ing), based on the calculated AIC values, to enhance the accuracyof TOF picks. We investigate the application of a median filter to re-move TOF outliers. We demonstrate that our improved automaticTOF picker can accurately pick TOFs in the presence of randomnoise of up to 80% of the maximum absolute synthetic signalamplitude. We apply the improved automatic TOF picking methodto clinical ultrasound breast data, and demonstrate that ultrasoundsound–speed tomography with our improved automatic TOF pickssignificantly enhances the reconstruction accuracy and reducesimage artifacts.
2. Materials and methods
2.1. Ultrasound breast data acquired using the CURE device
Clinical ultrasound breast data used for this study were col-lected with the CURE device, a clinical prototype ultrasound scan-ner designed for clinical ultrasound breast tomography. CURE iscapable of recording all ultrasound wavefields including reflected,transmitted, and diffracted ultrasonic signals from the breast tis-sue. The engineering prototype of CURE is described in [17], andthe current clinical prototype is described in [5]. Fig. 1a is a sche-matic representation of the transducer ring. Fig. 1b illustrates scat-tering of ultrasound emitted from a transducer element andreceived by all transducer elements along the ring. There are a totalof 256 elements in the 20-cm diameter ring array. Each elementcan emit and receive ultrasound waves with a central frequencyof 1.5 MHz. During the scan, the ring array is immersed in a watertank, and encircles the breast. The signals are recorded at a sam-
Determine TOF using Equation (5)
Calculate a predefined time window using the sound-speed of water
Calculate AIC values for the original data within the predefined window
Calculate a weighted average model for the signal segment in the new time window using Equations (3) and (4)
Rejected
Accept
Repeat the above process for all waveforms
If difference ≤ threshold
Apply the median filter to the TOFs (Equation (6))
Replaced by median values
If difference > threshold
Compare TOFs of reciprocal transmitter-receiver pairs
Discard
Output TOFs
Fig. 2. Schematic flowchart of our improved AIC picker.
C. Li et al. / Ultrasonics 49 (2009) 61–72 63
pling rate of 6.25 MHz. The whole breast is scanned slice by slice,and the scanned slice data are recorded by a computer for dataprocessing afterwards. A motorized gantry is used to translatethe ring along the vertical direction, starting from the chest wallto the nipple.
2.2. Improved automatic AIC time-of-flight picker
The wavelet–AIC TOF picker [8] is based on the AR–AIC pickerwhich assumes that a signal can be divided into locally stationarysegments and that the segments before and after the time-of-flightpoint are two different stationary processes ([14]). Data pointswithin the selected time window are divided into two segmentsat each data point i (i ¼ 1; :::; k; :::;N; where N is the total numberof data points in the selected time window). For a given data pointk the wavelet–AIC TOF picker uses Maeda’s formula ([15]) to calcu-late the AIC function directly from the waveform
AICðkÞ ¼ klogðvarðSð1; kÞÞÞ þ ðN � k� 1ÞlogðvarðSðkþ 1;NÞÞÞ; ð1Þ
where S(1, k) (for data points 1 through k) and S(k + 1, N) (for datapoints k + 1 through N) are the two segments in the selected timewindow, and the variance function ‘‘var(�)” is calculated using
varðSði; jÞÞ ¼ r2j�i ¼
1j� i
Xj
l¼i
ðSðl; lÞ � �SÞ2;
i 6 j; i ¼ 1; . . . ;N and j ¼ 1; . . . ;N; ð2Þ
where �S is the mean value of S(i,j) The AIC value given by Eq. (1)measures the information loss of using the current selected modelto approximate reality. In the wavelet–AIC auto-picker in [8], thepoint with minimum AIC value (that indicates the minimum infor-mation loss, therefore it is called the best model) is selected to bethe TOF point.
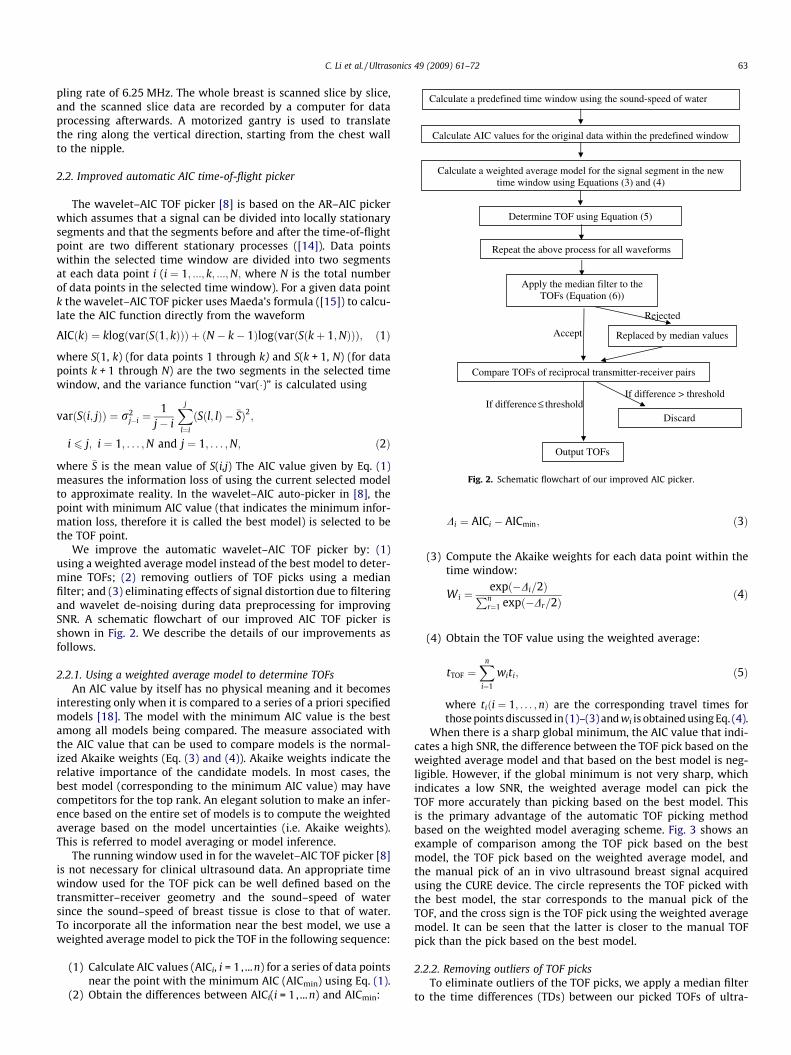
We improve the automatic wavelet–AIC TOF picker by: (1)using a weighted average model instead of the best model to deter-mine TOFs; (2) removing outliers of TOF picks using a medianfilter; and (3) eliminating effects of signal distortion due to filteringand wavelet de-noising during data preprocessing for improvingSNR. A schematic flowchart of our improved AIC TOF picker isshown in Fig. 2. We describe the details of our improvements asfollows.
2.2.1. Using a weighted average model to determine TOFsAn AIC value by itself has no physical meaning and it becomes
interesting only when it is compared to a series of a priori specifiedmodels [18]. The model with the minimum AIC value is the bestamong all models being compared. The measure associated withthe AIC value that can be used to compare models is the normal-ized Akaike weights (Eq. (3) and (4)). Akaike weights indicate therelative importance of the candidate models. In most cases, thebest model (corresponding to the minimum AIC value) may havecompetitors for the top rank. An elegant solution to make an infer-ence based on the entire set of models is to compute the weightedaverage based on the model uncertainties (i.e. Akaike weights).This is referred to model averaging or model inference.
The running window used in for the wavelet–AIC TOF picker [8]is not necessary for clinical ultrasound data. An appropriate timewindow used for the TOF pick can be well defined based on thetransmitter–receiver geometry and the sound–speed of watersince the sound–speed of breast tissue is close to that of water.To incorporate all the information near the best model, we use aweighted average model to pick the TOF in the following sequence:
(1) Calculate AIC values (AICi, i = 1, ...n) for a series of data pointsnear the point with the minimum AIC (AICmin) using Eq. (1).
(2) Obtain the differences between AICi(i = 1, ...n) and AICmin:
Di ¼ AICi � AICmin; ð3Þ
(3) Compute the Akaike weights for each data point within thetime window:
Wi ¼expð�Di=2ÞPn
r¼1 expð�Dr=2Þð4Þ
(4) Obtain the TOF value using the weighted average:
tTOF ¼Xn
i¼1
witi; ð5Þ
where tiði ¼ 1; . . . ; nÞ are the corresponding travel times forthose points discussed in (1)–(3) and wi is obtained using Eq. (4).
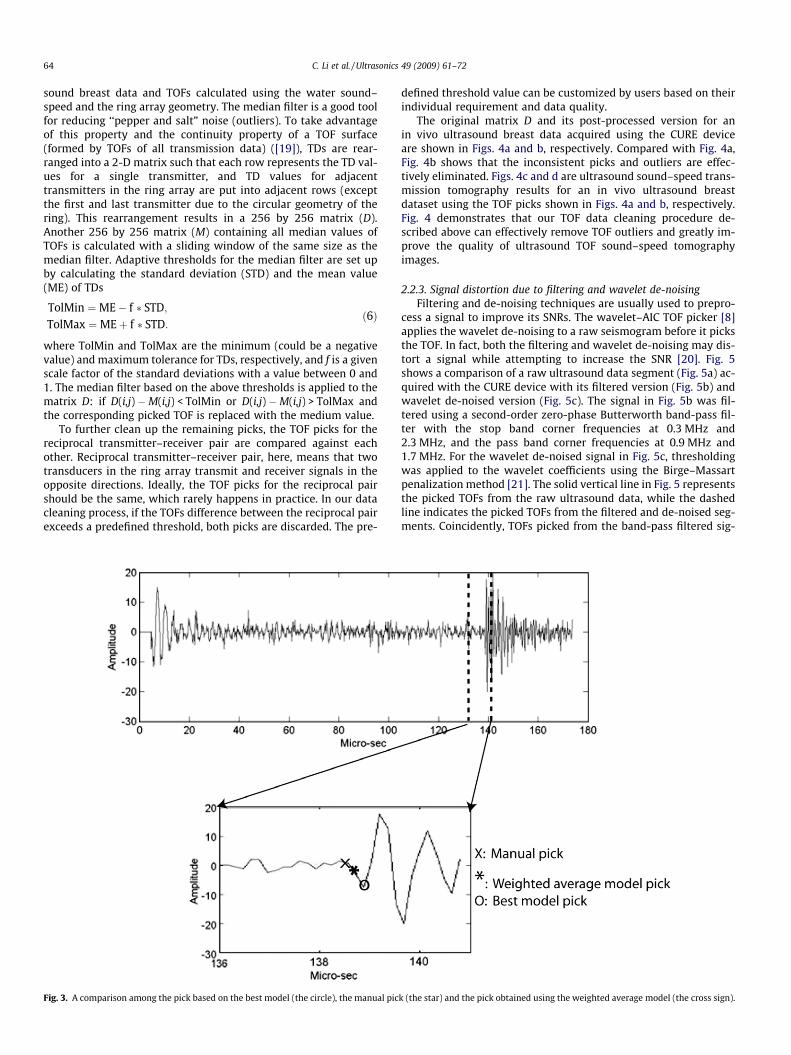
When there is a sharp global minimum, the AIC value that indi-cates a high SNR, the difference between the TOF pick based on theweighted average model and that based on the best model is neg-ligible. However, if the global minimum is not very sharp, whichindicates a low SNR, the weighted average model can pick theTOF more accurately than picking based on the best model. Thisis the primary advantage of the automatic TOF picking methodbased on the weighted model averaging scheme. Fig. 3 shows anexample of comparison among the TOF pick based on the bestmodel, the TOF pick based on the weighted average model, andthe manual pick of an in vivo ultrasound breast signal acquiredusing the CURE device. The circle represents the TOF picked withthe best model, the star corresponds to the manual pick of theTOF, and the cross sign is the TOF pick using the weighted averagemodel. It can be seen that the latter is closer to the manual TOFpick than the pick based on the best model.
2.2.2. Removing outliers of TOF picksTo eliminate outliers of the TOF picks, we apply a median filter
to the time differences (TDs) between our picked TOFs of ultra-
64 C. Li et al. / Ultrasonics 49 (2009) 61–72
sound breast data and TOFs calculated using the water sound–speed and the ring array geometry. The median filter is a good toolfor reducing ‘‘pepper and salt” noise (outliers). To take advantageof this property and the continuity property of a TOF surface(formed by TOFs of all transmission data) ([19]), TDs are rear-ranged into a 2-D matrix such that each row represents the TD val-ues for a single transmitter, and TD values for adjacenttransmitters in the ring array are put into adjacent rows (exceptthe first and last transmitter due to the circular geometry of thering). This rearrangement results in a 256 by 256 matrix (D).Another 256 by 256 matrix (M) containing all median values ofTOFs is calculated with a sliding window of the same size as themedian filter. Adaptive thresholds for the median filter are set upby calculating the standard deviation (STD) and the mean value(ME) of TDs
TolMin ¼ME� f � STD;TolMax ¼MEþ f � STD:
ð6Þ
where TolMin and TolMax are the minimum (could be a negativevalue) and maximum tolerance for TDs, respectively, and f is a givenscale factor of the standard deviations with a value between 0 and1. The median filter based on the above thresholds is applied to thematrix D: if D(i,j) �M(i,j) < TolMin or D(i,j) �M(i,j) > TolMax andthe corresponding picked TOF is replaced with the medium value.
To further clean up the remaining picks, the TOF picks for thereciprocal transmitter–receiver pair are compared against eachother. Reciprocal transmitter–receiver pair, here, means that twotransducers in the ring array transmit and receiver signals in theopposite directions. Ideally, the TOF picks for the reciprocal pairshould be the same, which rarely happens in practice. In our datacleaning process, if the TOFs difference between the reciprocal pairexceeds a predefined threshold, both picks are discarded. The pre-
Fig. 3. A comparison among the pick based on the best model (the circle), the manual pic
defined threshold value can be customized by users based on theirindividual requirement and data quality.
The original matrix D and its post-processed version for anin vivo ultrasound breast data acquired using the CURE deviceare shown in Figs. 4a and b, respectively. Compared with Fig. 4a,Fig. 4b shows that the inconsistent picks and outliers are effec-tively eliminated. Figs. 4c and d are ultrasound sound–speed trans-mission tomography results for an in vivo ultrasound breastdataset using the TOF picks shown in Figs. 4a and b, respectively.Fig. 4 demonstrates that our TOF data cleaning procedure de-scribed above can effectively remove TOF outliers and greatly im-prove the quality of ultrasound TOF sound–speed tomographyimages.
2.2.3. Signal distortion due to filtering and wavelet de-noisingFiltering and de-noising techniques are usually used to prepro-
cess a signal to improve its SNRs. The wavelet–AIC TOF picker [8]applies the wavelet de-noising to a raw seismogram before it picksthe TOF. In fact, both the filtering and wavelet de-noising may dis-tort a signal while attempting to increase the SNR [20]. Fig. 5shows a comparison of a raw ultrasound data segment (Fig. 5a) ac-quired with the CURE device with its filtered version (Fig. 5b) andwavelet de-noised version (Fig. 5c). The signal in Fig. 5b was fil-tered using a second-order zero-phase Butterworth band-pass fil-ter with the stop band corner frequencies at 0.3 MHz and2.3 MHz, and the pass band corner frequencies at 0.9 MHz and1.7 MHz. For the wavelet de-noised signal in Fig. 5c, thresholdingwas applied to the wavelet coefficients using the Birge–Massartpenalization method [21]. The solid vertical line in Fig. 5 representsthe picked TOFs from the raw ultrasound data, while the dashedline indicates the picked TOFs from the filtered and de-noised seg-ments. Coincidently, TOFs picked from the band-pass filtered sig-
k (the star) and the pick obtained using the weighted average model (the cross sign).
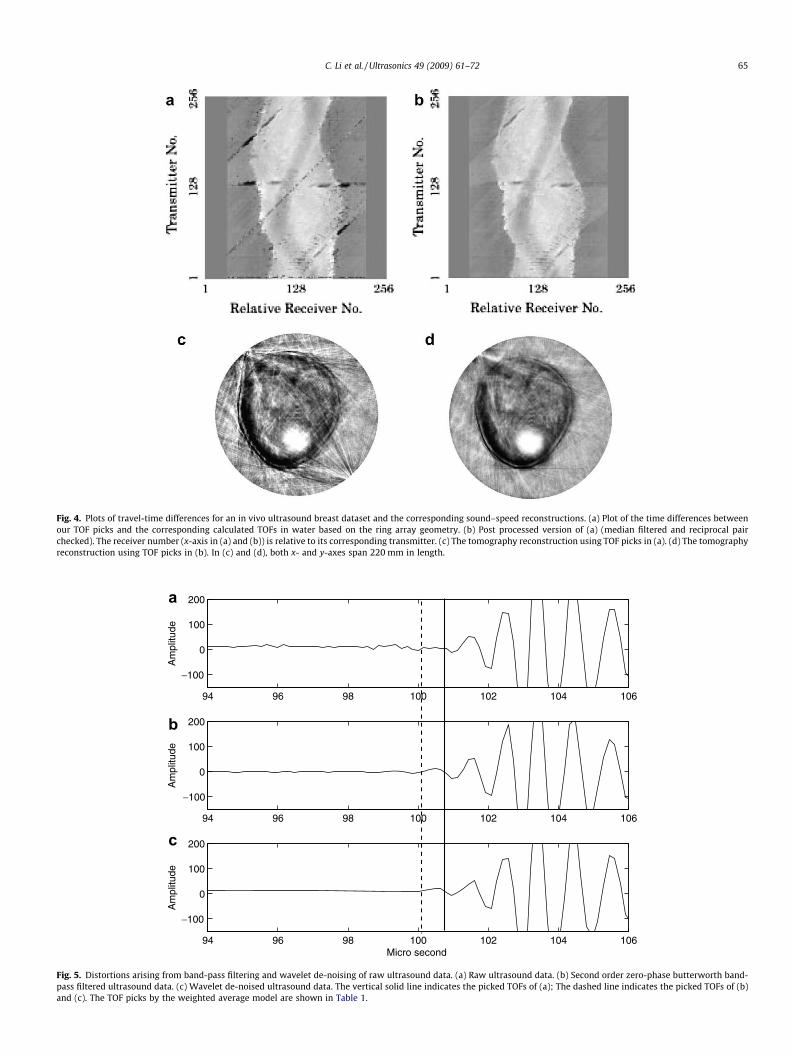
Fig. 4. Plots of travel-time differences for an in vivo ultrasound breast dataset and the corresponding sound–speed reconstructions. (a) Plot of the time differences betweenour TOF picks and the corresponding calculated TOFs in water based on the ring array geometry. (b) Post processed version of (a) (median filtered and reciprocal pairchecked). The receiver number (x-axis in (a) and (b)) is relative to its corresponding transmitter. (c) The tomography reconstruction using TOF picks in (a). (d) The tomographyreconstruction using TOF picks in (b). In (c) and (d), both x- and y-axes span 220 mm in length.
94 96 98 100 102 104 106
−100
0
100
200
Am
plitu
de
94 96 98 100 102 104 106
−100
0
100
200
Am
plitu
de
94 96 98 100 102 104 106
−100
0
100
200
Am
plitu
de
Micro second
a
b
c
Fig. 5. Distortions arising from band-pass filtering and wavelet de-noising of raw ultrasound data. (a) Raw ultrasound data. (b) Second order zero-phase butterworth band-pass filtered ultrasound data. (c) Wavelet de-noised ultrasound data. The vertical solid line indicates the picked TOFs of (a); The dashed line indicates the picked TOFs of (b)and (c). The TOF picks by the weighted average model are shown in Table 1.
C. Li et al. / Ultrasonics 49 (2009) 61–72 65
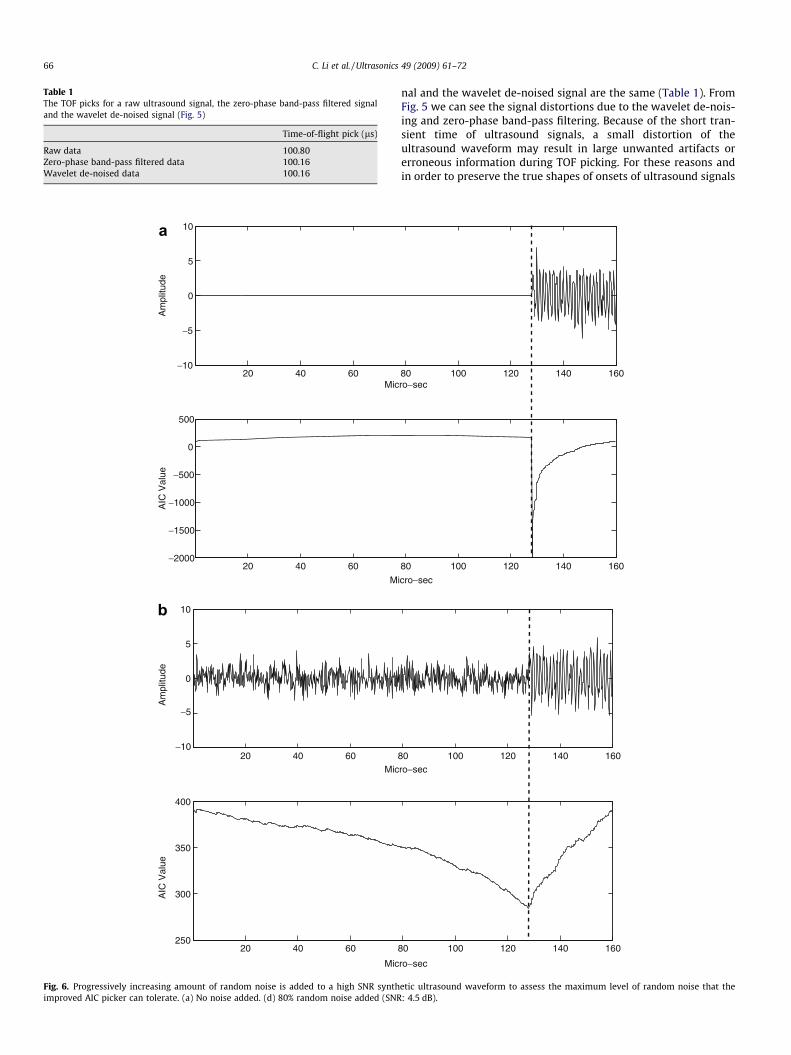
Table 1The TOF picks for a raw ultrasound signal, the zero-phase band-pass filtered signaland the wavelet de-noised signal (Fig. 5)
Time-of-flight pick (ls)
Raw data 100.80Zero-phase band-pass filtered data 100.16Wavelet de-noised data 100.16
20 40 60−10
−5
−10
−5
0
5
10
Mic
Mic
Mic
M
Am
plitu
de
20 40 60−2000
−1500
−1000
−500
0
500
AIC
Val
ueA
mpl
itude
AIC
Val
ue
20 40 60
0
5
10
20 40 60250
300
350
400
a
b
Fig. 6. Progressively increasing amount of random noise is added to a high SNR synthimproved AIC picker can tolerate. (a) No noise added. (d) 80% random noise added (SNR
66 C. Li et al. / Ultrasonics 49 (2009) 61–72
nal and the wavelet de-noised signal are the same (Table 1). FromFig. 5 we can see the signal distortions due to the wavelet de-nois-ing and zero-phase band-pass filtering. Because of the short tran-sient time of ultrasound signals, a small distortion of theultrasound waveform may result in large unwanted artifacts orerroneous information during TOF picking. For these reasons andin order to preserve the true shapes of onsets of ultrasound signals
80 100 120 140 160ro−sec
ro−sec
ro−sec
icro−sec
80 100 120 140 160
80 100 120 140 160
80 100 120 140 160
etic ultrasound waveform to assess the maximum level of random noise that the: 4.5 dB).
45 50 55 60 65 70 75 80 85 90 95 1000
10
20
30
40
50
60
<
<<
<<
Time (micro-sec)
Trac
es n
umbe
r + 1
0
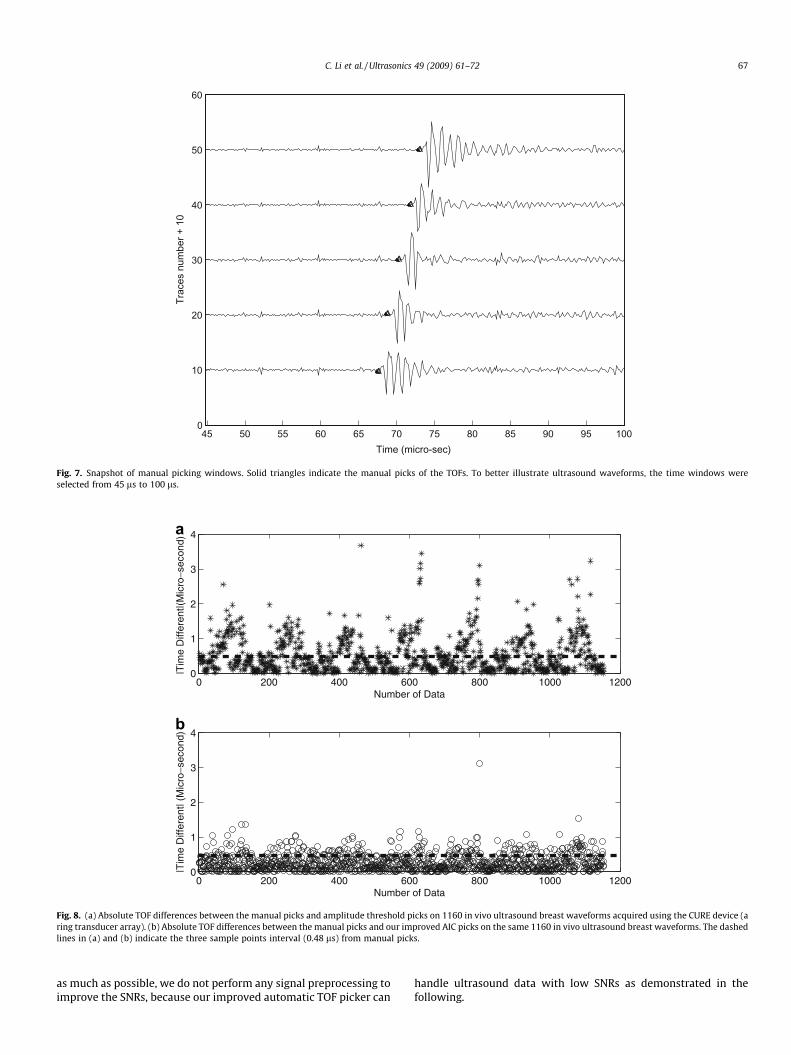
Fig. 7. Snapshot of manual picking windows. Solid triangles indicate the manual picks of the TOFs. To better illustrate ultrasound waveforms, the time windows wereselected from 45 ls to 100 ls.
0 200 400 600 800 1000 12000
1
2
3
4
|Tim
e D
iffer
ent|(
Mic
ro−s
econ
d)|T
ime
Diff
eren
t| (M
icro
−sec
ond)
Number of Data
0 200 400 600 800 1000 12000
1
2
3
4
Number of Data
a
b
Fig. 8. (a) Absolute TOF differences between the manual picks and amplitude threshold picks on 1160 in vivo ultrasound breast waveforms acquired using the CURE device (aring transducer array). (b) Absolute TOF differences between the manual picks and our improved AIC picks on the same 1160 in vivo ultrasound breast waveforms. The dashedlines in (a) and (b) indicate the three sample points interval (0.48 ls) from manual picks.
C. Li et al. / Ultrasonics 49 (2009) 61–72 67
as much as possible, we do not perform any signal preprocessing toimprove the SNRs, because our improved automatic TOF picker can
handle ultrasound data with low SNRs as demonstrated in thefollowing.
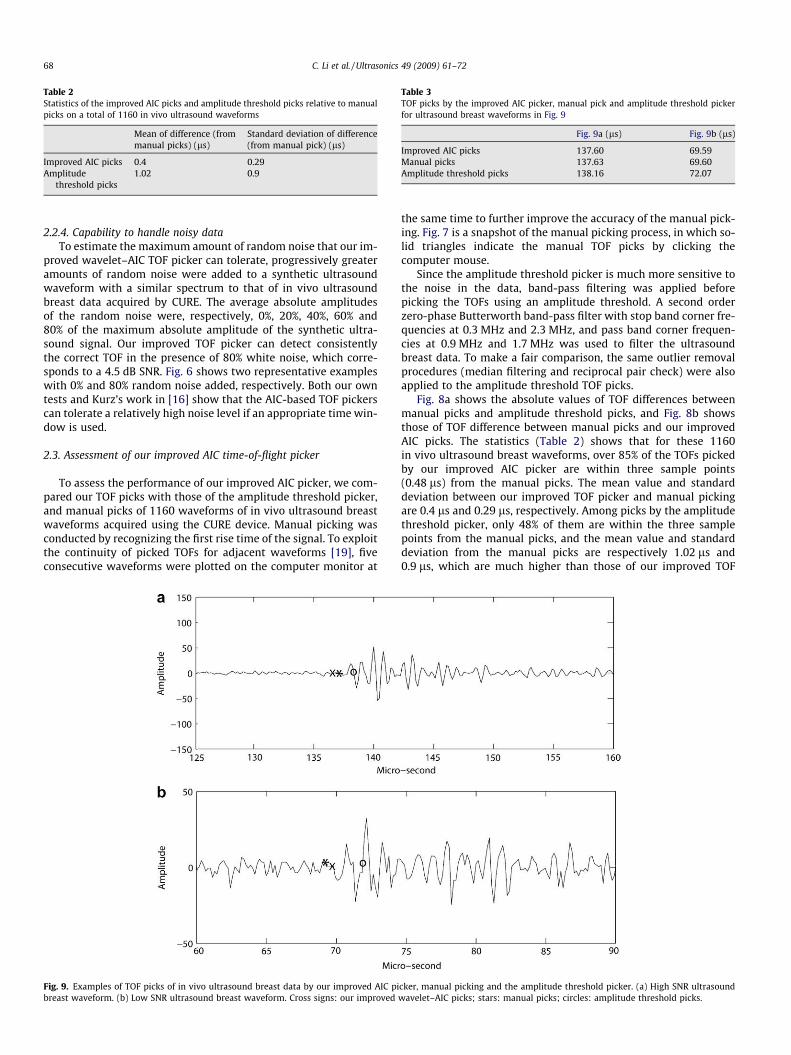
Table 2Statistics of the improved AIC picks and amplitude threshold picks relative to manualpicks on a total of 1160 in vivo ultrasound waveforms
Mean of difference (frommanual picks) (ls)
Standard deviation of difference(from manual pick) (ls)
Improved AIC picks 0.4 0.29Amplitude
threshold picks1.02 0.9
Table 3TOF picks by the improved AIC picker, manual pick and amplitude threshold pickerfor ultrasound breast waveforms in Fig. 9
Fig. 9a (ls) Fig. 9b (ls)
Improved AIC picks 137.60 69.59Manual picks 137.63 69.60Amplitude threshold picks 138.16 72.07
68 C. Li et al. / Ultrasonics 49 (2009) 61–72
2.2.4. Capability to handle noisy dataTo estimate the maximum amount of random noise that our im-
proved wavelet–AIC TOF picker can tolerate, progressively greateramounts of random noise were added to a synthetic ultrasoundwaveform with a similar spectrum to that of in vivo ultrasoundbreast data acquired by CURE. The average absolute amplitudesof the random noise were, respectively, 0%, 20%, 40%, 60% and80% of the maximum absolute amplitude of the synthetic ultra-sound signal. Our improved TOF picker can detect consistentlythe correct TOF in the presence of 80% white noise, which corre-sponds to a 4.5 dB SNR. Fig. 6 shows two representative exampleswith 0% and 80% random noise added, respectively. Both our owntests and Kurz’s work in [16] show that the AIC-based TOF pickerscan tolerate a relatively high noise level if an appropriate time win-dow is used.
2.3. Assessment of our improved AIC time-of-flight picker
To assess the performance of our improved AIC picker, we com-pared our TOF picks with those of the amplitude threshold picker,and manual picks of 1160 waveforms of in vivo ultrasound breastwaveforms acquired using the CURE device. Manual picking wasconducted by recognizing the first rise time of the signal. To exploitthe continuity of picked TOFs for adjacent waveforms [19], fiveconsecutive waveforms were plotted on the computer monitor at
Fig. 9. Examples of TOF picks of in vivo ultrasound breast data by our improved AIC pibreast waveform. (b) Low SNR ultrasound breast waveform. Cross signs: our improved
the same time to further improve the accuracy of the manual pick-ing. Fig. 7 is a snapshot of the manual picking process, in which so-lid triangles indicate the manual TOF picks by clicking thecomputer mouse.
Since the amplitude threshold picker is much more sensitive tothe noise in the data, band-pass filtering was applied beforepicking the TOFs using an amplitude threshold. A second orderzero-phase Butterworth band-pass filter with stop band corner fre-quencies at 0.3 MHz and 2.3 MHz, and pass band corner frequen-cies at 0.9 MHz and 1.7 MHz was used to filter the ultrasoundbreast data. To make a fair comparison, the same outlier removalprocedures (median filtering and reciprocal pair check) were alsoapplied to the amplitude threshold TOF picks.
Fig. 8a shows the absolute values of TOF differences betweenmanual picks and amplitude threshold picks, and Fig. 8b showsthose of TOF difference between manual picks and our improvedAIC picks. The statistics (Table 2) shows that for these 1160in vivo ultrasound breast waveforms, over 85% of the TOFs pickedby our improved AIC picker are within three sample points(0.48 ls) from the manual picks. The mean value and standarddeviation between our improved TOF picker and manual pickingare 0.4 ls and 0.29 ls, respectively. Among picks by the amplitudethreshold picker, only 48% of them are within the three samplepoints from the manual picks, and the mean value and standarddeviation from the manual picks are respectively 1.02 ls and0.9 ls, which are much higher than those of our improved TOF
cker, manual picking and the amplitude threshold picker. (a) High SNR ultrasoundwavelet–AIC picks; stars: manual picks; circles: amplitude threshold picks.
100 110 120 130 140 150120
125
130
135
140
145
150
Receiver
Tim
e (m
icro
−sec
)
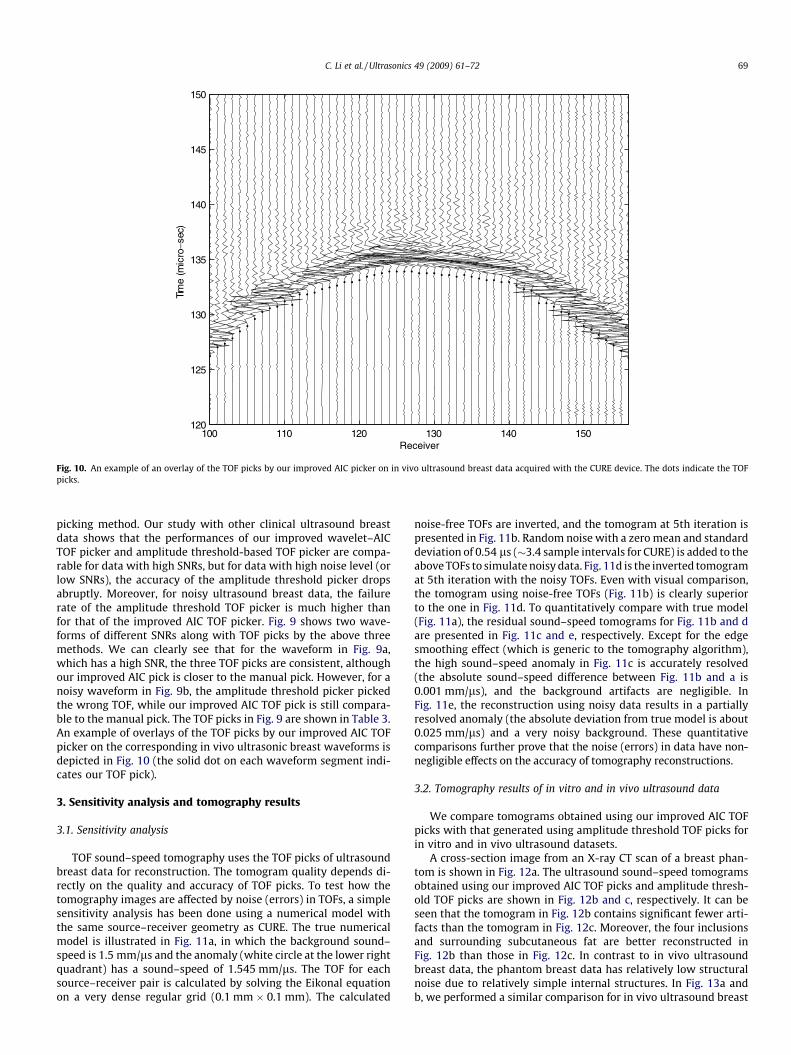
Fig. 10. An example of an overlay of the TOF picks by our improved AIC picker on in vivo ultrasound breast data acquired with the CURE device. The dots indicate the TOFpicks.
C. Li et al. / Ultrasonics 49 (2009) 61–72 69
picking method. Our study with other clinical ultrasound breastdata shows that the performances of our improved wavelet–AICTOF picker and amplitude threshold-based TOF picker are compa-rable for data with high SNRs, but for data with high noise level (orlow SNRs), the accuracy of the amplitude threshold picker dropsabruptly. Moreover, for noisy ultrasound breast data, the failurerate of the amplitude threshold TOF picker is much higher thanfor that of the improved AIC TOF picker. Fig. 9 shows two wave-forms of different SNRs along with TOF picks by the above threemethods. We can clearly see that for the waveform in Fig. 9a,which has a high SNR, the three TOF picks are consistent, althoughour improved AIC pick is closer to the manual pick. However, for anoisy waveform in Fig. 9b, the amplitude threshold picker pickedthe wrong TOF, while our improved AIC TOF pick is still compara-ble to the manual pick. The TOF picks in Fig. 9 are shown in Table 3.An example of overlays of the TOF picks by our improved AIC TOFpicker on the corresponding in vivo ultrasonic breast waveforms isdepicted in Fig. 10 (the solid dot on each waveform segment indi-cates our TOF pick).
3. Sensitivity analysis and tomography results
3.1. Sensitivity analysis
TOF sound–speed tomography uses the TOF picks of ultrasoundbreast data for reconstruction. The tomogram quality depends di-rectly on the quality and accuracy of TOF picks. To test how thetomography images are affected by noise (errors) in TOFs, a simplesensitivity analysis has been done using a numerical model withthe same source–receiver geometry as CURE. The true numericalmodel is illustrated in Fig. 11a, in which the background sound–speed is 1.5 mm/ls and the anomaly (white circle at the lower rightquadrant) has a sound–speed of 1.545 mm/ls. The TOF for eachsource–receiver pair is calculated by solving the Eikonal equationon a very dense regular grid (0.1 mm � 0.1 mm). The calculated
noise-free TOFs are inverted, and the tomogram at 5th iteration ispresented in Fig. 11b. Random noise with a zero mean and standarddeviation of 0.54 ls (�3.4 sample intervals for CURE) is added to theabove TOFs to simulate noisy data. Fig. 11d is the inverted tomogramat 5th iteration with the noisy TOFs. Even with visual comparison,the tomogram using noise-free TOFs (Fig. 11b) is clearly superiorto the one in Fig. 11d. To quantitatively compare with true model(Fig. 11a), the residual sound–speed tomograms for Fig. 11b and dare presented in Fig. 11c and e, respectively. Except for the edgesmoothing effect (which is generic to the tomography algorithm),the high sound–speed anomaly in Fig. 11c is accurately resolved(the absolute sound–speed difference between Fig. 11b and a is0.001 mm/ls), and the background artifacts are negligible. InFig. 11e, the reconstruction using noisy data results in a partiallyresolved anomaly (the absolute deviation from true model is about0.025 mm/ls) and a very noisy background. These quantitativecomparisons further prove that the noise (errors) in data have non-negligible effects on the accuracy of tomography reconstructions.
3.2. Tomography results of in vitro and in vivo ultrasound data
We compare tomograms obtained using our improved AIC TOFpicks with that generated using amplitude threshold TOF picks forin vitro and in vivo ultrasound datasets.
A cross-section image from an X-ray CT scan of a breast phan-tom is shown in Fig. 12a. The ultrasound sound–speed tomogramsobtained using our improved AIC TOF picks and amplitude thresh-old TOF picks are shown in Fig. 12b and c, respectively. It can beseen that the tomogram in Fig. 12b contains significant fewer arti-facts than the tomogram in Fig. 12c. Moreover, the four inclusionsand surrounding subcutaneous fat are better reconstructed inFig. 12b than those in Fig. 12c. In contrast to in vivo ultrasoundbreast data, the phantom breast data has relatively low structuralnoise due to relatively simple internal structures. In Fig. 13a andb, we performed a similar comparison for in vivo ultrasound breast
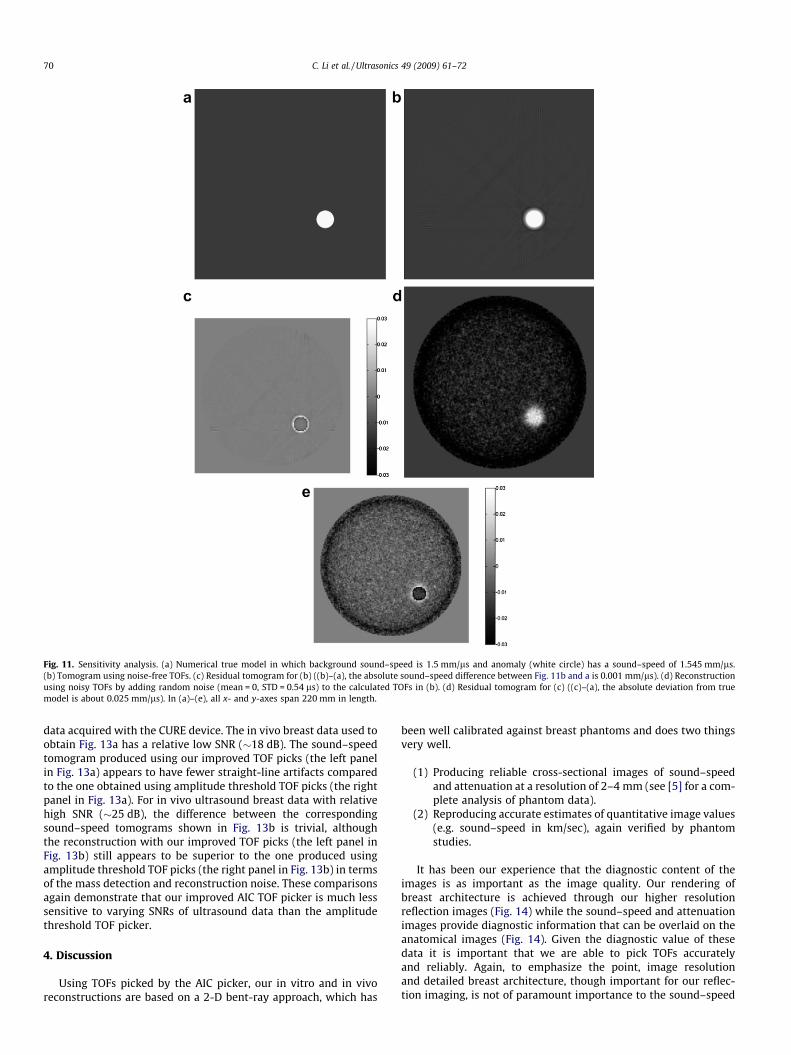
Fig. 11. Sensitivity analysis. (a) Numerical true model in which background sound–speed is 1.5 mm/ls and anomaly (white circle) has a sound–speed of 1.545 mm/ls.(b) Tomogram using noise-free TOFs. (c) Residual tomogram for (b) ((b)–(a), the absolute sound–speed difference between Fig. 11b and a is 0.001 mm/ls). (d) Reconstructionusing noisy TOFs by adding random noise (mean = 0, STD = 0.54 ls) to the calculated TOFs in (b). (d) Residual tomogram for (c) ((c)–(a), the absolute deviation from truemodel is about 0.025 mm/ls). In (a)–(e), all x- and y-axes span 220 mm in length.
70 C. Li et al. / Ultrasonics 49 (2009) 61–72
data acquired with the CURE device. The in vivo breast data used toobtain Fig. 13a has a relative low SNR (�18 dB). The sound–speedtomogram produced using our improved TOF picks (the left panelin Fig. 13a) appears to have fewer straight-line artifacts comparedto the one obtained using amplitude threshold TOF picks (the rightpanel in Fig. 13a). For in vivo ultrasound breast data with relativehigh SNR (�25 dB), the difference between the correspondingsound–speed tomograms shown in Fig. 13b is trivial, althoughthe reconstruction with our improved TOF picks (the left panel inFig. 13b) still appears to be superior to the one produced usingamplitude threshold TOF picks (the right panel in Fig. 13b) in termsof the mass detection and reconstruction noise. These comparisonsagain demonstrate that our improved AIC TOF picker is much lesssensitive to varying SNRs of ultrasound data than the amplitudethreshold TOF picker.
4. Discussion
Using TOFs picked by the AIC picker, our in vitro and in vivoreconstructions are based on a 2-D bent-ray approach, which has
been well calibrated against breast phantoms and does two thingsvery well.
(1) Producing reliable cross-sectional images of sound–speedand attenuation at a resolution of 2–4 mm (see [5] for a com-plete analysis of phantom data).
(2) Reproducing accurate estimates of quantitative image values(e.g. sound–speed in km/sec), again verified by phantomstudies.
It has been our experience that the diagnostic content of theimages is as important as the image quality. Our rendering ofbreast architecture is achieved through our higher resolutionreflection images (Fig. 14) while the sound–speed and attenuationimages provide diagnostic information that can be overlaid on theanatomical images (Fig. 14). Given the diagnostic value of thesedata it is important that we are able to pick TOFs accuratelyand reliably. Again, to emphasize the point, image resolutionand detailed breast architecture, though important for our reflec-tion imaging, is not of paramount importance to the sound–speed
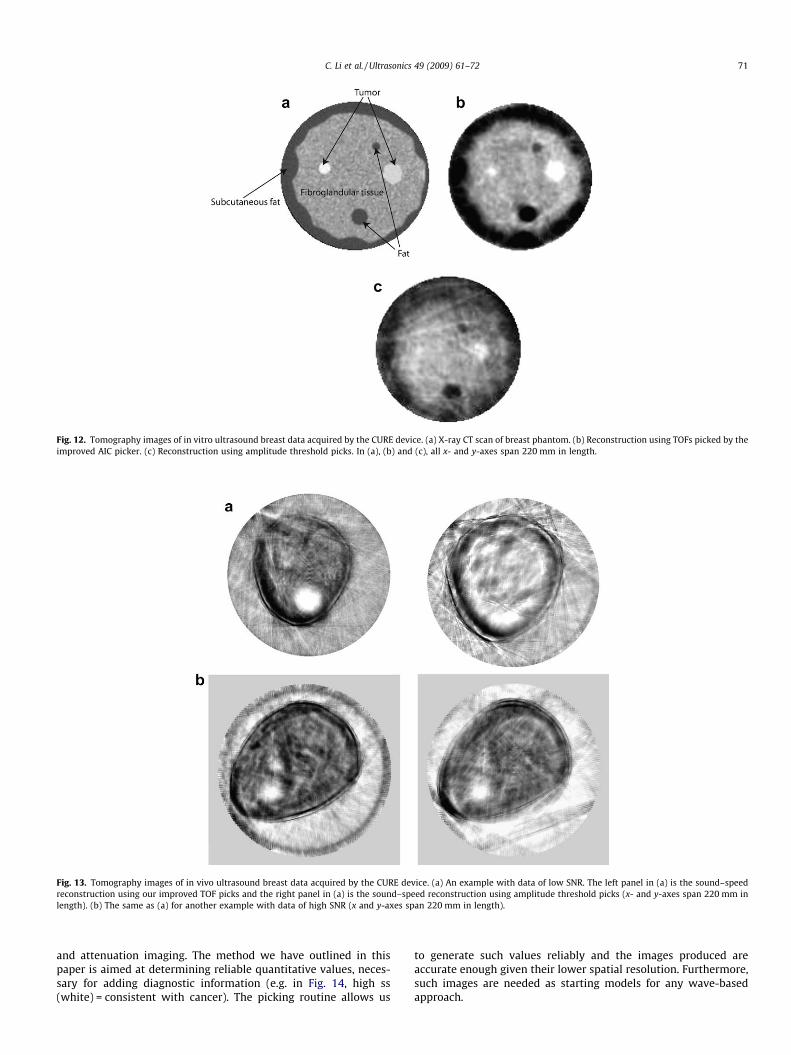
Fig. 12. Tomography images of in vitro ultrasound breast data acquired by the CURE device. (a) X-ray CT scan of breast phantom. (b) Reconstruction using TOFs picked by theimproved AIC picker. (c) Reconstruction using amplitude threshold picks. In (a), (b) and (c), all x- and y-axes span 220 mm in length.
Fig. 13. Tomography images of in vivo ultrasound breast data acquired by the CURE device. (a) An example with data of low SNR. The left panel in (a) is the sound–speedreconstruction using our improved TOF picks and the right panel in (a) is the sound–speed reconstruction using amplitude threshold picks (x- and y-axes span 220 mm inlength). (b) The same as (a) for another example with data of high SNR (x and y-axes span 220 mm in length).
C. Li et al. / Ultrasonics 49 (2009) 61–72 71
and attenuation imaging. The method we have outlined in thispaper is aimed at determining reliable quantitative values, neces-sary for adding diagnostic information (e.g. in Fig. 14, high ss(white) = consistent with cancer). The picking routine allows us
to generate such values reliably and the images produced areaccurate enough given their lower spatial resolution. Furthermore,such images are needed as starting models for any wave-basedapproach.
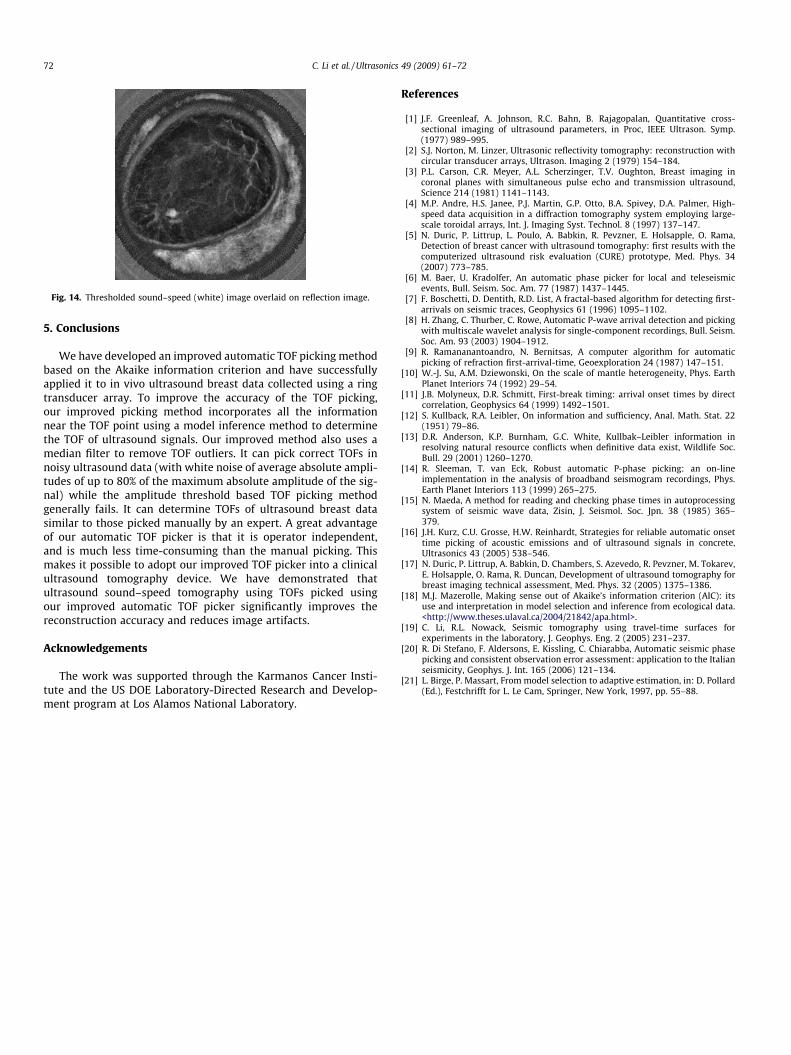
Fig. 14. Thresholded sound–speed (white) image overlaid on reflection image.
72 C. Li et al. / Ultrasonics 49 (2009) 61–72
5. Conclusions
We have developed an improved automatic TOF picking methodbased on the Akaike information criterion and have successfullyapplied it to in vivo ultrasound breast data collected using a ringtransducer array. To improve the accuracy of the TOF picking,our improved picking method incorporates all the informationnear the TOF point using a model inference method to determinethe TOF of ultrasound signals. Our improved method also uses amedian filter to remove TOF outliers. It can pick correct TOFs innoisy ultrasound data (with white noise of average absolute ampli-tudes of up to 80% of the maximum absolute amplitude of the sig-nal) while the amplitude threshold based TOF picking methodgenerally fails. It can determine TOFs of ultrasound breast datasimilar to those picked manually by an expert. A great advantageof our automatic TOF picker is that it is operator independent,and is much less time-consuming than the manual picking. Thismakes it possible to adopt our improved TOF picker into a clinicalultrasound tomography device. We have demonstrated thatultrasound sound–speed tomography using TOFs picked usingour improved automatic TOF picker significantly improves thereconstruction accuracy and reduces image artifacts.
Acknowledgements
The work was supported through the Karmanos Cancer Insti-tute and the US DOE Laboratory-Directed Research and Develop-ment program at Los Alamos National Laboratory.
References
[1] J.F. Greenleaf, A. Johnson, R.C. Bahn, B. Rajagopalan, Quantitative cross-sectional imaging of ultrasound parameters, in Proc, IEEE Ultrason. Symp.(1977) 989–995.
[2] S.J. Norton, M. Linzer, Ultrasonic reflectivity tomography: reconstruction withcircular transducer arrays, Ultrason. Imaging 2 (1979) 154–184.
[3] P.L. Carson, C.R. Meyer, A.L. Scherzinger, T.V. Oughton, Breast imaging incoronal planes with simultaneous pulse echo and transmission ultrasound,Science 214 (1981) 1141–1143.
[4] M.P. Andre, H.S. Janee, P.J. Martin, G.P. Otto, B.A. Spivey, D.A. Palmer, High-speed data acquisition in a diffraction tomography system employing large-scale toroidal arrays, Int. J. Imaging Syst. Technol. 8 (1997) 137–147.
[5] N. Duric, P. Littrup, L. Poulo, A. Babkin, R. Pevzner, E. Holsapple, O. Rama,Detection of breast cancer with ultrasound tomography: first results with thecomputerized ultrasound risk evaluation (CURE) prototype, Med. Phys. 34(2007) 773–785.
[6] M. Baer, U. Kradolfer, An automatic phase picker for local and teleseismicevents, Bull. Seism. Soc. Am. 77 (1987) 1437–1445.
[7] F. Boschetti, D. Dentith, R.D. List, A fractal-based algorithm for detecting first-arrivals on seismic traces, Geophysics 61 (1996) 1095–1102.
[8] H. Zhang, C. Thurber, C. Rowe, Automatic P-wave arrival detection and pickingwith multiscale wavelet analysis for single-component recordings, Bull. Seism.Soc. Am. 93 (2003) 1904–1912.
[9] R. Ramananantoandro, N. Bernitsas, A computer algorithm for automaticpicking of refraction first-arrival-time, Geoexploration 24 (1987) 147–151.
[10] W.-J. Su, A.M. Dziewonski, On the scale of mantle heterogeneity, Phys. EarthPlanet Interiors 74 (1992) 29–54.
[11] J.B. Molyneux, D.R. Schmitt, First-break timing: arrival onset times by directcorrelation, Geophysics 64 (1999) 1492–1501.
[12] S. Kullback, R.A. Leibler, On information and sufficiency, Anal. Math. Stat. 22(1951) 79–86.
[13] D.R. Anderson, K.P. Burnham, G.C. White, Kullbak–Leibler information inresolving natural resource conflicts when definitive data exist, Wildlife Soc.Bull. 29 (2001) 1260–1270.
[14] R. Sleeman, T. van Eck, Robust automatic P-phase picking: an on-lineimplementation in the analysis of broadband seismogram recordings, Phys.Earth Planet Interiors 113 (1999) 265–275.
[15] N. Maeda, A method for reading and checking phase times in autoprocessingsystem of seismic wave data, Zisin, J. Seismol. Soc. Jpn. 38 (1985) 365–379.
[16] J.H. Kurz, C.U. Grosse, H.W. Reinhardt, Strategies for reliable automatic onsettime picking of acoustic emissions and of ultrasound signals in concrete,Ultrasonics 43 (2005) 538–546.
[17] N. Duric, P. Littrup, A. Babkin, D. Chambers, S. Azevedo, R. Pevzner, M. Tokarev,E. Holsapple, O. Rama, R. Duncan, Development of ultrasound tomography forbreast imaging technical assessment, Med. Phys. 32 (2005) 1375–1386.
[18] M.J. Mazerolle, Making sense out of Akaike’s information criterion (AIC): itsuse and interpretation in model selection and inference from ecological data.<http://www.theses.ulaval.ca/2004/21842/apa.html>.
[19] C. Li, R.L. Nowack, Seismic tomography using travel-time surfaces forexperiments in the laboratory, J. Geophys. Eng. 2 (2005) 231–237.
[20] R. Di Stefano, F. Aldersons, E. Kissling, C. Chiarabba, Automatic seismic phasepicking and consistent observation error assessment: application to the Italianseismicity, Geophys. J. Int. 165 (2006) 121–134.
[21] L. Birge, P. Massart, From model selection to adaptive estimation, in: D. Pollard(Ed.), Festchrifft for L. Le Cam, Springer, New York, 1997, pp. 55–88.
Related Documents