Available on website http://www.wrc.org.za ISSN 0378-4738 = Water SA Vol. 34 No. 3 July 2008 ISSN 1816-7950 = Water SA (on-line) 381 * To whom all correspondence should be addressed. +2711 717-7153; fax: +2711 717-7045; e-mail: [email protected] Received 4 November 2007; accepted in revised form 16 April 2008. An improved area-based guideline for domestic water demand estimation in South Africa HJ van Zyl 1 , AA Ilemobade 1 * and JE van Zyl 2 1 School of Civil and Environmental Engineering, University of the Witwatersrand, Johannesburg, South Africa 2 Department of Civil Engineering Science, University of Johannesburg, South Africa Abstract Increased infrastructural development and potable water consumption have highlighted the importance of accurate water- demand estimates for effective municipal water services infrastructure planning and design. In the light of evolving water consumption trends, the current guideline for municipal water demand estimation, published in 1983, needs to be revised. This study investigated, using regression analyses, the combined effect of various socio-economic and climatic parameters on municipal water consumption with the objective of determining the dominant influencing parameters and suggesting a new guideline for water-demand estimation. To this end, an initial database comprising more than 2.5 x10 6 metered water con- sumption records extracted from 48 municipal treasury databases, which are located within 5 out of the 7 South African water regions was analysed. Each of the 48 municipal treasury databases spanned a period of at least 12 months. The final amalga- mated database, after rigorous cleaning and filtering, comprised 1 091 685 consumption records. Single variable and stepwise multiple variable regression analyses were utilised. Results show that stand area, stand value and geographical location are the dominant parameters influencing municipal water consumption, with stand area and stand value positively correlated to water consumption. In suggesting a new municipal water-demand estimation guideline, these three parameters were consid- ered. Stand value, however, fell away as a reliable parameter for estimating water consumption because of the inconsistent basis for predicting stand values due to the constant fluctuations in the value of property, and municipal valuations that often become outdated. Inland and coastal geographical locations exhibited different consumption patterns, with coastal stands of the same stand area and stand value consistently consuming less water than inland stands. These should therefore be treated separately in any design guideline. Stand area then became the best parameter on which to base water-demand estimations. A single guideline curve is therefore proposed which gives various confidence limits for estimating water demand in South Africa, based on stand area. Keywords: domestic water demand estimation, area-based guideline Glossary Guideline A document approved and published by the relevant government institution(s) and extensively used by industry with the aim of guiding decisions and cri- teria in specific areas (in this study, domestic water demand estimation) Stand A plot of land City A municipal centre incorporated by a province Town A built-up area with a name, defined boundaries, and local government, that is larger than a village and generally smaller than a city Suburb An outlying residential district of a city Ward An administrative division of a city or town, typi- cally represented by a councilor or councilors Introduction Background to the study and motivation In South Africa, the expansion of urban areas, increased infrastruc- tural development and constant need for potable water services, have brought to light the importance of accurate water-demand estimates in municipal water services planning and design. Water- demand estimates are used to calculate peak water demands and sewer flows and thus determine municipal water and sewer infra- structure requirements. Inaccurate estimates result in a deficiency in basic design information that could lead to inadequate service due to over-, or under-design of water supply infrastructure. A key input therefore in municipal water services planning and design is the estimation of present demand, and the prediction of future water demand. In addition, South Africa is a water-scarce country that constantly strives to apply its available water resources in the most efficient and equitable manner. Different users includ- ing industry, domestic, agriculture and the environment, vie for the available resources and have to be awarded an equitable and adequate share. Inaccurate estimates of the water needs of dif- ferent users may well result in inequitable distribution. It has been recognised that domestic water-demand esti- mates should preferably be based on actual water consump- tion. However, information on actual water consumption is not always readily available and as a consequence, domestic water- demand estimates measured as annual average daily water demand(AADD) are still mostly based on stand area (CSIR, 2003; Jacobs et al., 2004). The estimates obtained are then mul- tiplied by the number of stands and peak-to-average ratios are applied. The most commonly used South African design guideline for municipal water-demand estimation was first published in 1983 (the so-called Blue Book) (Table F6 and Figure F2; DCD,

Welcome message from author
This document is posted to help you gain knowledge. Please leave a comment to let me know what you think about it! Share it to your friends and learn new things together.
Transcript

Available on website http://www.wrc.org.zaISSN 0378-4738 = Water SA Vol. 34 No. 3 July 2008ISSN 1816-7950 = Water SA (on-line)
381
* To whom all correspondence should be addressed. +2711 717-7153; fax: +2711 717-7045;e-mail: [email protected] 4 November 2007; accepted in revised form 16 April 2008.
An improved area-based guideline for domestic water demand estimation in South Africa
HJ van Zyl1, AA Ilemobade1* and JE van Zyl2
1School of Civil and Environmental Engineering, University of the Witwatersrand, Johannesburg, South Africa2Department of Civil Engineering Science, University of Johannesburg, South Africa
Abstract
Increased infrastructural development and potable water consumption have highlighted the importance of accurate water-demand estimates for effective municipal water services infrastructure planning and design. In the light of evolving water consumption trends, the current guideline for municipal water demand estimation, published in 1983, needs to be revised. This study investigated, using regression analyses, the combined effect of various socio-economic and climatic parameters on municipal water consumption with the objective of determining the dominant influencing parameters and suggesting a new guideline for water-demand estimation. To this end, an initial database comprising more than 2.5 x10⁶ metered water con-sumption records extracted from 48 municipal treasury databases, which are located within 5 out of the 7 South African water regions was analysed. Each of the 48 municipal treasury databases spanned a period of at least 12 months. The final amalga-mated database, after rigorous cleaning and filtering, comprised 1 091 685 consumption records. Single variable and stepwise multiple variable regression analyses were utilised. Results show that stand area, stand value and geographical location are the dominant parameters influencing municipal water consumption, with stand area and stand value positively correlated to water consumption. In suggesting a new municipal water-demand estimation guideline, these three parameters were consid-ered. Stand value, however, fell away as a reliable parameter for estimating water consumption because of the inconsistent basis for predicting stand values due to the constant fluctuations in the value of property, and municipal valuations that often become outdated. Inland and coastal geographical locations exhibited different consumption patterns, with coastal stands of the same stand area and stand value consistently consuming less water than inland stands. These should therefore be treated separately in any design guideline. Stand area then became the best parameter on which to base water-demand estimations. A single guideline curve is therefore proposed which gives various confidence limits for estimating water demand in South Africa, based on stand area.
Keywords: domestic water demand estimation, area-based guideline
Glossary
Guideline A document approved and published by the relevant government institution(s) and extensively used by industry with the aim of guiding decisions and cri-teria in specific areas (in this study, domestic water demand estimation)
Stand A plot of landCity A municipal centre incorporated by a provinceTown A built-up area with a name, defined boundaries, and
local government, that is larger than a village and generally smaller than a city
Suburb An outlying residential district of a cityWard An administrative division of a city or town, typi-
cally represented by a councilor or councilors
Introduction
Background to the study and motivation
In South Africa, the expansion of urban areas, increased infrastruc-tural development and constant need for potable water services,
have brought to light the importance of accurate water-demand estimates in municipal water services planning and design. Water-demand estimates are used to calculate peak water demands and sewer flows and thus determine municipal water and sewer infra-structure requirements. Inaccurate estimates result in a deficiency in basic design information that could lead to inadequate service due to over-, or under-design of water supply infrastructure. A key input therefore in municipal water services planning and design is the estimation of present demand, and the prediction of future water demand. In addition, South Africa is a water-scarce country that constantly strives to apply its available water resources in the most efficient and equitable manner. Different users includ-ing industry, domestic, agriculture and the environment, vie for the available resources and have to be awarded an equitable and adequate share. Inaccurate estimates of the water needs of dif-ferent users may well result in inequitable distribution. It has been recognised that domestic water-demand esti-mates should preferably be based on actual water consump-tion. However, information on actual water consumption is not always readily available and as a consequence, domestic water-demand estimates measured as annual average daily water demand(AADD) are still mostly based on stand area (CSIR, 2003; Jacobs et al., 2004). The estimates obtained are then mul-tiplied by the number of stands and peak-to-average ratios are applied. The most commonly used South African design guideline for municipal water-demand estimation was first published in 1983 (the so-called Blue Book) (Table F6 and Figure F2; DCD,

Available on website http://www.wrc.org.zaISSN 0378-4738 = Water SA Vol. 34 No. 3 July 2008
ISSN 1816-7950 = Water SA (on-line)
382
1983). The latest version of this document (the so-called Red Book) (Tables 9.10, 9.11, 9.14 and Fig. 9.9; CSIR, 2003) contains the same design guideline for municipal water-demand estima-tion as that published in the Blue Book (the colour codes for each book simply refers to the colour of the folder housing the guide-lines). This is despite the changes that have occurred in municipal water consumption over the past 25 years. The only significant change that has occurred in these guidelines since publication in 1983 has been to distinguish between domestic water-demand estimation in developing areas and developed areas. For domes-tic water-demand estimation in developing areas the guideline provides a typical consumption value and a range in ℓ/cap·d for communal water points, stand pipes and yard taps (Tables 9.10 and 9.11; CSIR, 2003). For domestic water-demand estimation in developed areas, AADD (for single residential stands) is based on stand area (Fig. 9.9; CSIR, 2003). In this figure, an upper and lower limit for domestic demand as a function of stand area is given. The designer is expected to estimate the design demand between these limits, and take into account parameters such as climate, income level and cost of water. Currently, the Red Book AADD guideline is widely used in the Southern Africa region and as mentioned above, does not take into consideration the evolution of municipal water con-sumption over the past 25 years. A revised guideline is therefore needed. This paper reports on an investigation of metered water consumption over a period of at least 12 months for an initial database of more than 2.5 x10⁶ consumers from a cross-section of South African towns and cities which are located within 5 out of 7 water regions. After rigorous cleaning and filtering, the final database comprised 1 091 685 consumers. The combined effect of various parameters which influence municipal domes-tic water consumption is investigated using regression analyses, the dominant parameters influencing water consumption are determined, and an improved guideline for estimating domestic water demand in South Africa is suggested.
Previous studies
The study by Garlipp (1979) was one of the earliest of its kind in South Africa. Garlipp (ibid.) investigated a number of param-eters influencing domestic water consumption in Pretoria, Blo-emfontein, Cape Town, Port Elizabeth and Durban. Data for this study were sourced from meter readings logged during the study, water meter books from individual customers, and social surveys. Household size was found to be the most significant parameter influencing domestic water consumption with water consumption per capita decreasing with an increase in household size. Other parameters that had a positive influence on domes-tic consumption were prolonged high temperatures, stand area and income. Domestically, water was found to be largely con-sumed internally at lower temperatures and externally, at higher temperatures. A limitation of the study was the inadequate and biased social surveys resulting from poor survey responses con-ducted primarily amongst the engineering fraternity in South Africa. A study by Stephenson and Turner (1996) investigated dif-ferent income users in the Gauteng area (242 stands in a high-income residential area, 7 119 stands in 7 middle-income resi-dential areas, 2 370 stands in 2 low-income residential areas/townships and 3 suburbs where the land use was predominantly of a commercial and industrial nature). The study confirmed the Blue Book guideline – that stand area exerted the most influence on domestic water consumption. Other parameters that were found to influence water demand included income, population
density, water supply level of service, and housing type. Some limitations of the study included the use of average stand area for all the stands in an area or zone, as this likely led to the misrepresentation of stand area. Also, the guidelines presented in the study for each study area were likely to generate higher AADD values than actual domestic water consumption because the estimates included water losses, and potentially some non-domestic water use (e.g. fire-hydrant water). Van Vuuren and Van Beek (1997) investigated domestic and non-domestic water consumption for 69 supply areas in the Pre-toria vicinity using measured consumption figures for different income categories over about 12 years (March 1982 to Octo-ber 1994). The study confirmed a strong correlation between domestic consumption and household income with high-income households consuming significantly more water than middle- and low-income households. Also, water consumption patterns of high-income households were found to be more climate (rain-fall and temperature) sensitive than in middle- and low-income households, primarily because of the large outdoor water demand in high-income households. For non-domestic users, climate had a negligible effect on water consumption. In the study, all users responded to water restrictions, although high-income house-holds took longer to respond. High-income households however, recovered quicker when the restrictions were lifted. In com-parison with the Red Book AADD guideline (CSIR, 2003), Van Vuuren and Van Beek (1997) found the domestic AADD for all income categories in the Pretoria vicinity to be lower than esti-mated by the guidelines. The study had limitations with regard to:• The accuracy of some of the parameters used (e.g. meter-
reading intervals and land-use characteristics) • Income levels were defined and users categorised by means
of property tax information• The study only considered formal residential developments
with potable water connections and water-borne sanitation on each stand, thus excluding informal residential areas.
It is of note that stand areas for the low-income category con-sidered by Van Vuuren and Van Beek (1997) were significantly greater (ranging from 600 to 2 900 m2) than the stand areas con-sidered by Stephenson and Turner (1996) (ranging from 200 to 1 400 m2). Van Zyl et al. (2003) investigated the elasticity of water price, water pressure, household income and stand area for residen-tial water consumption in some Gauteng residential areas (i.e. Alberton, Boksburg, Centurion and Midrand), comprising more than 110 000 users. This pilot study investigated the strengths and weaknesses of end-use modelling as a water-demand pre-dictor in South Africa. The study grouped end-uses into indoor consumption, outdoor consumption and leakage, and provides ranges of elasticity values identified for the modelling param-eters (i.e. water price, water pressure, household income and stand area). The potential effects of these elasticity values on water consumption were then evaluated through a sensitivity analysis. Price was found to exert the most significant impact on domestic water consumption patterns. Household income, stand area and water pressure had positive demand elasticities. A case study was used to show the potential for end-use mod-elling to investigate scenarios of simultaneous changes in dif-ferent parameters. The merit of this study lies in the fact that typical South African conditions were investigated with regards to suburban and township developments. Potential parameters influencing water demand such as climate, geographic location, level of service and age of infrastructure were not considered in
Available on website http://www.wrc.org.zaISSN 0378-4738 = Water SA Vol. 34 No. 3 July 2008ISSN 1816-7950 = Water SA (on-line)
383
the analysis. Also, other user categories such as parks, schools, business/commercial sites, etc. were not considered. New guidelines for domestic water-demand estimation were proposed by Jacobs et al. (2004). The proposed guidelines were based on the analysis of 582 997 domestic users with at least 12 months of data (varying from December 1999 to July 2003) country-wide from municipal treasury data. Stand area was used as the only influencing variable and separate guidelines were proposed for four different geographic regions. Township and suburban areas were considered only in one of the regions. The study analysed consumers using less than 20 kℓ/d and located on stand areas of between 50 to 2 050 m2. The authors concluded the Red Book AADD guideline to be conservative. The work by Jacobs et al. (2004) presents a valuable discussion with regards to estimating residential water demand in Southern Africa using a single-coefficient model that relates water demand with stand area. The work presented here is considered to be an improve-ment over Jacobs et al. (2004) because more data points are uti-lised, the study is specific to South Africa and several variables influencing water consumption, apart from stand area, are con-sidered in the analysis. In subsequent related studies, household size was identified as being the most significant determinant of indoor water demand, hot water demand and wastewater flow (Jacobs and Haarhoff, 2004; Jacobs, 2007). Husselmann and Van Zyl (2006) investigated the independ-ent effects of stand area and income (using stand value as a sur-rogate for income) on water consumption. The study used meas-ured consumption data for 769 393 residential stands in Gauteng with the data divided into 6 stand-area and 6 stand-value catego-ries. The authors found a strong link between water consump-tion and income, but found that stand value is too variable to be used as a parameter in a design guideline. Hence, they concluded that stand area provides the best basis for a design guideline. A comparison of the results with the Red Book AADD guideline showed that the Red Book guideline underestimates the AADD in the 300 to 700 m2 stand area range and overestimates the AADD for stand areas larger than 700 m2. New guideline curves were proposed. Internationally, one of the longest and most continuous national domestic water use databases (at 5-year intervals from 1950-2000) was generated by the US Geological Survey. Domestic water use included water for drinking, food prepara-tion, bathing, laundry and dishes, flushing toilets, and watering lawns and gardens. Analyses of the database showed a continual increase in water use from 1950-1995 largely due to increases in population. The analyses did not, however, provide any evi-dence explaining what other factors besides population increase accounted for differences in consumer behaviour (Solley et al., 1998). In the UK, metering and the costs that it incurred for the domestic consumer were shown to cut water demand by about 21% for about 50 000 households in the Isle of Wight. The East Anglian Regional survey of domestic water consumption involved 2 000 properties and showed that per capita consump-tion could be related to four main variables, i.e. household size, type of house, income level and rateable value of properties (Edwards and Martin, 1995).
Summary of unresolved issues
Below are some of the research issues unresolved in the previous South African studies:• Three of the 6 studies indicate that AADD is primarily influ-
enced by stand area. The other studies indicate the most influential parameter to be price, household income and
household size. Consensus on the most dominant param-eters is therefore required
• There has been limited investigation on the effect of climate on various categories of users, located in various types of developments (cities vs. towns) and geographical locations (inland vs. coastal)
• Most of the previous studies considered parameters influenc-ing water consumption individually and did not investigate the combined effect of these parameters on water consump-tion
• Previous studies (Jacobs et al., 2004; Husselmann and Van Zyl, 2004; and Van Vuuren and Van Beek, 1997) indicate that the Red Book AADD guideline may be conservative. Hence, this guideline needs to be revised in the subsequent Red Book edition.
• Previous guidelines for AADD are limited in scope com-pared to this study, which is based on a larger database than previously used.
This study reports on an investigation of metered water con-sumption over a period of at least 12 months (the vast majority for at least 24 months) from an initial database of more than 2.5 x10⁶ consumers from a cross-section of South African towns and cities which are located within 5 out of 7 water regions. The combined effect of various parameters which influence munici-pal domestic water consumption is investigated using regression analyses, the dominant parameters influencing water consump-tion are determined, and suggestions are made for improved esti-mation of domestic water demand in South Africa. Non-domes-tic demand estimation falls outside the scope of this paper.
Methodology
This study utilised municipal water-meter readings stored in treasury databases as the source of consumption data, as was the case with Jacobs et al. (2004) and Husselmann and Van Zyl (2006). This made it possible to study a large number of consumer records and to conduct rigorous statistical analyses. The relatively large size of the database made it possible to investigate the distribution of the data in greater detail, and to have representative samples for specific consumption charac-teristics. In South Africa, most users in developed areas are metered and meter readings are generally taken at regular inter-vals in order to generate monthly water bills. Until recently, actual meter readings were often hidden in complicated data-bases or could not be directly or easily accessed. However, the past decade has seen significant software developments that now enable the abstraction and analysis of information from treasury databases (Jacobs et al., 2004). One such tool that achieves this end is the Swift Software Programme (GLS, 2007). Swift allows a user to interrogate and access municipal treasury databases to obtain demographic data, stand charac-teristics (area and value) and recorded water consumption for individual consumer connections. A large number of munici-palities throughout South Africa (e.g. Tshwane Metropolitan, Ekurhuleni, and Johannesburg Water) have implemented Swift and the existing treasury databases in these municipalities cover years of consumption data for millions of users. Van Zyl and Geusteyn (2007) undertook an extensive study to develop an archive of water consumption nationally. Data used in this study are a subset of the data compiled in Van Zyl and Geusteyn’s (2007) study. It was assumed for this study that the accuracies of the con-sumer meters studied are adequate. To address problems like

Available on website http://www.wrc.org.zaISSN 0378-4738 = Water SA Vol. 34 No. 3 July 2008
ISSN 1816-7950 = Water SA (on-line)
384
meter clock-overs or replacements, this study made use of the data-cleaning functions contained in Swift. In addition, this study also undertook rigorous data-cleaning processes to ensure the integrity of the final database used for analysis. This study has a number of limitations, including the follow-ing: • Water consumption is an inherently variable process and
thus, any metered consumption data will thus include a measure of variability and uncertainty
• Stands using alternative water sources (e.g. groundwater from boreholes, rainwater collected from roofs and on-site reuse of grey water) were not identified in this study. As such, all stands in the database are assumed to utilise only potable municipal supply.
• The length of time for the climatic parameters generated in the study coincides with the years of treasury data available. As such, any long-term climatic effects on water consump-tion beyond the data length were ignored.
The methodology undertaken in this study therefore involved the following: extracting water consumption data from munici-pal treasury databases; extracting data on the parameters influ-encing water consumption from several sources; cleaning the data; and detailed analyses of the data.
Data on water consumption
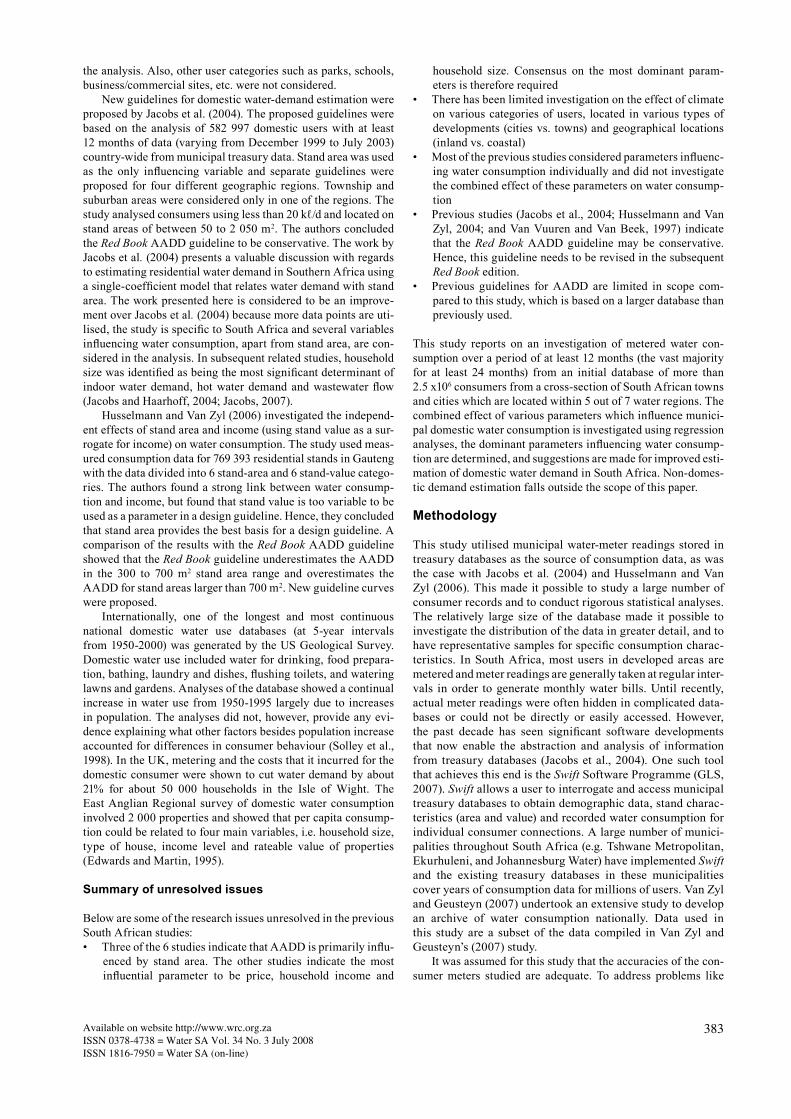
Forty-eight municipal treasury databases totalling more than 2.5 x10⁶ records were collected and analysed in this study. This included 4 metros (Johannesburg, Tshwane, Ekurhuleni and Cape Town) and 151 other cities or towns. The location of the municipalities included in the study is indicated on the map (Fig. 1) showing the 7 South African water regions proposed by Basson et al. (1997). These regions were cre-ated by grouping together catchments of broadly similar hydro-meteorogical characteristics. It is clear from Fig. 1 that the municipalities investigated are fairly representative of the South Western, Southern Coastal and Northern water regions of the country. Only one municipality each in the Eastern Coastal region and Central region was available for this study. Two water regions namely the Eastern Inland and the Karoo had no representation in the database. However, since municipal treasury data were obtained using Swift, this study was restricted to municipalities that have implemented Swift. Table 1 provides a summary of the database used in this study according to water region and municipality. Each stand has a calculated AADD value based on at least 12 months of consumption data (see Fig. 2). Only single residential stands were considered in this study, i.e. residential properties each consisting of a single dwelling on a stand. Group housing (i.e. flats, townhouses) was not considered in this study.
South Western Region
Southern Coastal Region
Eastern Coastal Region
Central Region
Karoo Region
Northern Region
Eastern Inland Region
Cape Town
Bloemfontein
Durban
Port Elizabeth
East London
Kimberley
Polokwane
Pretoria
JohannesburgN
Beaufort West
Berg Rivier
Breede Valley
Cape Agulhas
Cederberg
Matzikama
Drakenstein
Ekurhuleni
Lange Berg
Overstrand Plettenberg Bay
Saldanha
JohannesburgSedibeng
Swartland
Theewaterskloof George
Pretoria
Stellenbosch
Mossel Bay
Oudtshoorn
City Town
Available Treasury Data
East London
Cape Town
Tswhane & Centurion
TABLE 1Summary of initial and final domestic records
Water region Municipality Initial No. of domestic
and non-domestic
stands
Initial No. of domestic
stands
No. of domestic
stands after cleaning and
filteringCentral Sedibeng 170 126 144 135 35 436
Eastern Coastal Buffalo City (East London) 119 748 102 665 69 581
Northern Ekurhuleni, Johannesburg Water, Randfontein, Tshwane 1 629 636 1 377 457 840 639South Western Berg River, Blaauwberg, Breede River, Breede Valley, Cape
Agulhas, Cederberg, Drakenstein, Helderberg, Matzikama, Oostenberg, Overstrand, Saldanha Bay, Stellenbosch, Swart-land, Theewaterskloof, Tygerberg
557 671 457 613 359 018
Southern Coastal Beaufort West, George, Langeberg, Mossel Bay, Oudts hoorn, Plettenberg Bay
111 825 68 685 49 119
Eastern Inland - - - -Karoo - - - -Sub-total 2 589 006 2 150 555 1 353 793Additional filter-ing (outliers)
- 262 108
TOTAL 1 091 685
Figure 1Location of the municipalities used in the study on the map
showing the 7 South African water regions

Available on website http://www.wrc.org.zaISSN 0378-4738 = Water SA Vol. 34 No. 3 July 2008ISSN 1816-7950 = Water SA (on-line)
385
Data on parameters influencing water consumption
Information was collected from various sources and linked to the consumption data to allow correlations to be analysed. Table 2 shows the parameters used in this study and their sources. The MAP (mean annual precipitation), MAE (mean annual evapora-tion), and temperatures were linked to the water consumption data on the basis of municipality and, where higher resolution was possible, at a suburb level. Linking the socio-economic data to the consumption data was a complicated process as the former was only available on the political ward level. It was not ideal to use socio-economic data provided on the political ward level since different socio-economic groupings, and thus differ-ent water consumption groupings, may occur in the same ward. Reconciliation of the two data sets was made possible using a GIS interface. A single database was created after linking the data.
Data cleaning
To ensure the integrity of the final database, three data-cleaning phases were implemented. In the primary data-cleaning phase, Swift adjustment codes (assigned where Swift identifies certain anomalies or errors in the data) were used to exclude records with inconsistent readings or dates due to meter replacements or clock-overs, and records with less than 12 months of data. In the secondary data-cleaning phase, records or stands identified as un-metered, vacant, pre-paid, duplicate, including more than
one type of land use, group housing or classified as non-domes-tic were excluded from the database. In the tertiary data-cleaning phase, filters were applied to the database to exclude users with unrealistically low or unrealisti-cally high stand areas and stand values. These consumers were omitted not on the basis that the stand areas and values may be wrong, but on the basis that it is not practical to design water-supply infrastructure for consumption values that are unrealis-tically high or low. Table 1 shows the number of records used in the analyses. The cleaned database contained the following descriptors/values:
A unique stand identifier and address that can be linked back • to the treasury databaseA land-use code and suburb category in which each stand is • locatedAADD in kℓ/d and the period of calculation of the AADD• Area (m• 2), value, development level (city or town), and geo-graphic location of each standMAP (mm) and MAE (mm) for the area• Average maximum and minimum temperatures for the water • consumption periodUnique political ward ID as obtained from the South African • Demarcation BoardPercentage of unemployed persons in the economically active • population*Percentage of households with formal housing*• Average household size (no. of persons)*, house size (no. of • rooms)*, and household income*
Nov
-97
Jan-
98M
ar-9
8M
ay-9
8Ju
l-98
Sep-
98N
ov-9
8Ja
n-99
Mar
-99
May
-99
Jul-9
9Se
p-99
Nov
-99
Jan-
00M
ar-0
0M
ay-0
0Ju
l-00
Sep-
00N
ov-0
0Ja
n-01
Mar
-01
May
-01
Jul-0
1Se
p-01
Nov
-01
Jan-
02M
ar-0
2M
ay-0
2Ju
l-02
Sep-
02O
ct-0
2D
ec-0
2Fe
b-03
Apr
-03
Jun-
03A
ug-0
3O
ct-0
3D
ec-0
3Fe
b-04
Apr
-04
Jun-
04A
ug-0
4O
ct-0
4D
ec-0
4Fe
b-05
Apr
-05
Jun-
05A
ug-0
5
SedibengBuffulo CityEkurhuleniJohannesburg WaterTshwaneRandfonteinOverstrandBlaauwbergOostenbergTygerbergBergRiverCape AgulhasHelderbergSaldanha BayBreede RiverBreede ValleyCederbergDrakensteinMatzikamaStellenboschSwartlandTheewaterskloofLangebergGeorgeMossel BayPlettenberg BayBeaufort WestOudtshoorn
12months
Northern region
Eastern Coastal region
South Western region
Central region
Southern Coastal region
Figure 2Spread and duration of
each municipal database
TABLE 2The different parameters influencing water consumption and their sources of data
Source of data ParametersMunicipal treasury data Stand area, stand value and improvements, monthly meter readingsSouth African Municipal Demarcation Board Level of unemployment, annual household income, level of sanitation, level of
water service, household size, house size/floor area, dwelling typeSouth African Weather Service Rainfall, daily temperatures (average maximum and minimum)Surface Water Resources of South Africa by Midgley et al. (1994)
Mean annual precipitation, mean annual evaporation

Available on website http://www.wrc.org.zaISSN 0378-4738 = Water SA Vol. 34 No. 3 July 2008
ISSN 1816-7950 = Water SA (on-line)
386
Percentage of houses with potable water house • connections*Percentage dwellings with waterborne sanita-• tion*.
*data only available on ward level
Data analyses and demand estimation
The first step in the analysis was a direct compari-son of each suburb’s AADD vs. average suburb stand area, with the Red Book AADD guideline. The analysis was simply to generate a preliminary idea of how on average, the data compared with the Red Book guideline. It was assumed that climatic and socio-economic conditions in each suburb were homogeneous. The average stand area and AADD for each suburb were thus determined and these values superimposed on the Red Book guideline. A best-fit line was generated using a single variable regression model with average stand area specified as the independent variable and average AADD, the dependent variable. The next step in the data analysis was an attempt at quantifying the level of influence the different parameters (climatic and socio-economic) had on domestic water consump-tion. To this end, 18 smaller databases, comprising 8 stand-area databases (Table 3, Column 1) and 10 stand-value databases (Table 4, Column 1) were created from the single database for efficient data management and analyses. Stand value was used as proxy for household income (Van Zyl et al., 2003 and Hussel-mann and Van Zyl, 2006). A stepwise multiple variable regres-sion analysis was carried out on the 18 smaller databases with Ln (AADD) as the dependent variable. A stepwise regression for more than one independent variable will always select the variable that correlates best with the dependent variable first and then, the next best correlated variable, and so forth. Thus, mul-tiple variable models were obtained for each of the 18 databases. These models represent the combined effect on water consump-tion of each of the different parameters. In most models, stand area and stand value influenced water consumption the most, with geographical location in third place (Table 3 and Table 4). Based on this result, a further refinement of the first two param-eters was carried out, by distinguishing between inland and coastal geographical areas. Inland and coastal areas represent a broader classification of the different water regions shown in Fig. 1. Following the outcome of the regression analyses, it was considered constructive to generate one or more curves that could aid design engineers in their estimation of water demand.
Results and discussion
Suburb-level analysis
The effect of average suburb stand area on average suburb domestic water consumption is shown in Fig. 3 with the Red Book upper and lower guideline curves. Of the 1 188 suburbs plotted, 461 (39%) lie below the lower guideline curve and 100 (8%) lie above the upper guideline curve. Thus, the current Red Book guideline only accounts for 53% of the suburbs. This gives the strongest indication yet of the need to update the Red Book curves. Of the 92% of suburbs that lie below the upper guideline curve, 57% have stand areas smaller than 800 m2. The 100
suburbs that had AADD values above the upper guideline curve were mostly a combination of middle-income, small single-res-idential developments (such as Cason in Boksburg, and Brixton and Yeoville in Johannesburg), low income or township devel-opments (such as Orange Grove in Johannesburg and Ncala in Germiston), and 23 suburbs were high-income, high-security developments (such as Kyalami Estates, Dainfern, Douglasdale and Sunning Hill in the northern suburbs of Johannesburg). A single regression analysis was then carried out to deter-mine the equation representing the average AADD as a function of average stand area:
(1)
where: StdArea = stand area in m2 AADD is in kℓ/d
The first part of the equation describes the single variable regres-sion curve, and the second part, the 97.5% confidence limits. The regression model generated an adjusted R2 value (square of the Pearson product moment correlation coefficient) of 0.218, which implies that 21.8% of the variability in the data can be explained by this equation. This value is acceptable for this analysis considering that an adjusted R2 value of more than 20% is considered good when predicting human behaviour. Numer-ous factors contribute to the variability in the data and given the large database, even greater variation could have resulted. A logarithmic regression model was used to generate the model as this gave the best fit to the data. The Red Book guideline curves were extrapolated up to stand areas of 4 000 m2 as the database had more than 30 000 residential stands with stand areas greater than 2 000 m2. As can be seen in Fig. 3, the regression curve falls within the Red Book guideline curves for stand areas up to approximately 1 700 m2 with the regression line lying very close to the upper limit for stand areas smaller than 750 m2. In fact, the model predicts slightly higher AADD values for stand areas between 500 m2 and 750 m2. For stand areas larger than 1 700 m2 the
0.000
0.500
1.000
1.500
2.000
2.500
3.000
3.500
4.000
4.500
5.000
5.500
6.000
6.500
7.000
0 500 1000 1500 2000 2500 3000 3500 4000
Stand Area (m2)
AA
DD
(kl/d
ay)
Red Book Lower Limit Red Book Upper Limit Suburb Average Regression Model
Ln(AADD) = -1.61+0.297Ln(StandArea)
Figure 3Preliminary assessment of the Red Book guideline using suburb AADD vs.
average suburb stand area
666977)4124.6(1016.9860.0)(297.0610.1)(
27 LnStdAreaStdAreaLnAADDLn
666977)4124.6(1016.9860.0)(297.0610.1)(
27 LnStdAreaStdAreaLnAADDLn

Available on website http://www.wrc.org.zaISSN 0378-4738 = Water SA Vol. 34 No. 3 July 2008ISSN 1816-7950 = Water SA (on-line)
387
TABLE 3Stepwise multiple variable regression analyses results in relation to Ln (AADD) for stand-area databases
Category description
No of data points, N
No. of para-meters analysed
The three most influential parameters byorder of best correlation with Ln(AADD)
Cumulative adjusted R2
≥ 20 m2 and < 500 m2 433 104 14 Stand area 0.053Geographic location 0.066Ln (stand value) 0.079
≥ 500 m2 and < 750 m2 112 443 14 Ln(stand value) 0.037Geographic location 0.062Ave household income 0.071
≥ 750 m2 and < 1000 m2 136 019 14 Ln(stand value) 0.067Geographic location 0.086Ave min temperature 0.101
≥ 1000 m2 and < 1500 m2 184 497 15 Ln(stand value) 0.092Ave household income 0.117Ave house size 0.139
≥ 1500 m2 and < 2000 m2 49 952 11 Ln(stand value) 0.105Ave household income 0.132Ave house size 0.155
≥ 2000 m2 and < 2500 m2 17 506 11 Ln(stand value) 0.092Geographic location 0.125Ave household income 0.136
≥ 2500 m2 and < 3000 m2 6 884 8 Ln(stand value) 0.161Geographic location 0.187Stand area 0.194
≥ 3000 m2 and < 4000 m2 6 168 8 Ln (stand value) 0.164Geographic location 0.196Stand value 0.207
TABLE 4Stepwise multiple variable regression analyses results in relation to Ln (AADD) for stand-value databases
Category description
No of data points, N
No. of para-meters analysed
The three most influential parameters byorder of best correlation with Ln(AADD)
Cumulative adjusted R2
≥ R20 000 and < R50 000 211 753 16 Ln(stand value) 0.029Ln(stand area) 0.041Geographic location 0.050
≥ R50 000 and < R100 000 200 322 14 Ln(stand area) 0.033Geographic location 0.049Mean annual evaporation 0.055
≥ R100 000 and < R250 00 298 703 15 Ln(Stand area) 0.065Geographic location 0.089Ave household income 0.099
≥ R250 000 and < R500 000 227 595 16 Ln(stand area) 0.107Ave household income 0.134Ave house size 0.152
≥ R500 000 and < R750 000 49 807 13 Ln(stand area) 0.102Geographic location 0.148Ave household income 0.165
≥ R750 000 and < R1 000 000 14 351 13 Geographic location 0.087Ln(stand area) 0.133Mean annual precipitation 0.139
≥ R1 000 000 and < R2 000 000 8 704 12 Geographic location 0.079Ln(stand area) 0.118Ave min temperature 0.141
≥ R2 000 000 and < R3 000 000 1 286 9 Ave min temperature 0.261% water connection 0.356Ave max temperature 0.388
≥ R3 000 000 and < R4 000 000 428 3 Ave min temperature 0.195Geographic location 0.291Stand area 0.298
≥ R4 000 000 1 275 7 Mean annual evaporation 0.274% unemployed 0.366Ave min temperature 0.39

Available on website http://www.wrc.org.zaISSN 0378-4738 = Water SA Vol. 34 No. 3 July 2008
ISSN 1816-7950 = Water SA (on-line)
388
model predicts much lower AADD values. This result corre-sponds with the comment made while comparing the suburb averages with the Red Book guideline, namely that the majority of the stands that exhibited consumption higher than what the guideline predicted were smaller stands with areas of less than 800 m2. The 97.5% confidence limits lie very close to the regres-sion line, so much so that the difference can hardly be distin-guished. The 97.5% confidence limits indicate the 97.5% prob-ability that the mean AADD of all the suburbs will lie within the upper and lower confidence limits.
Regression analyses
To analyse the various parameters influencing domestic water consumption, a stepwise multiple regression analysis was per-formed on each of the 18 smaller databases. Detailed regres-sion analyses results for stand area and stand value databases are shown in Tables 3, 4 and 5. For each database, the number of data points and parameters analysed, the three independ-ent parameters influencing water consumption by order of best correlation with Ln (AADD), as well as the adjusted R2 value for each regression step are shown (Tables 3 and 4). The regression equations for the most influential parameters are shown in Table 5.
Stand area, stand value (as proxy for household income) and geographic location emerged as the top three parameters influ-encing domestic water consumption - for stand-area databases, stand value influences water consumption the most; for stand-value databases, stand area influences water consumption the most; for 6 out of the 8 stand-area categories, and 4 out of the 10 stand-value categories, geographic location stands out as the second most influential parameter. The small magnitudes of the adjusted R2 values are indicative of the large sample sizes and the inherent variability and uncertainty in the data. The regres-sion analyses are, however, very useful in identifying the most important parameters influencing water consumption. Following the multiple variable analysis, a single variable analysis was conducted for each of the 18 databases with each of the parameters that emerged (i.e. stand area, stand value and geographical location) as influencing water consumption the most. Geographic location was considered in the single vari-able regression analysis by categorising for inland and coastal regions. Superimposed on the Red Book guideline, Fig. 4 shows the single variable regression models with stand area as inde-pendent variable for various income (using stand value as a proxy for household income) categories for both inland and coastal geographic locations. The regression models predict that for the same stand area, higher income levels will consume
TABLE 5Stepwise regression equations for the most influential parameter in relation to Ln (AADD)
Category description
Most influential pa-rameter in relation to Ln(AADD)
Regression equation for the most influential parameter
Stand-area categories≥ 20 m2 and < 500 m2 Stand area 195.0001.0 −= StdAreaLnAADD≥ 500 m2 and < 750 m2 Ln(stand value)
920.0)ln(099.0 −= StdValueLnAADD≥ 750 m2 and < 1 000 m2 Ln(stand value)
824.1)ln(181.0 −= StdValueLnAADD≥ 1000 m2 and < 1500 m2 Ln(stand value)
595.2)ln(251.0 −= StdValueLnAADD≥ 1500 m2 and < 2 000 m2 Ln(stand value)
050.3)ln(295.0 −= StdValueLnAADD≥ 2000 m2 and < 2 500 m2 Ln(stand value) 788.2)ln(279.0 −= StdValueLnAADD≥ 2500 m2 and < 3 000 m2 Ln(stand value)
670.3)ln(348.0 −= StdValueLnAADD≥ 3000 m2 and < 4 000 m2 Ln(stand value)
453.3)ln(331.0 −= StdValueLnAADDStand value categories
≥ R20 000 and < R50 000 Ln(stand value)736.2)ln(266.0 −= StdValueLnAADD
≥ R50 000 and < R100 000 Ln(stand area)661.0)ln(133.0 −= StdAreaLnAADD
≥ R100 000 and < R250 00 Ln(stand area)910.0)ln(186.0 −= StdAreaLnAADD
≥ R250 000 and < R500 000 Ln(stand area)455.1)ln(286.0 −= StdAreaLnAADD
≥ R500 000 and < R750 000 Ln(stand area)159.1)ln(266.0 −= StdAreaLnAADD
≥ R750 000 and < R1 000 000 Geographic location
≥ R1 000 000 and < R2 000 000 Geographic location≥ R2 000 000 and < R3 000 000 Ave min temp
890.2)(172.0 +−= MinTempLnAADD≥ R3 000 000 and < R4 000 000 Ave min temp specific
986.2)(123.0 +−= MinTempLnAADD≥ R4 000 000 MAE
336.3)(0027.0 −= MAELnAADD
≥ R750 000 and < R1 000 000 Geographic location 398.1)(427.0 GLLnAADD
≥ R1 000 000 and < R2 000 000 Geographic location 534.1)(446.0 GLLnAADD

Available on website http://www.wrc.org.zaISSN 0378-4738 = Water SA Vol. 34 No. 3 July 2008ISSN 1816-7950 = Water SA (on-line)
389
more water on average than lower income levels. The regression models also predict that coastal stands with the same stand area and stand value will consistently consume less water than their inland counterparts. Figure 5 shows the single variable regression models with stand value as the independent variable for various stand-area categories for both inland and coastal geographic locations. These regression models predict that consumers with larger stand areas will generally consume more water than consumers with smaller stand areas for the same stand value (or income) categories. The regression models confirm the previous result that coastal stands with the same stand area and stand value will consistently consume significantly less water than inland stands. From these results it is apparent that household income in addition to stand area, have a significant impact on domestic water consumption and that it would be ideal to jointly take these two parameters into account when estimating domestic demand. The single variable regression models confirm the outcome of the multiple variable regression models, i.e. that both stand area and income are positively correlated to domestic water consump-tion. Geographic location is also an important factor to consider with domestic water-demand estimation, i.e. that coastal stands
consistently consume less water than inland stands for the same stand area and value.
Development of a water-demand estimation guideline
The results of this study confirm that stand area is one of the parameters that influence domestic water consumption the most. However, in this study, stand value (as a proxy for household income) and geographic location were also found to significantly influence domestic water consumption. It was therefore consid-ered constructive to propose a new AADD guideline, given the results of this study. The 1st possibility investigated was a two-variable model with stand area and stand value specified as independent vari-ables. However, information on stand value is generally diffi-cult to obtain and a designer would not easily have access to such data for design purposes.. Also, stand values continuously change and would be significantly different over time from the values used in this study for the exact same suburb. Also, in many instances, stand values are based on perception rather than true values and hence, would distort demand estimates. The 2nd possibility investigated was to develop three income models (with stand value as a proxy for household income). In
0
0.5
1
1.5
2
2.5
3
3.5
0 500 1000 1500 2000 2500 3000 3500 4000 4500
Stand area (m2)
AA
DD
(kl/d
ay)
a
b
c
e
d
f
a = ≥R750,000 and <R1 million
b = ≥R500,000 and <R750,000 c = ≥R250,000 and <R500,000 d = ≥R100,000 and <R250,000 e = ≥ R50,000 and <R100,000 f = ≥R20,000 and <R50,000
Red Book lower limit Red Book upper li i
inland coastal
ab
c
d
e f
0
1
2
3
4
5
6
0 500,000 1,000,000 1,500,000 2,000,000 2,500,000 3,000,000 3,500,000 4,000,000 4,500,000
Stand Value (R)
AA
DD
(kl/d
ay)
hg
f
e
d
c
a = 3000m2 and <4000m2 b = ≥2500m2 and <3000m2 c = ≥2000m2 and <2500m2
d = ≥1500m2 and <2000m2 e = ≥1000m2 and <1500m2 f = ≥750m2 and <1000m2 g = ≥500m2 and <750m2 h = ≥20m2 and <500m2
b
inland coastal
a
cd
b
ae
fg
h
Figure 4Single variable
regression models for AADD vs. stand
area for different income levels situ-ated in coastal and inland geographical
areas
Figure 5Single variable
regression models for AADD vs. stand value for different
stand areas situated in coastal and inland geographical areas

Available on website http://www.wrc.org.zaISSN 0378-4738 = Water SA Vol. 34 No. 3 July 2008
ISSN 1816-7950 = Water SA (on-line)
390
other words, categorise the single database into three income categories namely low-, middle- and high-income, and then gen-erate a regression model for each income group with stand area as the independent variable (Fig. 4 is an example of this possibil-ity). It was felt, however, that the categorisation of stand values into income levels could also be considered too subjective when used for the development of an AADD guideline. A guideline that allows the designer to interpret income levels, knowing that higher income users consume more water, may be a better option. The 3rd possibility investigated, which is the preferred of the three, is to develop a single guideline curve for AADD vs. stand area using all the AADD values in the single database (simi-lar to Fig. 3). The guideline curve will have envelopes around it based on 5%, 25%, 75% and 95% confidence limits. The confi-dence limits indicate the boundaries wherein a given percentage of AADD would lie. Figure 6 presents the proposed regression model. The equations for the confidence limits are given below.
95% (+) and 5% (-) confidence limits:
(2)
75% (+) and 25% (-) confidence limits:
(3)
Conclusions
This study investigated the combined effect of various socio-economic and climatic parameters on municipal water consump-tion with the objective of determining the dominant influencing parameters. The result is a new guideline for AADD estimation. To this end, an initial database comprising over 2.5 x10⁶ metered water consumption records, extracted from 48 municipal treas-ury databases, which are located within 5 out of the 7 South African water regions, was analysed. Each of the 48 munici-pal treasury databases spanned a period of at least 12 months
(the vast majority for at least 24 months). The final amalga-mated database, after rigorous cleaning and filtering, comprised 1 091 685 consumption records. Single variable and stepwise multiple variable regression analyses were utilised. The main conclusions of the study are:
Water consumption is by nature highly variable and thus • it is not possible to develop a single regression model that can predict individual water demands accurately. However, regression models can greatly assist the design engineer by identifying the most important parameters that affect water demandOf all the parameters investigated in this study, it was clear • that stand area, stand value and geographical location (inland or coastal) are the dominant parameters that affect domestic water consumptionInland stands use more water than coastal stands and should • be treated separately in any design guidelineStand area and stand value are positively correlated with • domestic water consumptionIt is not possible to have a consistent basis for predicting • stand values due to constant fluctuations in the value of property and municipal valuations that are often outdated. This leaves stand area as the best descriptor of AADDThe current • Red Book AADD guideline is not adequate and needs to be revised. This is made clear by the fact that the Red Book AADD guideline envelope accounts for only 53% of the suburbs studiedA guideline curve giving various confidence limits for water • demand based on stand area is presented to assist design engineers with selecting appropriate AADD values for new developments.
Acknowledgements
The authors acknowledge and appreciate financial and research support from the Water Research Commission (Project No K5/1525), Rand Water, and municipal data supplied by GLS Consulting.
References
BASSON MS, VAN NIEKERK PH and VAN ROOYEN JA (1997) Overview of Water Resources Availability and Utilisation in South
0
0.5
1
1.5
2
2.5
3
3.5
4
4.5
5
5.5
0 500 1000 1500 2000 2500 3000 3500 4000
Stand Area (m2)
AA
DD
(kl/d
ay)
Ln(AADD) = - 1.61+0.297ln(StandArea)
95%
5%
75%
25%
Figure 6Proposed guideline for
domestic water-demand estimation
666977)4124.6(ln1)43865.0)(6449.1()ln(297.0610.1)ln(2
StdAreaStdAreaAADD
666977)4124.6(ln1)43865.0)(6745.0()ln(297.0610.1)ln(2
StdAreaStdAreaAADD
666977)4124.6(ln1)43865.0)(6449.1()ln(297.0610.1)ln(2
StdAreaStdAreaAADD
666977)4124.6(ln1)43865.0)(6745.0()ln(297.0610.1)ln(2
StdAreaStdAreaAADD

Available on website http://www.wrc.org.zaISSN 0378-4738 = Water SA Vol. 34 No. 3 July 2008ISSN 1816-7950 = Water SA (on-line)
391
Africa. Department of Water Affairs and Forestry P RSA/00/0197, Pretoria, South Africa. May. 72 pp.
CSIR (2003) Guidelines for Human Settlement Planning and Design. The Red Book (2nd edn.). A report compiled under the patronage of the Department of Housing, South Africa.
DCD, DEPARTMENT OF COMMUNITY DEVELOPMENT (1983) Guidelines for the Provision of Engineering Services for Residential Townships. The Blue Book. Pretoria, South Africa. pp F12.
EDWARDS K and MARTIN L (1995) A Methodology for Surveying Domestic Water Consumption. J. Chartered Inst. Water and Envi-ron. Manage. October (9) 477-488.
GARLIPP, KDCO (1979) Water Consumption Patterns in Urban Areas. M.Sc. Dissertation. University of Pretoria, Pretoria, South Africa.
GLS, GEUSTYN LOUBSER STREICHER CONSULTING and GLS SOFTWARE (2007) Swift. http://www.gls.co.za/Gls/pages/swift/overview.html. Accessed 27 September 2007.
HUSSELMANN ML and VAN ZYL JE (2006) Effect of stand size and income on residential water demand. J. S. Afr. Inst. Civ. Eng. 48 (3) 12-16.
JACOBS HE, GEUSTEYN LC, LOUBSER BF and VAN DER MERWE B (2004) Estimating residential water demand in Southern Africa. J. S. Afr. Inst. Civ. Eng. 46 (4) 2-13.
JACOBS HE and HAARHOFF J (2004) Application of a residential end-use model for estimating cold and hot water demand, waste-
water flow and salinity. Water SA 30 (3) http://www.wrc.org.za/archives/watersa%20archive/2004/July-04/3.pdf
JACOBS HE (2007) The first reported correlation between end-use esti-mates of residential water demand and measured use in South Africa. Water SA 33 (4) http://www.wrc.org.za/downloads/watersa/2007/Jul%2007/2053.pdf
MIDGLEY DC, PITMAN WV and MIDDLETON BJ (1994) Surface Water Resources of South Africa. WRC Report No. 298/1/94. Water Research Commission, Pretoria, South Africa.
SOLLEY WB, PIERCE, RB and PERLMAN HA (1998) Estimated Use of Water in the United States in 1995. US Department of the Interior. US Geological Society. Denver, CO: USGS.
STEPHENSON D and TURNER K (1996) Water demand patterns in Gauteng. IMIESA 21 (1) 11-16.
VAN VUUREN SJ and VAN BEEK JC (1997) Her-evaluering van die Bestaande Riglyne vir Stedelike en Industriële Watervoorsiening gebaseer op Gemete Waterverbruike Fase 1: Pretoria Voorsienings-gebied. WRC Report No. 705/1/97, Water Research Commission, Pretoria, South Africa.
VAN ZYL JE, HAARHOFF J and HUSSELMAN ML (2003) Potential application of end-use demand modelling in South Africa. J. S. Afr. Inst. Civ. Eng. 45 (2) 9-19.
VAN ZYL JE and GEUSTEYN LC (2007) Development of a National Water Consumption Archive. WRC Report No. 1605/1/07. Water Research Commission, Pretoria, South Africa.

Available on website http://www.wrc.org.zaISSN 0378-4738 = Water SA Vol. 34 No. 3 July 2008
ISSN 1816-7950 = Water SA (on-line)
392
Related Documents

![Application guideline Rough Draft 20171031 - domestic[1]€¦ · Application guideline: applying to the Institute of Biosciences and Technology in Houston (a research institute of](https://static.cupdf.com/doc/110x72/5fcf206d3320645e23109d05/application-guideline-rough-draft-20171031-domestic1-application-guideline.jpg)


![TABLE OF CONTENTSlabour.gov.bn/Download/[LCS]GUIDELINE FOR NEW DOMESTIC... · 2016. 1. 14. · LCS – USER GUIDE V1 (030915) SRIMAYA TECHNOLOGIES AND COMMUNICATIONS Page 3 of 45](https://static.cupdf.com/doc/110x72/60b0898e0e4bc84e3854ff4c/table-of-lcsguideline-for-new-domestic-2016-1-14-lcs-a-user-guide-v1.jpg)