THE VIEW: AN EYE-TRACKING STUDY OF PRINT ADVERTISEMENTS By ASHTON LIERLE Bachelor of Science in Agricultural Communications Oklahoma State University Stillwater, Oklahoma 2015 Submitted to the Faculty of the Graduate College of the Oklahoma State University in partial fulfillment of the requirements for the Degree of MASTER OF SCIENCE December, 2017

Welcome message from author
This document is posted to help you gain knowledge. Please leave a comment to let me know what you think about it! Share it to your friends and learn new things together.
Transcript
THE VIEW: AN EYE-TRACKING STUDY
OF PRINT ADVERTISEMENTS
By
ASHTON LIERLE
Bachelor of Science
in Agricultural Communications
Oklahoma State University
Stillwater, Oklahoma
2015
Submitted to the Faculty of the Graduate College of the
Oklahoma State University in partial fulfillment of
the requirements for the Degree of
MASTER OF SCIENCE December, 2017

ii
THE VIEW: AN EYE-TRACKING STUDY OF
PRINT ADVERTISEMENTS
Thesis Approved:
Dr. Shelly Peper Sitton
Thesis Adviser Dr. D. Dwayne Cartmell, II
Dr. Gregory Clare
iii
Name: ASHTON LIERLE Date of Degree: DECEMBER, 2017 Title of Study: THE VIEW: AN EYE-TRACKING STUDY OF PRINT
ADVERTISEMENTS Major Field: AGRICULTURAL COMMUNICATIONS Abstract:
This research investigates how agricultural communications students view animal agriculture print advertisements using eye-tracking technology. The advertisements are constructed of a minimum of four areas of interest (AOIs) and are analyzed using eye-tracking metrics (time to first fixation, fixation duration, and fixation count) and scanpath entropy. Eye-tracking technology is a growing phenomenon in the advertising industry, but the data isn’t always readily available. The purpose of this study is to determine how agricultural communication view print advertisements and if they view them differently after experiencing an introductory graphic design course.
Students completed a demographic questionnaire and were eye-tracked during the
first week of their introductory graphic design course and were then eye-tracked a second time using an identical eye-tracking test at the end of the semester. The eye-tracking test was designed so the participants had five seconds to view each of the eight advertisements.
Based on eye-tracking metrics, participants, on average, viewed all AOIs within
the advertisement in less than four seconds and the image produced the highest fixation count. The logo AOI produced the greatest scanpath entropy, meaning it had the most information loss during viewing.
Evidence from this study led to recommendations for graphic designers to include
a dominant, attention-attracting element in their designs along with attention-holding elements to keep a viewer engaged in the design. For education, graphic design instructors should consider curriculum revision based on the results of eye-tracking studies.
iv
TABLE OF CONTENTS
Chapter Page I. INTRODUCTION ......................................................................................................1
Statement of the Problem .........................................................................................2 Purpose and Objectives ............................................................................................3 Review of Literature ................................................................................................4 Eye-tracking .......................................................................................................4 Visual Attention .................................................................................................7 Framework ...............................................................................................................8 II. METHODOLOGY ..................................................................................................10 Institutional Review Board ....................................................................................10 Research Design .....................................................................................................10 Instrumentations .....................................................................................................11 Questionnaire ...................................................................................................11 Eye-tracking Technology .................................................................................12 Advertisements ................................................................................................12 Data Collection ......................................................................................................15 Part 1: Questionnaire Administration ..............................................................15 Part 2: Eye-tracking Experience ......................................................................15 Threats to Validity .................................................................................................17 Participants .............................................................................................................17 Participant Confidentiality .....................................................................................17 Data Analysis .........................................................................................................18 Statistical Analysis ...........................................................................................18 Scanpath Entropy .............................................................................................18 III. MANUSCRIPT I ...................................................................................................21 Abstract ..................................................................................................................21 Introduction ............................................................................................................22 Methods..................................................................................................................24 Participants .......................................................................................................24 Materials ..........................................................................................................24
v
Chapter Page
Procedure .........................................................................................................27 Findings .................................................................................................................28 Conclusions and Recommendations ......................................................................35 Recommendations for Future Research .................................................................37 Recommendations for Practice ..............................................................................38 Summary ......................................................................................................................39 IV. MANUSCRIPT II ..................................................................................................40 Abstract ..................................................................................................................40 Introduction ............................................................................................................40 Methods..................................................................................................................46 Results ....................................................................................................................50 Conclusions and Discussion ..................................................................................52 Recommendations for Future Research .................................................................53 Recommendations for Education and Practice ......................................................54 V. DISCUSSION AND IMPLICATIONS .................................................................55 REFERENCES ............................................................................................................59 APPENDICES .............................................................................................................65 APPENDIX A: Institutional Review Board (IRB) Approval Form ......................66 APPENDIX B: Questionnaire ................................................................................68 APPENDIX C: Recruitment Script ........................................................................71 APPENDIX D: Consent Form ...............................................................................73

vi
LIST OF TABLES
Table Page 1. Fixation Duration and Count ................................................................................31 2. Time to First Fixation ...........................................................................................33 3. Weighted Scanpath Entropy .................................................................................51
vii
LIST OF FIGURES
Figure Page 1. Advertisement designs used for eye-tracking .......................................................14 2. Researcher-developed areas of interest in the advertisement designs ..................26 3. Self-reported sex and permanent geographic residence type ................................29 4. Scanpath illustrations using average time to first fixation ....................................34 5. Researcher-developed areas of interest in the advertisement designs ..................46
1
CHAPTER I
INTRODUCTION
Studies have found an average adult is exposed to 600 advertisements in any form
every day (Media Matters, 2007). But, the question is “Do those consumers ever really
think, ‘Wow, that designer took a lot of time considering the placement of the elements in
that design’?” So, what attracts average consumers to designs: Words? Spacing? Fonts?
Bigger, more dominant elements? Bright color schemes? Today, graphic designers are
trained to have these questions in mind while they design advertising material (Martin &
Hannington, 2012). In fact, designers should continuously review and critique their work
to distinguish themselves from others in the industry (Graham, 2005).
According to Graham (2005), graphic designers are creative artists who always
strive to meet the needs of the customer. Those needs include identifying a target
audience and keeping the characteristics of that audience in mind during the entire design
process (Graham, 2005). Every graphic designer should focus on understanding how
design elements incorporate the principles of design, and one of the most important
aspects of producing a visual creation is to base the design around the interests of the
2
viewers, not the designer (Graham, 2005).
Every time a designer begins a project, the target audience should be established
first (Graham, 2005). Marketing to different age groups, like children and centenarians,
can change the whole concept of the design (Graham, 2005). Children most likely prefer
designs with brighter colors and “fun” graphics, while people older than 60 probably
prefer something a little less busy and more straightforward with larger fonts and
graphics (Graham, 2005). College-level design textbooks, such as Martin & Hannington
(2012) and Graham (2005), provide curriculum stating designers and artists should be
trained to look for key design elements such as lines, shapes, color, and texture. Average
viewers of design products tend to look for the same elements most of the time, but skim
certain elements or do not recognize relationships among the elements used in the design
process as they scan for the overall message (Wedel et al., 2008).
Throughout the last decade, eye-tracking work has evolved in this new
technology-driven society (Duchowski, 2007). Researchers now are beginning to
understand the unique contributions eye-tracking can lend to their studies (Duchowski,
2007). However, eye-tracking data collected by advertisers is commonly difficult to find
(Duchowski, 2007).
Statement of the Problem
Eye-tracking technology has grown in popularity throughout the last decade, but
little evidential research of eye-tracking is being used for advertisement analysis (Rayner
et al., 2001). Companies implement eye-tracking technology into their advertisement
development plan but keep the information mostly proprietary (Rayner et al., 2001).
Additionally, research in curriculum development strategies in higher education
are needed (Clarence-Fincham & Naidoo, 2013). Stark (2000) found college professors
3
and faculty seek little to no help from curriculum research literature when it comes to
curriculum development.
Purpose and Objectives
The purpose of this study was to determine how a specific college-age audience
views print advertisements and if they view advertisements differently after experiencing
graphic-design training. The results of this study will provide graphic design instructors
with insights on how their curricula affects the way designers view advertisements.
The following research objectives were established for this study:
1. Determine the time it takes agricultural communications students to view specific
areas of interest (AOIs) in advertisements.
2. Determine the scanpaths followed by agricultural communications students when
viewing advertisements.
3. Determine the amount of time agricultural communications students spend
viewing AOIs in advertisements.
4. Determine the number of times agricultural communications students view AOIs
within advertisements.
5. Determine information transfer (scanpath entropy) of AOIs when students view
advertisements prior to an introductory graphic design course.
6. Determine information transfer (scanpath entropy) of AOIs when students view
advertisements after experiencing an introductory graphic design course.
7. Compare the information transfer (scanpath entropy) of AOIs when students view
advertisements before and after exposure to an introductory graphic design
course.
4
Review of Literature
The literature associated with the use of eye-tracking technology and eye-tracking
studies in the discipline of graphic design uses terminology that could require some
clarification. To incorporate methods common to eye-tracking research in the current
study, we employed the basic concepts of eye-tracking, visual attention, and fixations and
saccades.
Eye-tracking
Eye-tracking is a method for incorporating the voice of consumers into design
practice and increasing in popularity (Duchowski, 2017). Eye-tracking is based on Just
and Carpenter’s (1976) “eye-mind” hypothesis, which stated the location of a person’s
gaze directly corresponds to the most immediate thought in a person’s mind.
Eye-tracking technology collects data on the unconscious action of the eye
(Duchowski, 2017) and has been used by researchers for several decades to reveal covert
perceptual and cognitive processes that inspire the perception and aesthetic evaluation of
art (Lochner, 2006).
In 2001, Miall and Tchalenko performed the first thorough examination of a
painter’s work process. Miall and Tchalenko (2001) observed the rhythm between
fixations on the model and fixations on the drawing. They also looked into the pattern of
hand movements in relation to the eye positions when drawing quick sketches. Tchalenko
and Miall have continued their studies with other researchers, specifically focusing on
fixations and saccades.
In hopes of expanding on the role of eye movements, Yarbus (1967) determined
the human eye voluntarily and involuntarily fixates on elements that contain essential
5
information to the viewer. The greater the amount of information in the element, the
greater amount of time the viewers’ eyes stay fixated on that element (Yarbus, 1967).
When looking at order and duration of the fixations on elements, Yarbus concluded those
measures are influenced by the thought process associated with the analysis of the
information received. Yarbus (1967) explained the concept of saccades as:
The main function of saccades is to change the points of fixation, to direct
the most sensitive regions of the retina (the fovea) to a particular element
of the object of perception. The nature of saccades is responsible for much
of the refinement of perception. The high velocity and correspondingly
short duration of the saccade usually permits the eye to remain in a state of
fixation for 95% of total time. (p. 129)
Several eye-tracking studies have concluded measuring saccades is actually not
necessary in eye-tracking studies (Just and Carpenter, 1976; Neilson & Pernice, 2010;
Yarbus, 1967). Saccades are among an ongoing debate about their relevance to the
literature in certain cases and methodologically more complex to quantify, so for this
study, we will primarily focus on measuring fixations.
Large corporations, educational institutions, and others are growing accustomed
to using eye-tracking technology. These eye-tracking systems combined with the
available software packages can generate detailed statistical results (Duchowski, 2007).
Eye-tracking technology measures an individual’s eye movements and tells the researcher
where the person is looking at any certain time as well as the pattern his or her eyes
follow from one element to another (Duchowski, 2007). When it comes to remote, non-
intrusive eye-tracking, the most common technique used is pupil center corneal reflection
6
(PCCR) (Poole & Ball, 2005). This approach measures how light is used to illuminate the
eye, which creates highly visible reflections, while a camera is used to capture an image
of the eye to show the reflections (Poole & Ball, 2005). This image then is used to detect
the reflection of the light source on the cornea and in the pupil. A vector can be
developed by the angle between the cornea and pupil reflections. Gaze direction is
calculated by combining the direction of the vector with other geometrical features of the
reflections (Matos, 2016). Today’s most advanced eye-trackers use near-infrared
illumination to create the reflection patterns on the cornea and the pupil of the eye. A
physiological three-dimensional (3D) model of the eye and advanced image processing
algorithms are used to estimate the position of the eye in space and the point of gaze with
high accuracy (Matos, 2016).
One common component used to describe eye-tracking is the mind-eye
hypothesis. This fundamental approach is found to be the backbone of a majority of eye-
tracking studies. In general, the mind-eye hypothesis assumes a person looks at what he
or she is thinking about. Anderson et al. (1976) describe the mind-eye hypothesis in more
specific terms:
Eye movements do not necessarily reflect mental processes, but they do
reflect ongoing processes to the extent that the processes depend on the
encoding of information. Although some cognitive tasks have to wait for
information to be encoded, in many cases, the mind has a path to travel
after the encoding of the information, and eye movements do not indicate
what is happening on that path. (p. 230)
7
Visual Attention
In eye-tracking research, we first look at the motivation for recording human eye
movements to help us understand attentional processes because we need to know more
about visual attention (Duchowski, 2007). William James (1981) defined visual attention
in his book Principles of Psychology:
Everyone knows what attention is. It is the taking possession by the mind,
in clear and vivid form, of one out of what seem several simultaneously
possible objects or trains of thought. Focalization, concentration, of
consciousness are of its essence. It implies withdrawal from some things
in order to deal effectively with others and is a condition which has a real
opposite in the confused, dazed, scatterbrained state. (p. 404)
For the human mind to process the stimulus of interest, attention is used to focus
psychological capacities on selections of the sensory input (Duchowski, 2007). The
human brain processes sensory input by concentrating on specific components of the
whole sensory range so intriguing sights, sounds, and smells may be inspected with
greater attention to detail than peripheral stimuli (Duchowski, 2007).
Three psychologists, Von Helmholtz (1925), James (1981) and Gibson (1941),
explored the “where,” “what,” and “how” of visual attention. Von Helmholtz (1925)
suggested visual attention is a vital tool of visual perception. He focused on studying eye
movements to spatial location – the “where” of visual attention. James (1981) defined
attention as it pertains to the “what,” or the identity, meaning, or expectation related to
the focus of attention. Gibson (1941) centered his interpretation of visual attention on
intention. His proposal described the viewer’s preparation as to whether to react to
8
something, and if so, how and with what class of responses.
Framework
A conceptual framework, with emphasis on the scanpath theory and information
theory, will be used to guide the study.
Noton and Stark (1971) studied eye movements and defined the observed patterns
as “scanpaths.” They determined even without questions for the viewers to consider
before viewing, participants tend to fixate on identifiable areas of interests. Scanpaths
showed the order of eye movements across areas of interest (AOIs) is significantly
variable in Noton and Starks (1971) research. Scanpath theory also depicts how scanpath
facilitates subsequent recognition of advertisements (Viviani, 1990).
To better understand the concept of scanpath entropy we reviewed the work of
Hooge and Camps (2013) as a guide to this measure of eye-tracking. Hooge and Camps
(2013) summarized the use of entropy to quantify gaze guidance along with other
existing measures. To explore scanpath entropy, it is first important to understand the
concepts of the Information Theory. Information theory is a mathematical theory of
communication with two main goals: (a) develop fundamental theoretical limits on the
achievable performance when communicating a given information source through a given
communications channel using coding schemes from a prescribed class and (b) develop
coding schemes providing reasonably good performance compared to optimal
performance given by the theory (Gray, 2011). Shannon’s Information Theory is seen by
some as an extension of the applied probability theory and the ergodic theory (Gray,
2011). Shannon’s development of the idea of entropy of random variables to the
formation of the information theory. Entropy was later defined by Gray (2011) as the
9
relevance to a single random variable or random vector.
In 2001, Rayner et al. studied eye movements on print advertisements with
different tasks assigned to participants. They found viewers commonly looked at the text
longer than they looked at the picture in the advertisement and more fixations occurred
on the text than the picture. After doing an initial scan of the advertisements, it is
common for viewers to read larger text and then the smaller text, followed by fixating on
the image (Rayner, 2001).
In a similar study, Pieters & Wedel (2004) studied brand pictorial and text-size.
They determined the size of AOIs within advertisements does directly affect viewers’
attention (Pieters & Wedel, 2004). Another aspect to review in regard to attention is
visual complexity, which was studied by Pieters, Wedel & Batra (2010). By studying
feature and design complexity, Pieters et al. (2010) found attention to more complex
advertisements strictly depends on if the advertisement possesses feature or design
complexity. Feature complexity describes how complex visual details are in an
advertisement, while design complexity relates more to the detail in creative design
shapes, objects, and organization (Pieters et al., 2010). In advertisement design Pieters et
al. (2010) determined design complexity aids in advertisement performance while feature
complexity harms it.

10
CHAPTER II
METHODOLOGY
In this chapter, you will find the methods and procedures followed by the
researcher to conduct this study including the Oklahoma State University Institutional
Review Board (IRB) approval, research design, instrumentation, participants, and data
analysis.
Institutional Review Board
Federal regulations, along with institutional standards set by Oklahoma State
University, require all research conducted using human subjects to be approved prior to
beginning a study. The Oklahoma State University Office of University Research
Services and Institutional Review Board regulate the biomedical and behavioral research
to maintain the welfare of the human subjects. This study was reviewed by the OSU IRB
and was approved January 18, 2017 (see Appendix A). This study is identified by IRB
application number AG-17-1.
Research Design
A research design is defined as the science and art of planning procedures for
conducting studies so as to get the most valid findings (Vogt, 2005). An exploratory one-
11
group design with a nonprobability convenient population was used for both research
studies. A census design was used because of the small population size. Because of these
characteristics, the results in both studies cannot be generalized beyond the given
population. The researchers designed Manuscript I as a general exploratory study with
one group and no control while Manuscript II was a pretest-posttest design. A mixed-
methods analysis was used to analyze the data.
Instrumentation
Questionnaire
A researcher-developed questionnaire (see Appendix B) was used in this study
prior to collection of the eye-tracking data to gain insight about the participants. The
questionnaire asked the participants demographic questions, such as age and sex. The
participants also were asked to identify their college major and relation to agriculture.
This was done to help the researchers better understand the participants’ background. The
last five questions on the survey pertained to physical traits of the participants pertaining
to vision. The participants were asked if they were colorblind or had been diagnosed with
any other disorder or medical condition that could influence their vision. If a participant
had reported a non-corrected vision issue, the participant would have been removed from
the data set.
The following questions were included in the research questionnaire:
1. What is your sex?
2. What is your primary major?
3. Prior to attending Oklahoma State University, where did you live?
4. Are you right-hand or left-hand dominant?
12
5. Do you have any vision issues?
6. If answered yes on #5, do you where corrective lenses to obtain normal vision?
7. Are you colorblind?
8. Do you have epilepsy?
9. Have you ever been diagnosed with a disorder or medical condition that could
influence your vision?
Eye-Tracking Technology
Eye movements were recorded using a Tobii™ T60 version 3.4.7 screen-based
eye-tracker. A desktop iMac computer was used to power the Tobii™ T60 device. The
advertisement images were imported into the Tobii™ software as JPEG files and
displayed on the screen at a full resolution of 1920 x 1080 pixels. The advertisements
were centered on a color monitor when viewed by the participants.
The eye-tracking device software provided corresponding heat maps, gaze plots,
and statistical data. The statistical data was exported into Microsoft Excel files by the
Tobii™ software program. This data can provide a visual analysis to help readers
comprehend the scan patterns and distributed attention (Martin & Hannington, 2012).
Advertisements
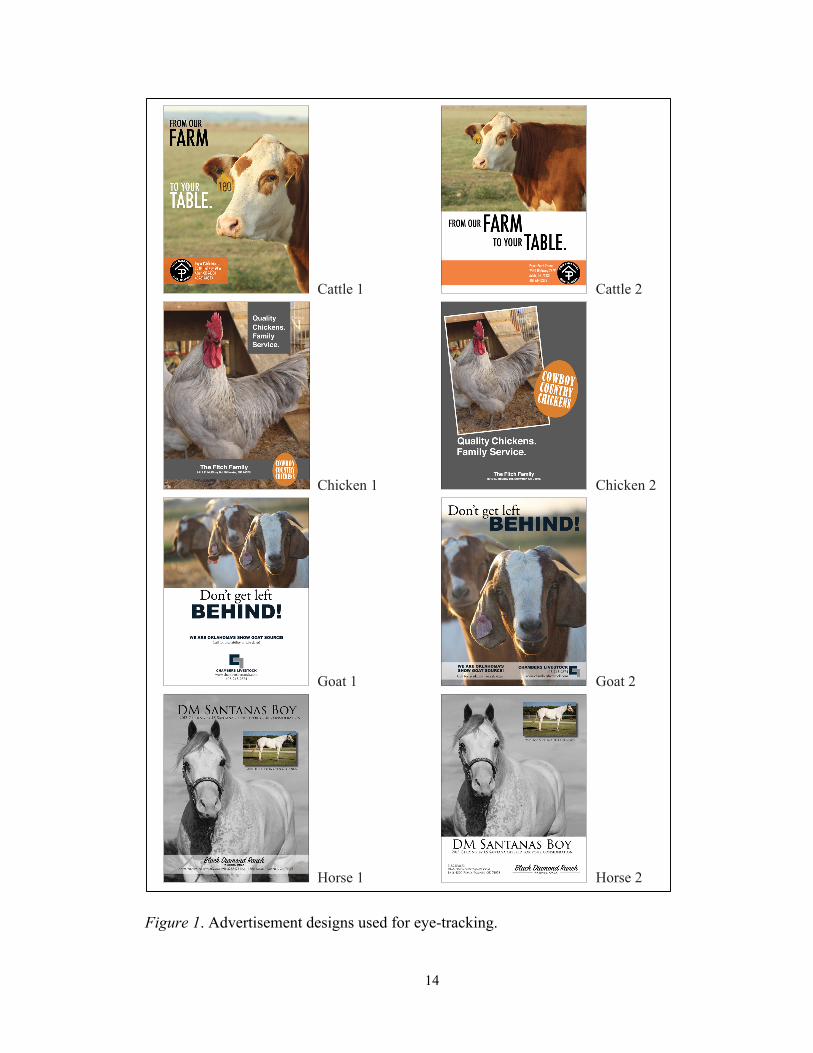
Participants viewed eight different unpublished advertisements (see Figure 1) viewed at
approximately 8.5” x 11” (612 x 792 pixels) on the screen. Six of the advertisements
were full-color, while the other two advertisements were primarily black and white with a
smaller color image. The four advertisements used to analyze scanpath entropy were full-
color and contained four areas of interest: an image, a headline, a logo, and contact
information. Four agricultural species were included in the advertisement set: cattle,

13
goats, chickens, and horses. Two versions of each of the advertisements were designed to
determine different eye patterns and fixations on the same content as suggested by Hooge
& Camps (2013). Each advertisement was viewed in RGB color mode at 72 dots per inch
(dpi). The advertisements designed for the study were reviewed for face and content
validity by two professionals with working knowledge of graphic design principles and
one person who had no graphic design experience. The reviewers indicated no changes
needed to be made. This was done to assure the advertisements realistically depicted an
advertisement that would possibly be seen in a magazine as recommended by Duchowski
(2017).
14
Figure 1. Advertisement designs used for eye-tracking.
Cattle 1
Chicken 1
Goat 1
Horse 1
Cattle 2
Chicken 2
Goat 2
Horse 2
Figure 1. Advertisement Designs
15
Data Collection
Part 1: Questionnaire Administration
To begin the study, participants were asked to complete a brief questionnaire to
help the researchers gain insight on the population. On the first day of the Spring 2017
AGCM 3213 Layout and Design course, the researcher was introduced to the class by the
professor of the course. The researcher then read the first section of the script (see
Appendix C) regarding the purpose and objectives of the study. After answering some
follow-up questions, the researcher explained the relation this study had to an assignment
for the course, instructions for the questionnaire, the consent process, and the students’
rights as research participants (see Appendix D).
After reading the script and answering all of the questions the participants had, the
researcher explained how to register for a time to complete the eye-tracking experience
and how to access the eye-tracking laboratory. The professor of the course, who is also
the committee chair for this research project, and the researcher left the room while the
participants completed the questionnaire and consent form. The questionnaire and
consent forms then were placed in a sealed envelope and placed in a locked cabinet by a
staff member with no relation to the study. The sealed envelope remained secure until
after final grades were recorded.
Part 2: Eye-tracking Experience
For the eye-tracking segment of the study, participants were placed in the eye-
tracking laboratory one at a time. The participants were seated so the distance between
the computer monitor and their eyes was approximately 50-80 cm, which is the
16
recommended best practice (Duchowski, 2007). All participants were advised to keep
their head and body as still as possible during the eye-tracking session.
The participants were asked to enter their first and last name in the space provided
in the Tobii™ software program. They then were instructed to have their eyes follow the
red dot on the white screen while the machine calibrated to their eyes. All participants
completed the calibration process on the first try without any significant drift, which is
when the point of gaze differs from the point of regards (Duchowski, 2017). After the
calibration process was complete, the participants were asked to enter their first and last
name again before the eye tracking began. An instruction sheet appeared on the screen,
and the participants were advised to read the instructions while I also explained them.
The instructions read as: Look at the following advertisements as if you were looking at
them in a magazine. When you are ready to start the eye-tracking experience please say
“begin.”
After the instructions were complete, each advertisement appeared individually on
the screen and remained on the computer screen for five seconds before the next
advertisement appeared. The study was completely “hands-free” after the eye-tracking
began, meaning the participants did not have to click or push any buttons to move to the
next image. All data was collected through the same eye-tracking software, Tobii™
Studio 3.4.5, on one computer by the same researcher to minimize variance. The eye-
tracking laboratory remained controlled in lighting and temperature. The computer used
to conduct the eye tracking also was surrounded by a barrier to prevent any distraction for
the participants. The advertisements were presented to each participant in the same order.
17
Threats to Validity
This study runs the risk of having some threats to ecological validity because it
was in conducted in a laboratory setting; however, the advertisements were designed to
replicate the same size of a magazine and controls – such as the lighting in the room, the
same researcher administered all of the tests, and only one participant was allowed in the
room at one time – stayed constant.
Participants
Twenty-nine participants with minimal or no graphic design experience took part
in the census study. A census design was chosen because the population was small and all
participants could be tested conveniently using the eye-tracking instrument. All students
in the population were enrolled in or had completed a prerequisite introductory
agricultural communications writing course prior to enrolling in the course used in this
study.
Participant Confidentiality
The questionnaire was administered by an outside source not connected to the
research to avoid the researchers knowing who did or did not consent for their data to be
used. The consent forms were placed in a locked cabinet to ensure the identity of the
participants was protected. After the completion of the semester, the data collected from
the questionnaire was recorded into a secure document and stored on a password-
protected computer. All records containing sensitive content were stored on a password-
protected computer and in a locked file cabinet only accessible by myself and my
committee chair.
18
Data Analysis
Statistical Analysis
Statistical analysis of the eye-tracking data was used to produce information
regarding the following metrics: time to first fixation, total fixation duration, fixation
count, total visit duration, visit count, and percentage fixated. Tobii™ (2016) defines
these metrics as:
Time to First Fixation: The time from the start of the stimulus display until the test
participant fixates on the area of interest (AOI) or AOI group for the first time.
Total Fixation Duration: Duration of all fixations within an AOI.
Fixation Count: Number of times the participant fixates on an AOI.
Visit Count: Number of visits within an AOI or AOI group.
These values, all produced by the Tobii™ software, were analyzed by calculating
the means of each AOI on its respective advertisement. The data was also analyzed using
SPSS 21 for Macintosh. Four of the advertisements contained four AOIs and the
remaining four advertisements contained five AOIs, all of which were determined by the
researcher.
Scanpath Entropy
Scanpath, or transition, entropy-based analysis methods have developed as an
additional method used to analyze eye-tracking data. Krejtz et al (2015), Stark and Ellis
(1981), and others have created a similar method for analyzing scanpath, or transition,
entropy. This particular study uses the Shannon entropy measure, which is defined by
Information Theory as the relevance to a single random variable or random vector (Gray,
2011). The main goal of scanpath entropy in this study is to quantify gaze guidance.
19
Since most advertisements are designed for more than just the goal of brand recognition
(Hooge & Camps, 2013), we did not specify one particular AOI to calculate entropy for
but instead wanted to better understand visual scanning behaviors of the AOIs within the
context of the advertisement as a whole.
The first step in creating measurable scanpaths in eye-tracking data is to create
AOIs within each image (Hooge & Camps, 2013). Four AOIs were defined in each
advertisement used for this study: image, headline, contact, and logo. These AOIs were
drawn by hand in the Tobii™ software by the researcher. Hooge and Camps (2013)
suggests smaller, more detailed AOIs produce longer and higher numbers of scanpaths.
The researcher kept this information in mind while developing each individual AOI.
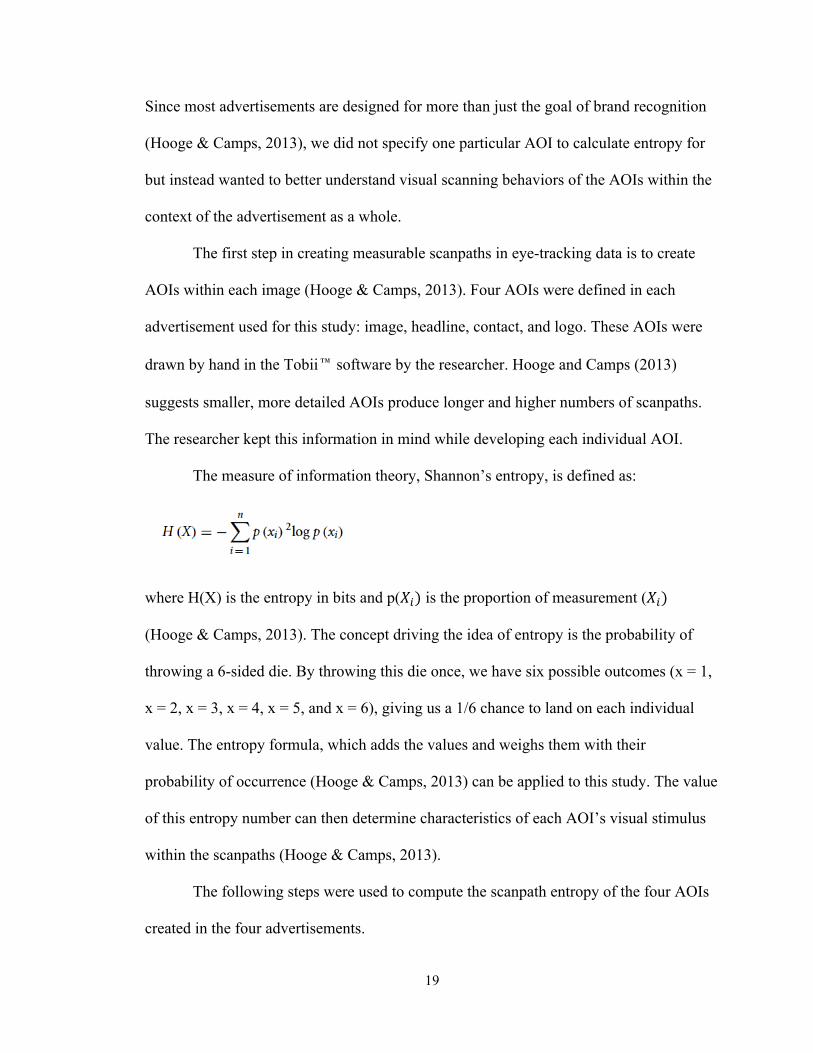
The measure of information theory, Shannon’s entropy, is defined as:
where H(X) is the entropy in bits and p(𝑋") is the proportion of measurement (𝑋")
(Hooge & Camps, 2013). The concept driving the idea of entropy is the probability of
throwing a 6-sided die. By throwing this die once, we have six possible outcomes (x = 1,
x = 2, x = 3, x = 4, x = 5, and x = 6), giving us a 1/6 chance to land on each individual
value. The entropy formula, which adds the values and weighs them with their
probability of occurrence (Hooge & Camps, 2013) can be applied to this study. The value
of this entropy number can then determine characteristics of each AOI’s visual stimulus
within the scanpaths (Hooge & Camps, 2013).
The following steps were used to compute the scanpath entropy of the four AOIs
created in the four advertisements.
20
1. Produced AOIs of each individual advertisement.
2. Analyzed each scanpath playback to create a character string. The AOI character string
was determined using a coding system where I represented image, H represented
headline, C represented contact, and L represented logo.
3. Removed all repeated AOIs in the character string. This leaves no more than four AOIs
in each character string. For example: A character string of IIHCLCH becomes IHCL
after removing repetitions. This process is converting the character string from a fixation-
based sequence to a dwell-based sequence (Holmqvist et al., 2011).
4. Calculated the number of unique scanpaths.
5. Applied the entropy formula to compute entropy. Shannon’s entropy formula was used
for this study.
21
CHAPTER III
MANUSCRIPT I
Abstract
When you look at an advertisement in your favorite magazine, where does your
eye go? The picture? The text? What is the last thing you see before turning the page?
The objective of this study was to identify key elements college-aged consumers viewed
in a livestock print advertisement. Twenty-nine participants with minimal or no graphic
design experience viewed eight print advertisements, designed by previous students, for
five seconds each. Eye-tracking technology was used to determine time to and location of
first fixation, final point of fixation, and fixation count. Participants took an average of
0.81 seconds to view the first fixated element and used an additional 3.34 seconds to
reach the last fixated element. The AOI with the largest surface size in the
advertisements, the image, produced the highest fixation counts with an average fixation
count of 5.25. Therefore, future graphic designers should be mindful when including a
dominant element in their designs. Also, current designers should have an understanding
of consumer eye behavior to best market their product or service to college-aged students.
22
Introduction
Advertisements are all around us and play a crucial role in our visual world
(Radach et. al, 2003). Since the 1990s, advertisers have increased the amount of money
they spend to produce advertisements (Wedel & Pieters, 2000). In a study conducted by
Media Matters (2007), an average adult is exposed to 600 advertisements daily, including
print and electronic media. This situation can make it difficult for advertisers to “stand
out from the others” when it comes to attracting consumers attention (Wedel & Pieters,
2000). By understanding the way potential customers view advertisements, designers can
implement guidelines to channel their creative work to meet the needs of their audience
(Radach et. al, 2003).
Therefore, the research objectives for this study are (a) to determine the time it
takes agricultural communications students to view specific areas of interest (AOIs) in
advertisements, (b) to determine the scanpaths followed by agricultural communications
students when viewing advertisements, (c) to determine the amount of time agricultural
communications students spend viewing AOIs in advertisements, and (d) to determine the
number of times agricultural communications students view AOIs within advertisements.
The study of eye movements is gaining attention from researchers because of the
possibilities to understand the visual search process (Rayner & Castelhano, 2008).
Patterns of visual attention are a useful measure generated by eye-tracking technology
when it comes to viewing advertisements (Higgins, Leinenger & Rayner, 2014).
Attention can be measured in terms of selection and gaze duration (Pieters et al., 2007).
Print advertisements decline in effectiveness when the designer fails to capture
consumer’ attention, which can lead to the inability to reach marketing goals (Pieters &
23
Wedel, 2004).
Rayner and Castelhano (2008) characterized basic eye movements and
determined we move our eyes every 250 to 350 milliseconds. During this time of eye
movement, known as saccades, we acquire information during the fixation period
(Rayner & Castelhano, 2008). Fixations, or the pauses between saccades, are a key
element in gathering visual information and should be considered for the improvement of
visual materials, such as advertisements (Hooge & Camps, 2013). Fixations occur when
the retina is stabilized over a stationary object and take place during approximately 90%
of the viewing time (Duchowski, 2017). Fixations can help determine an advertisement’s
potential to gain attention (Viviani, 1990).
Yarbus (1967) found fixations occurred on the elements that contain important
information to the viewer. The more information within the element, the longer the
viewers’ eyes remains fixated on the element (Yarbus, 1967). To help us understand the
concept of saccades, Yarbus (1967) explained them as the way a viewer changes the
point of fixation.
Placement and size of key elements in print advertisements, such as logos,
graphics, and text, play an important role in capturing attention (Pieters & Wedel, 2004).
It is also still widely practiced among graphic designers to design with the Z-pattern in
mind (Hooge & Camps, 2013). The Z-pattern suggests people scan from left to right and
from top to bottom, just as people most commonly read in the western culture (Hooge &
Camps, 2013). Consumer research conducted by Gorn et al. (1997) showed
advertisements containing color were perceived as higher value and more likeable than
black and white or greyscale designs. Emphasizing an image or graphic makes it easier
24
for the viewer to determine what message is being portrayed by the advertisement
quickly (Graham, 2005).
To determine scanpaths of the human eye, Noton and Stark (1971) studied the
scanpaths to later help them formulate the Scanpath Theory. They found viewers
commonly fixate on identifiable areas of interest within a composition without being
instructed to consider certain questions. Noton and Stark (1971) also determined the
pattern of eye movements across areas of interest is significantly variable. The Scanpath
Theory suggests perception and eye-movements are determined by the top-down spatial
cognitive model (Privitera, 2006). The concepts of the Scanpath Theory were used in this
study to guide us in achieving the overall purpose of the study, which is to determine how
an audience views print advertisements.
Methods
Participants
The researchers recruited participants through a junior-level, beginning print
design class in the agricultural communications program at Oklahoma State University.
Of the 31 students (N = 31) enrolled when the course began, 29 (n = 29) completed
research protocol for a 93.55% response rate. A census design was used because of the
small population size (Privitera, 2006).
Materials
Participants’ eye movements were recorded using version 3.3.1 of the Tobii™
T60 screen-based eye tracker. Eight unpublished advertisements were presented to the
participants at approximately 8.5” x 11” to most closely resemble the size of an
advertisement printed in a magazine. Having slightly different sets of advertisement
25
designs can lead to a thorough comparison of gaze behavior (Hooge & Camps, 2013).
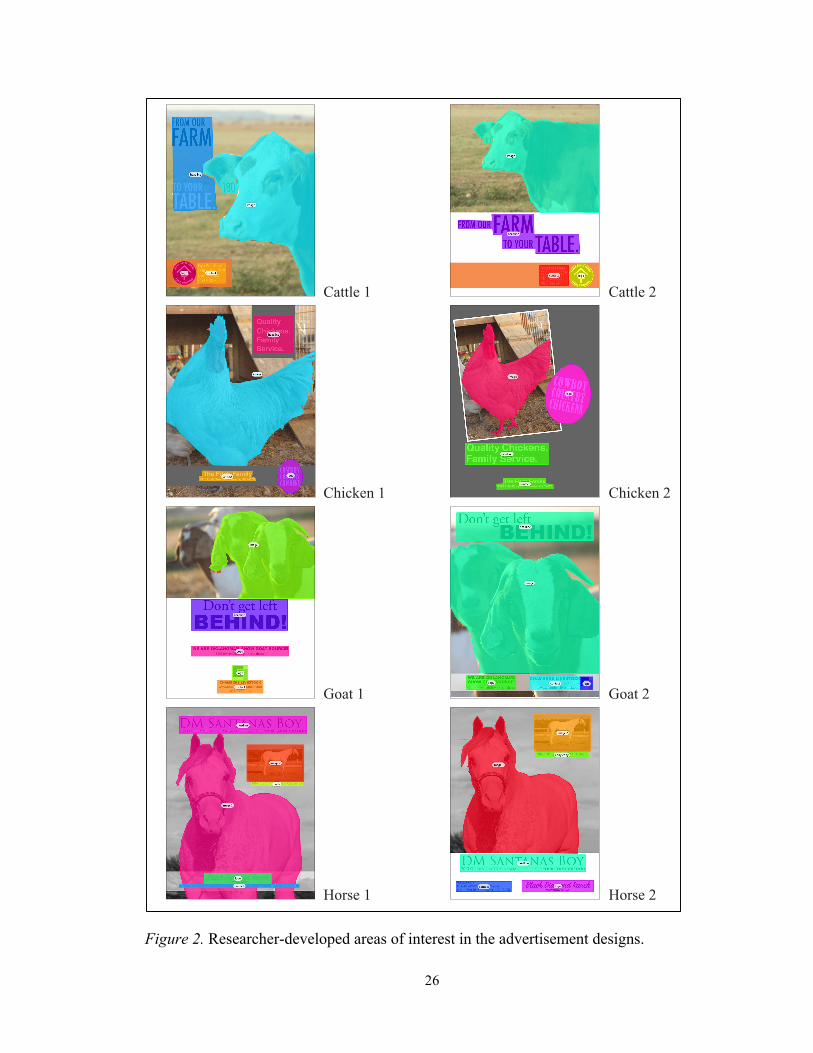
Four animal species were included in the set of advertisements: cattle, goats, chickens,
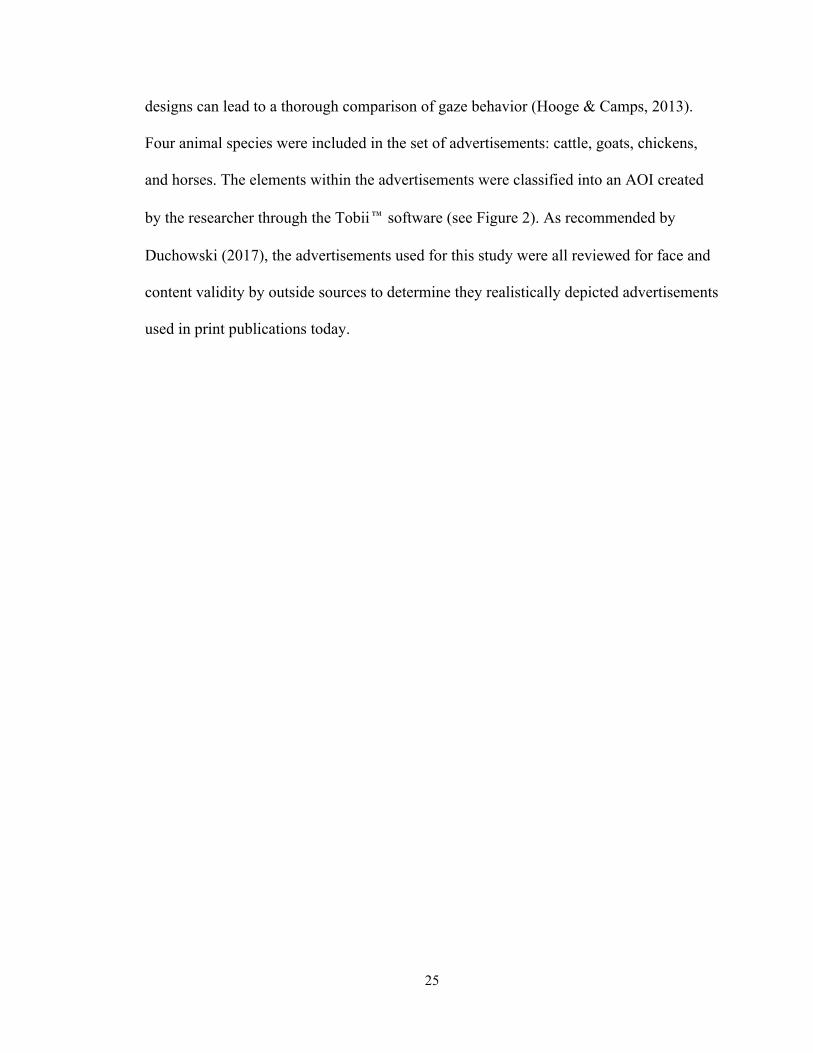
and horses. The elements within the advertisements were classified into an AOI created
by the researcher through the Tobii™ software (see Figure 2). As recommended by
Duchowski (2017), the advertisements used for this study were all reviewed for face and
content validity by outside sources to determine they realistically depicted advertisements
used in print publications today.
26
Figure 2. Researcher-developed areas of interest in the advertisement designs.
Cattle 1
Chicken 1
Goat 1
Horse 1
Cattle 2
Chicken 2
Goat 2
Horse 2
Figure 2. Areas of interest created by the reseacher in Tobii™ Studio.
27
Procedure
Participants were asked to complete a brief researcher-developed questionnaire to
provide insight on the population for the researchers. The completed questionnaires were
locked in a cabinet until the completion of the course because of the nature of
relationship bias between the researchers knowing who did and did not consent the use of
their data. The participants then scheduled a time to complete the eye-tracking exercise.
To maintain consistency throughout the eye-tracking process, all procedures were
conducted by one researcher, and each participant was individually eye-tracked on one
computer. The instructions given to the participants before the eye-tracking remained
consistent throughout and were general to not reveal the purpose of the study to the
participants. The laboratory where the eye-tracking exercise took place was controlled for
lighting and temperature throughout the study.
Each advertisement appeared on the screen for five seconds, followed by a three
second blank black screen before the next advertisement appeared. The eye-tracking
software was set up to make the study entirely hands-free so the participants did not have
to click or push any buttons to complete the study.
Time to first fixation, total fixation duration, fixation count, total visit duration,
and visit count were produced by the Tobii™ Studio v. 3.4.7 eye-tracking software and
then analyzed using SPSS for Macintosh version 21 to determine means and standard
deviations. Time to first fixation is a useful measure to estimate the attention captured by
individual elements within the design (Hooge & Camps, 2013). Effective design
techniques can be identified by determining how quickly a viewer fixates on an element
for the first time (Hooge & Camps, 2013). The goal of advertisements is message
28
transfer, which can be obtained by telling a story within the design (Hooge & Camps
2013). This research also discussed the importance of this message transfer by suggesting
the analysis of fixation order. Fixation order was determined in this study by reviewing
time to first fixation measurements.
As suggested by Hooge and Camps (2013) scanpath illustrations were created
using time to first fixation measurements. To avoid the cluttered default arrow plots
produced by Tobii™ Studio, researcher developed scanpath illustrations to include only
the specified areas of interest once.
Findings
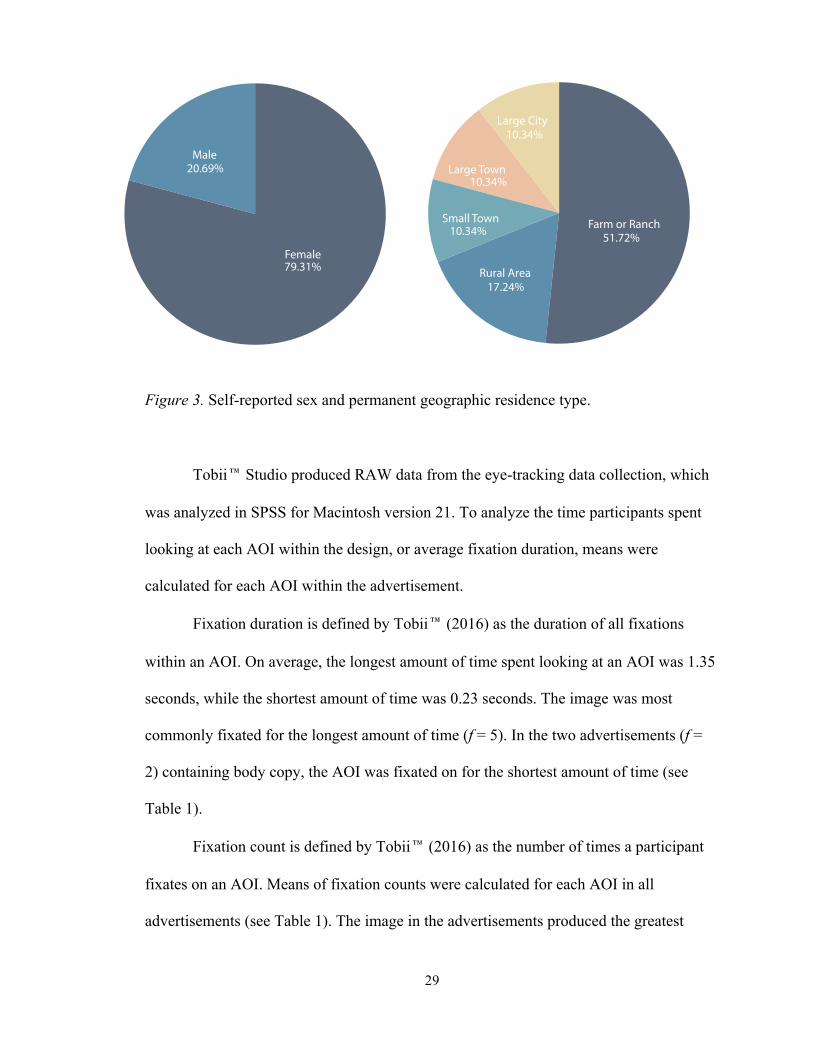
Participants were agricultural communications majors, ranging in age from 19 to
22 years old. Twenty-three (79.31%) of the participants were female and six (20.69%)
were male. Fifteen (51.72%) participants indicated they had no vision issues while 12
(41.38%) said they were nearsighted, one (0.03%) farsighted, and one (0.03%) both
nearsighted and farsighted. Fourteen (100%) participants who stated they did not have
normal vision indicated they wore corrective eyewear to obtain normal vision. Of the 29
participants, 15 (51.72%) of them indicated they lived on a farm or ranch prior to
attending Oklahoma State University (see Figure 3). None (0.00%) of the participants
indicated they were colorblind or had been diagnosed with any other disorder or medical
condition that could possibly affect their vision.
29
Female
Male
Farm or Ranch
Rural Area
Small Town
Large Town
Large City
Female
Male
Farm or Ranch
Rural Area
Small Town
Large Town
Large City
Figure 3. Demographic pie charts for sex and background of participants.
20.69%
51.72%
10.34%
10.34%
10.34%
17.24%
79.31%
Figure 3. Self-reported sex and permanent geographic residence type.
Tobii™ Studio produced RAW data from the eye-tracking data collection, which
was analyzed in SPSS for Macintosh version 21. To analyze the time participants spent
looking at each AOI within the design, or average fixation duration, means were
calculated for each AOI within the advertisement.
Fixation duration is defined by Tobii™ (2016) as the duration of all fixations
within an AOI. On average, the longest amount of time spent looking at an AOI was 1.35
seconds, while the shortest amount of time was 0.23 seconds. The image was most
commonly fixated for the longest amount of time (f = 5). In the two advertisements (f =
2) containing body copy, the AOI was fixated on for the shortest amount of time (see
Table 1).
Fixation count is defined by Tobii™ (2016) as the number of times a participant
fixates on an AOI. Means of fixation counts were calculated for each AOI in all
advertisements (see Table 1). The image in the advertisements produced the greatest
30
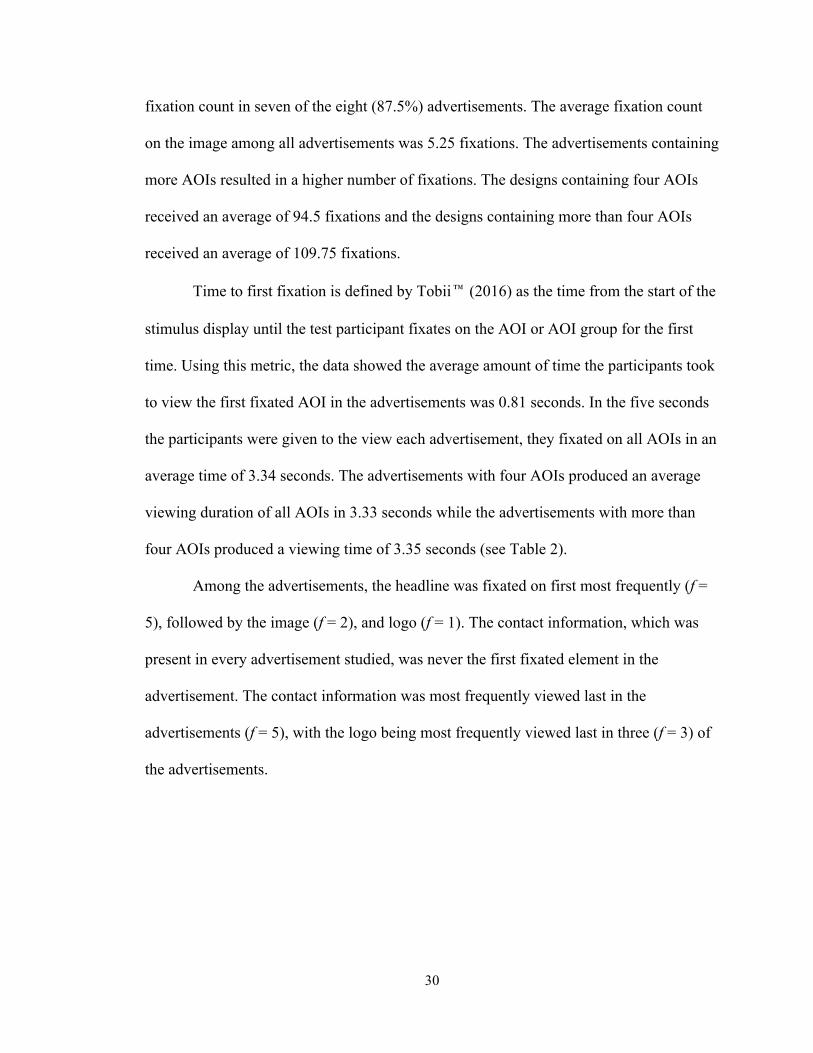
fixation count in seven of the eight (87.5%) advertisements. The average fixation count
on the image among all advertisements was 5.25 fixations. The advertisements containing
more AOIs resulted in a higher number of fixations. The designs containing four AOIs
received an average of 94.5 fixations and the designs containing more than four AOIs
received an average of 109.75 fixations.
Time to first fixation is defined by Tobii™ (2016) as the time from the start of the
stimulus display until the test participant fixates on the AOI or AOI group for the first
time. Using this metric, the data showed the average amount of time the participants took
to view the first fixated AOI in the advertisements was 0.81 seconds. In the five seconds
the participants were given to the view each advertisement, they fixated on all AOIs in an
average time of 3.34 seconds. The advertisements with four AOIs produced an average
viewing duration of all AOIs in 3.33 seconds while the advertisements with more than
four AOIs produced a viewing time of 3.35 seconds (see Table 2).
Among the advertisements, the headline was fixated on first most frequently (f =
5), followed by the image (f = 2), and logo (f = 1). The contact information, which was
present in every advertisement studied, was never the first fixated element in the
advertisement. The contact information was most frequently viewed last in the
advertisements (f = 5), with the logo being most frequently viewed last in three (f = 3) of
the advertisements.
31
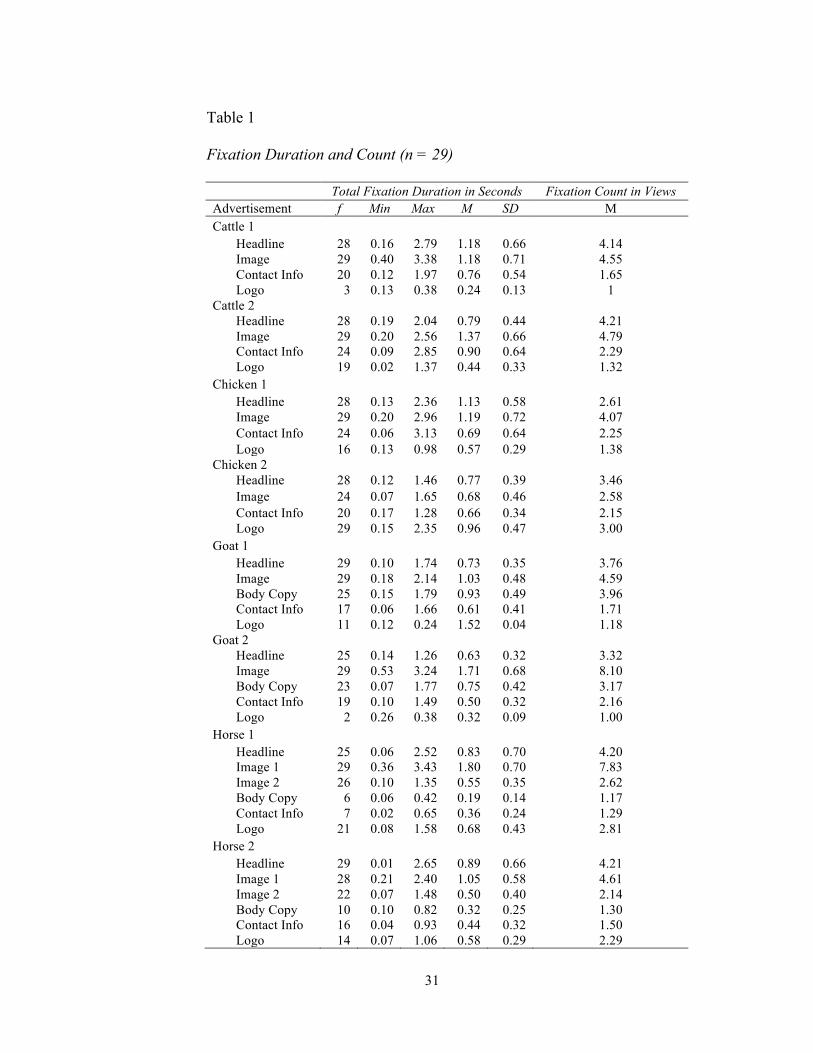
Table 1
Fixation Duration and Count (n = 29)
Total Fixation Duration in Seconds Fixation Count in Views Advertisement f Min Max M SD M Cattle 1
Headline 28 0.16 2.79 1.18 0.66 4.14 Image 29 0.40 3.38 1.18 0.71 4.55 Contact Info 20 0.12 1.97 0.76 0.54 1.65 Logo 3 0.13 0.38 0.24 0.13 1
Cattle 2 Headline 28 0.19 2.04 0.79 0.44 4.21 Image 29 0.20 2.56 1.37 0.66 4.79 Contact Info 24 0.09 2.85 0.90 0.64 2.29 Logo 19 0.02 1.37 0.44 0.33 1.32
Chicken 1 Headline 28 0.13 2.36 1.13 0.58 2.61 Image 29 0.20 2.96 1.19 0.72 4.07 Contact Info 24 0.06 3.13 0.69 0.64 2.25 Logo 16 0.13 0.98 0.57 0.29 1.38
Chicken 2 Headline 28 0.12 1.46 0.77 0.39 3.46 Image 24 0.07 1.65 0.68 0.46 2.58 Contact Info 20 0.17 1.28 0.66 0.34 2.15 Logo 29 0.15 2.35 0.96 0.47 3.00
Goat 1 Headline 29 0.10 1.74 0.73 0.35 3.76 Image 29 0.18 2.14 1.03 0.48 4.59 Body Copy 25 0.15 1.79 0.93 0.49 3.96 Contact Info 17 0.06 1.66 0.61 0.41 1.71 Logo 11 0.12 0.24 1.52 0.04 1.18
Goat 2 Headline 25 0.14 1.26 0.63 0.32 3.32 Image 29 0.53 3.24 1.71 0.68 8.10 Body Copy 23 0.07 1.77 0.75 0.42 3.17 Contact Info 19 0.10 1.49 0.50 0.32 2.16 Logo 2 0.26 0.38 0.32 0.09 1.00
Horse 1 Headline 25 0.06 2.52 0.83 0.70 4.20 Image 1 29 0.36 3.43 1.80 0.70 7.83 Image 2 26 0.10 1.35 0.55 0.35 2.62 Body Copy 6 0.06 0.42 0.19 0.14 1.17 Contact Info 7 0.02 0.65 0.36 0.24 1.29 Logo 21 0.08 1.58 0.68 0.43 2.81
Horse 2 Headline 29 0.01 2.65 0.89 0.66 4.21 Image 1 28 0.21 2.40 1.05 0.58 4.61 Image 2 22 0.07 1.48 0.50 0.40 2.14 Body Copy 10 0.10 0.82 0.32 0.25 1.30 Contact Info 16 0.04 0.93 0.44 0.32 1.50 Logo 14 0.07 1.06 0.58 0.29 2.29
32
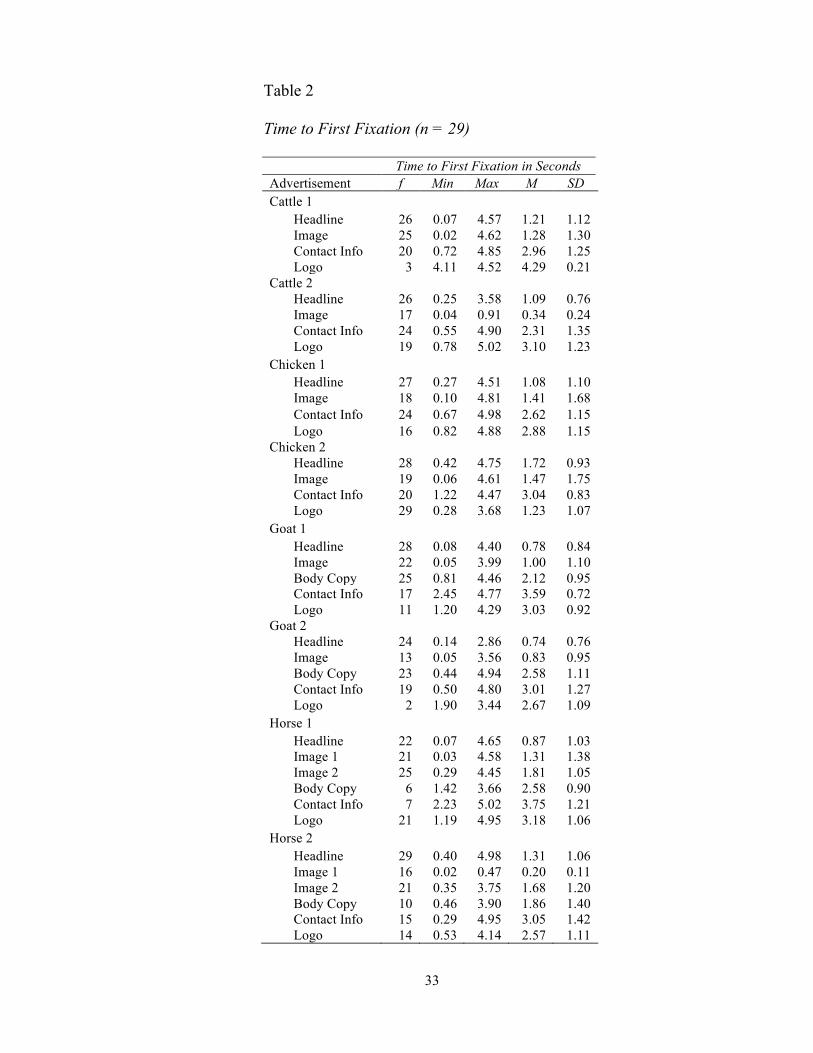
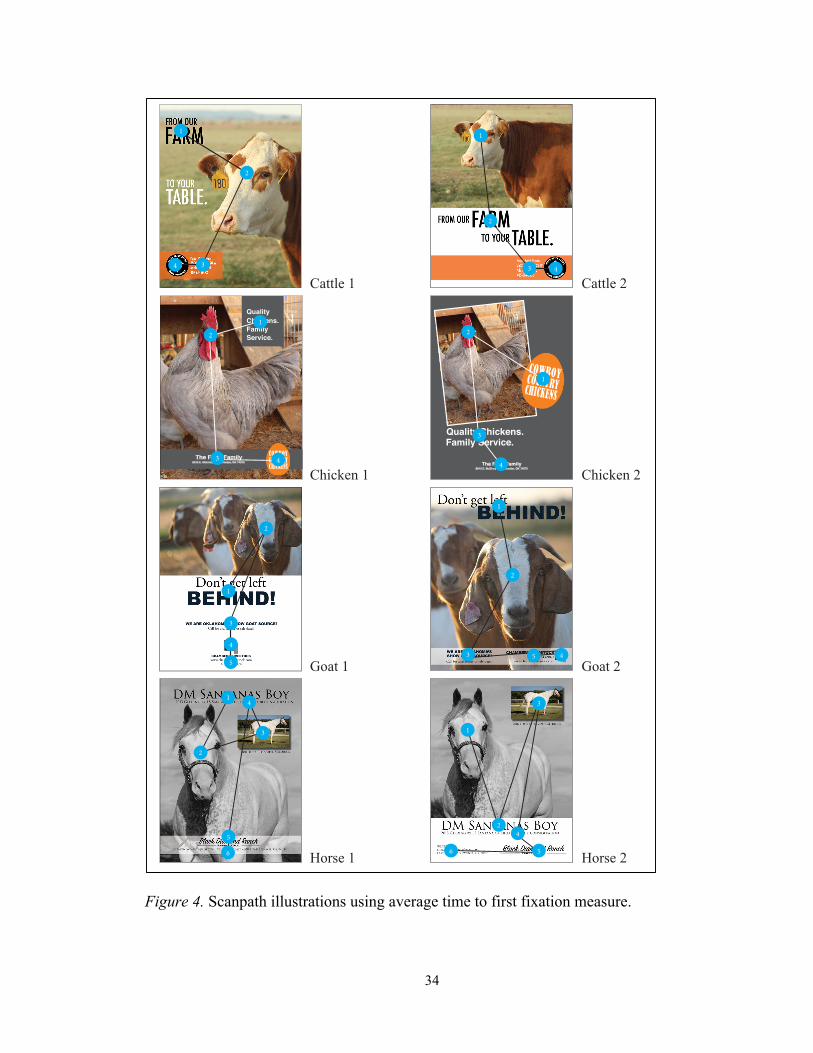
The average time to first fixation measurements for each advertisement also were
used to determine common scanpaths followed by the viewers. The average times to first
fixation were ordered from shortest amount of time to longest amount of time. The
researcher then created illustrations to depict the most frequent scanpath on each
advertisement (see Figure 4). Analyzed qualitatively by the researcher, the scanpath
illustrations depict a primary viewing pattern of top to bottom. The placement of the
AOIs on each individual advertisement, show trends in viewing. When the contact
information was placed on the bottom-left region of the page and the logo on the bottom-
right region, the logo was viewed first and then the viewer looked to the left at the contact
information. In the advertisements with one AOI or AOI group along the bottom of the
advertisement, it was most commonly viewed last. In the advertisement where the logo
was placed on the left side of the page, the logo was seen only by three (f = 3;10.35%)
participants.
33
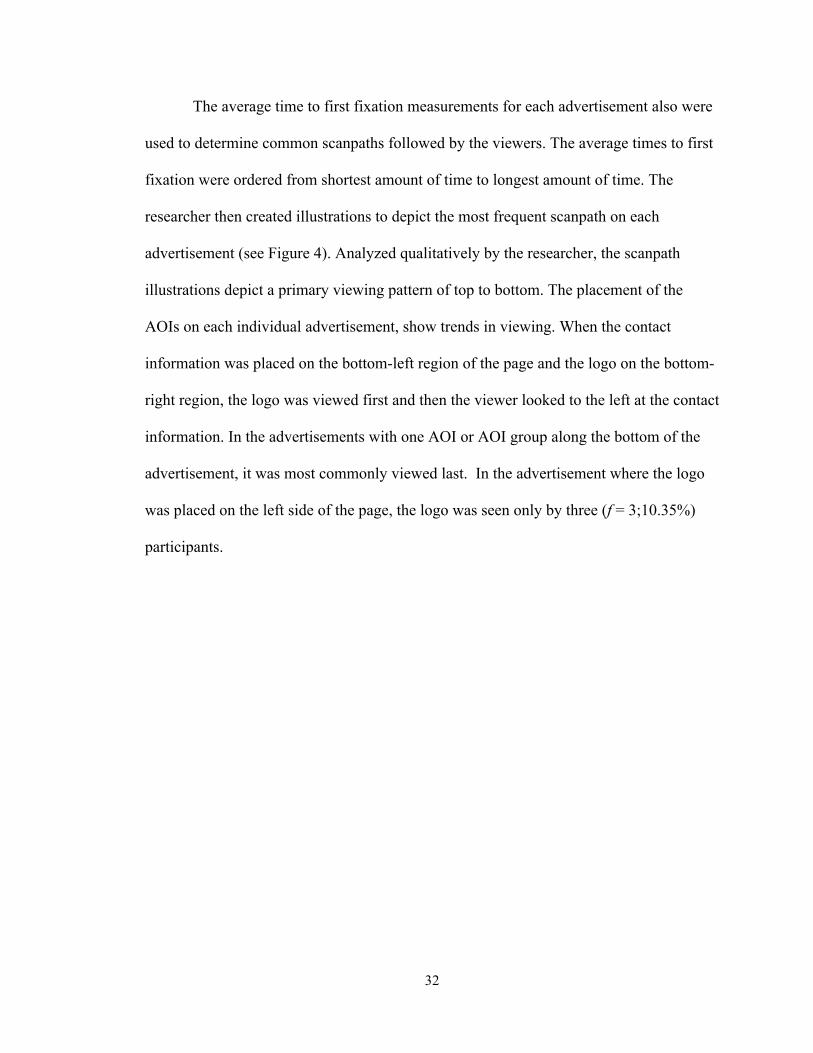
Table 2
Time to First Fixation (n = 29)
Time to First Fixation in Seconds Advertisement f Min Max M SD Cattle 1
Headline 26 0.07 4.57 1.21 1.12 Image 25 0.02 4.62 1.28 1.30 Contact Info 20 0.72 4.85 2.96 1.25 Logo 3 4.11 4.52 4.29 0.21
Cattle 2 Headline 26 0.25 3.58 1.09 0.76 Image 17 0.04 0.91 0.34 0.24 Contact Info 24 0.55 4.90 2.31 1.35 Logo 19 0.78 5.02 3.10 1.23
Chicken 1 Headline 27 0.27 4.51 1.08 1.10 Image 18 0.10 4.81 1.41 1.68 Contact Info 24 0.67 4.98 2.62 1.15 Logo 16 0.82 4.88 2.88 1.15
Chicken 2 Headline 28 0.42 4.75 1.72 0.93 Image 19 0.06 4.61 1.47 1.75 Contact Info 20 1.22 4.47 3.04 0.83 Logo 29 0.28 3.68 1.23 1.07
Goat 1 Headline 28 0.08 4.40 0.78 0.84 Image 22 0.05 3.99 1.00 1.10 Body Copy 25 0.81 4.46 2.12 0.95 Contact Info 17 2.45 4.77 3.59 0.72 Logo 11 1.20 4.29 3.03 0.92
Goat 2 Headline 24 0.14 2.86 0.74 0.76 Image 13 0.05 3.56 0.83 0.95 Body Copy 23 0.44 4.94 2.58 1.11 Contact Info 19 0.50 4.80 3.01 1.27 Logo 2 1.90 3.44 2.67 1.09
Horse 1 Headline 22 0.07 4.65 0.87 1.03 Image 1 21 0.03 4.58 1.31 1.38 Image 2 25 0.29 4.45 1.81 1.05 Body Copy 6 1.42 3.66 2.58 0.90 Contact Info 7 2.23 5.02 3.75 1.21 Logo 21 1.19 4.95 3.18 1.06
Horse 2 Headline 29 0.40 4.98 1.31 1.06 Image 1 16 0.02 0.47 0.20 0.11 Image 2 21 0.35 3.75 1.68 1.20 Body Copy 10 0.46 3.90 1.86 1.40 Contact Info 15 0.29 4.95 3.05 1.42 Logo 14 0.53 4.14 2.57 1.11
34
Figure 4. Scanpath illustrations using average time to first fixation measure.
1
2
34
1
2
3 4
1
2
3
4
6 5
1
2
3 4
1
2
3
4
1
2
3
4
5
1
2
3 45
1
2
3
4
6
5
Cattle 1
Chicken 1
Goat 1
Horse 1
Cattle 2
Chicken 2
Goat 2
Horse 2
Figure 4. Scanpath Illustrations
35
Conclusions and Recommendations
The typical viewer in this study was a 20-year-old female studying agricultural
communications who grew up on a farm or ranch. She had normal vision or wore
corrective eyewear to obtain normal vision and did not have any medical conditions that
affected her vision.
The average amount of time it took participants to view all AOIs in the
advertisement was less than four seconds. Therefore, this finding suggests that five
seconds is more than adequate time for viewers to look at an advertisement with similar
technical design specifications to the sample stimuli. This fixation time of all AOIs on the
advertisements was slightly higher than previous studies (Pieters & Wedel 2004; Pieters
et al. 2010), which found the time to be around two seconds. Nonetheless, this finding
can still provide insight to designers with the evidence that they have a short amount of
the time to attract attention and deliver a message to a viewer through a print
advertisement.
Contradicting the findings of Radach (2003), participants did not take more time
to view the more complex advertisements in this study. However, Radach (2003)
concluded controlling the amount of time the viewers can see the advertisement may
affect fixation duration and influence scanpaths.
The viewing patterns most commonly followed by participants were from the top
of the advertisement to the bottom of the advertisement, which correlates with the typical
scanpath among the western culture (Hooge & Camps, 2013). The data from this study
also shows when the logo was placed on the left side of the page, it was only viewed by
36
three participants. However, research has shown the nature of a task given to viewers can
influence the duration of each fixation and scanpath (Rayner & Castelhano, 2008).
The headline was most commonly fixated first in all of the advertisements,
followed by the image, then the logo, and, lastly, the contact information. Rayner et al.
(2001) observed this same scanpath behavior, with the headline being the most common
first fixation, in their study of advertisements. Rayner et al. (2001) also concluded the
larger text was viewed first regardless of where it was positioned on the page.
The image in the advertisements most frequently had the longest fixation
duration. The AOIs with the most importance to the viewer are fixated on longer than the
AOIs less important to the viewer (Christianson et al, 1991). To determine the
importance of each AOI to the viewer, a specific task would have to be implemented.
The two advertisements with six AOIs produced the shortest fixation duration on the
body copy AOI. Knowing the body text was smaller than other text on the
advertisements, the data contradicts with Rayner & Castelhanno (2008), stating fixation
duration increases as text becomes more difficult to read. This short fixation duration
could also be credited to its size on the page or relevance to the viewer (Christianson et
al, 1991).
The image in the advertisements produced the highest fixation count in seven of
the eight advertisements tested. It is assumed the fixation count correlates with the
amount of information a viewer obtains from an advertisement (Wedel & Pieters, 2000),
concluding the viewers will most likely remember the most about the image. To
generalize more about the fixation counts, fixations would need to be analyzed in
relevance to the surface area each AOI takes up in the overall design. The advertisements
37
containing more AOIs resulted in a higher number of fixations, suggesting more complex
advertisements may receive a greater number of overall fixations.
Recommendations for Future Research
Limitations of this study can lead to opportunities for future research. First, the
participants all had the commonality of college major and fit within a small age range –
19 to 22 years old. This limitation could be avoided in future studies by recruiting a
larger, more diverse population. It would also be interesting to see what differences in
scanpaths and fixations occur among a diverse population of men and women and
participants within a wider age range. Does advertisement viewing differ between men
vs. women and children vs. adults? Even without knowing the answer to this specific
question, we can recommend designers should always formulate an advertisement for the
audience it is meant to reach.
Another limitation was the use of computer monitors to display advertisements
intended for printed media. Future studies on this topic could use a head-mounted eye-
tracking device and advertisements physically printed in a publication to compare
advertisement observation behaviors. By creating advertisement pairs with the same
elements and presenting them in order by pair, this study is also limited by an order
effect, which in future eye-tracking scripts could be counterbalanced. Counterbalancing
can be achieved by the use of Latin squares (Zeelenber & Pecher, 2015) and is a common
technique used to avoid order effect. Zeelenberg and Pecher (2015) recommend
counterbalancing to increase the control over sequential effects.
To better understand the relation of headline, image, copy and logo to visual
attention, future research could include comparison with the surface size of the elements.
38
To aid in determining visual recall, a post eye-tracking survey could be conducted to
identify what elements or message the participants remembered from the advertisements.
A goal-oriented study could be beneficial to research by assigning different tasks
to the viewers for each advertisement or group of advertisements, the level of information
transfer can better be understood (Pieters & Wedel, 2007).
Recommendations for Practice
Since this study concluded on average all AOIs were fixated before the five
second time limit was exceeded, how can graphic designers grab viewers’ attention and
deliver a message in less than five seconds? By including “attention-getting” and also
“attention-holding” elements in designs to maintain consumer’s attention for at least two
seconds, the chances of memorability increase (Percy & Rossiter, 1983).
Humans are creatures of habit, which leads us to expect they typically view
advertisements similarly to how they read – top to bottom and left to right (Hooge &
Camps, 2013). Rayner et al. (2001) found the reading behavior to be left to right as
expected, however, it was determined that the viewers didn’t always read all of the text.
Rayner et al. concluded this could be due to the fact the viewers believed they had
already had the information they needed to understand the message of the advertisement.
By adding an AOI of body text to designs, more research can be done on the reading of
text in advertisements. Also, aware of this finding, graphic designers should be mindful
of the size of the headline compared to body text to differentiate the two.
The evidence from this study shows the logo loses attraction when placed on the
bottom left of the page which, is something designers should take into consideration.
Contradicting recommendations for having the logo placed relatively small at the bottom
39
of the page, Pieters & Wedel (2004) found increasing the size of the logo does not create
a negative effect on attention to the advertisement as a whole.
A headline is commonly fixated first by viewers, which creates a need for
effective headlines. Ogilvy (1963, p. 104) even went as far to say the headline is crucial
to print advertisements and “the wickedest of all sins is to run an advertisement without a
headline.”
Summary
The data obtained from eye-tracking technology can lead to innovative
discoveries for the advertising industry (Duchowski, 2017). This research can lend
knowledge to designers for future reference of where certain elements should be placed
on the page and what elements should be emphasized to best suit the audience. This
information also can provide insight to designers about the amount of time they have to
capture a viewer’s attention through an advertisement design. This finding also coincides
with research conducted by Pieters et al. (2010).
With this study being the first one of its kind pertaining to print advertisements in
the animal agriculture industry, several ways exist for this topic to be further explored.
Because of the abundance of metrics provided by eye-tracking software, this study could
be replicated with several different modifications and produce unique results.
40
CHAPTER IV
MANUSCRIPT II
Abstract
The key elements of print advertisements play an important role in capturing
consumers attention. By providing evidence of human eye-movements when looking at
print advertisements, graphic designers can better understand what layouts and content
can most effectively communicate the message to the audience. But, do graphic designers
view advertisements differently than viewers with little to no graphic design knowledge?
The findings from this study reveal no significant difference exists in how viewers look at
advertisements before and after being exposed to a graphic design course. However, an
observed difference occurs in advertisements with gaze-guiding properties.
Introduction
In today’s society, people are exposed to hundreds of advertisements every day –
around 600 to be exact, according to a study conducted by Media Matters (2007). So,
what exactly do those consumers see when they look at these advertisements, and do they
look at them differently than the designer who created them?
41
Throughout the last decade, eye-tracking research has flourished (Duchowski,
2017). With the society becoming technology driven, eye-tracking can be a useful tool
for researchers to look into different phenomena, including print advertisements
(Duchowski, 2017). Corporations are known to use eye-tracking to determine the most
effective way to present advertisements to consumers, but this information is not
commonly shared with the public (Duchowski, 2017).
Graphic design textbooks used today, like Martin & Hannington (2012) and
Graham (2005), depict the key elements designers should be trained to use effectively,
such as lines, shapes, color, and texture. Graham (2005) suggests graphic designers
should pay close attention to the principles of design and incorporate them into their work
and overall should base their design around the interests of the audience, not themselves.
Wedel et al. (2008) determined average viewers tend to look at design products by
skimming certain areas while looking for the information they want to get from the
advertisement. Viewers typically do not recognize the relationship among the elements
used in the design process (Wedel et al., 2008).
Therefore, the objectives guiding this study are as follows:
1. Determine information transfer (scanpath entropy) of AOIs when students view
advertisements prior to an introductory graphic design course.
2. Determine information transfer (scanpath entropy) of AOIs when students view
advertisements after experiencing an introductory graphic design course.
3. Compare the information transfer (scanpath entropy) of AOIs when students view
advertisements before and after exposure to an introductory graphic design
course.
42
According to Morgan and Rucker (2013), layout and design skills are expected of
graduates wishing to pursue a career in the agricultural communications field. To aid in
preparing students for this demand, collegiate agricultural communications programs
across the United States are providing courses in introductory graphic design (Cannon,
Specht, & Buck, 2014). The main projects assigned to students in this course are to
design a logo, an infographic, an identity package containing a business card and one
other branding type item, two advertisements, a brochure, a newsletter, and a magazine
layout (Sitton, 2017a).
For this particular study, the researchers focused on the implementation of
principles of graphic design, advertisement design, and curriculum. The principles of
design emphasized to students in the course were (a) appropriateness, (b) balance, (c)
consistency, and (d) focus and flow (Sitton, 2017b). These principles were communicated
to the class through PowerPoint Presentations and general lecture. According to Graham
(2005), principles of graphic design should always be taken into consideration.
Furthermore, designers can improve their work by understanding the principles of design
and applying them to their compositions (Graham, 2005). As stated in the text required
for the course, the terminology for the principles of design can vary but the outcome is
the same – success in design (Gonnella, Navetta, & Friedman, 2015).
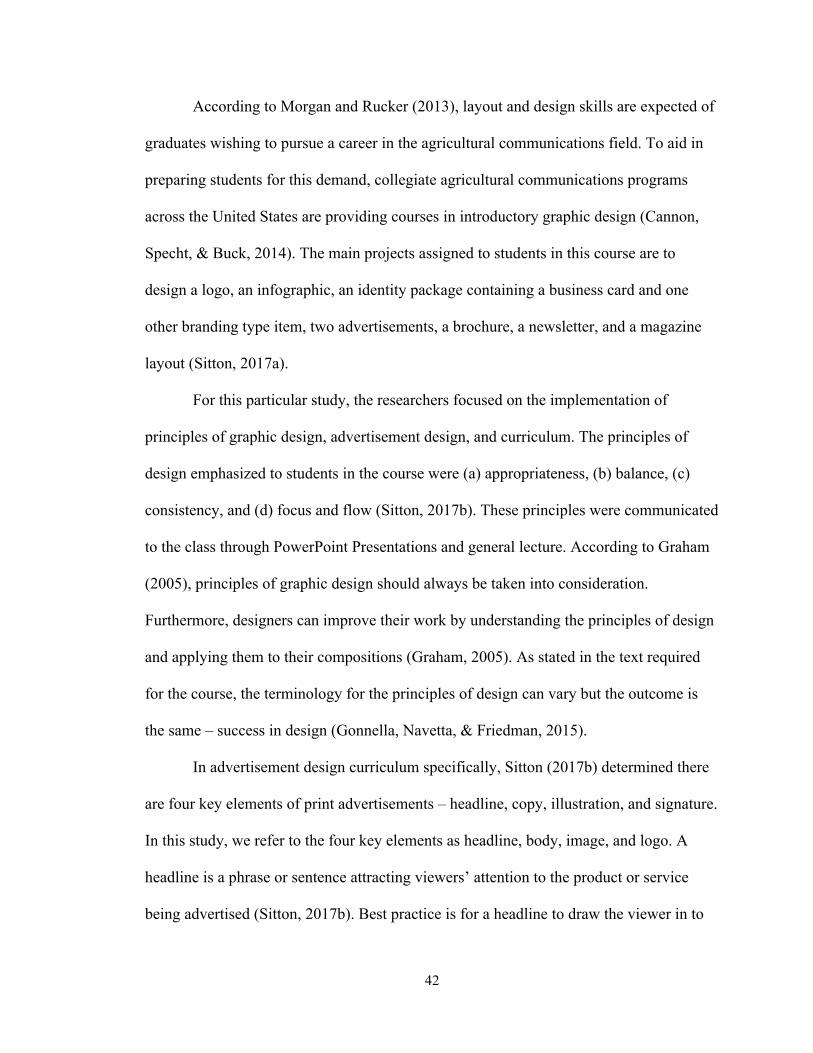
In advertisement design curriculum specifically, Sitton (2017b) determined there
are four key elements of print advertisements – headline, copy, illustration, and signature.
In this study, we refer to the four key elements as headline, body, image, and logo. A
headline is a phrase or sentence attracting viewers’ attention to the product or service
being advertised (Sitton, 2017b). Best practice is for a headline to draw the viewer in to
43
look at the illustration and then read the copy (Sitton, 2017b). An illustration in an
advertisement, such as an image or graphic, should attract and maintain the viewers’
attention (Sitton, 2017b).
Another key concept to expose novice graphic designers to is the Gestalt theory
(Graham, 2005). The idea of Gestalt explains how the human brain organizes a whole
that is different from the sum of the parts (Wageman et al., 2012). In graphic design,
Gestalt principles can be implemented to create emphasis, closure, proximity, etc. (Sitton,
2017c). The human brain is trained to “fill in the gaps” when something is not complete
and ultimately organizes elements as a coherent whole (Gonnella et al., 2015). For
designers, principles of Gestalt theory can be used to unify their designs (Graham, 2005).
More recently Yarbus’ (1967) and Noton and Starks’ (1971) research has contradicted the
Gestalt view, but nonetheless should still be discussed as an important asset to design
(Duchowski, 2017).
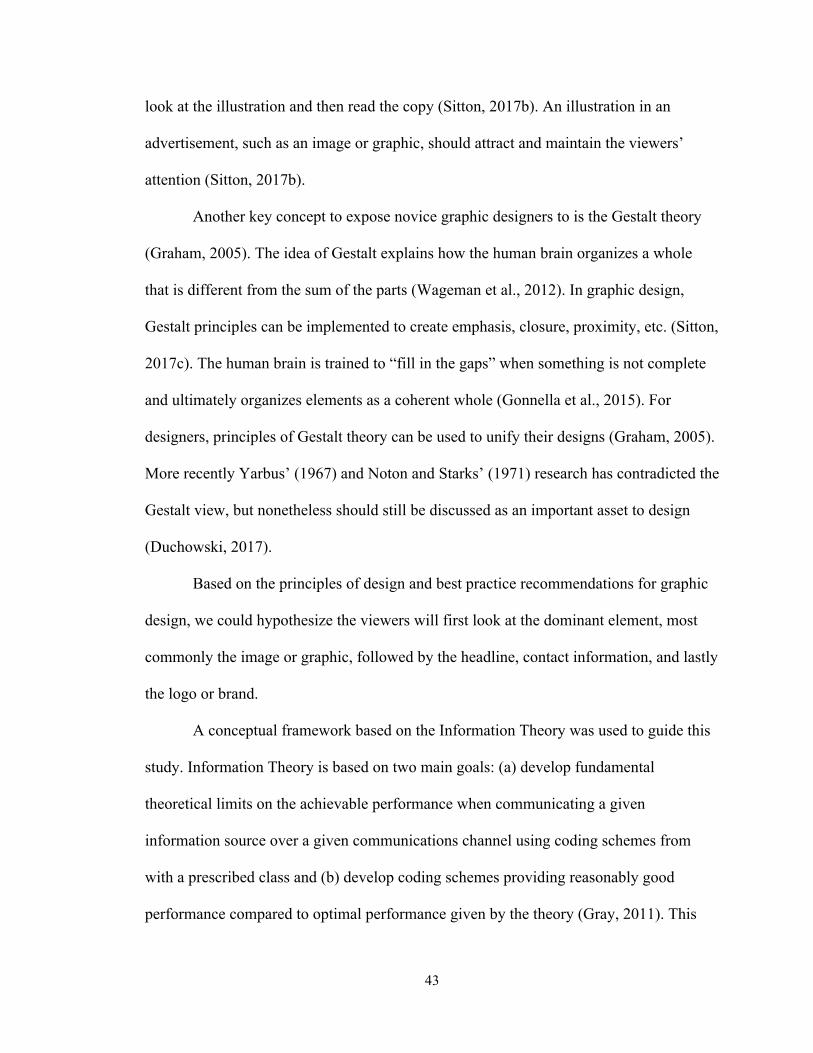
Based on the principles of design and best practice recommendations for graphic
design, we could hypothesize the viewers will first look at the dominant element, most
commonly the image or graphic, followed by the headline, contact information, and lastly
the logo or brand.
A conceptual framework based on the Information Theory was used to guide this
study. Information Theory is based on two main goals: (a) develop fundamental
theoretical limits on the achievable performance when communicating a given
information source over a given communications channel using coding schemes from
with a prescribed class and (b) develop coding schemes providing reasonably good
performance compared to optimal performance given by the theory (Gray, 2011). This
44
mathematical theory was devised by Shannon’s concept of entropy of random variables.
Gray (2011) defines entropy as the relevance to a single random variable or random
vector.
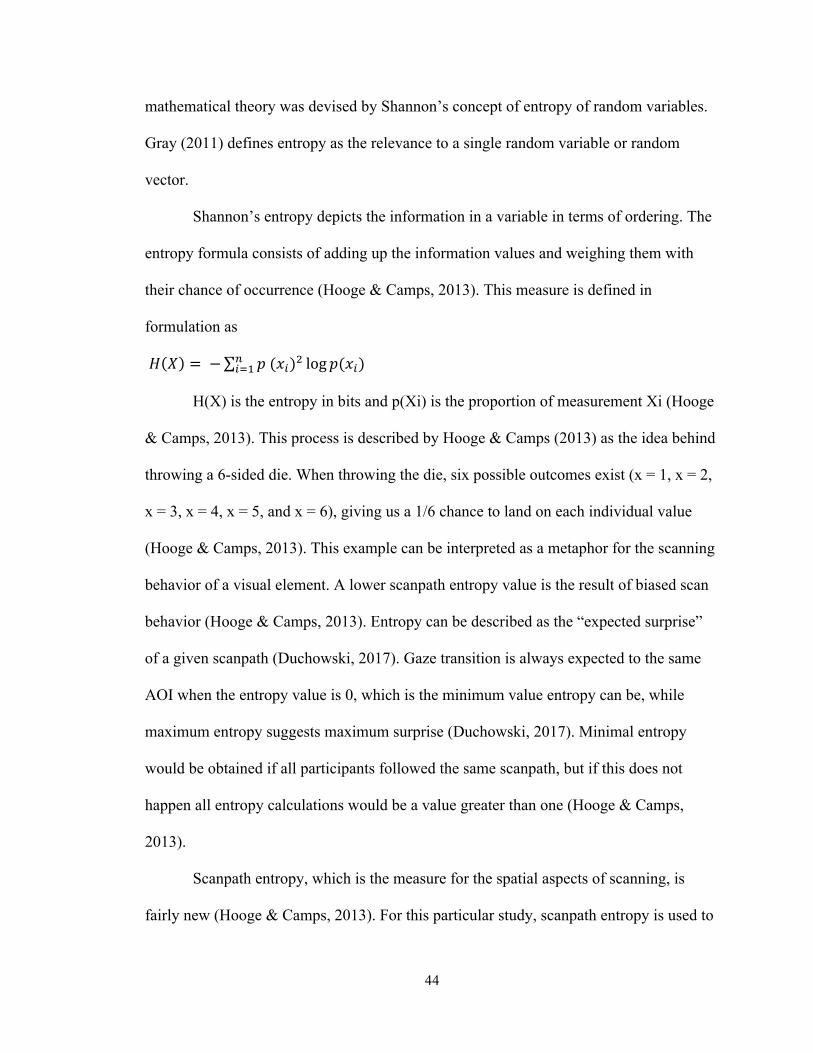
Shannon’s entropy depicts the information in a variable in terms of ordering. The
entropy formula consists of adding up the information values and weighing them with
their chance of occurrence (Hooge & Camps, 2013). This measure is defined in
formulation as
𝐻 𝑋 =− 𝑝(𝑥")+ log 𝑝(𝑥")/"01
H(X) is the entropy in bits and p(Xi) is the proportion of measurement Xi (Hooge
& Camps, 2013). This process is described by Hooge & Camps (2013) as the idea behind
throwing a 6-sided die. When throwing the die, six possible outcomes exist (x = 1, x = 2,
x = 3, x = 4, x = 5, and x = 6), giving us a 1/6 chance to land on each individual value
(Hooge & Camps, 2013). This example can be interpreted as a metaphor for the scanning
behavior of a visual element. A lower scanpath entropy value is the result of biased scan
behavior (Hooge & Camps, 2013). Entropy can be described as the “expected surprise”
of a given scanpath (Duchowski, 2017). Gaze transition is always expected to the same
AOI when the entropy value is 0, which is the minimum value entropy can be, while
maximum entropy suggests maximum surprise (Duchowski, 2017). Minimal entropy
would be obtained if all participants followed the same scanpath, but if this does not
happen all entropy calculations would be a value greater than one (Hooge & Camps,
2013).
Scanpath entropy, which is the measure for the spatial aspects of scanning, is
fairly new (Hooge & Camps, 2013). For this particular study, scanpath entropy is used to
45
quantify gaze guidance of the participants. Gaze guidance can be created in an
advertisement by subtle visual cues (McNamara, Bailey, & Grimm, 2009). Traditionally,
advertisements are designed with the branding element in the bottom right corner of the
composition, which figuratively is meant to act as a signature for the design (Hooge &
Camps, 2013). This traditional composition arrangement has been hypothesized to attract
more attention to the logo (Hooge & Camps, 2013). McNamara et al. (2009) found subtle
visual cues can effectively lead to fixations through gaze guidance. For example,
Mackworth and Morandi (1967) determined humans are naturally attracted to faces in
images. Images containing visually significant elements, such as faces, produce longer
fixation times and aid in determining the viewers gaze (Bailey et al., 2009). With this
knowledge of the research conducted on gaze guidance, we can hypothesize that
scanpaths among different viewers can be determined by visual elements containing
gaze-guiding properties. Also, if gaze guidance is effective, scanpaths of individual
viewers should be somewhat similar. Hooge and Camps (2013) found advertisements
without gaze guiding properties resulted in several different scanpaths and produced
maximal entropy. The advertisements designed with gaze guidance properties produced
less scanpaths and a lower entropy.
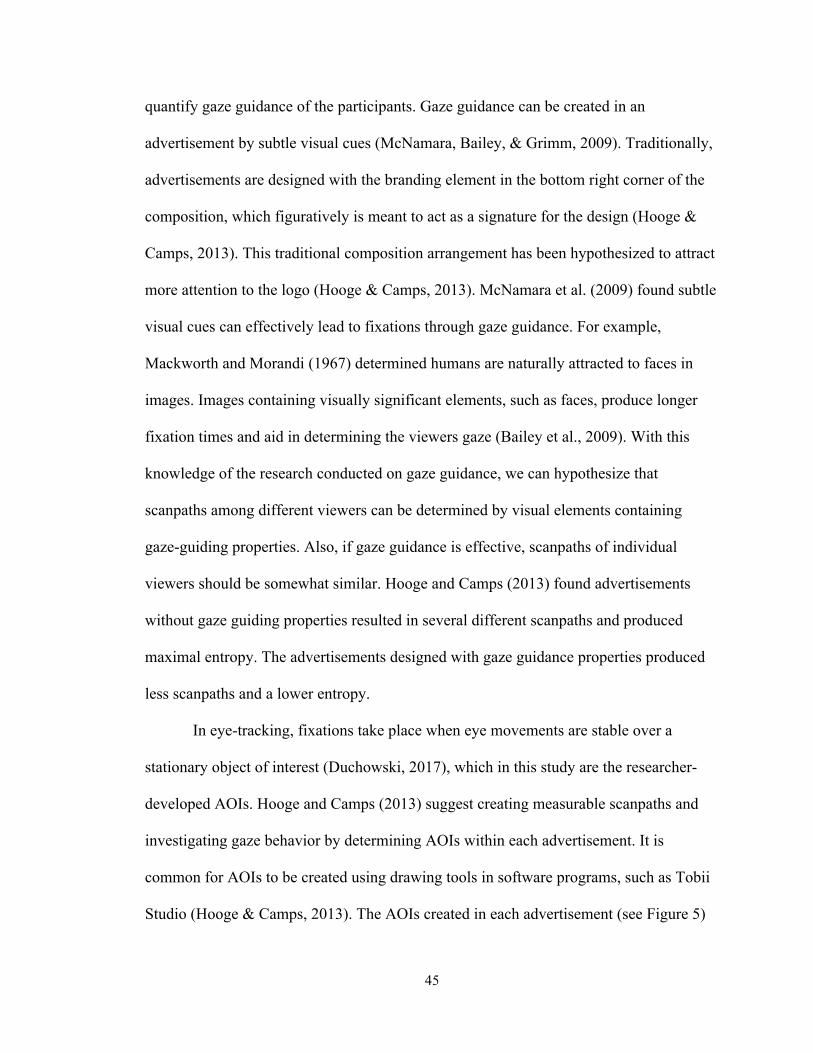
In eye-tracking, fixations take place when eye movements are stable over a
stationary object of interest (Duchowski, 2017), which in this study are the researcher-
developed AOIs. Hooge and Camps (2013) suggest creating measurable scanpaths and
investigating gaze behavior by determining AOIs within each advertisement. It is
common for AOIs to be created using drawing tools in software programs, such as Tobii
Studio (Hooge & Camps, 2013). The AOIs created in each advertisement (see Figure 5)
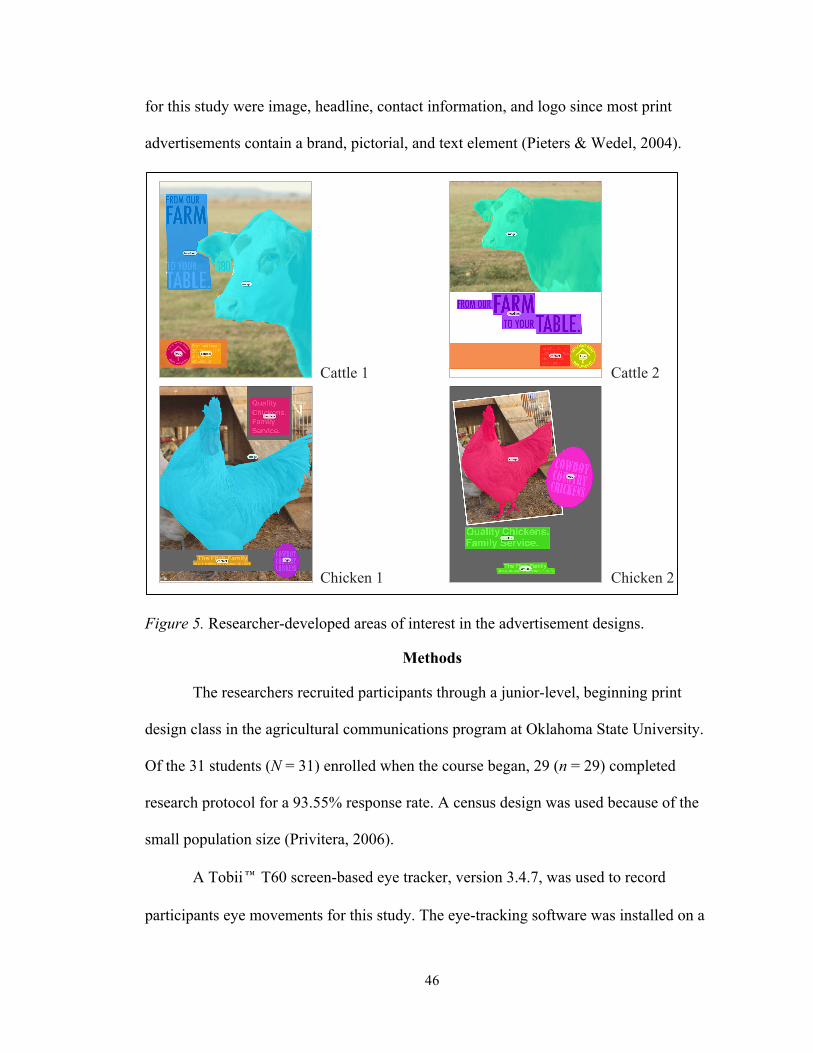
46
for this study were image, headline, contact information, and logo since most print
advertisements contain a brand, pictorial, and text element (Pieters & Wedel, 2004).
Figure 5. Researcher-developed areas of interest in the advertisement designs.
Methods
The researchers recruited participants through a junior-level, beginning print
design class in the agricultural communications program at Oklahoma State University.
Of the 31 students (N = 31) enrolled when the course began, 29 (n = 29) completed
research protocol for a 93.55% response rate. A census design was used because of the
small population size (Privitera, 2006).
A Tobii™ T60 screen-based eye tracker, version 3.4.7, was used to record
participants eye movements for this study. The eye-tracking software was installed on a
Cattle 1
Chicken 1
Cattle 2
Chicken 2
Figure 5. Areas of interest created by the reseacher in Tobii™ Studio.
47
Macintosh computer located in an on-campus laboratory controlled for light and
temperature. The eye-tracking device operated binocularly at 60 Hz at an accuracy of
about 0.5° (Tobii™, 2016). As with most eye-tracking devices, the table-mounted
machine used for this study produced instantaneous (x, y) coordinates of the viewer’s
gaze.
Participants viewed four unpublished advertisements based on animal agriculture
for this study. Two of the advertisements contained an image of a cow, and the other two
contained an image of a chicken. Variations of slightly different advertisements were
created for each animal species to help lead to a thorough comparison of gaze behavior as
suggested by Hooge and Camps (2013). All four of the advertisements were presented in
full color. The four advertisements used in this study met the following criteria:
1. The ad contained an image depicting animal agriculture.
2. The ad contained a headline.
3. The ad contained contact information.
4. The ad contained a logo to represent the company.
To most closely depict an advertisement viewers would routinely see in a print
publication, the advertisements were presented on the screen at approximately 8.5” x 11”.
As a recommendation from eye-tracking methodology literature (Duchowski, 2017),
sources not connected to this study reviewed the four advertisements for face and content
validity where they verified the designs portrayed advertisements being published in
print. Participants were recruited, offered the chance to consent, and were then asked to
complete a questionnaire on the first day of their introductory graphic design course. This
researcher-developed questionnaire was used to collect information about the population.
48
These completed questionnaires were stored in a locked cabinet not accessible by the
researchers until the completion of the course.
For the second part of the study, each participant was individually eye-tracked by
one researcher. Each participant entered his or her name into the eye-tracking software,
and the researcher instructed each participant on how to calibrate their eyes to the
machine. Upon completion of the calibration, instructions were given to the participants
to “look at the ads as if they were looking at them in a magazine,” which was similar to
the instructions given in Pieters & Wedel (2004).
The four advertisements appeared separately on the screen for five seconds and
were followed by a blank black screen that appeared for three seconds. Participants did
not have to click or push any buttons throughout the eye-tracking experience.
Participants then were exposed to a semester-long introductory graphic design
course. Objectives for this course as highlighted in the course syllabus were to expose
students to the understanding of publication design, including layout, content, and
typography (Sitton, 2017a). Upon completion of the course, students were expected to be
able to demonstrate knowledge of desktop publishing, photo and graphic editing, and
prepress preparation (Sitton, 2017a).
During the final week of the course, participants completed the eye-tracking
exercise again. The post-test for this study was a replica of the pre-test and was
conducted by the same researcher in the same light and temperature-controlled on-
campus computer laboratory.
The following steps were used to compute the scanpath entropy of the four AOIs
created in the advertisements.
49
(1) Produced AOIs of each individual advertisement. (2) Analyzed each scanpath
playback to create a character string. The AOI character string was determined using a
coding system where I represented image, H represented headline, C represented contact,
and L represented logo. (3) Removed all repeated AOIs in the character string leaving no
more than four AOIs in each character string. For example: A character string of
IIHCLCH becomes IHCL after removing repetitions. This process involves converting
the character string from a fixation-based sequence to a dwell-based sequence (Holmqvist
et al., 2011). (4) Calculated the number of unique scan paths. (5) Applied the entropy
formula to compute entropy using Shannon’s entropy formula.
It is common for scanpath entropy to measure only the gaze guidance to one AOI
(Hooge & Camps, 2013), such as the logo, but for this particular study the scanpath
entropy was computed for all four of the AOIs. To determine if the scanpath entropy was
high or low, Hooge & Camps (2013) suggest comparing the scanpath entropy
calculations to the minimum (0.000) and maximum (0.374) entropy possible.
The use of a convenience sample created a limitation for this study. The
participants all possessed similar characteristics including age and college major. A
larger, more diverse population could be recruited to avoid this limitation in future
research. A testing effect also has to be discussed as a limitation since the participants
were exposed to the same advertisements for both the pre- and post-test. A threat to
internal validity also exists in this study because the study does not include a non-
treatment control group for comparison.
One limitation of the eye-tracking apparatus is it was not validated with a second
calibration method. As recommended by Duchowski (2017), it is best practice to
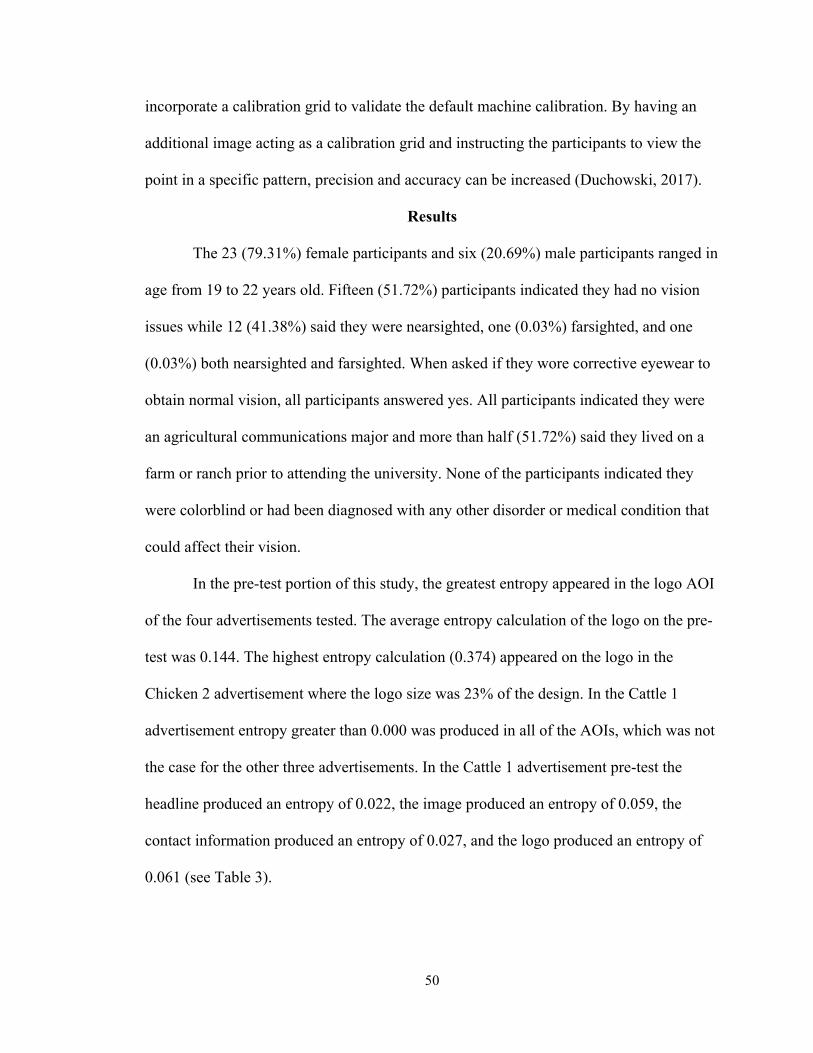
50
incorporate a calibration grid to validate the default machine calibration. By having an
additional image acting as a calibration grid and instructing the participants to view the
point in a specific pattern, precision and accuracy can be increased (Duchowski, 2017).
Results
The 23 (79.31%) female participants and six (20.69%) male participants ranged in
age from 19 to 22 years old. Fifteen (51.72%) participants indicated they had no vision
issues while 12 (41.38%) said they were nearsighted, one (0.03%) farsighted, and one
(0.03%) both nearsighted and farsighted. When asked if they wore corrective eyewear to
obtain normal vision, all participants answered yes. All participants indicated they were
an agricultural communications major and more than half (51.72%) said they lived on a
farm or ranch prior to attending the university. None of the participants indicated they
were colorblind or had been diagnosed with any other disorder or medical condition that
could affect their vision.
In the pre-test portion of this study, the greatest entropy appeared in the logo AOI
of the four advertisements tested. The average entropy calculation of the logo on the pre-
test was 0.144. The highest entropy calculation (0.374) appeared on the logo in the
Chicken 2 advertisement where the logo size was 23% of the design. In the Cattle 1
advertisement entropy greater than 0.000 was produced in all of the AOIs, which was not
the case for the other three advertisements. In the Cattle 1 advertisement pre-test the
headline produced an entropy of 0.022, the image produced an entropy of 0.059, the
contact information produced an entropy of 0.027, and the logo produced an entropy of
0.061 (see Table 3).
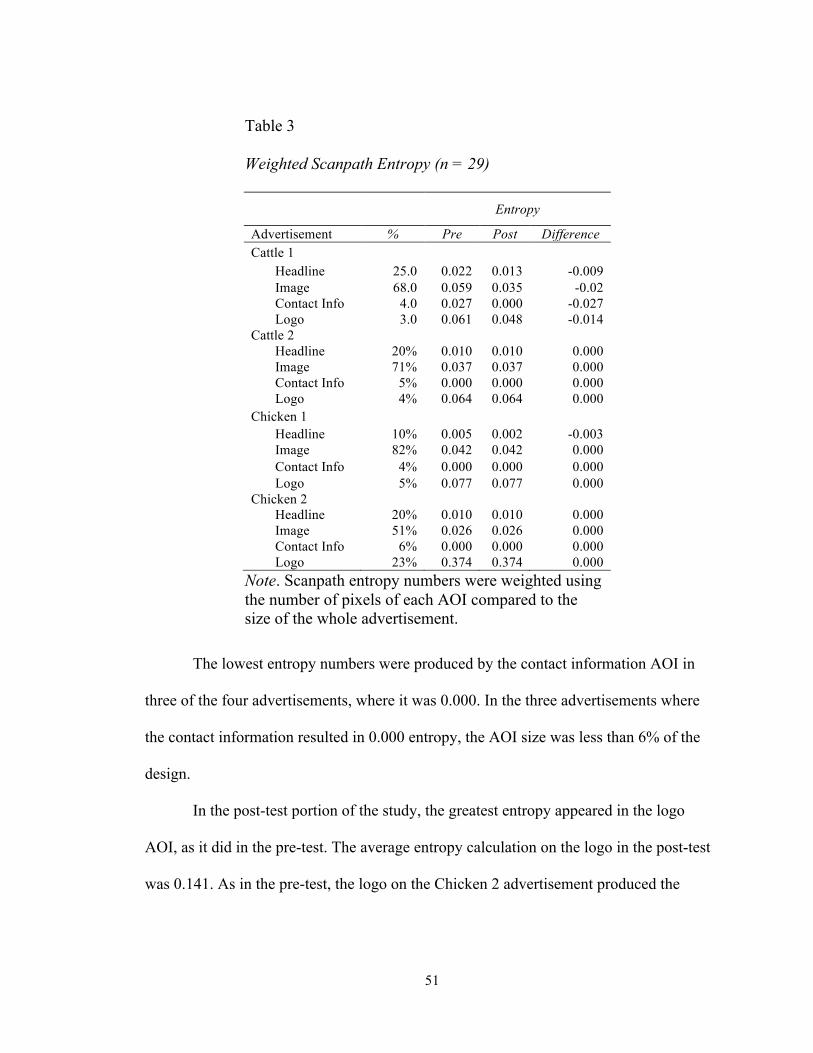
51
The lowest entropy numbers were produced by the contact information AOI in
three of the four advertisements, where it was 0.000. In the three advertisements where
the contact information resulted in 0.000 entropy, the AOI size was less than 6% of the
design.
In the post-test portion of the study, the greatest entropy appeared in the logo
AOI, as it did in the pre-test. The average entropy calculation on the logo in the post-test
was 0.141. As in the pre-test, the logo on the Chicken 2 advertisement produced the
Table 3
Weighted Scanpath Entropy (n = 29)
Entropy
Advertisement % Pre Post Difference Cattle 1
Headline 25.0 0.022 0.013 -0.009 Image 68.0 0.059 0.035 -0.02 Contact Info 4.0 0.027 0.000 -0.027 Logo 3.0 0.061 0.048 -0.014
Cattle 2 Headline 20% 0.010 0.010 0.000 Image 71% 0.037 0.037 0.000 Contact Info 5% 0.000 0.000 0.000 Logo 4% 0.064 0.064 0.000
Chicken 1 Headline 10% 0.005 0.002 -0.003 Image 82% 0.042 0.042 0.000 Contact Info 4% 0.000 0.000 0.000 Logo 5% 0.077 0.077 0.000
Chicken 2 Headline 20% 0.010 0.010 0.000 Image 51% 0.026 0.026 0.000 Contact Info 6% 0.000 0.000 0.000 Logo 23% 0.374 0.374 0.000
Note. Scanpath entropy numbers were weighted using the number of pixels of each AOI compared to the size of the whole advertisement.
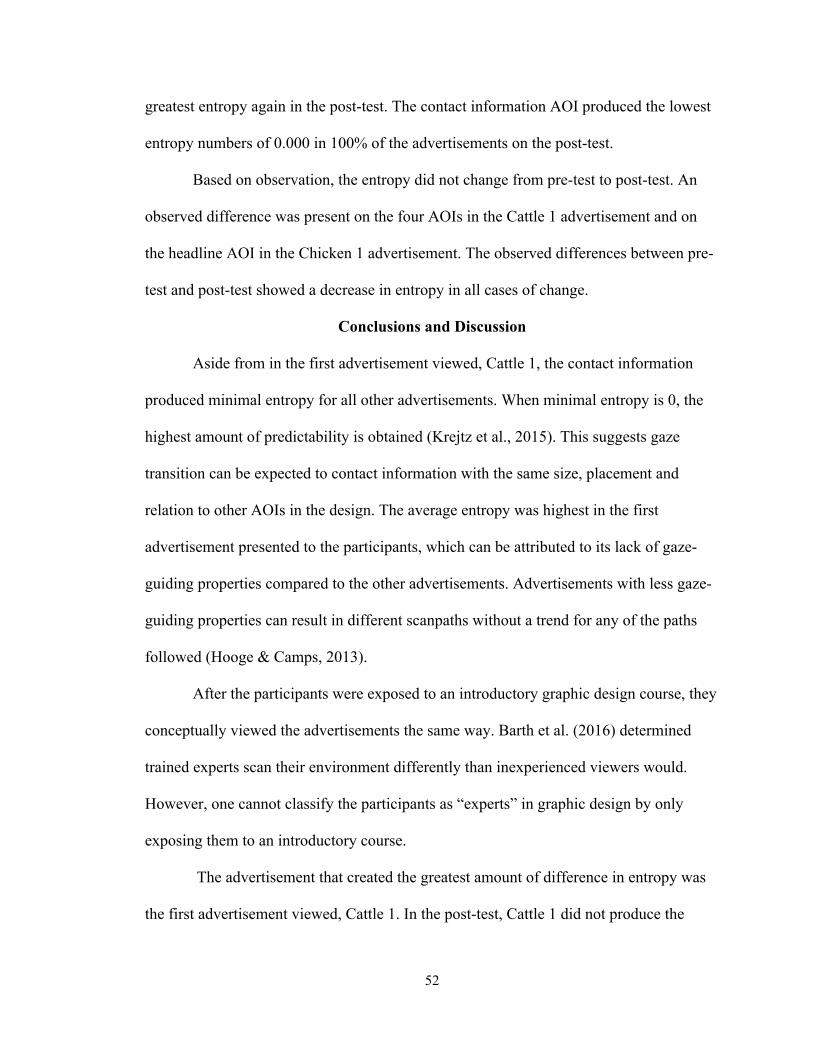
52
greatest entropy again in the post-test. The contact information AOI produced the lowest
entropy numbers of 0.000 in 100% of the advertisements on the post-test.
Based on observation, the entropy did not change from pre-test to post-test. An
observed difference was present on the four AOIs in the Cattle 1 advertisement and on
the headline AOI in the Chicken 1 advertisement. The observed differences between pre-
test and post-test showed a decrease in entropy in all cases of change.
Conclusions and Discussion
Aside from in the first advertisement viewed, Cattle 1, the contact information
produced minimal entropy for all other advertisements. When minimal entropy is 0, the
highest amount of predictability is obtained (Krejtz et al., 2015). This suggests gaze
transition can be expected to contact information with the same size, placement and
relation to other AOIs in the design. The average entropy was highest in the first
advertisement presented to the participants, which can be attributed to its lack of gaze-
guiding properties compared to the other advertisements. Advertisements with less gaze-
guiding properties can result in different scanpaths without a trend for any of the paths
followed (Hooge & Camps, 2013).
After the participants were exposed to an introductory graphic design course, they
conceptually viewed the advertisements the same way. Barth et al. (2016) determined
trained experts scan their environment differently than inexperienced viewers would.
However, one cannot classify the participants as “experts” in graphic design by only
exposing them to an introductory course.
The advertisement that created the greatest amount of difference in entropy was
the first advertisement viewed, Cattle 1. In the post-test, Cattle 1 did not produce the
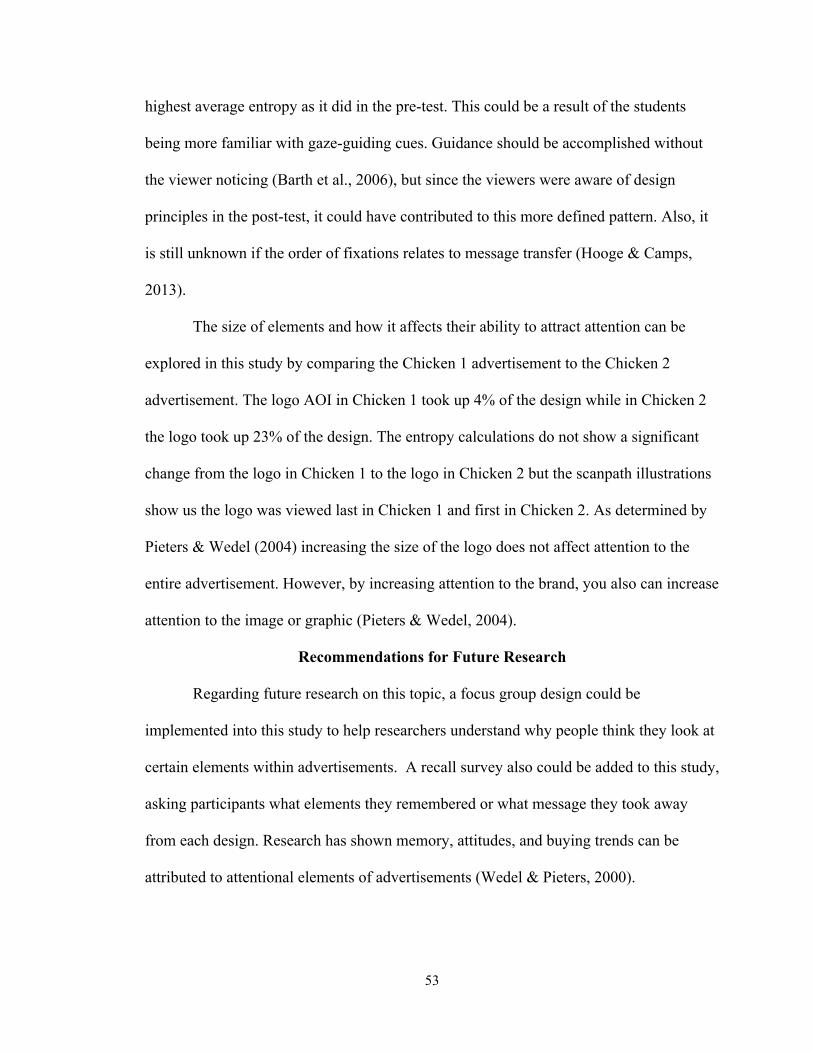
53
highest average entropy as it did in the pre-test. This could be a result of the students
being more familiar with gaze-guiding cues. Guidance should be accomplished without
the viewer noticing (Barth et al., 2006), but since the viewers were aware of design
principles in the post-test, it could have contributed to this more defined pattern. Also, it
is still unknown if the order of fixations relates to message transfer (Hooge & Camps,
2013).
The size of elements and how it affects their ability to attract attention can be
explored in this study by comparing the Chicken 1 advertisement to the Chicken 2
advertisement. The logo AOI in Chicken 1 took up 4% of the design while in Chicken 2
the logo took up 23% of the design. The entropy calculations do not show a significant
change from the logo in Chicken 1 to the logo in Chicken 2 but the scanpath illustrations
show us the logo was viewed last in Chicken 1 and first in Chicken 2. As determined by
Pieters & Wedel (2004) increasing the size of the logo does not affect attention to the
entire advertisement. However, by increasing attention to the brand, you also can increase
attention to the image or graphic (Pieters & Wedel, 2004).
Recommendations for Future Research
Regarding future research on this topic, a focus group design could be
implemented into this study to help researchers understand why people think they look at
certain elements within advertisements. A recall survey also could be added to this study,
asking participants what elements they remembered or what message they took away
from each design. Research has shown memory, attitudes, and buying trends can be
attributed to attentional elements of advertisements (Wedel & Pieters, 2000).
54
Pieters and Wedel (2004) found increasing the size of the brand does not have a
negative effect on overall attention to the advertisement, so further research could be
done on the entropy produced by the logo as it increases in size. Entropy can also be
investigated for one designated AOI (Hooge & Camps, 2013), instead of all AOIs within
an advertisement, as done in this study.
Recommendations for Education and Practice
For graphic designers, without being aware of trends in human eye movements,
the message of their advertisements could easily be overlooked (Pieters & Wedel, 2004).
From the results of this study, we know novice graphic designers view their work
relatively the same as they did before they were familiar with design principles, but this
should not deter them from always designing with their audience in mind (Graham,
2005).
Revising curriculum is a crucial aspect of academia (O’Neill, 2010), and the
results from this study combined with other studies of its kind can lend information to
revisit and possibly revise some current graphic design curriculum.
55
CHAPTER V
DISCUSSION AND IMPLICATIONS
In Chapter V, you will find overarching discussion and implications related to
both parts of this two-fold research study.
Since participants in this study shared common demographics, such as college
major and age, these results cannot be generalized to advertising consumers. However,
this study could be replicated with a larger more representative population.
It could be beneficial to eye-track a group of professionals in the graphic design
industry to explore their viewing trends. Comparing the advertisement design
observations of expert designers also could reveal if the graphic designers view the
advertisements like they intend for them to be viewed by their target audiences. However,
without being able to control the exposure to graphic design curriculum and level of
expertise, as done in this study, it could lead to flaws in the research design. Also, using a
post-test only design would only allow for comparison among advertisement designs.
Although the advertisements used for the first manuscript were not all studied in
the second manuscript due to varied designs and the number of specified AOIs, the four
advertisements can be compared through eye-tracking metrics and entropy. The logo in
the four advertisements produced the greatest entropy as well as the least fixations on
56
average. By comparing entropy and fixations, some evidence suggests the logo in an
advertisement may be an important consideration for designers. If the overall goal of the
design is for the logo to not draw any extra attention, the visual stimuli used for this study
could be effective. On the other hand, if the designer is wanting to attract attention to the
logo, further research would need to be conducted to determine its most effective size and
placement in advertisements.
Comparing pre-test and post-test results, difference were observed in all AOIs in
the Cattle 1 advertisement and the headline AOI in the Chicken 1 advertisement. Entropy
decreased from pre-test to post-test, which may indicate a slight increase in predictability
of scanpaths after the students were exposed to graphic design curriculum. This
phenomenon could be further explored with a larger population or with a different group
of participants with and without graphic design experience. Without knowing the amount
of information the students retained from the course, it can become difficult to describe
them as “trained” graphic designers after they completed the course. However, it is safe
to assume participating students were primed with more knowledge of graphic design
than typical consumers.
This particular study could be improved by including a control group in the pre-
post design. By including a control group not exposed to graphic design curriculum, we
could explore more variations in viewing trends. It also could be beneficial to use designs
seen in livestock publications today. Most of the time the modern livestock publication
advertisement designs are complex and, in some people’s opinion, can be classified as
“busy” designs. By using actual designs being used as advertisements to the livestock
industry, we could better understand consumer viewing trends.
57
The designs for this study also were similar in composition and could be altered
more to compare advertisement observation changes through varying the graphic design
stimuli, such as controlling the image size and placement in the advertisement. For
example, the logo was never at the top of the page in any of the designs used in this
study, and the image was always the dominant AOI. By moving the AOIs around more
throughout the design and varying them in size, we could better understand viewing
trends.
Few academic departments offer instruction on the role eye-tracking research can
play (Duchowski, 2017). As observed by the researcher conducting the eye-tracking
portion of the study, students were intrigued by the eye-tracking technology and most
stated they did not know it existed on the university campus. An abundant amount of
research should be done in regard to eye-tracking print advertisements but without the
awareness of the technology, this research could be left untouched.
Eye-tracking research can be beneficial to future and current professionals in the
graphic design industry. Without the understanding of trends of human eye movements,
designers could be costing the company for which they design money in the long run.
Visual attention is a complex topic, but with effective implementation of design the
overall goal of communicating a message can be achieved.
As a graphic designer and future design instructor, I plan to implement my
findings from this study as well as future eye-tracking research in my designs and design
curriculum. This research has opened my eyes to the endless possibilities eye-tracking
research can provide to the design industry and education. Without understanding the

58
concepts of visual attention, designers and design instructors could quickly fall behind
their peers in the industry who are executing these findings in their work.
59
REFERENCES
Anderson, J.R., Bothell, D., & Douglass, S. (2004). Eye movements do not reflect
retrieval process: Limits of the eye-mind hypothesis. Psychological Science,
15(4), 225-231.
Bailey, R., McNamara, A., Sudarsanam, N., & Grimm, C. (2009). Subtle gaze direction.
ACM Transactions on Graphics, 28(4).
Barth, E., Dorr, M., Bohme, M., Gegenfurtner, K., & Martinetz, T. (2006). Guiding eye
movement for better communication and augmented vision. Perception and
Interactive Technologies. Lecture notes in computer science, 4021.
Blascheck, T., Kurzhals, K., Raschke, M., Burch, M., Weiskopf, D., & Ertl, T. (2014).
State of the art visualization for eye tracking data. Eurographics Conference of
Visualization, State of the Art Report.
Cannon, K.J., Specht, A.R., & Buck E.B. (2014). Agricultural communications: A
national portrait of undergraduate courses. Journal of Applied Communications,
100(1), 6-16.
Christianson, S.A., Loftus, E.F., Hoffman, H., & Loftus, G.R. (1991). Eye fixations and
memory for emotional events. Journal of Experimental Psychology: Learning,
Memory, and Cognition, 17, 693-701.
60
Clarence-Fincham, J., & Naidoo, K. (2013). Taking a longer view: Processes of
curriculum development in the department of graphic design at the University of
Johannesburg. Critical Studies In Teaching and Learning (CriSTal), 1 (1).
Duchowski, A.T. (2007). Eye Tracking Methodology: Theory and Practice. New York:
Springer-Verlag Londan Limited.
Duchowski, A.T. (2017). Eye Tracking Methodology: Theory and Practice. New York:
Springer-Verlag Londan Limited.
Gibson, J. J. (1941). A Critical Review of the Concept of Set in Contemporary
Experimental Psychology. Psychological Bulletin, 38 (9), 781–817.
Gonnella, R., Navetta, C.J., & Friedman, M. (2015). Design fundamentals: notes on
visual elements & principles of composition. San Francisco: Peachpit Press.
Gorn, G.J., Chattapadhyay, A., Yi, T., & Dahl, D.W. (1997). Effects of color as an
executional cue in advertising: They’re in the shade. Management Science,
43(10). 1387-1400.
Graham, L. (2005). Basics of design. Clifton Park, NY: Thomson/Delmar Learning.
Gray, R.M. (2011). Entropy and information theory. New York, NY: Springer.
Higgins, E., Leinenger, M., & Rayner, K. (2014). Eye movements when viewing
advertisements. Frontiers in Psychology, 5, 1-15.
Holmqvist, K., Nyström, M., Andersson, R., Dewhurst, R., Jarodzka, H., & Van
deWeijer, J. (2011). Eye tracking: A comprehensive guide to methods and
measures. Oxford, UK: Oxford University Press.
Hooge, I., & Camps, G. (2013). Scan path entropy and arrow plots: Capturing scanning
behavior of multiple observers. Frontiers in Psychology, 4 (996).
61
James, W. (1981). The Principles of Psychology (Vol. I). Cambridge, MA: Harvard
University Press.
Just M.A., & Carpenter, P.A. (1976). Eye fixations and cognitive processes. Cognitive
Psychology, 8, 441-480.
Krejtz, K., Duchowski, A.T., Sxmidt, T., Krejtz, I., González Perilli, F., Pires, A., Vilaro,
A., & Villalobos, N. (2015) Gaze transition entropy. ACM Transactions on
Applied Perception, 13 (1), 4:1-4:20.
Lochner, P.J. (2006). The usefulness of eye movement recording to subject an aesthetic
episode with visual art to empirical scrutiny. Psychology Science, 2, 106-114.
Mackworth, N.H., Morandi, A.J. (1967). The gaze selects informative details with
pictures. Perception and Psychophysics, 2(11).
Martin, B. & Hannington, B.M. (2012). Universal methods of design: 100 ways to
research complex problems, develop innovative ideas, and design effective
solutions. Beverly, MA: Rockport.
Matos, R. (2016). Eye tracking essentials. Retrieved March 8, 2017, from
http://www.tobiipro.com/learn-and-support/learn/eye-tracking-essentials/
McNamara, A., Bailey R., & Grimm, C. (2009). Search task performance using subtle
gaze direction with the presence of distractions. ACM Transactions on Applied
Perception, 6(3).
Media Matters (February 2007). “Our Rising Ad Dosage: It’s Not as Oppressive as Some
Think”.
Miall, R.C., & Tchalenko, J. (2001). A painter’s eye movements: A study of eye and
hand movement during portrait drawing. Leonardo, 34(1), 35-40.
62
Morgan A.C., & Rucker, K.J. (2013). Competencies needed by agricultural
communication undergraduates: An academic perspective. Journal of Applied
Communications, 97(1), 50-65.
Nielsen, J., & Pernice, K. (2010). Eye-tracking web usability. New Riders.
Noton, D., & Stark, L. (1971a). Eye Movements and Visual Perception. Scientific
American, 224, 34–43.
Noton, D., & Stark, L. (1971b). Scanpaths in saccadic eye movements while viewing and
recognizing patterns. Vision Research, 11, 929–942.
Ogilvy, D. (1983). Ogilvy on advertising. New York: Crown Publishers, Inc.
Oklahoma State University. (2017). 2017-2018 University Catalog. Retrieved from
https://registrar.okstate.edu/University-Catalog
Percy, L., & Rossiter, J.R. (1983). Effects of picture size and color on brand attitude
responses in print advertising. Advances in Consumer Research, 10, 17-20.
Pieters, R., Wedel, M. (2004). Attention capture and transfer in advertising: Brand,
pictorial, and text-size effects. Journal of Marketing, 68, 36-50.
Pieters, R., Wedel, M., & Zhang, J. (2007). Optimal feature advertising design under
competitive clutter. Management Science, 53(11), 1815-1828.
Poole, A. & Ball, A.J. (2005). Eye tracking in human computer interaction and usability
research. Encyclopedia of Human Computer Interaction, 2005.
Privitera, C.M. (2006). The scanpath theory: Its definition and later developments.
Human Vision and Electronic Imaging, 6057.
63
Radach, R., Lemmer, S., Vorstius, C., Heller, D., & Radach, K. (2003). Eye movements
in the process of print advertisements. The Mind’s Eye: Cognitive and Applied
Aspects of Eye Movement Research.
Rayner, K., & Castelhano, M.S. (2008). Eye movements during reading scene
perception, visual search, and while looking at print advertisements. Visual
Marketing From Attention to Action.
Rayner, K., Rotello, C.M., Stewart, A.J., Keir, J., Duffy, S.A. (2001). Integrating text and
pictorial information: Eye movements when looking at print advertisements.
Journal of Experimental Psychology, 7(3), 219-226.
Sitton, S. (2017a). AGCM 3213: Layout and Design for Print Publication [Syllabus].
Stillwater, OK: Department of Agricultural Education, Communications, and
Leadership, Oklahoma State University.
Sitton, S. (2017b). Advertisements: AGCM 3213 [PowerPoint Slides]. Stillwater, OK:
Department of Agricultural Education, Communications, and Leadership,
Oklahoma State University.
Stark, J.S. (2000). Planning introductory college courses: Content, context and form.
Instructional Science, 28, 414-438.
Stark, L.W., & Ellis, H.C. (1981). Scanpaths revisited: Cognitive models direct active
looking. Eye Movements: Cognition and Visual Perception. Lawrence Erlbaum
Associates.
Tobii Studio. (2016). User’s Manual: Version 3.4.5
64
Viviani, P. (1990). Eye movements in visual search: Cognitive, perceptual, and motor
control aspects in eye movements and their role in visual and cognitive processes.
Elsevier Science Publishers BV.
Vogt, W. P. (2005). Dictionary of statistics and methodology: A nontechnical guide for
the social sciences. London: Sage.
Von Helmholtz, H. (1925). Handbuch der Physiologischen Optik (Treatise on
Physiological Optics) (Vol. III, Translated from the Third German ed.).
Rochester, NY: The Optical Society of America.
Wagemans, J., Feldman, J., Gepshtein, S., Kimchi, R., Pomerantz, J.R., & van der
Helm, P. (2012). A century of gestalt psychology in visual perception: II.
Conceptual and theoretical foundations. Psychological Bulletin, 138(6), 1218-
1252.
Wedel, M., & Pieters, R. (2000). Eye fixations on advertisements and memory for
brands: A model and findings. Journal of Marketing Science, 19 (4), 297-312.
Wedel, M., Pieters, R., & Liechty, J. (2008). Attention switching during scene
perception: How goals influence the time course of eye movements across
advertisements. Journal of Experimental Psychology: Applied, 14 (2), 129-138.
Yarbus, A. L. (1967). Eye Movements and Vision. New York: Plenum Press.
Zeelenberg, R., Pecher, D. (2015). A method for simultaneously counterbalancing
condition order and assignment of stimulus materials to conditions. Behavior
Research Methods 47 (1), 127-133,

65
APPENDICES

66
APPENDIX A
INSTITUTIONAL REVIEW BOARD (IRB) APPROVAL FORM
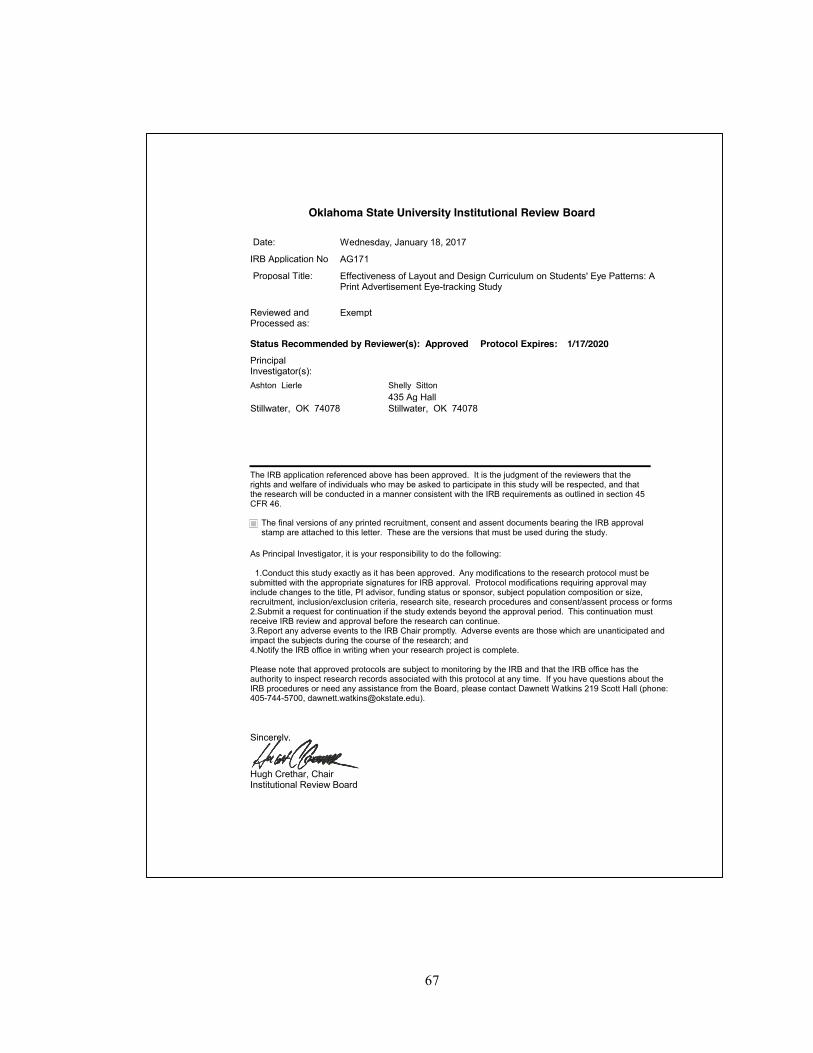
67
Oklahoma State University Institutional Review Board
Date: Wednesday, January 18, 2017
Proposal Title: Effectiveness of Layout and Design Curriculum on Students' Eye Patterns: A Print Advertisement Eye-tracking Study
Principal Investigator(s):
1/17/2020Protocol Expires:
IRB Application No AG171
Reviewed and Processed as:
Exempt
Status Recommended by Reviewer(s): Approved
Ashton Lierle
Stillwater, OK 74078435 Ag HallShelly Sitton
Stillwater, OK 74078
Sincerely,
Hugh Crethar, ChairInstitutional Review Board
The IRB application referenced above has been approved. It is the judgment of the reviewers that the rights and welfare of individuals who may be asked to participate in this study will be respected, and that the research will be conducted in a manner consistent with the IRB requirements as outlined in section 45 CFR 46.
The final versions of any printed recruitment, consent and assent documents bearing the IRB approval stamp are attached to this letter. These are the versions that must be used during the study.
As Principal Investigator, it is your responsibility to do the following:
1.Conduct this study exactly as it has been approved. Any modifications to the research protocol must be submitted with the appropriate signatures for IRB approval. Protocol modifications requiring approval may include changes to the title, PI advisor, funding status or sponsor, subject population composition or size, recruitment, inclusion/exclusion criteria, research site, research procedures and consent/assent process or forms.2.Submit a request for continuation if the study extends beyond the approval period. This continuation must receive IRB review and approval before the research can continue. 3.Report any adverse events to the IRB Chair promptly. Adverse events are those which are unanticipated and impact the subjects during the course of the research; and4.Notify the IRB office in writing when your research project is complete. Please note that approved protocols are subject to monitoring by the IRB and that the IRB office has the authority to inspect research records associated with this protocol at any time. If you have questions about the IRB procedures or need any assistance from the Board, please contact Dawnett Watkins 219 Scott Hall (phone: 405-744-5700, [email protected]).

68
APPENDIX B
QUESTIONNAIRE
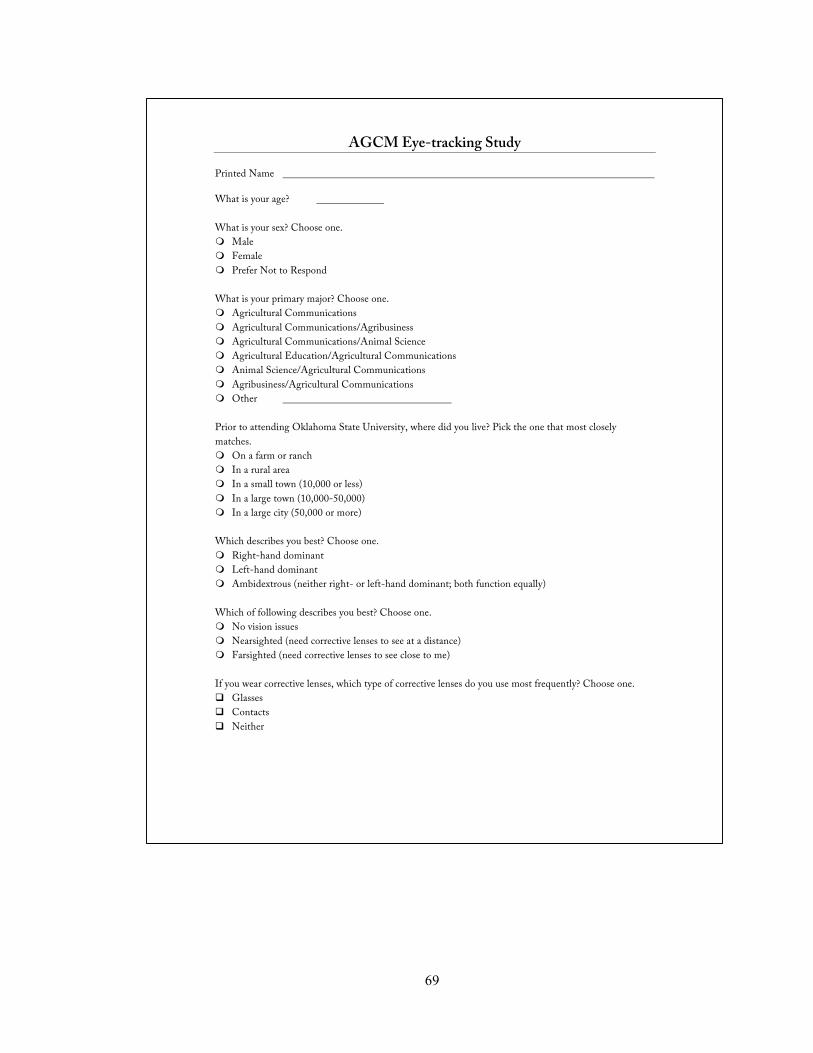
69
AGCM Eye-tracking Study Printed Name
What is your age? What is your sex? Choose one. m Male m Female m Prefer Not to Respond What is your primary major? Choose one. m Agricultural Communications m Agricultural Communications/Agribusiness m Agricultural Communications/Animal Science m Agricultural Education/Agricultural Communications m Animal Science/Agricultural Communications m Agribusiness/Agricultural Communications m Other Prior to attending Oklahoma State University, where did you live? Pick the one that most closely matches. m On a farm or ranch m In a rural area m In a small town (10,000 or less) m In a large town (10,000-50,000) m In a large city (50,000 or more) Which describes you best? Choose one. m Right-hand dominant m Left-hand dominant m Ambidextrous (neither right- or left-hand dominant; both function equally) Which of following describes you best? Choose one. m No vision issues m Nearsighted (need corrective lenses to see at a distance) m Farsighted (need corrective lenses to see close to me) If you wear corrective lenses, which type of corrective lenses do you use most frequently? Choose one. q Glasses q Contacts q Neither
70
AGCM Eye-tracking Study Are you colorblind? Choose one. m Yesm Nom Prefer Not to Respond
Do you have epilepsy? Choose one. m Yesm Nom Prefer Not to Respond
If you been diagnosed with a disorder or medical condition that could influence your vision or ability to focus on images, please list in the space below. For example, autism, attention-deficit disorder, traumatic brain injury, etc. This question is optional.

71
APPENDIX C
RECRUITMENT SCRIPT
72
Script Read by chief researcher, Ashton Lierle: My name is Ashton Lierle, and I am a graduate student in the OSU Department of Agricultural Education, Communications and Leadership as well as the Graduate Teaching Assistant for this class, AGCM 3213. I am studying the effectiveness of layout and design curriculum on students' eye patterns. Your participation in this study is completely voluntary and truly appreciated. If you choose to participate, your responses and tracking results will be confidential and not available to the researchers until after final grades are recorded with the OSU Registrar. Results of the research will be reported in the aggregate only. Completing the eye-tracking exercise is a requirement for AGCM 3213, but you are not required to consent for your data to be used for this research project. This study will take around 30 minutes to complete. There are no known risks for participating in this study, and there is no direct compensation or benefits. This research is to help the OSU AGCM program to improve its graphic design education curriculum. Are there any questions at this time? If not, we will begin the survey portion of the study. Dr. Sitton and I will exit the room while you complete the questionnaire. After you have completed the questionnaire please place it in the envelope provided. If you choose to not answer the questions presented on the questionnaire, just place it into the envelope provided along with all of the others. The envelope containing the completed questionnaires will be stored in a secure area and not accessed by us until after final grades have been posted at the end of the Spring 2017 semester. Before you exit the room, place your name next to a time slot on the eye tracking exercise sign up sheet provided on the table. If your scheduled AGCM 3213 lab time is on Thursday please sign up for a time slot on Thursday and if your scheduled AGCM 3213 lab time is on Friday please sign up for a Friday time slot.

73
APPENDIX D
CONSENT FORM
74
AGCM Eye-tracking Study Eye-tracking is an evolving tool used to help determine the effectiveness of advertising in media forms such as print, images, video and graphics. Eye-tracking is used in the marketing and communications field to provide insight on consumer actions. Advertisers strive to present the most effective information in advertisements as possible. Today’s eye-tracking machines have the capabilities of tracking eye patterns as well as determining gaze points.
Please read this consent information carefully before deciding to participate in this study. Once you have read the following, sign and return with your completed survey. My name is Ashton Lierle, and I am a graduate student in the OSU Department of Agricultural Education, Communications and Leadership as well as the Graduate Teaching Assistant for this class, AGCM 3213. I am studying the effectiveness of layout and design curriculum on students' eye patterns. Your participation in this study is completely voluntary and truly appreciated. If you choose to participate, your responses and tracking results will be confidential and not available to the researchers until after final grades are recorded with the OSU Registrar. Results of the research will be reported in the aggregate only. Completing the eye-tracking exercise is a requirement for AGCM 3213, but you are not required to consent for your data to be used for this research project.
This study will take around 30 minutes to complete. There are no known risks for participating in this study, and there is no direct compensation or benefits. This research is to help the OSU AGCM program to improve its graphic design education curriculum.
If you have any questions or concern, please contact myself or my research adviser, Shelly Sitton, at 405-744-3690. Mailing address is 436 Agricultural Hall, Stillwater, OK 74078. Any questions or concerns about your rights as a research participant can be answered by Dawnett Watkins, IRB Manager, 223 Scott Hall, 405-744-5700. I understand I must complete the eye-tracking assignment to meet AGCM 3213 requirements. _____________________________________________________________________________________ Participant Signature Date
I give my permission to use my eye-tracking results and my questionnaire responses in research. I will not be identified to researchers until after final grades are submitted. Choosing to allow my results in the research will not affect my final grade. _____________________________________________________________________________________ Participant Signature Date
VITA
Ashton Elizabeth Lierle
Candidate for the Degree of
Master of Science Thesis: THE VIEW: A PRINT ADVERTISEMENT EYE-TRACKING STUDY Major Field: Agricultural Communications Biographical:
Education:
Completed the requirements for the Master of Science in Agricultural Communications at Oklahoma State University, Stillwater, Oklahoma in December, 2017. Completed the requirements for the Bachelor of Science in Agricultural Communications at Oklahoma State University, Stillwater, Oklahoma in December, 2017.
Experience:
Employed as a graduate teaching assistant in the Agricultural Education, Communications and Leadership Department at Oklahoma State University, Stillwater, Oklahoma from January 2016 – December 2017.
Professional Memberships: Agricultural Communicators of Tomorrow, August 2013 – December
2017. Graduate Student Association in Agricultural Education,
Communications, and Leadership, January 2016 – December 2017. North American Colleges and Teachers of Agriculture, March 2017 –
December 2017.
Related Documents