A peer-reviewed version of this preprint was published in PeerJ on 30 June 2016. View the peer-reviewed version (peerj.com/articles/2190), which is the preferred citable publication unless you specifically need to cite this preprint. Hobbs SJ, Bertram JEA, Clayton HM. 2016. An exploration of the influence of diagonal dissociation and moderate changes in speed on locomotor parameters in trotting horses. PeerJ 4:e2190 https://doi.org/10.7717/peerj.2190

Welcome message from author
This document is posted to help you gain knowledge. Please leave a comment to let me know what you think about it! Share it to your friends and learn new things together.
Transcript

A peer-reviewed version of this preprint was published in PeerJ on 30June 2016.
View the peer-reviewed version (peerj.com/articles/2190), which is thepreferred citable publication unless you specifically need to cite this preprint.
Hobbs SJ, Bertram JEA, Clayton HM. 2016. An exploration of the influence ofdiagonal dissociation and moderate changes in speed on locomotorparameters in trotting horses. PeerJ 4:e2190https://doi.org/10.7717/peerj.2190
An exploration of the influence of diagonal dissociation and
moderate changes in speed on locomotor parameters in
trotting horses
Sarah Jane Hobbs Corresp., 1 , John E A Bertram 2 , Hilary M Clayton 3
1 Centre for Applied Sport and Exercise Sciences, University of Central Lancashire, Preston, Lancashire, United Kingdom
2 Faculty of Veterinary Medicine, University of Calgary, Calgary, Alberta, Canada
3 Sport Horse Science, LC, Michigan, United States
Corresponding Author: Sarah Jane Hobbs
Email address: [email protected]
Background. Although the trot is described as a diagonal gait, contacts of the diagonal
pairs of hooves are not usually perfectly synchronized. Although subtle, the timing
dissociation between contacts of each diagonal pair could have consequences on gait
dynamics and provide insight into the functional strategies employed. This study explores
the mechanical effects of different diagonal dissociation patterns when speed was
matched between individuals and how these effects link to moderate, natural changes in
trotting speed. We anticipate that hind-first diagonal dissociation at contact increases with
speed, diagonal dissociation at contact can reduce collision-based energy losses and
predominant dissociation patterns will be evident within individuals. Methods. The study
was performed in two parts: in the first 17 horses performed speed-matched trotting trials
and in the second, 5 horses each performed 10 trotting trials that represented a range of
individually preferred speeds. Standard motion capture provided kinematic data that were
synchronized with ground reaction force (GRF) data from a series of force plates. The data
were analyzed further to determine temporal, speed, GRF, postural, mass distribution,
moment, and collision dynamics parameters. Results. Fore-first, synchronous, and hind-
first dissociations were found in horses trotting at (3.3 m/s ± 10%). In these speed-
matched trials, mean centre of pressure (COP) cranio-caudal location differed significantly
between the three dissociation categories. The COP moved systematically and significantly
(P=.001) from being more caudally located in hind-first dissociation (mean location =
0.41±0.04) through synchronous (0.36±0.02) to a more cranial location in fore-first
dissociation (0.32±0.02). Dissociation patterns were found to influence function, posture,
and balance parameters. Over a moderate speed range, peak vertical forelimb GRF had a
strong relationship with dissociation time (R=.594; P<.01) and speed (R=.789; P<.01), but
peak vertical hindlimb GRF did not have a significant relationship with dissociation time
PeerJ Preprints | https://doi.org/10.7287/peerj.preprints.2114v1 | CC BY 4.0 Open Access | rec: 8 Jun 2016, publ: 8 Jun 2016

(R=.085; P>.05) or speed (R=.223; P=.023). Discussion. The results indicate that at
moderate speeds individual horses use dissociation patterns that allow them to maintain
trunk pitch stability through management of the cranio-caudal location of the COP. During
the hoof-ground collisions, reduced mechanical energy losses were found in hind-first
dissociations compared to fully synchronous contacts. As speed increased, only forelimb
vertical peak force increased so dissociations tended towards hind-first, which shifted the
net COP caudally and balanced trunk pitching moments.

1 An exploration of the influence of diagonal dissociation and moderate changes in speed on
2 locomotor parameters in trotting horses
3 Sarah Jane Hobbs1, John E.A. Bertram2 and Hilary M. Clayton3
41 Centre for Applied Sport and Exercise Sciences, University of Central Lancashire, Preston,
5 UK.
62 Faculty of Veterinary Medicine, University of Calgary, Calgary, Alberta, Canada
73 Sport Horse Science, LC, MI, USA.
8
9 Corresponding Author:
10 Sarah Hobbs1,
11 Darwin Building DB201, Preston, Lancashire, PR1 2HE, UK.
12 Tel: +44 1772 893328
13 E-mail: [email protected]
14
15
16
17
18

19 Abbreviations
20 COM Centre of mass
21 COP Centre of pressure
22 g Acceleration due to gravity
23 GRF Ground reaction force
24 GRFV Vertical ground reaction force
25 Jz ratio Fraction of body weight on the forelimbs
26 l Standing height
27 LF Left forelimb
28 LH Left hindlimb
29 MGRF Ground reaction force moments
30 RF Right forelimb
31 RH Right hindlimb
32 ROM Range of motion
33 Tzero Time of zero longitudinal force
34 V Velocity
35 Vr Relative COM velocity
36
37 Glossary
38 Dissociation pattern: The sequence of footfalls of a diagonal limb pair used by an individual
39 horse during trotting gaits.
40 Dissociation time: The length of time between forelimb and hindlimb ground contact.
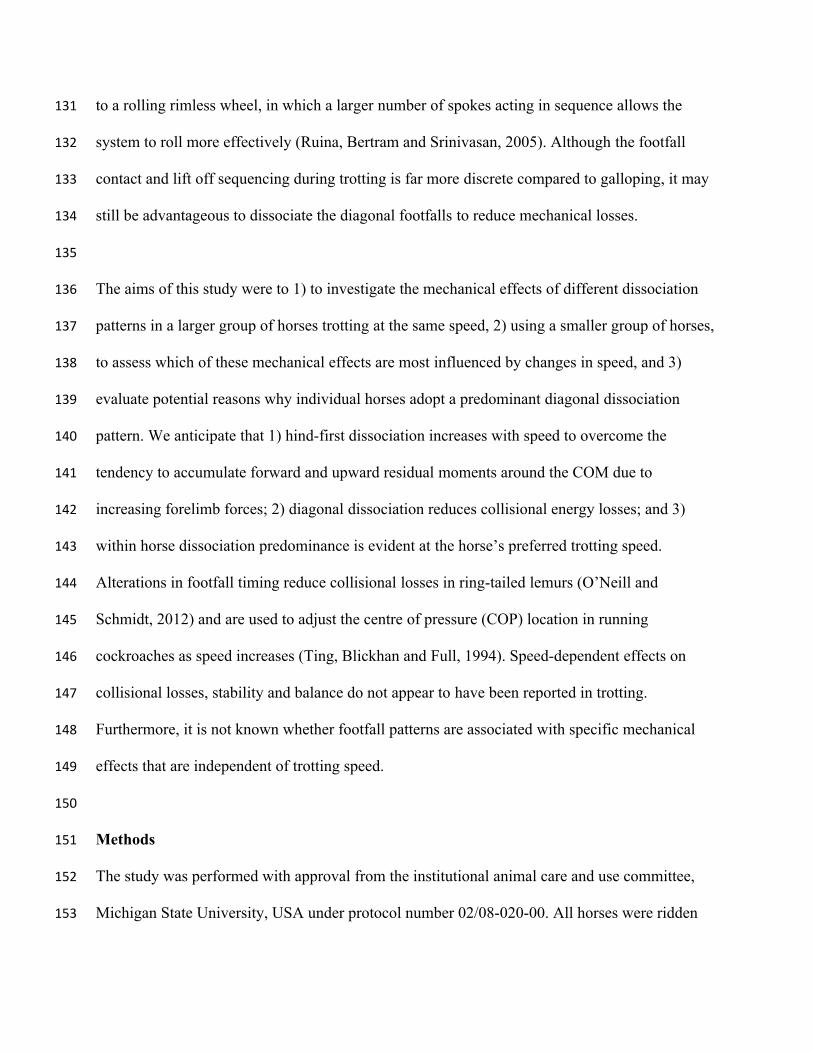
41 Fore-first dissociation: A diagonal footfall sequence where the forelimb contacts the ground
42 before the hindlimb. Otherwise known as negative diagonal advanced placement.
43 Hind-first dissociation: A diagonal footfall sequence where the hindlimb contacts the ground
44 before the forelimb. Otherwise known as positive diagonal advanced placement.
45 Nose up pitch rotation of the trunk: Pitching rotation of the body that would lift the forehand.
46 Synchronous footfalls: A diagonal footfall sequence where the forelimb and hindlimb contacts
47 the ground at the same time.
48
49 Abstract
50 Background. Although the trot is described as a diagonal gait, contacts of the diagonal pairs of
51 hooves are not usually perfectly synchronized. Although subtle, the timing dissociation between
52 contacts of each diagonal pair could have consequences on gait dynamics and provide insight
53 into the functional strategies employed. This study explores the mechanical effects of different
54 diagonal dissociation patterns when speed was matched between individuals and how these
55 effects link to moderate, natural changes in trotting speed. We anticipate that hind-first diagonal
56 dissociation at contact increases with speed, diagonal dissociation at contact can reduce
57 collision-based energy losses and predominant dissociation patterns will be evident within
58 individuals.
59
60 Methods. The study was performed in two parts: in the first 17 horses performed speed-matched
61 trotting trials and in the second, 5 horses each performed 10 trotting trials that represented a
62 range of individually preferred speeds. Standard motion capture provided kinematic data that
63 were synchronized with ground reaction force (GRF) data from a series of force plates. The data
64 were analyzed further to determine temporal, speed, GRF, postural, mass distribution, moment,
65 and collision dynamics parameters.
66
67 Results. Fore-first, synchronous, and hind-first dissociations were found in horses trotting at (3.3
68 m/s ± 10%). In these speed-matched trials, mean centre of pressure (COP) cranio-caudal location
69 differed significantly between the three dissociation categories. The COP moved systematically
70 and significantly (P=.001) from being more caudally located in hind-first dissociation (mean
71 location = 0.41±0.04) through synchronous (0.36±0.02) to a more cranial location in fore-first

72 dissociation (0.32±0.02). Dissociation patterns were found to influence function, posture, and
73 balance parameters. Over a moderate speed range, peak vertical forelimb GRF had a strong
74 relationship with dissociation time (R=.594; P<.01) and speed (R=.789; P<.01), but peak vertical
75 hindlimb GRF did not have a significant relationship with dissociation time (R=.085; P>.05) or
76 speed (R=.223; P=.023).
77
78 Discussion. The results indicate that at moderate speeds individual horses use dissociation
79 patterns that allow them to maintain trunk pitch stability through management of the cranio-
80 caudal location of the COP. During the hoof-ground collisions, reduced mechanical energy
81 losses were found in hind-first dissociations compared to fully synchronous contacts. As speed
82 increased, only forelimb vertical peak force increased so dissociations tended towards hind-first,
83 which shifted the net COP caudally and balanced trunk pitching moments.
84
85

86 Introduction
87 The trot is regarded as a symmetrical gait with the limbs moving by diagonal pairs (Alexander,
88 1984; Hildebrand, 1965; Lee, Bertram and Todhunter, 1999) but slow motion analysis in horses
89 has indicated that the diagonal footfalls often occur with some degree of contact asynchrony
90 (Clayton 1994; Deuel and Park 1990; Drevemo et al., 1980; Holmström, Fredricson and
91 Drevemo, 1994; Weishaupt et al., 2010). The asynchrony of this footfall sequence is reported to
92 vary between horses (Deuel and Park, 1990; Holmström, Fredricson and Drevemo, 1995) and,
93 depending on the hoof contact sequence, this can be classified as synchronous, hind-first or fore-
94 first dissociation. In dressage horses there is a positive association between hind-first contacts
95 and subjective assessment of gait quality at trot (Holmström, Fredricson and Drevemo, 1994).
96 Differences in the pattern and timing of dissociations have also been noted in horses performing
97 advanced dressage movements. One such movement is passage, which is described as a very
98 collected, elevated, cadenced and graceful trot (Fédération Equestre Internationale, 2014) with a
99 particularly high step and body carriage. When performing passage, longer relative hind-first
100 dissociation times were found by Weishaupt et al. (2010) compared to collected trot. Untrained
101 differences in dissociation have also been found in dogs. A tendency toward hind-first
102 dissociation has been reported in trotting Greyhounds while Labrador Retrievers tend toward
103 fore-first dissociation (Bertram et al., 2000). The breed-specific dissociation patterns may arise
104 to balance differences in body motions resulting from differences in conformation (body/limb
105 proportion and mass distribution). These subtle differences in contact timing also influence the
106 timing of peak force production in the diagonal pairs of limbs (Weishaupt et al., 2010). As such,
107 dissociation may have important consequences on trotting dynamics, particularly as moments

108 around the centre of mass (COM) are most affected by the vertical force components and their
109 effective distance to the COM (Hobbs, Richards and Clayton, 2014).
110
111 Diagonal synchronization can provide trunk pitch and roll stability if the load distribution
112 between the limbs remains consistent (Hildebrand, 1985). In horses at the trot, the head and trunk
113 are rotationally stabilized and this helps to determine and maintain whole-body spatial
114 orientation (Dunbar et al., 2008). In this context, trunk stability is defined as minimization of roll
115 and pitching moments about the COM. During trotting, activation of longissimus dorsi and
116 rectus abdominis muscles increases spinal stiffness (Robert et al., 2002), which provides a stable
117 platform for limb articulation and force transmission (Nauwelaerts and Clayton, 2009; Robert et
118 al., 2002). Hind-first contacts were thought to reflect nose-up pitch rotation of the trunk, with
119 the forequarters elevated relative to the hindquarters (Holmström, Fredricson and Drevemo,
120 1994). Whether trunk inclination or stability is affected by asynchronous foot contacts is
121 currently unknown.
122
123 The mechanical effects of diagonal dissociation have not been explored in detail and may be
124 important to locomotor efficiency. Mechanical energy losses through collision-like deflection of
125 the animal’s mass have been identified as a major source of mechanical cost during locomotion
126 (Ruina, Bertram and Srinivasan, 2005). Limb contact timing and sequence have a substantial
127 effect on the magnitude of collisional losses. For instance, during galloping collisional losses are
128 reduced by using a limb contact sequence that distributes changes in the COM angular deflection
129 between limbs, thereby decreasing the net deflection angle during each contact (Bertram and
130 Gutmann, 2009; Ruina, Bertram and Srinivasan, 2005). The effect of the limbs has been likened
131 to a rolling rimless wheel, in which a larger number of spokes acting in sequence allows the
132 system to roll more effectively (Ruina, Bertram and Srinivasan, 2005). Although the footfall
133 contact and lift off sequencing during trotting is far more discrete compared to galloping, it may
134 still be advantageous to dissociate the diagonal footfalls to reduce mechanical losses.
135
136 The aims of this study were to 1) to investigate the mechanical effects of different dissociation
137 patterns in a larger group of horses trotting at the same speed, 2) using a smaller group of horses,
138 to assess which of these mechanical effects are most influenced by changes in speed, and 3)
139 evaluate potential reasons why individual horses adopt a predominant diagonal dissociation
140 pattern. We anticipate that 1) hind-first dissociation increases with speed to overcome the
141 tendency to accumulate forward and upward residual moments around the COM due to
142 increasing forelimb forces; 2) diagonal dissociation reduces collisional energy losses; and 3)
143 within horse dissociation predominance is evident at the horse’s preferred trotting speed.
144 Alterations in footfall timing reduce collisional losses in ring-tailed lemurs (O’Neill and
145 Schmidt, 2012) and are used to adjust the centre of pressure (COP) location in running
146 cockroaches as speed increases (Ting, Blickhan and Full, 1994). Speed-dependent effects on
147 collisional losses, stability and balance do not appear to have been reported in trotting.
148 Furthermore, it is not known whether footfall patterns are associated with specific mechanical
149 effects that are independent of trotting speed.
150
151 Methods
152 The study was performed with approval from the institutional animal care and use committee,
153 Michigan State University, USA under protocol number 02/08-020-00. All horses were ridden
154 regularly and had received basic dressage training but none was trained to a medium or advanced
155 level. Horses were judged by a veterinarian who was experienced in lameness evaluation to be
156 sound at trot with lameness grade <1 on a 0 to 5 scale (Anon, 1991). Horses were accustomed to
157 the laboratory environment before data collection commenced and were trained to trot in hand at
158 steady state velocity along the runway and over the force platforms.
159
160 Experimental Data Collection
161 Kinematic data were recorded using 10 infra-red cameras (Eagle cameras, Motion Analysis
162 Corp.) and motion analysis software (Cortex 1.1.4.368, Motion Analysis Corp.). Force data were
163 recorded with a threshold of 50 N using four synchronized force plates arranged linearly with
164 their long axes parallel to the runway. The first and last plates measured 60 x 120 cm (FP61290,
165 Bertec Corporation) and the two middle plates measured 60 x 90 cm (FP6090, Bertec
166 Corporation). In 14 horses, kinematic data were collected at 120 Hz and force data at 960 Hz. In
167 the other 4 horses, kinematic data were collected at 100 Hz and force data at 1000 Hz to facilitate
168 synchronization with accelerometers worn by this subset of horses. The camera system and force
169 platforms were positioned mid way along a 40 m runway, which allowed steady state gait to be
170 obtained prior to data capture. All horses were led by a handler, who ran with the horses through
171 the data collection volume with a loose rope to ensure they did not interfere with the animal’s
172 natural gait. The horses were trained to match their speed with that of the handler.
173
174 Reflective cubic markers were attached to the horse’s skin (Hobbs, Richards and Clayton, 2014),
175 but with one additional mid-segment tracking marker on the left and right antebrachial and crural
176 segments to improve the estimation of their position during the trotting trials (Cappello et al.,
177 1997).
178
179 Speed matched data
180 20–30 trotting trials were collected from seventeen horses of mixed breed with (mean ± s.d.)
181 height 1.50 ± 0.06 m and mass 465 ± 34 kg. Successful trials were those in which the horse
182 moved straight and consistently through the data collection volume with a diagonal pair of
183 hooves making valid contacts with different force plates. Dissociations were classified as hind-
184 first, synchronous or fore-first for each diagonal separately. One successful, speed-matched (3.3
185 m/s ± 10%) trial per horse was selected, which included one left LFRH and one right RFLH
186 diagonal
187
188 Speed range data
189 A further ten successful trotting trials per horse were collected from five horses of mixed breed
190 with (mean ± s.d.) height 1.50 ± 0.03 m and mass 455 ± 19 kg. These trials were performed at a
191 speed that each horse favoured, which represented a narrow range of speeds for each horse.
192
193 Procedure
194 Kinematic and force data were recorded and prepared for analysis and a 25 segment model (see
195 Figure 1) was developed for each horse as described by Hobbs, Richards and Clayton (2014)
196 and, in accordance with the results of that study, the segmental model COM was adjusted to the
197 COP ratio during standing by shifting the trunk COM location. Consequently, the cranio-caudal
198 segmental model COM location matched the body COP location during standing. The standing
199 COP ratio (COPSTAND) was determined as follows;
200
201 [1]T
FSTAND
GRFV
GRFVRatioCOP
202 GRFVF =forelimb vertical force
203 GRFVT = summed forelimb and hindlimb vertical forces
204
205 Temporal parameters
206 The timings of hoof contacts and lift offs were identified from the force plate data using a
207 threshold of 50 N. One complete stride was used from each successful trial between successive
208 right forelimb lift offs. Contralateral forelimb lift offs subdivided the stride into two diagonals;
209 LFRH was the left forelimb and right hindlimb pair, and RFLH was the right forelimb and left
210 hindlimb pair. Contacts of the diagonal pairs were classified as hind-first dissociation (also
211 known as positive diagonal advanced placement), synchronous (also known as zero diagonal
212 advanced placement) and fore-first dissociation (also known as negative diagonal advanced
213 placement). Dissociation time for each diagonal pair was the time elapsing between fore and
214 hind contacts, with the value of hind-first contacts being designated positive and fore-first
215 contacts being designated negative.
216
217 GRF and moments parameters
218 GRFs were summed and COM-COP separation at time of zero fore-aft horizontal force (Tzero)
219 identified for each step. Ground reaction force moments (MGRF) were calculated for each frame
220 of data by summing the moments due to GRF from each limb component multiplied by their
221 effective distance to the COM (Hobbs, Richards and Clayton, 2014), as defined in Eqn. 2. A sign
222 convention was established for moments, which is described when viewing the right side of the
223 horse in the sagittal plane. A clockwise (nose-down) rotation about the COM was considered as
224 positive and an anticlockwise (nose-up) rotation about the COM was considered negative. Tzero
225 indicated the transition between absorbing and generating phases and mean moments were
226 summed for each of these phases separately.
227 [2]vHlHvFlF GRFLlGRFVlGRFLlGRFVlMGRF
228 F = forelimb, H = hindlimb
229 GRFVll = vertical GRF multiplied by fore-aft horizontal distance from the limb COP to the COM
230 of the body
231 GRFLlv = fore-aft horizontal GRF multiplied by vertical distance from the limb COP to the COM
232 of the body
233
234 Mass distribution parameters
235 COM and body COP locations along the cranio-caudal axis for each frame of data, and fraction
236 of body weight on the forelimbs (Jz ratio), were calculated as reported by Hobbs, Richards and
237 Clayton (2014). The COM location was determined using the segmental method, as described in
238 Eqn. 3
239 [3]𝐶𝑂𝑀 =∑𝑛
25𝑚𝑑𝑀
240 where COM = COM location relative to the origin of the laboratory coordinate system (LCS)
241 (m)
242 m = segment mass (kg)
243 d = distance of the segment COM relative to the origin of the LCS (m)

244 M = mass of the horse (kg).
245
246 The body COP location (m) was determined by taking moments relative to the origin of the LCS,
247 as described in Eqn. 4
248 [4]𝐶𝑂𝑃 =(𝐺𝑅𝐹𝑉𝑙𝑙𝐹 + 𝐺𝑅𝐹𝑉𝑙𝑙𝐻)
(𝐺𝑅𝐹𝑉𝐹 + 𝐺𝑅𝐹𝑉𝐻)
249
250 The Jz ratio was calculated for each stance phase as described in Eqn. 5
251 [5]𝐽𝑧𝑟𝑎𝑡𝑖𝑜 =𝐽𝑧𝐹𝐽𝑧
252 where JzF = forelimb vertical impulse
253 Jz = summed forelimb and hindlimb vertical impulses.
254
255 The distance between the COM and COP was designated positive when the COM was ahead of
256 (cranial to) the COP. Mean body COM and COP locations during each step were calculated
257 using the ratio of the distance to the forelimb COP at Tzero divided by the distance between the
258 forelimb and hindlimb COPs at Tzero (Hobbs and Clayton, 2013). This provided relative COM
259 and body COP locations.
260
261 Postural parameters
262 Limb angle was measured for each frame of data from the vertical to the line between the
263 proximal and distal markers on the forelimb and hindlimb in the sagittal plane of the lab
264 coordinate system. Limb retraction with the distal marker caudal to the proximal marker was
265 designated positive. Limb protraction with the distal marker cranial to the proximal marker was
266 designated negative (see Figure 2). Trunk inclination was calculated as rotation about the trunk
267 transverse axis in the lab coordinate system with nose-down from the horizontal as positive.
268
269 Speed parameters
270 The COM velocity was determined from the first derivatives of COM location. Relative (non-
271 dimensional) COM velocity was calculated as,
272 [6]𝑉𝑟 =𝑉
(𝑙𝑔)0.5
273 where V = velocity (ms-1)
274 l = standing height (m)
275 g = 9.81 (ms-2; acceleration of gravity).
276
277 Collisional parameters
278 Collisional angles were determined from the difference between the COM velocity angle and the
279 orthogonally offset summed GRF angle in the sagittal plane as absolute values for each frame of
280 data. Absorption angles (ϕ-) and generation angles (ϕ+) for each frame were negated, as collision
281 angles are considered to be non-negative (Ruina, Bertram and Srinivasan, 2005). In dynamics a
282 collision is defined simply as a discontinuity in the COM path (Bertram, 2013). Although
283 collision losses are most easily visualized when considering passive interaction between
284 colliding objects, active deflection of the COM due to actuation by the limbs during the
285 generative phase of the stride does involve collision losses. In this case, however, the metabolic
286 investment results in a net energy increase of the system. Net deflection (ϕ) over a step was
287 calculated from (Ruina, Bertram and Srinivasan, 2005) by summing mean absorption and mean
288 generation angles.
289 [7]∅ = ∅ -+ ∅ +
290
291 Data Analysis
292 For each step from forelimb lift off to the next forelimb lift off, mean values were calculated and
293 tabulated for speed, Jz ratio, COM and COP location and trunk inclination. Mean values during
294 absorption and generation were calculated for MGRF and collision angles. Net deflection was
295 calculated as described in Eqn. 7. Vertical GRF for the forelimbs and hindlimbs were integrated
296 to obtain mean impulse. Metric values extracted at Tzero were the separation between the COM
297 and body COP locations in the fore-aft direction and MGRF. Peak vertical GRF was determined
298 and time to peak GRF was expressed as a % stance (individual limb) or % diagonal stance (limb
299 pair). Trunk ROM was determined as the difference between minimum and maximum trunk
300 inclination over the step. All calculations were performed in Visual 3D Professional v5.01.6 (C-
301 Motion Inc.).
302
303 Metrics were imported into SPSS (IBM Corp.) for analysis. Data were tested for normality using
304 a Kolmogorov–Smirnov test and were found to be normally distributed for speed-matched data.
305 Simple bootstrapping was used on the speed range data, as the majority of parameters were not
306 normally distributed. From the speed-matched dataset a 3x2 ANOVA was used to determine
307 differences between dissociations (hind-first, synchronous, fore-first; combining data for the left
308 and right diagonals) and diagonals (LFRH, RFLH; combining data for the three types of
309 dissociations) for each variable separately with Bonferroni post hoc testing on significant
310 differences in dissociation. Moderate to strong relationships (R>0.55) between dissociation time
311 and locomotion parameters, and relative COM velocity and locomotion parameters, were
312 identified and compared between datasets. This was carried out using Pearson’s correlation for
313 the speed-matched dataset and using Partial correlation, controlling for horse for the speed-range
314 dataset. Significance was set at P <.05.
315
316 Results
317 The frequencies of the different categories of diagonal dissociation in the speed-matched and
318 speed-range data are shown in Table 1. For the speed-matched data, horses either contributed
319 two hind first diagonals, two fore-first diagonals, two synchronous diagonals, one hind-first and
320 one synchronous diagonal or one fore-first and one synchronous diagonal. The ensemble
321 averages (mean ± s.d.) of each parameter from the speed-matched data in Table 2 are separated
322 according to dissociation category (hind-first, synchronous, fore-first) and diagonal (LFRH,
323 RFLH). Absolute variation in mean speed between diagonals for each trial was 0.03 ± 0.02 ms-1
324 indicating that these runs, though unconstrained, were as close to steady state as possible.
325
326 For speed-matched data the ANOVA found significant (P<.05) differences between dissociation
327 categories for 4 functional parameters (peak vertical hindlimb GRF, net deflection, mean
328 absorbing angle, time to peak vertical forelimb GRF (% diagonal stance)), 3 postural parameters
329 (mean forelimb angle, mean hindlimb angle, mean trunk inclination) and 4 balance parameters
330 (mean COP location, COM-COP separation at Tzero, MGRF at Tzero, MGRF during
331 absorption). Of those, significant differences between all three dissociation categories were
332 found for only one parameter, mean COP location (hind-first vs synchronous; P<.001, hind-first
333 vs fore-first; P<.001, synchronous vs fore-first; P=.006). Figure 3 shows temporal data of
334 significant parameters for one step for one horse producing hind-first, one horse producing

335 synchronous and one horse producing fore-first dissociation. No significant differences (P>.05)
336 were found for diagonal (LFRH versus RFLH) and there were no significant interactions (P>.05)
337 between type of dissociation and diagonal. In the speed-matched data horses with hind-first
338 dissociation tended to have more protracted mean limb angles together with a more rearward
339 location of the COP and vice versa for fore-first dissociation (Table 2).
340
341 The velocity of the speed-range dataset was between 2.43 and 4.23 ms-1. Relationships between
342 locomotion parameters, dissociation time and relative COM velocity that were moderate to
343 strong (R>.55) for either dataset are shown in Table 3 and Figure 4. The relationship between
344 dissociation time and relative COM velocity for speed-matched data was R=.119 and for the
345 speed range data was R=.774. Mean COP location had the strongest relationship with
346 dissociation time when data were speed-matched, but also had a strong relationship with relative
347 COM velocity over the speed range (Table 3). MGRF at Tzero, MGRF during absorption and
348 mean hind limb angle shared only moderate relationships with the speed-matched dataset,
349 whereas trunk inclination had moderate relationships in both datasets. Conversely, forelimb
350 vertical GRF had a strong relationship with dissociation time over the speed range (R=.594;
351 P<.01) but not when speed-matched (R=.145; P>.05). Although only small differences in speed
352 were recorded between horses in the speed-matched dataset, fore and hindlimb impulses were
353 still found to have moderate to strong relationships with relative COM velocity, (with forelimb
354 impulses just outside of the threshold criteria). None of the other functional, postural or balance
355 parameters had moderate to strong relationships in either dataset. Figure 5 depicts mean COP
356 location against relative COM velocity for the speed-range data showing the dissociations used
357 by each horse for each step.

358
359 Discussion
360 This study investigated the effects of diagonal dissociation on locomotion parameters related to
361 function, posture and balance in horses trotting at the same speed and across a modest range of
362 naturally occurring trotting speeds. We hypothesised that; 1) hind-first dissociation would
363 increase with speed, 2) diagonal dissociation would reduce collisional energy losses, and 3)
364 within horse dissociation predominance would be evident at preferred trotting speed. Mean COP
365 location varied with dissociation in horses trotting at the same speed. The COP location also
366 changed with increasing speed, accompanied by an increase in peak forelimb vertical force.
367 Hypothesis 1) was partially supported, as hind-first dissociation increased with speed, but
368 between horse variations in dissociation pattern could be contributing to this finding. Hypothesis
369 2) was partially supported since net collisional losses were reduced during absorption when hind-
370 first was compared to synchronous dissociation at the same trotting speed. There was some
371 evidence to support within horse dissociation predominance (hypothesis 3), but further work is
372 needed to clarify this as a strong relationship is evident between speed and dissociation time.
373
374 For a cursorial mammal with relatively long limbs, a high COM position, and limbs that move
375 primarily in a parasagittal plane, balancing pitching moments will be an important stability
376 consideration. There are three fundamental motor control strategies available to accomplish this.
377 These are adjustments of i) relative fore-aft contact timing, i.e. diagonal dissociation (as shown
378 by Weishaupt et al. (2009)); ii) foot contact position (Lee, Bertram and Todhunter, 1999); and
379 iii) fore-aft vertical force distribution (Lee, Bertram and Todhunter, 1999). The first successful
380 trotting quadrupedal robot utilized a control strategy with synchronized diagonal contacts with

381 equal fore-aft contact forces and adjusted contact position to maintain fore-aft stability (Raibert,
382 1986, 1990). In trotting dogs, Lee, Bertram and Todhunter, (1999) found that moderate fore-aft
383 moments were balanced primarily by adjusting fore-aft contact forces with relatively consistent
384 fore-aft contact position. Lee, Bertram and Todhunter, (1999) also found that subtle differences
385 in contact timing could be detected between breeds (Labrador retriever vs. greyhound) and
386 attributed this largely to differences in body form and mass distribution (a conclusion consistent
387 with experiments with quadrupedal robots, Raibert, 1990). The current study provides evidence
388 that horses subtly employ all three of these strategies when trotting at constant speed and that this
389 is likely linked to balance maintaining parameters.
390
391 The first strategy, diagonal dissociation, altered the mean COP location in horses trotting at the
392 same speed (Table 2). The subtle difference in timing at the beginning of the stance phase
393 changed the inter-limb timing of force production and consequently the relative fore-hind force
394 contributions throughout stance. The mean COM location, which can also influence force
395 distribution patterns, was not different with dissociation. Alexander (2002) suggested that
396 dynamic stability in quadrupeds may be achieved by altering the timing of peak force production
397 within limbs, thereby changing the effective value of the distance from the COM to that limb.
398 The temporal parameters (Table 2) show that the timing of peak force production is only altered
399 in hind-first dissociation in which peak forelimb force occurs later during diagonal stance. This
400 affects the COP location by causing a more gradual change in ratio towards the forelimb (Figure
401 3). Dissociation has also been shown to change with lameness. When inducing a fore hoof
402 lameness, fore-first dissociation time increased progressively with the degree of lameness on
403 both diagonals (Buchner et al., 1995). In mild to moderate forelimb induced lameness, increasing

404 forelimb stance duration was found to be the main mechanism that the horse uses to reduce
405 GRFV whilst maintaining impulse (Weishaupt et al., 2006). The effect of dissociation time on
406 balance in lame horses is yet to be fully explored.
407
408 The second strategy was also evident at constant speed, as forelimb and hindlimb mean angles
409 varied between dissociations. For hind-first dissociation there was a tendency for both limbs to
410 be more protracted which allows the hindlimb to step further under the body at contact and the
411 forelimb to leave the ground in a more vertically oriented position at lift off. Horses with fore-
412 first dissociation appeared to adopt a more ‘falling forwards’ posture, as COM-COP separation at
413 Tzero was more positive for fore-first dissociation and mean limb angles were more retracted
414 compared to hind-first dissociation (Table 2). With this posture the COM and gravity may be
415 used to develop greater forward and downward moments prior to Tzero to balance the earlier
416 negative MGRF moments during braking. This difference is illustrated in Figure 3, where the
417 positive moments prior to Tzero were greater with fore-first dissociation. This strategy could be
418 likened to the theory of Pose® running in humans, where landing with a vertically aligned COM
419 and COP allows gravitational moments to be used as the main force that moves the COM
420 forwards (Romanov and Fletcher, 2007). Running economy was however not improved using
421 this technique compared to heel-toe running (Fletcher, Romanov and Bartlett, 2008). Further
422 work might consider whether oxygen consumption is optimized with predominant dissociation
423 patterns in trotting.
424
425 The first strategy, dissociation, also shifted as speed moderately increased. Although an increase
426 in speed need not involve a change in moment, provided speed is constant stride to stride, strong
427 correlations between dissociation time, speed and COP location were evident. The uneven fore-
428 aft mass distribution of the horse (with the majority of the mass carried by the fore quarters),
429 likely results in residual moments over the stride cycle that will be greater at faster trotting
430 speeds. One interpretation of the current result is that dissociation contributes to the mitigation of
431 these moments as speed increases, but the pattern of shift (from fore first to synchronous or
432 synchronous to hind first) will be dependent on the specific body proportions of the individual
433 (and also influenced by the particular subject’s reliance on aspects of the alternative strategies).
434
435 Peak force increased with speed in the forelimb (Figure 4), but not in the hindlimb, which was
436 also reported by Dutto et al. (2004) at moderate speeds. If dissociation was not used to increase
437 nose-down moments during absorption, then nose-up residual moments could accumulate and
438 challenge balance under these conditions. Other strategies to manage pitching moments are
439 reported when speed is increased beyond energy efficient thresholds (Hoyt and Taylor, 1991).
440 These include racing trotters moving at high speed which show a stronger relationship between
441 speed and peak vertical force in the hindlimbs compared to the forelimbs (Crevier-Denoix et al.,
442 2014). However, these horses were pulling a sulky which is likely to affect force generation and
443 distribution between limbs. Deuel and Park (1990) also reported a range of dissociations from
444 hind-first to fore-first in horses performing extended trot, so individual predominance is still
445 evident at higher speeds in highly trained horses. In order to produce a larger hindlimb force one
446 might expect the hindlimb would either be closer to the COM during peak force production (in
447 order to add vertical impulse to support body weight while limiting the contribution to pitching
448 moment) or that there would be an increase in limb stiffness thereby producing a larger reaction
449 at the ground. Increased hindlimb muscle activity at 6 ms-1 compared to slower trotting speeds
450 has been reported (Robert et al., 2002), which was attributed to applying greater force during hip
451 extension. This suggests that the third balancing strategy will be evident at higher speeds.
452
453 It has been argued that collision-like losses associated with the limbs deflecting the COM are
454 important in determining, and consequently in interpreting, gait dynamics (Bertram, 2013;
455 Bertram and Gutmann, 2009; Ruina, Bertram and Srinivasan, 2005). Despite the small
456 magnitude of the temporal dissociations of the footfalls, net collisional losses and collisional
457 losses during absorption were significantly greater with synchronous compared to hind-first
458 dissociations at the same speed. Hind-first dissociation also produced positive MGRF during
459 absorption. These findings illustrate the profound effects of limb sequencing, where individual
460 limbs can be thought of much like the spokes of a rolling rimless wheel which helps to distribute
461 the angular deflection changes, thereby reducing collisional losses (Ruina, Bertram and
462 Srinivasan, 2005). The advantages of limb sequencing in reducing collisional losses have mainly
463 been reported for gaits that have a sequential footfall pattern, cantering in ring tailed lemurs
464 (O’Neill and Schmidt, 2012), galloping in horses and cheetahs (Bertram and Gutmann, 2009),
465 and walking and galloping, but not trotting, in dogs and goats (Lee et al., 2011). Collisional
466 losses appear high during trotting (Lee et al., 2011), but total mechanical cost would likely be
467 even higher to move at the same speed with a different gait (if the equine trot functionally
468 resembles the human run; Srinivasan and Ruina, 2006). The trot is usually considered to have
469 synchronous diagonal contacts but our findings indicate that there is scope for collisional losses
470 in trot to be mitigated to some degree by diagonal dissociation.
471
472 Stabilizing the trunk also appears to be important in horses during trotting, as a very small trunk
473 ROM was found in this study, which concurs with Dunbar et al. (2008) and Buchner Obermüller
474 and Scheidl (2000). In the quest for spinal stability during trotting, the epaxial and hypaxial
475 muscles are activated to reduce vertical thoracic and lumbar spinal excursions (Robert et al.,
476 2002), while splenius and semispinalis capitis provide postural stability of the cervical spine
477 (Gellman et al., 2002). Diagonal dissociations may then be used to manage COP excursions,
478 which minimize pitching moments to provide rotational stability. In human walking it was
479 suggested that trunk angular momentum is highly regulated by the central nervous system
480 (Popovic, Hofmann and Herr, 2004). Based on our findings, quadrupedal trotting may have
481 similar requirements. Trunk inclination was influenced by speed; when speed increased the mean
482 trunk angle increased slightly to a more nose-up posture. However, a relationship between trunk
483 inclination and dissociation time was also evident in the speed-matched dataset, so hind-first
484 dissociations were also associated with a more nose-up trunk posture. Weishaupt et al. (2009)
485 found an association between a more elevated head and neck position and increased hind-first
486 dissociation time when comparing passage to collected trot. In this case passage was performed
487 at a slower speed than collected trot, so an inverse relationship was evident compared to the
488 speed-range dataset. It is also interesting to note that trunk inclination in Greyhounds compared
489 to Labrador Retrievers is likely to vary with dissociation pattern in a similar manner (Bertram et
490 al., 2000). Further work is needed to investigate motor control strategies used in horses
491 performing higher level movements.
492
493 One of the study aims was to evaluate potential reasons for adopting a predominant diagonal
494 dissociation pattern within an individual horse. The choice of preferred speed may influence the
495 habitual dissociation pattern used by the individual and this may also relate to maximizing
496 energy efficiency at that speed whilst maintaining pitch stability. Inter-breed differences in peak
497 vertical forelimb GRF between Warmbloods and Quarter Horses have been attributed to
498 conformation and gait differences (Back et al., 2007). It is likely that diagonal dissociation will
499 also vary in those breeds, although from this study it appears that dynamic rather than static
500 posture is a more important determinant. Given the multiple strategies available to the animal
501 and the subtle relationship between them identified in this study, it is evident that more work is
502 needed in horses and other species to confirm this observation. In addition, this study only
503 covered a moderate range of speeds occurring within the natural (energy efficient) range for
504 trotting horses (Hoyt and Taylor, 1991). Different force production patterns have been reported
505 at higher speeds in harness horses (Crevier-Denoix et al., 2014) suggesting that further work is
506 needed to investigate the mechanical effects at speeds beyond those performed by the general
507 equine population.
508
509 Conclusions
510 Dissociation patterns vary between horses trotting at the same speed, but speed and dissociation
511 time are also intrinsically linked. When comparing data within and across a range of speeds
512 subtle differences in dissociation could be explored to investigate why individual horses use
513 different dissociation patterns. The evidence presented suggests that at moderate speeds horses
514 use dissociation to maintain trunk pitch stability by managing the COP location. This is likely
515 due to body proportion differences but could also be influenced by the motor control strategy
516 utilized by the individual animal. Both hind-first and fore-first dissociations may have
517 mechanical advantages over synchronous contacts in certain circumstances. As trotting speed

518 increases, forelimb vertical peak force increases and dissociations tend towards hind-first,
519 principally to shift the COP caudally and control trunk pitching moments.
520
521 Acknowledgements
522 The authors thank LeeAnn Kaiser, Lila Zarski and Narelle Stubbs for assistance in collecting
523 data for this study. The authors also would like to thank the reviewers of this manuscript for their
524 constructive comments.
525
526 References
527 Alexander RM. 2002. Stability and manoeuvrability of terrestrial vertebrates. Integrated and
528 Comparative Biology 42:158-164.
529 Alexander RM. 1984. The gaits of bipedal and quadrupedal animals. International Journal of
530 Robotics Research 3:49-59.
531 Anon 1991. Guide for Veterinary Service and Judging of Equestrian Events 4th edn. American
532 Association of Equine Practitioners, Lexington, 19.
533 Back W, MacAllister CG, Van Heel MCG, Pollmeier M and Hanson P D. 2007. Vertical
534 frontlimb ground reaction forces of sound and lame Warmbloods differ from those in Quarter
535 Horses. Journal of Equine Veterinary Science 27:3:123-129.
536 Bertram JEA. 2013. Gait as solution, but what is the problem? Exploring cost, economy and
537 compromise in locomotion. Veterinary Journal Supplement 198:e3-e8.
538 Bertram JEA and Gutmann A. 2009. Motions of the running horse and cheetah revisited:
539 fundamental mechanics of the transverse and rotary gallop. Journal of the Royal Society
540 Interface 6:549-559.

541 Bertram JEA, Lee DV, Case HN and Todhunter RJ. 2000. Comparison of the trotting gaits of
542 Labrador Retrievers and Greyhounds. American Journal of Veterinary Research 61:7:832-838.
543 Buchner HHF, Obermüller S and Scheidl M. 2000. Body Centre of Mass Movement in the
544 Sound Horse. Veterinary Journal 160:225-234.
545 Buchner HHF, Savelberg HHCM, Schamhardt HC, and Barneveld A. 1995. Temporal stride
546 patterns in horses with experimentally induced fore- and hindlimb lameness. Equine Veterinary
547 Journal Supplement 18:161–165.
548 Cappello A, Cappozzo A, La Palombara PF, Lucchetti L and Leardini A. 1997. Multiple
549 anatomical landmark calibration for optimal bone pose estimation. Human Movement Science
550 16:259-274.
551 Clayton HM. 1994. Comparison of the stride kinematics of the collected, working, medium, and
552 extended trot. Equine Veterinary Journal 26:230-234.
553 Crevier-Denoix N, Camus M, Pourcelot P, Pauchard M, Falala S, Ravary-Plumioen B, Denoix J,
554 Desquilbet L and Chateau H. 2014. Effect of speed on stride parameters and limb loading:
555 comparison between forelimb and hindlimb at training trot on a firm surface. Equine Veterinary
556 Journal Supplement 46:38.
557 Deuel NR and Park JJ. 1990. The gait patterns of Olympic dressage horses. International
558 Journal of Sports Biomechanics 6:198-226.
559 Drevemo S, Dalin G, Fredricson I. and Hjendn G. 1980 Equine locomotion: I. The analysis of
560 linear and temporal stride characteristics of trotting Standardbreds. Equine Veterinary Journal
561 12:60-65.
562 Duel NR and Park J-J (1990). The gait patterns of Olympic dressage horses. International
563 Journal of Sports Biomechanics 6:198-226.

564 Dunbar DC, Macpherson JM, Simmons RW and Zarcades A. 2008. Stabilization and mobility of
565 the head, neck and trunk in horses during overground locomotion: comparisons with humans and
566 other primates. Journal of Experimental Biology 211:3889-3907.
567 Dutto DJ, Hoyt DF, Cogger EA and Wickler SJ. 2004. Ground reaction forces in horses trotting
568 up an incline and on the level over a range of speeds. Journal of Experimental Biology 207:3507-
569 3514.
570 Fédération Equestre Internationale. 2014. Passage. In: Dressage Rules. 25th Edn. Switzerland.
571 22.
572 Fletcher G, Romanov NS and Bartlett RM. (2008). Pose® method technique improves running
573 performance without economy changes. International Journal of Sports Science and Coaching
574 3:365-380.
575 Gellman KS, Bertram JEA and Hermanson JW. 2002. Morphology, Histochemistry, and
576 Function of Epaxial Cervical Musculature in the Horse (Equus caballus). Journal of Morphology
577 251:182-194.
578 Hildebrand M. 1965. Symmetrical gaits of horses. Science 150:701-708.
579 Hildebrand M. 1985. Walking and running. In: Hildebrand M, Bramble DM, Liem KF and Wake
580 DB, ed. Functional Vertebrate Morphology. Cambridge, London: Belknap Harvard, 38-57.
581 Hobbs SJ and Clayton HM. 2013. Sagittal plane ground reaction forces, centre of pressure and
582 centre of mass in trotting horses. Veterinary Journal Supplement 198:1:e14-e19.
583 Hobbs SJ, Richards J and Clayton HM. 2014. The effect of centre of mass location on sagittal
584 plane moments around the centre of mass in trotting horses. Journal of Biomechanics 47:6:1278-
585 1286.

586 Holmström M, Fredricson I and Drevemo S. 1994. Biokinematic differences between riding
587 horses judged as good and poor at the trot. Equine Veterinary Journal 26:51–56.
588 Holmström M, Fredricson I and Drevemo S. 1995. Variation in angular pattern adaptation from
589 trot in hand to passage and piaffe in the Grand Prix dressage horse. Equine Veterinary Journal
590 Supplement 18:132-137.
591 Hoyt DF and Taylor CR. 1991. Gait and the energetic of locomotion in horses. Nature 292:239-
592 240.
593 Lee DV, Bertram JEA and Todhunter RJ. 1999. Acceleration and balance in trotting dogs.
594 Journal of Experimental Biology 202:3565-3573.
595 Lee DV, Bertram JEA, Anttonen JT, Ros IG, Harris SL and Biewener AA. 2011. A collisional
596 perspective on quadrupedal gait dynamics. Journal of the Royal Society Interface 8:1480-1486.
597 Nauwelaerts S and Clayton HM. 2009. Trunk deformation in the trotting horse. Equine
598 Veterinary Journal 41:3:203-206.
599 O’Neill MC and Schmitt D. 2012. The gaits of primates: center of mass mechanics in walking,
600 cantering and galloping ring-tailed lemurs, Lemur catta. Journal of Experimental Biology
601 215:1728-1739.
602 Popovic M, Hofmann A and Herr H. 2004. Angular momentum regulation during human
603 walking: Biomechanics and control. Proceedings of the 2004 IEEE International Conference on
604 Robotics & Automation, New Orleans, LA, April 2004. pp 2405-2411.
605 Raibert MH. 1986. Legged robots that balance. Cambridge, MA: MIT Press.
606 Raibert MH. 1990. Trotting, pacing and bounding by a quadrupedal robot. Journal of
607 Biomechanics 23:79-98.
608 Robert C, Valette J-P, Pourcelot P, Audigié F and Denoix J-M. 2002. Effects of trotting speed on
609 muscle activity and kinematics in saddlehorses. Equine Veterinary Journal Supplement 34:295-
610 301.
611 Romanov N and Fletcher G. 2007. Runners do not push off the ground but fall forwards via a
612 gravitational torque. Sports Biomechanics 6:3:434-452.
613 Ruina A, Bertram JEA and Srinivasan M. 2005. A collisional model of the energetic cost of
614 support work qualitatively explains leg sequencing in walking and galloping, pseudo-elastic leg
615 behaviour in running and the walk-to-run transition. Journal of Theoretical Biology 237: 170-
616 192.
617 Srinivasan M and Ruina A. 2006. Computer optimization of a minimal biped discovers walking
618 and running. Nature 439:72-75.
619 Ting LH, Blickhan R and Full RJ. 1994. Dynamic and static stability in hexepedal runners.
620 Journal of Experimental Biology 197:251–269.
621 Weishaupt MA, Wiestner T, Hogg HP, Jordan P and Auer JA. 2006. Compensatory load
622 redistribution of horses with induced weight-bearing forelimb lameness trotting on a treadmill.
623 Veterinary Journal 171:135-146.
624 Weishaupt MA, Byström K, Von Peinen T, Weistner H, Meyer H, Waldern N, Johnston C, Van
625 Weeren R and Roepstorff L. 2009. Kinetics and kinematics of the passage. Equine Veterinary
626 Journal 41:3:263-267.
627 Weishaupt MA, Hogg HP, Auer JA and Wiestner T. 2010. Velocity-dependent changes of time,
628 force and spatial parameters in Warmblood horses walking and trotting on a treadmill. Equine
629 Veterinary Journal Supplement 42:s38:530-537.
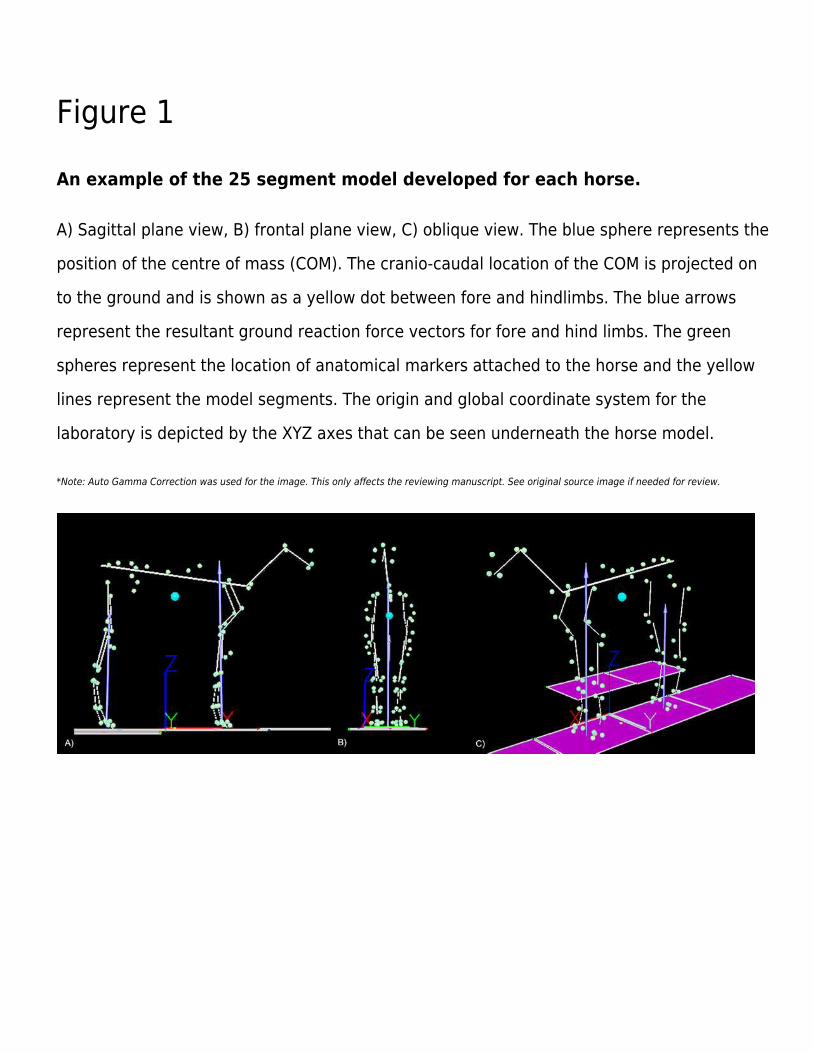
Figure 1
An example of the 25 segment model developed for each horse.
A) Sagittal plane view, B) frontal plane view, C) oblique view. The blue sphere represents the
position of the centre of mass (COM). The cranio-caudal location of the COM is projected on
to the ground and is shown as a yellow dot between fore and hindlimbs. The blue arrows
represent the resultant ground reaction force vectors for fore and hind limbs. The green
spheres represent the location of anatomical markers attached to the horse and the yellow
lines represent the model segments. The origin and global coordinate system for the
laboratory is depicted by the XYZ axes that can be seen underneath the horse model.
*Note: Auto Gamma Correction was used for the image. This only affects the reviewing manuscript. See original source image if needed for review.
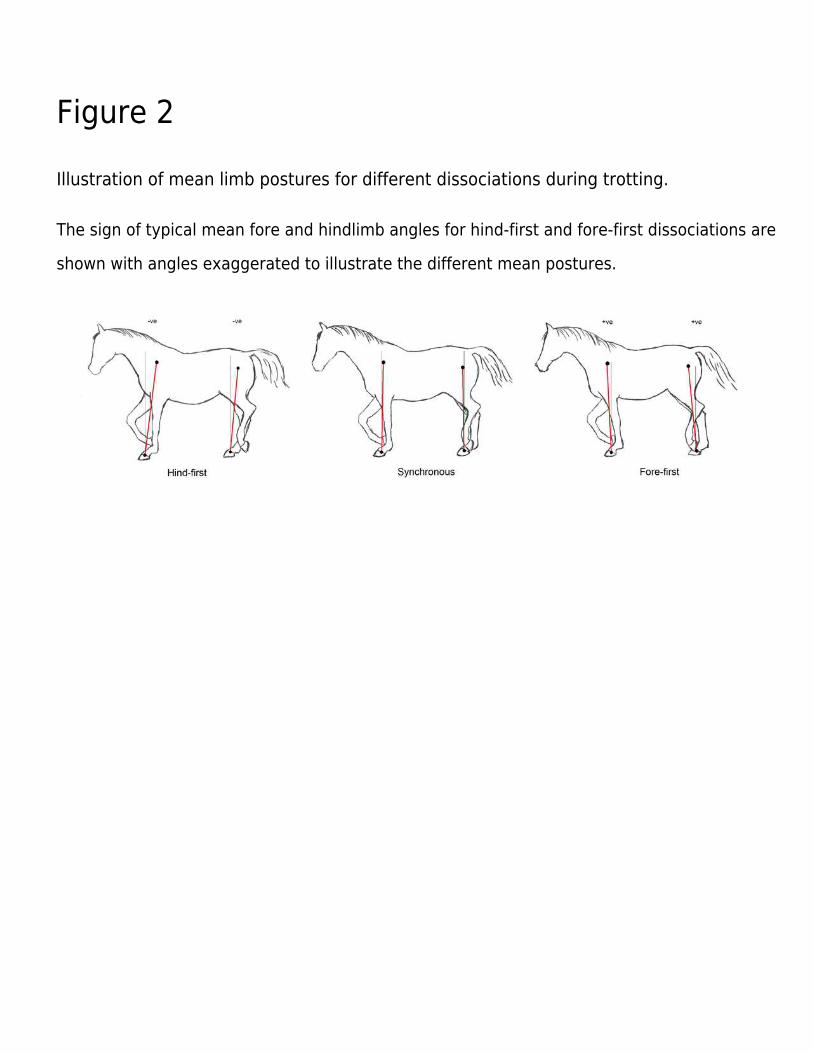
Figure 2
Illustration of mean limb postures for different dissociations during trotting.
The sign of typical mean fore and hindlimb angles for hind-first and fore-first dissociations are
shown with angles exaggerated to illustrate the different mean postures.

Figure 3
Examples of significant parameters from typical hind-first, synchronous and fore-first
dissociation patterns when speed-matched.
A) Relative COM and COP location from the forelimb COP position at Tzero; B) Vertical (GRFV)
and longitudinal (GRFL) GRFs for the fore and hindlimbs (N/kg); C) total and fore and hindlimb
components of ground reaction force moments (MGRF) (Nm/kg); D) GRF collision angle,
velocity collision angle and net deflection (rad); E) Fore and hindlimb angles and trunk
inclination (degrees).
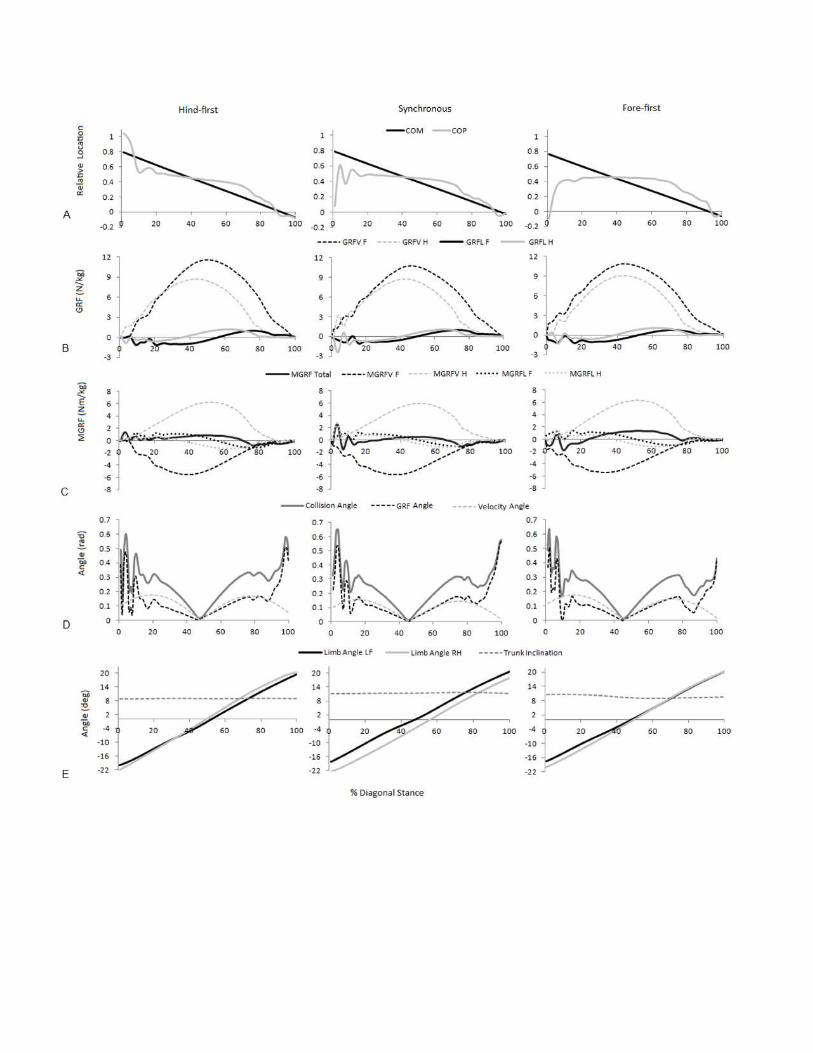
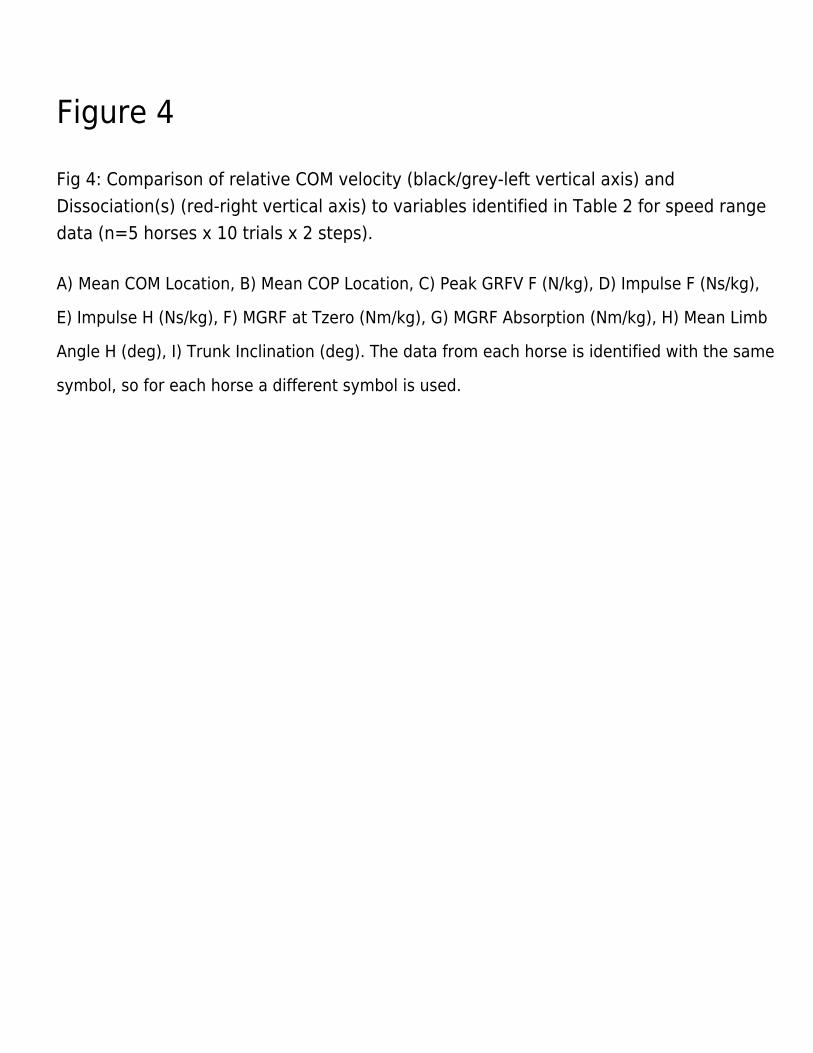
Figure 4
Fig 4: Comparison of relative COM velocity (black/grey-left vertical axis) and
Dissociation(s) (red-right vertical axis) to variables identified in Table 2 for speed range
data (n=5 horses x 10 trials x 2 steps).
A) Mean COM Location, B) Mean COP Location, C) Peak GRFV F (N/kg), D) Impulse F (Ns/kg),
E) Impulse H (Ns/kg), F) MGRF at Tzero (Nm/kg), G) MGRF Absorption (Nm/kg), H) Mean Limb
Angle H (deg), I) Trunk Inclination (deg). The data from each horse is identified with the same
symbol, so for each horse a different symbol is used.


Figure 5
Comparison of relative COM velocity to COP location for speed range data (n=5 horses x
10 trials x 2 steps).
Each step is classified with respect to its dissociation using colours where black = fore-first,
red = synchronous and blue = hind-first. The data from each horse is identified with the
same symbol, so for each horse a different symbol is used.
Table 1(on next page)
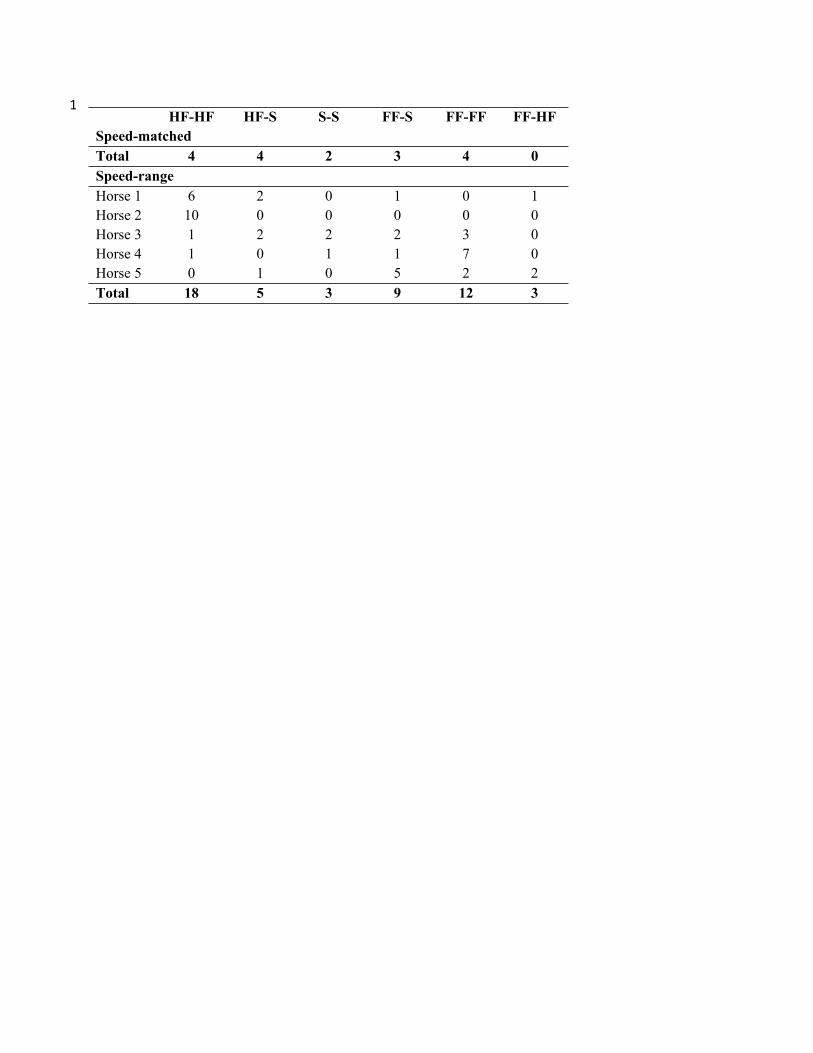
Number of LFRH-RFLH footfalls in each dissociation classification for speed-matched and
speed-range datasets.
HF-HF = both hind-first; HF-S = one hind-first and one synchronous; S-S = both synchronous;
FF-S = one fore-first and one synchronous; FF-FF = both fore-first; HF-FF = one hind-first and
one fore-first.
1
HF-HF HF-S S-S FF-S FF-FF FF-HF
Speed-matched
Total 4 4 2 3 4 0
Speed-range
Horse 1 6 2 0 1 0 1
Horse 2 10 0 0 0 0 0
Horse 3 1 2 2 2 3 0
Horse 4 1 0 1 1 7 0
Horse 5 0 1 0 5 2 2
Total 18 5 3 9 12 3
Table 2(on next page)
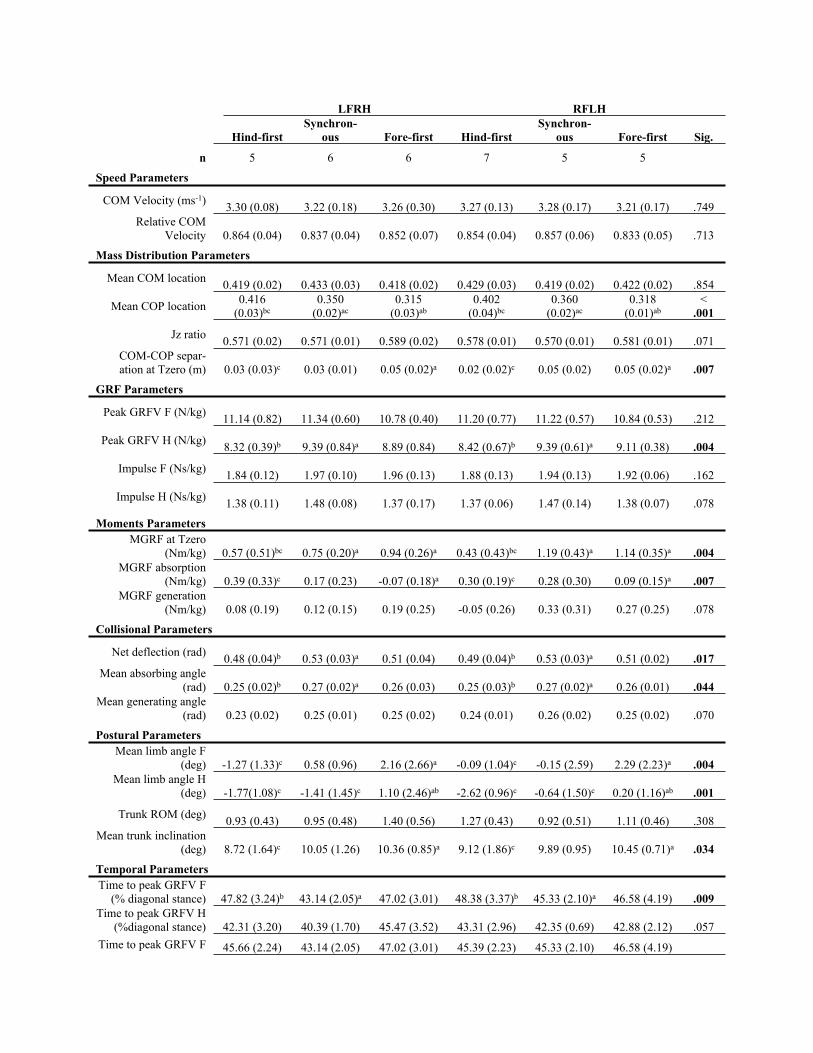
Locomotion parameters grouped by dissociation category and diagonal (speed-
matched, n = 17 horses).
No significant differences were found for diagonal. No interactions between dissociation and
diagonal were found. Significance (Sig.) for each parameter between dissociation
classifications is given, with significant differences (P<.05) highlighted in bold. Superscript
letters denote Post hoc comparisons between dissociation pairs, where a = significantly
different (P<.05) to hind-first; b = significantly different (P<.05) to synchronous; and c =
significantly different (P<.05) to fore-first.
LFRH RFLH
Hind-first
Synchron-
ous Fore-first Hind-first
Synchron-
ous Fore-first Sig.
n 5 6 6 7 5 5
Speed Parameters
COM Velocity (ms-1)3.30 (0.08) 3.22 (0.18) 3.26 (0.30) 3.27 (0.13) 3.28 (0.17) 3.21 (0.17) .749
Relative COM
Velocity 0.864 (0.04) 0.837 (0.04) 0.852 (0.07) 0.854 (0.04) 0.857 (0.06) 0.833 (0.05) .713
Mass Distribution Parameters
Mean COM location 0.419 (0.02) 0.433 (0.03) 0.418 (0.02) 0.429 (0.03) 0.419 (0.02) 0.422 (0.02) .854
Mean COP location0.416
(0.03)bc
0.350
(0.02)ac
0.315
(0.03)ab
0.402
(0.04)bc
0.360
(0.02)ac
0.318
(0.01)ab
<
.001
Jz ratio0.571 (0.02) 0.571 (0.01) 0.589 (0.02) 0.578 (0.01) 0.570 (0.01) 0.581 (0.01) .071
COM-COP separ-
ation at Tzero (m) 0.03 (0.03)c 0.03 (0.01) 0.05 (0.02)a 0.02 (0.02)c 0.05 (0.02) 0.05 (0.02)a .007
GRF Parameters
Peak GRFV F (N/kg)11.14 (0.82) 11.34 (0.60) 10.78 (0.40) 11.20 (0.77) 11.22 (0.57) 10.84 (0.53) .212
Peak GRFV H (N/kg)8.32 (0.39)b 9.39 (0.84)a 8.89 (0.84) 8.42 (0.67)b 9.39 (0.61)a 9.11 (0.38) .004
Impulse F (Ns/kg)1.84 (0.12) 1.97 (0.10) 1.96 (0.13) 1.88 (0.13) 1.94 (0.13) 1.92 (0.06) .162
Impulse H (Ns/kg)1.38 (0.11) 1.48 (0.08) 1.37 (0.17) 1.37 (0.06) 1.47 (0.14) 1.38 (0.07) .078
Moments Parameters
MGRF at Tzero
(Nm/kg) 0.57 (0.51)bc 0.75 (0.20)a 0.94 (0.26)a 0.43 (0.43)bc 1.19 (0.43)a 1.14 (0.35)a .004
MGRF absorption
(Nm/kg) 0.39 (0.33)c 0.17 (0.23) -0.07 (0.18)a 0.30 (0.19)c 0.28 (0.30) 0.09 (0.15)a .007
MGRF generation
(Nm/kg) 0.08 (0.19) 0.12 (0.15) 0.19 (0.25) -0.05 (0.26) 0.33 (0.31) 0.27 (0.25) .078
Collisional Parameters
Net deflection (rad)0.48 (0.04)b 0.53 (0.03)a 0.51 (0.04) 0.49 (0.04)b 0.53 (0.03)a 0.51 (0.02) .017
Mean absorbing angle
(rad) 0.25 (0.02)b 0.27 (0.02)a 0.26 (0.03) 0.25 (0.03)b 0.27 (0.02)a 0.26 (0.01) .044
Mean generating angle
(rad) 0.23 (0.02) 0.25 (0.01) 0.25 (0.02) 0.24 (0.01) 0.26 (0.02) 0.25 (0.02) .070
Postural Parameters
Mean limb angle F
(deg) -1.27 (1.33)c 0.58 (0.96) 2.16 (2.66)a -0.09 (1.04)c -0.15 (2.59) 2.29 (2.23)a .004
Mean limb angle H
(deg) -1.77(1.08)c -1.41 (1.45)c 1.10 (2.46)ab -2.62 (0.96)c -0.64 (1.50)c 0.20 (1.16)ab .001
Trunk ROM (deg)0.93 (0.43) 0.95 (0.48) 1.40 (0.56) 1.27 (0.43) 0.92 (0.51) 1.11 (0.46) .308
Mean trunk inclination
(deg) 8.72 (1.64)c 10.05 (1.26) 10.36 (0.85)a 9.12 (1.86)c 9.89 (0.95) 10.45 (0.71)a .034
Temporal Parameters
Time to peak GRFV F
(% diagonal stance) 47.82 (3.24)b 43.14 (2.05)a 47.02 (3.01) 48.38 (3.37)b 45.33 (2.10)a 46.58 (4.19) .009
Time to peak GRFV H
(%diagonal stance) 42.31 (3.20) 40.39 (1.70) 45.47 (3.52) 43.31 (2.96) 42.35 (0.69) 42.88 (2.12) .057
Time to peak GRFV F 45.66 (2.24) 43.14 (2.05) 47.02 (3.01) 45.39 (2.23) 45.33 (2.10) 46.58 (4.19)

(% stance) .103
Time to peak GRFV H
(% stance) 44.73 (3.01) 44.13 (0.86) 46.30 (3.28) 45.97 (2.33) 45.37 (2.29) 44.28 (1.53) .790
1
Table 3(on next page)
Comparison of moderate to strong relationships of locomotor parameters to dissociation
time and speed for speed matched and speed-range data.
Correlation coefficients for speed-matched data (Pearson correlations, n = 17 horses x 1
stride per horse) compared to speed range data (Partial correlation controlling for horse, n =
5 horses x 10 strides per horse) where a moderate to strong (R<.55) relationship was found
in either dataset.
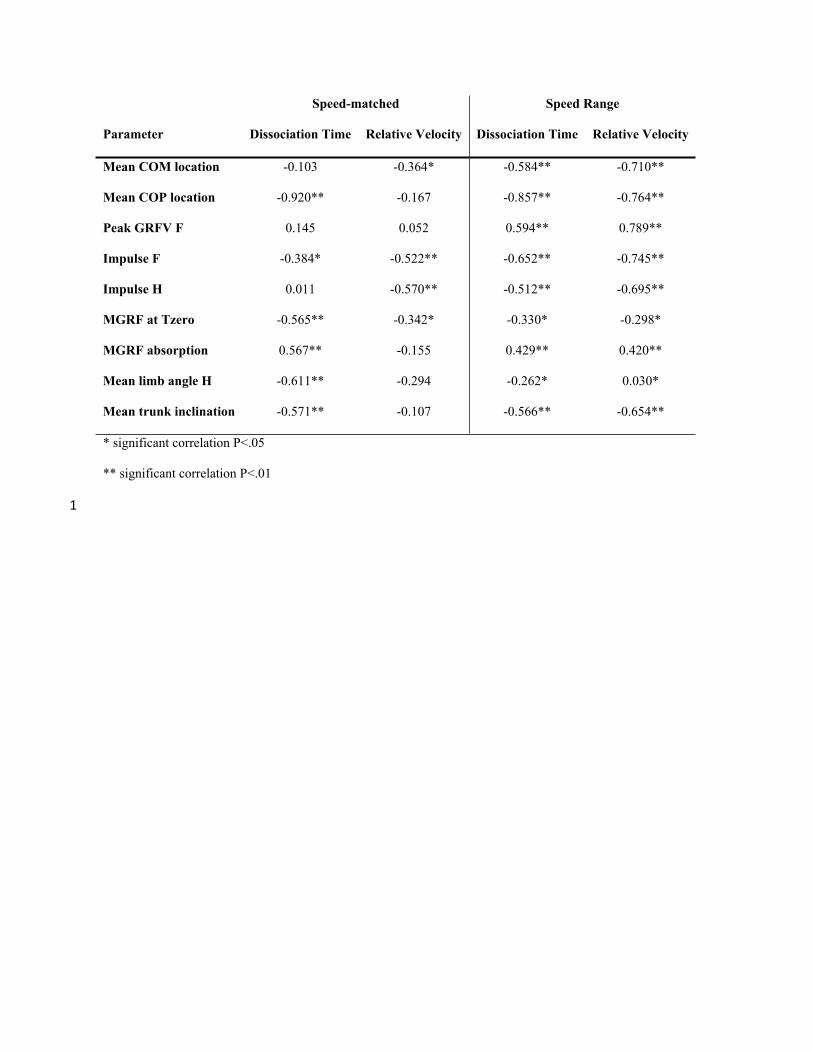
Speed-matched Speed Range
Parameter Dissociation Time Relative Velocity Dissociation Time Relative Velocity
Mean COM location -0.103 -0.364* -0.584** -0.710**
Mean COP location -0.920** -0.167 -0.857** -0.764**
Peak GRFV F 0.145 0.052 0.594** 0.789**
Impulse F -0.384* -0.522** -0.652** -0.745**
Impulse H 0.011 -0.570** -0.512** -0.695**
MGRF at Tzero -0.565** -0.342* -0.330* -0.298*
MGRF absorption 0.567** -0.155 0.429** 0.420**
Mean limb angle H -0.611** -0.294 -0.262* 0.030*
Mean trunk inclination -0.571** -0.107 -0.566** -0.654**
* significant correlation P<.05
** significant correlation P<.01
1
Related Documents