An exploration of streamflow and water chemistry patterns in urban waters US Geological Survey: Virginia and West Virginia Water Science Center [email protected] Aaron J Porter Hydrologist Fairfax County Monitoring Objectives 1. Determine how streamflow, water-quality, and benthic macroinvertebrates vary spatially (across monitored watersheds) and temporally (seasonally/annually) 2. Compute annual nutrient and sediment loads and analyze trends 3. Link changes in streamflow, water-quality, and benthic macroinvertebrates to changes in the landscape (e.g. development, BMPs)

Welcome message from author
This document is posted to help you gain knowledge. Please leave a comment to let me know what you think about it! Share it to your friends and learn new things together.
Transcript
An exploration of streamflow and water chemistry patterns in urban waters
US Geological Survey:Virginia and West VirginiaWater Science [email protected]
Aaron J PorterHydrologist
Fairfax County Monitoring Objectives1. Determine how streamflow, water-quality, and benthic macroinvertebrates vary spatially (across monitored watersheds) and temporally (seasonally/annually)2. Compute annual nutrient and sediment loads and analyze trends3. Link changes in streamflow, water-quality, and benthic macroinvertebrates to changes in the landscape (e.g. development, BMPs)
This information is preliminary and is subject to revision. It is being provided to meet the need for timely best science. The information is provided on the condition that neither the U.S. Geological Survey nor the U.S. Government shall be held liable for any damages resulting from the authorized or unauthorized use of the information.
#*
#*#*
#*
#*
#*
#*
#*
#*
#*#*
#*#*
#*#*
#*
#* #*
#*
#*
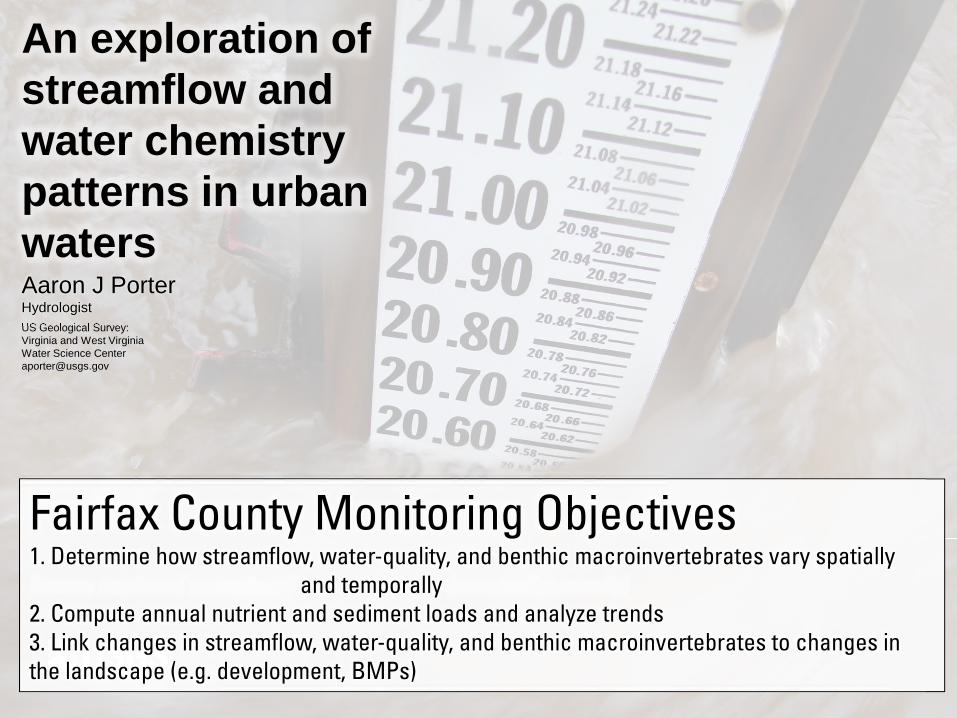
City of Fairfax
WASHINGTON, D.C.
City of Manassas
LOUDOUN COUNTY
Occoquan RiverPRINCE WILLIAM COUNTY
FAIRFAX COUNTY
ARLINGTONCOUNTY
City of Falls Church
MARYLAND
01656903
0165694286
0165690673
01644343
01645940
01645762
01645745
01645844
01654500
01646305
01645704
01652789
01652860
01657394
01655305
01657100
01653717
0164425950
01653844
01657322
Potomac River
City ofAlexandria
#*
#*#*
#*
#*
#*
#*
#*
#*
#*#*
#*#*
#*#*
#*
#* #*
#*
#*
City of Fairfax
WASHINGTON, D.C.
City of Manassas
LOUDOUN COUNTY
Occoquan RiverPRINCE WILLIAM COUNTY
FAIRFAX COUNTY
ARLINGTONCOUNTY
City of Falls Church
MARYLAND
01656903
0165694286
0165690673
01644343
01645940
01645762
01645745
01645844
01654500
01646305
01645704
01652789
01652860
01657394
01655305
01657100
01653717
0164425950
01653844
01657322
Potomac River
City ofAlexandria
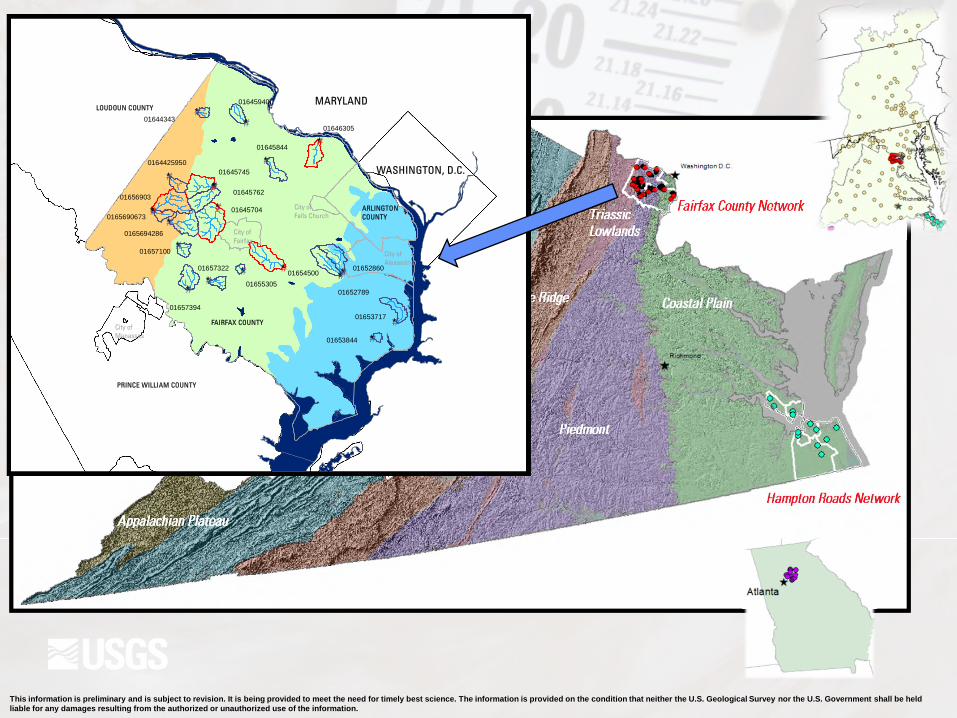
Urbanized Watersheds
High Peak
Short Duration/ ”Flashy”
Symptoms of:1. Impervious cover2. Soil compaction3. Channelized stormwater
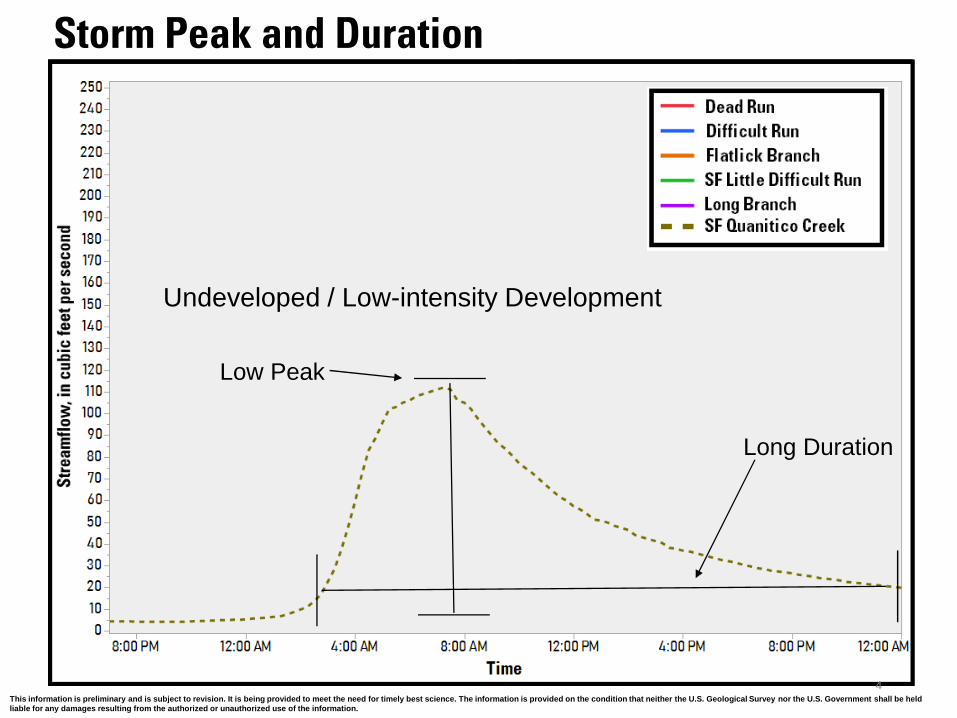
Storm Peak and Duration
This information is preliminary and is subject to revision. It is being provided to meet the need for timely best science. The information is provided on the condition that neither the U.S. Geological Survey nor the U.S. Government shall be held liable for any damages resulting from the authorized or unauthorized use of the information.
Urbanized Watersheds
High Peak
Short Duration
Undeveloped / Low-intensity Development
Low Peak
Long Duration
4
This information is preliminary and is subject to revision. It is being provided to meet the need for timely best science. The information is provided on the condition that neither the U.S. Geological Survey nor the U.S. Government shall be held liable for any damages resulting from the authorized or unauthorized use of the information.
5
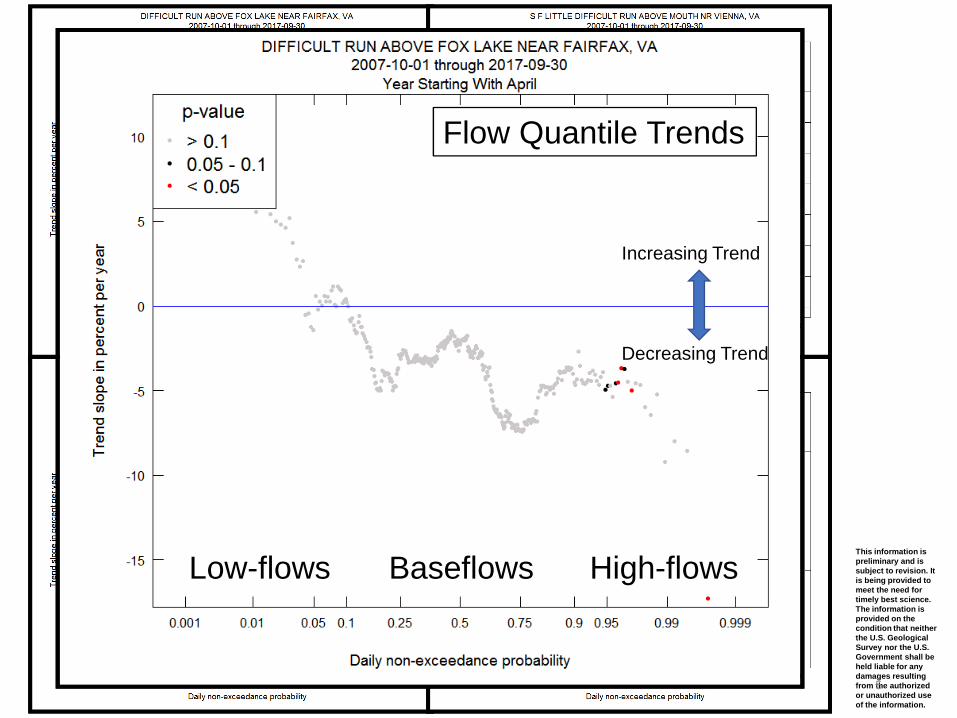
High-flowsLow-flows Baseflows
Flow Quantile Trends
Increasing Trend
Decreasing Trend
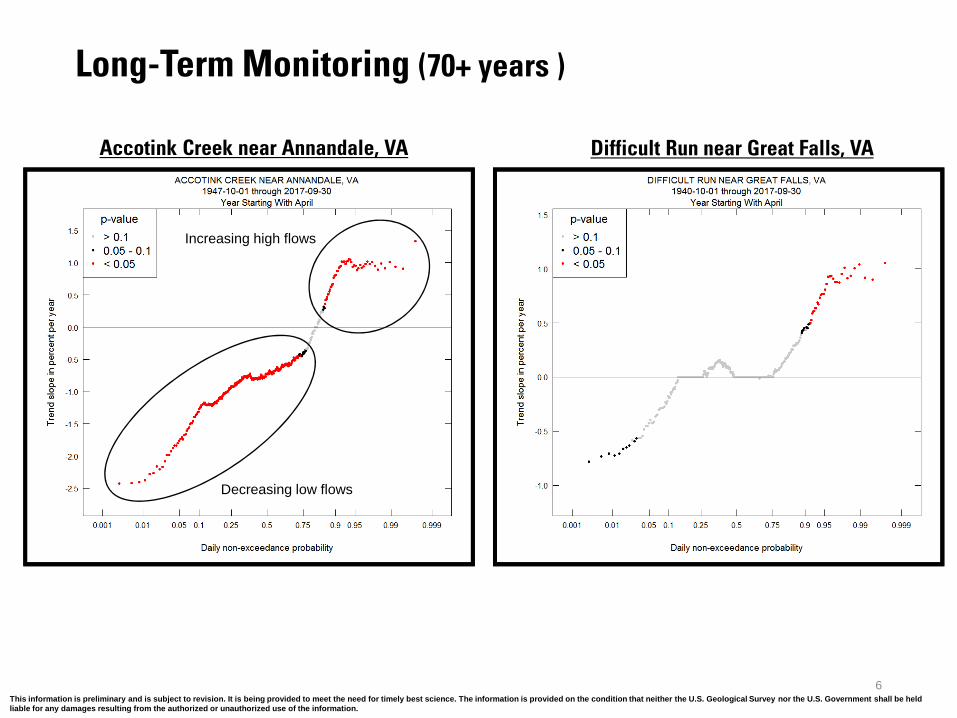
Accotink Creek near Annandale, VA Difficult Run near Great Falls, VA
Long-Term Monitoring (70+ years )
This information is preliminary and is subject to revision. It is being provided to meet the need for timely best science. The information is provided on the condition that neither the U.S. Geological Survey nor the U.S. Government shall be held liable for any damages resulting from the authorized or unauthorized use of the information.
Decreasing low flows
Increasing high flows
6

• Continuous water-quality monitoring at 5 stations • (SC, TB, WT, DO, pH)
• Discretely collected monthly water-quality parameters at 20 stations
• (SC, TB, WT, DO, pH)
• Monthly nutrient and sediment sampling – 20 stations• Manual grab samples
• Stormflow nutrient and sediment sampling – 5 stations• Automated ISCO samplers
Streamflow StreamflowTurbidity
StreamflowTurbiditySamples
This information is preliminary and is subject to revision. It is being provided to meet the need for timely best science. The information is provided on the condition that neither the U.S. Geological Survey nor the U.S. Government shall be held liable for any damages resulting from the authorized or unauthorized use of the information.
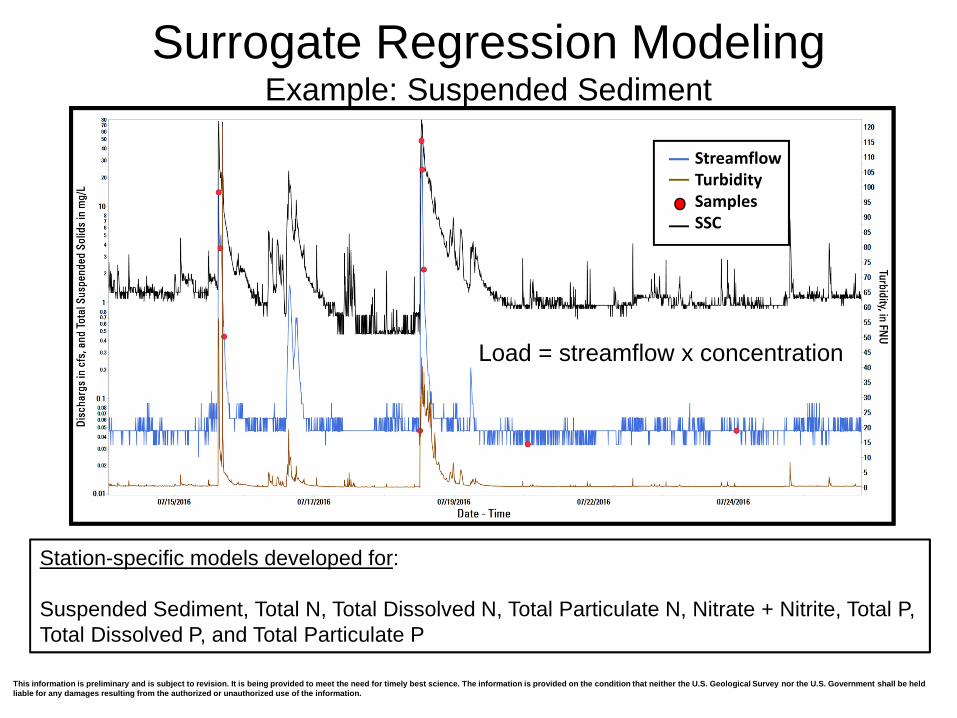
Surrogate Regression ModelingExample: Suspended Sediment
Station-specific models developed for:
Suspended Sediment, Total N, Total Dissolved N, Total Particulate N, Nitrate + Nitrite, Total P, Total Dissolved P, and Total Particulate P
SSC = ƒ-1[β0 + β1{log(Q)} + β2{log(TB)}...]
R 2 = 0.9784
0
100
200
300
400
500
600
700
0 50 100 150 200 250 300 350 400
Turbidity (FNU)
SS
C (
mg
/L)
StreamflowTurbiditySamplesSSC
Load = streamflow x concentration

Composition of Nitrogen Loads
This information is preliminary and is subject to revision. It is being provided to meet the need for timely best science. The information is provided on the condition that neither the U.S. Geological Survey nor the U.S. Government shall be held liable for any damages resulting from the authorized or unauthorized use of the information.
• Total Nitrogen primarily dissolved • Dissolved N primarily Nitrate
Nitrate, as well as orthophosphate, is a key limiting nutrient of phytoplankton growth in Chesapeake Bay –Fisher and others, 1992
Thomas R. Fisher, Emily R. Peele, James W. Ammerman and Lawrence W. Harding Jr. Marine Ecology Progress Series, Vol. 82, No. 1 (May 14 1992), pp. 51-63.

This information is preliminary and is subject to revision. It is being provided to meet the need for timely best science. The information is provided on the condition that neither the U.S. Geological Survey nor the U.S. Government shall be held liable for any damages resulting from the authorized or unauthorized use of the information.
1Active onsite sewage disposal systems supplied by Paul Shannon on 7/17/2018
(in mg/L as N)
> 4.01.9 – 4.01 – 1.49< 0.99
10-year Median NitrateConcentrations
Onsite sewagedisposal system1
Highest concentrations of nitrate observed in watersheds with high density of septic systems
This information is preliminary and is subject to revision. It is being provided to meet the need for timely best science. The information is provided on the condition that neither the U.S. Geological Survey nor the U.S. Government shall be held liable for any damages resulting from the authorized or unauthorized use of the information.
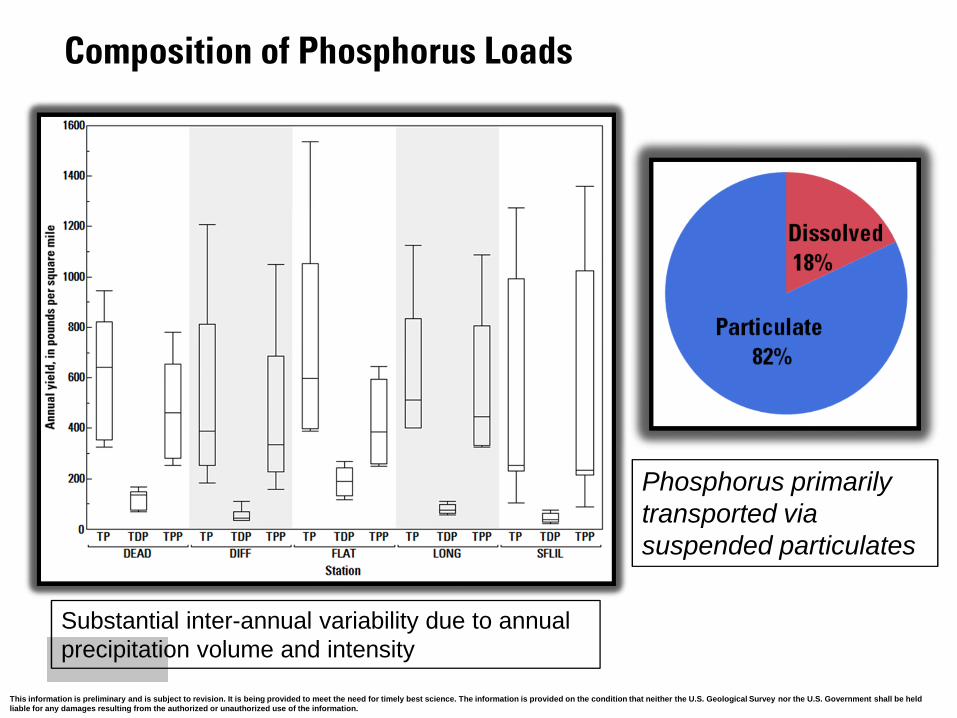
Composition of Phosphorus Loads
Phosphorus primarily transported via suspended particulates
Substantial inter-annual variability due to annual precipitation volume and intensity
This information is preliminary and is subject to revision. It is being provided to meet the need for timely best science. The information is provided on the condition that neither the U.S. Geological Survey nor the U.S. Government shall be held liable for any damages resulting from the authorized or unauthorized use of the information.
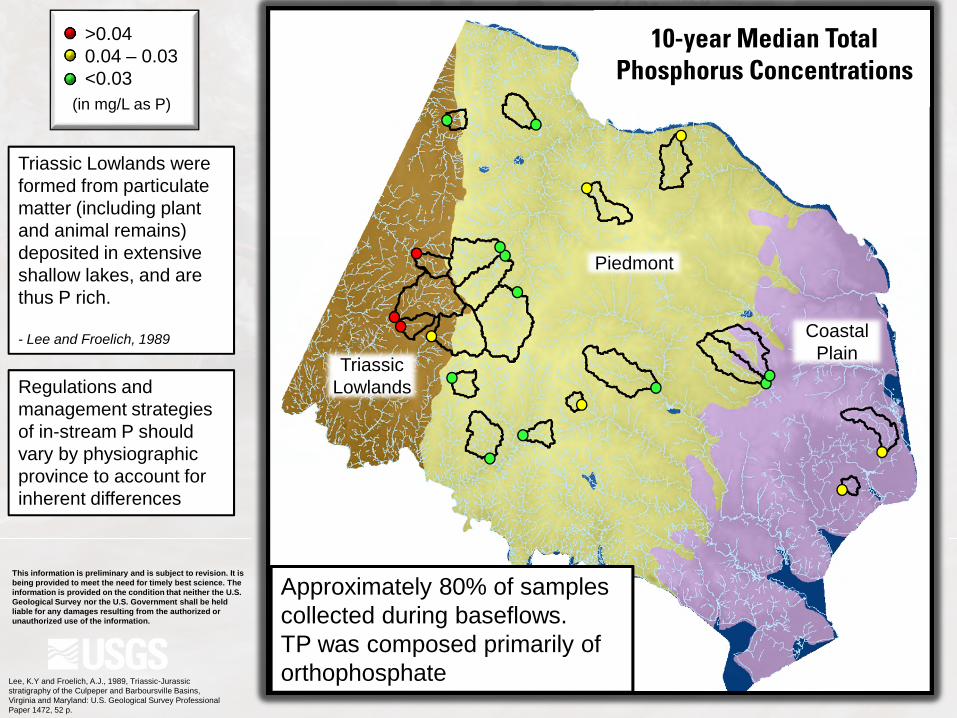
(in mg/L as P)
>0.040.04 – 0.03<0.03
Triassic Lowlands were formed from particulate matter (including plant and animal remains) deposited in extensive shallow lakes, and are thus P rich.
- Lee and Froelich, 1989
Regulations and management strategies of in-stream P should vary by physiographic province to account for inherent differences
Lee, K.Y and Froelich, A.J., 1989, Triassic-Jurassic stratigraphy of the Culpeper and Barboursville Basins, Virginia and Maryland: U.S. Geological Survey Professional Paper 1472, 52 p.
`Triassic
Lowlands
10-year Median Total Phosphorus Concentrations
Piedmont
Coastal Plain
Approximately 80% of samples collected during baseflows.TP was composed primarily of orthophosphate

This information is preliminary and is subject to revision. It is being provided to meet the need for timely best science. The information is provided on the condition that neither the U.S. Geological Survey nor the U.S. Government shall be held liable for any damages resulting from the authorized or unauthorized use of the information.
Comparison of Sediment YieldsA
nnua
l sus
pend
ed s
edim
ent y
ield
, in
tons
per
squ
are
mile
Important factors affecting sediment yielding rates1. Source pools/availability2. Land use/land cover3. Topographic relief4. Stream order
• In Piedmont, pre-colonial geologic rates of erosion were low• Centuries of agriculture led to accumulation of legacy sediments• Modern sediment yields are highest in the Piedmont region
irrespective of current land usesGellis, A.C., and others, 2009, Sources, transport, and storage of sediment in the Chesapeake Bay Watershed: U.S. Geological Survey Scientific Investigations Report 2008–5186, 95 p.
Piedmont – Fairfax County: moderate topographic relief, large pools of legacy sediments, urbanization
Coastal Plain – Hampton Roads: low topographic relief, largely sand
Valley and Ridge - Roanoke: High topographic relief, shallow soils –reduced source pools
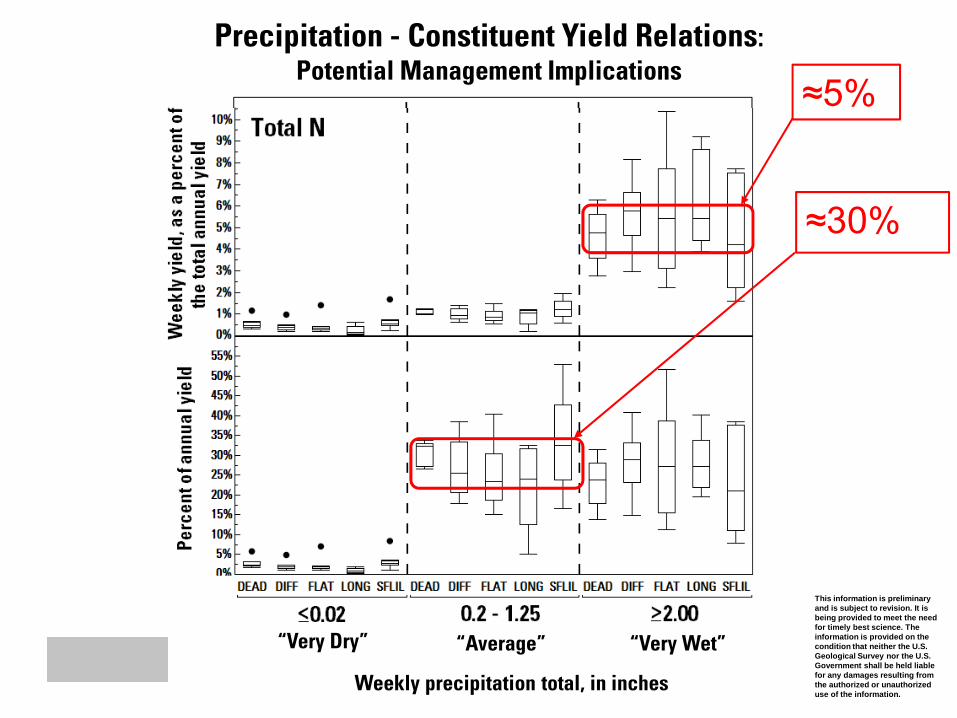
Precipitation - Constituent Yield Relations:Potential Management Implications
This information is preliminary and is subject to revision. It is being provided to meet the need for timely best science. The information is provided on the condition that neither the U.S. Geological Survey nor the U.S. Government shall be held liable for any damages resulting from the authorized or unauthorized use of the information.
“Very Dry” “Average” “Very Wet”
Weekly precipitation total, in inches
≈5%
≈30%
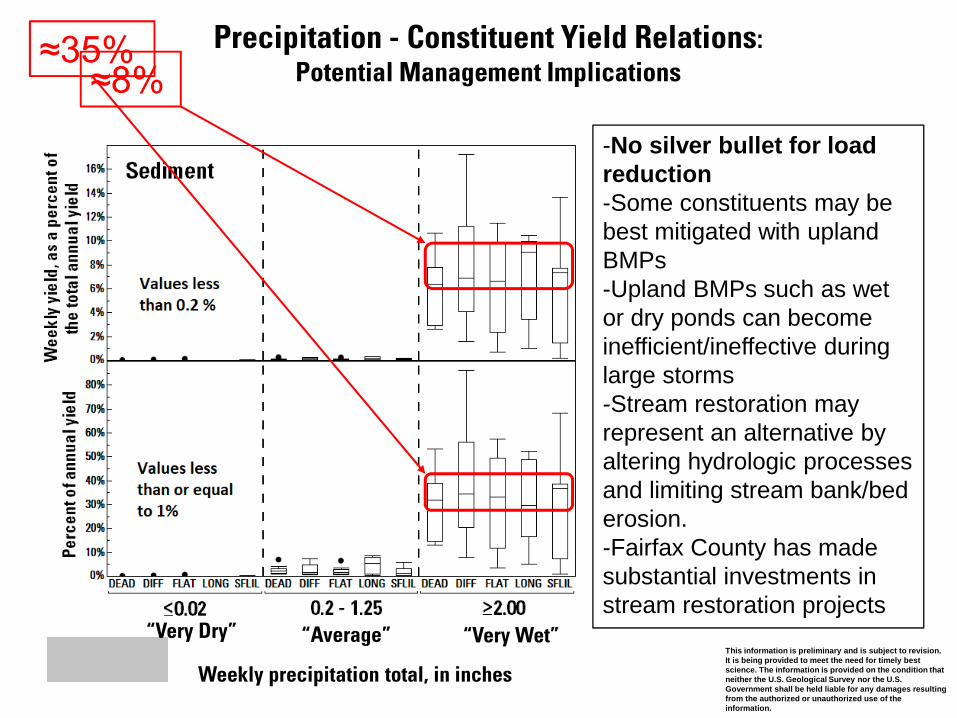
Precipitation - Constituent Yield Relations:Potential Management Implications
This information is preliminary and is subject to revision. It is being provided to meet the need for timely best science. The information is provided on the condition that neither the U.S. Geological Survey nor the U.S. Government shall be held liable for any damages resulting from the authorized or unauthorized use of the information.
≈8%≈35%
-No silver bullet for load reduction-Some constituents may be best mitigated with upland BMPs -Upland BMPs such as wet or dry ponds can become inefficient/ineffective during large storms-Stream restoration may represent an alternative by altering hydrologic processes and limiting stream bank/bed erosion.-Fairfax County has made substantial investments in stream restoration projects
“Very Dry” “Average” “Very Wet”
Weekly precipitation total, in inches
In Closing…
Fairfax County streams show many key symptoms of urbanization• Increased peak flows, decreased baseflows• “Flashy” storm hydrographs• Hotspots of elevated nutrient inputs• Altered stream geomorphology and stability (high sediment
loading rates)• Issues which require a variety of watershed management
strategies
Related Documents