An Experimental Momentum-based Front Detection Method for Autonomous Underwater Vehicles Jeremy Gottlieb, Rishi Graham, Thom Maughan, Fr´ ed´ eric Py, Gabriel Elkaim and Kanna Rajan Abstract— Fronts have been recognized as hotspots of intense biological activity and are important targets for observation to understand coastal ecology and transport in a changing ocean. With high spatial and temporal variabil- ity, detection and event response for frontal zones is chal- lenging for robotic platforms like autonomous underwater vehicles (AUVs). These vehicles have shown their versatility and cost-effectiveness in using automated approaches to detect a range of features. Targeting them for in-situ observation and sampling capabilities for frontal zones then provides an important tool for characterizing rapid and episodic changes. We introduce a novel momentum- based front detection (MBFD) algorithm which utilizes a Kalman filter and a momentum accumulator function to identify significant temperature gradients associated with upwelling fronts. MBFD is designed to work at a number of levels including onboard an AUV, on-shore with a sparse real-time data stream and post-experiment on a full resolution data set gathered by a vehicle. Such a multi-layered approach plays an important role in mixed human-robot decision making for oceanographers making coordinated sampling and asset allocation strategies in large multi-robot field experiments in the coastal ocean. I. I NTRODUCTION AND MOTIVATION The coastal ocean is a complex environment driven by the interaction of atmospheric, oceanographic, estuar- ine/riverine and land-sea processes. Among the phenom- ena that oceanographers study are ocean fronts - zones of locally intensive physical gradients that experience enhanced circulation and biological activity. Fronts are important targets for observation to understand coastal ecology and transport. They occur at varying spatial scales, from a depth of a few meters all the way to the sub-sea benthic environment. They also occur at highly variable temporal scales, subsisting from a few hours to a few weeks. In addition, they can be observed via changes in multiple environmental properties (e.g., temperature, nitrate, salinity, etc). Studying fronts has been a persistent challenge. Re- cently, approaches using robotic vehicles have been at- tempted but recognition of the frontal boundary remains difficult. Thus far, a reliable mathematical model of the structure and behavior of fronts does not exist. As a consequence, computational methods and those tied to autonomic behavior are sparse. Instead, oceanographers J. Gottlieb and G. Elkaim are with the Baskin School of Engi- neering, UC Santa Cruz, 1156 High St., Santa Cruz, CA 95064 USA {gottlieb,elkaim}@soe.ucsc.edu R. Graham, T. Maughan, F. Py, and K. Rajan are with MBARI, 7700 Sandholdt Rd., Moss Landing, CA 95039 USA {rishi,tm,fpy,kanna.rajan}@mbari.org Fig. 1: MBARI’s Dorado AUV on the R/V Zephyr. use heuristics based on ship-board and remote sensing measurements to characterize frontal zones. Autonomous underwater vehicles (AUVs) in this con- text offer new, more cost-effective and sustainable op- portunities for making targeted oceanographic obser- vations at high spatial and temporal resolution. AUVs with the ability to automatically detect features can au- tonomously retarget themselves to detect and then track fronts, potentially making water sample measurements of interest to oceanographers[12]. Often scientists are in- terested in sampling the differing water mass across and within the frontal boundaries. This is difficult enough for scientists on manned vessels. Our end goal is to have a robot undertake such sampling missions autonomously. The primary challenges include translating the heuristics that oceanographers use to identify fronts into features a robot can use for identification, and identifying these features in the context of a very noisy environmental background. We introduce a novel momentum-based front detec- tion (MBFD) algorithm designed for use on AUVs. The algorithm has been run onboard MBARI’s Dorado platform (Fig. 1). Simultaneously, the algorithm is also run on shore within the Oceanographic Decision Support System (ODSS) [6] for the Controlled, Agile, and Novel Observing Network (CANON) program [1]. It is an early attempt to implement event response capabilities in the coastal ocean, a key scientific and engineering goal for CANON and the ODSS. Dynamic and episodic phenomena such as fronts are hard to predict given current difficulties constructing ocean models. Thus, having robotic platforms that can autonomously and dynamically target these phenomena would be beneficial to oceanographers. We envision future applications that would allow an AUV to use these algorithms to react to the presence of fronts in order to clarify their location or direction of movement. While the technique presented 2012 IEEE International Conference on Robotics and Automation RiverCentre, Saint Paul, Minnesota, USA May 14-18, 2012 978-1-4673-1404-6/12/$31.00 ©2012 IEEE 5322

Welcome message from author
This document is posted to help you gain knowledge. Please leave a comment to let me know what you think about it! Share it to your friends and learn new things together.
Transcript

An Experimental Momentum-based Front Detection Methodfor Autonomous Underwater Vehicles
Jeremy Gottlieb, Rishi Graham, Thom Maughan, Frederic Py,Gabriel Elkaim and Kanna Rajan
Abstract— Fronts have been recognized as hotspots ofintense biological activity and are important targets forobservation to understand coastal ecology and transport ina changing ocean. With high spatial and temporal variabil-ity, detection and event response for frontal zones is chal-lenging for robotic platforms like autonomous underwatervehicles (AUVs). These vehicles have shown their versatilityand cost-effectiveness in using automated approaches todetect a range of features. Targeting them for in-situobservation and sampling capabilities for frontal zonesthen provides an important tool for characterizing rapidand episodic changes. We introduce a novel momentum-based front detection (MBFD) algorithm which utilizesa Kalman filter and a momentum accumulator functionto identify significant temperature gradients associatedwith upwelling fronts. MBFD is designed to work at anumber of levels including onboard an AUV, on-shore witha sparse real-time data stream and post-experiment ona full resolution data set gathered by a vehicle. Such amulti-layered approach plays an important role in mixedhuman-robot decision making for oceanographers makingcoordinated sampling and asset allocation strategies inlarge multi-robot field experiments in the coastal ocean.
I. INTRODUCTION AND MOTIVATION
The coastal ocean is a complex environment drivenby the interaction of atmospheric, oceanographic, estuar-ine/riverine and land-sea processes. Among the phenom-ena that oceanographers study are ocean fronts - zonesof locally intensive physical gradients that experienceenhanced circulation and biological activity. Fronts areimportant targets for observation to understand coastalecology and transport. They occur at varying spatialscales, from a depth of a few meters all the way tothe sub-sea benthic environment. They also occur athighly variable temporal scales, subsisting from a fewhours to a few weeks. In addition, they can be observedvia changes in multiple environmental properties (e.g.,temperature, nitrate, salinity, etc).
Studying fronts has been a persistent challenge. Re-cently, approaches using robotic vehicles have been at-tempted but recognition of the frontal boundary remainsdifficult. Thus far, a reliable mathematical model of thestructure and behavior of fronts does not exist. As aconsequence, computational methods and those tied toautonomic behavior are sparse. Instead, oceanographers
J. Gottlieb and G. Elkaim are with the Baskin School of Engi-neering, UC Santa Cruz, 1156 High St., Santa Cruz, CA 95064 USA{gottlieb,elkaim}@soe.ucsc.edu
R. Graham, T. Maughan, F. Py, and K. Rajan are withMBARI, 7700 Sandholdt Rd., Moss Landing, CA 95039 USA{rishi,tm,fpy,kanna.rajan}@mbari.org
Fig. 1: MBARI’s Dorado AUV on the R/V Zephyr.
use heuristics based on ship-board and remote sensingmeasurements to characterize frontal zones.
Autonomous underwater vehicles (AUVs) in this con-text offer new, more cost-effective and sustainable op-portunities for making targeted oceanographic obser-vations at high spatial and temporal resolution. AUVswith the ability to automatically detect features can au-tonomously retarget themselves to detect and then trackfronts, potentially making water sample measurementsof interest to oceanographers[12]. Often scientists are in-terested in sampling the differing water mass across andwithin the frontal boundaries. This is difficult enough forscientists on manned vessels. Our end goal is to have arobot undertake such sampling missions autonomously.The primary challenges include translating the heuristicsthat oceanographers use to identify fronts into featuresa robot can use for identification, and identifying thesefeatures in the context of a very noisy environmentalbackground.
We introduce a novel momentum-based front detec-tion (MBFD) algorithm designed for use on AUVs.The algorithm has been run onboard MBARI’s Doradoplatform (Fig. 1). Simultaneously, the algorithm is alsorun on shore within the Oceanographic Decision SupportSystem (ODSS) [6] for the Controlled, Agile, and NovelObserving Network (CANON) program [1]. It is anearly attempt to implement event response capabilitiesin the coastal ocean, a key scientific and engineeringgoal for CANON and the ODSS. Dynamic and episodicphenomena such as fronts are hard to predict givencurrent difficulties constructing ocean models. Thus,having robotic platforms that can autonomously anddynamically target these phenomena would be beneficialto oceanographers. We envision future applications thatwould allow an AUV to use these algorithms to react tothe presence of fronts in order to clarify their location ordirection of movement. While the technique presented
2012 IEEE International Conference on Robotics and AutomationRiverCentre, Saint Paul, Minnesota, USAMay 14-18, 2012
978-1-4673-1404-6/12/$31.00 ©2012 IEEE 5322

MBFD
MBFD
Oceanographic Decision Support System
Temperature difference within a yo
High resolution CTD dataSampled at 5Hz
On board
All yos250-300 measurements per mission
Temperature difference within a yo
Low resolution CTD dataOne data point every 5m of depth
On shore - real time
Only downward yos150-200 measurements per mission
Temperature difference within a water column
Gridded and interpolated CTD data.5-10 water columns per yo
On shore - post-processing
All water columns500-1000 measurements per mission
Fig. 2: The experimental setup for running MBFD onboardthe AUV, using sub-sampled AUV data obtained via satelliteand using full-resolution log data.
can be applied to any associated oceanographic property,our discussion will focus primarily on temperature.
Our work extends earlier methods by applying statis-tical parameter estimation from past data characterizingthe extent of the transition zone that defines an oceanfront. The experimental setup is as shown in Fig. 2.MBFD is run in three contexts: onboard the DoradoAUV; on sub-sampled AUV data sent to shore viasatellite; and post-hoc after mission completion on fullresolution data. This work was specifically targeted atidentifying upwelling fronts.
The paper is organized as follows: Section II describesrelated work. Section III describes the algorithm whileSection IV highlights the results of MBFD on archiveddata as well as on an AUV deployment at sea. Section Vanalyses the results and Section VI concludes with futurework.
II. RELATED WORK
Fronts have been studied primarily by physicaloceanographers applying edge detection techniques toremote sensing profiles of sea-surface temperature (SST)measurements ([14], [9], [11], [3]) where [4] forms thebasis for many of the detection methods. Biologicalproductivity in fronts has been a long-term study topic(e.g., [15]), while the impact of fronts on large marineecosystems are an important factor in the study ofcoastal ecosystem management [8], [13], [10].
Traditional ship based observations such as recentfine scale measurements using towed instruments havebeen the norm in the ocean sciences [7]. Automatedapproaches are relatively new; newer still are those usedin-situ on marine robots, particularly those using a full-volume field (horizontal and vertical measurements).The primary advantage to using AUVs over ship-basedobservations is that AUVs can be in the water contin-uously for longer periods cost-effectively. UnpoweredAUVs or gliders can persist for months in the water-column driven by human operators via satellite.
[5] used AUVs to reactively detect and track a thermo-cline. While their method as applied to the thermoclineis similar in appearance to ours as applied to fronts,they seek to identify a specific point as the centroid ofthe region of intense change, while we seek to definethe entire region over which change is intense. Earlierwork from [16] made use of mixed-initiative methods totarget fronts; field reconstruction from sub-sampled datais used by an oceanographer on shore for identifying afront, followed by retargeting of the vehicle.
An upwelling front can be characterized by a rapidtransition between stratified and non-stratified water. Bydefinition, stratified water contains a strong vertical gra-dient. In [17], vertical gradient information is capturedby computing the temperature difference between twopredefined depths. This method is extended in [18] toquantify the horizontal gradient of the vertical temper-ature difference as a basis for front detection. Thesealgorithms have been demonstrated on AUVs in situ forautonomous detection of stratified and unstratified watertypes as well as the fronts between them. Our workfollows this approach using a Kalman filter to smooththe signal and a momentum function to aggregate changeover distance.
III. THE MBFD ALGORITHM
MBFD was designed to be flexible and scalable inmultiple data-gathering contexts, using parameter val-ues estimated from past data. Momentum values aregenerated directly from the data by taking into accountthe magnitude of vertical differences and horizontalcumulative change. While [17], [18] use differences atdiscrete depths, our measure is the maximum differencewithin a continuous profile.
A. The Role of Gradients in Fronts
Fig. 3 shows an example of a water-column track witha temperature front encountered by our AUV duringan overnight mission on June 13-14, 2011. The AUVwas typically targeted at a suspected frontal region byoceanographers using remote sensing and archival datacoupled with their understanding of the mechanics of
Fig. 3: An AUV track with temperature data showing a frontalzone, from a mission in Monterey Bay in June, 2011.
5323

upwelling zones in Monterey Bay. However, MBFDitself has no a priori contextual information and istherefore unbiased towards identifying fronts.
Our experimental setup closely follows that of [17],[18]. As the AUV moves through the front into theupwelled water, the temperature within the water columnrapidly becomes more homogenous (less as it movesout). The temperature difference decreases (increases),which generates a steep, sustained gradient. In order tocharacterize the vertical structure of the water columnover a region of (horizontal) space, the AUV executes ayo-yo pattern.1 The AUV track is then partitioned into asequence of Nprof ∈ N profiles, transects from surface todepth or depth to surface. For each profile, the differencebetween maximum and minimum measured temperaturevalues is stored.
B. Algorithmic Details
The maximum vertical difference within the watercolumn is a continuous function of horizontal location.We use the maximum difference across each profile asa discrete proxy, applying a Kalman filter to obtaina smooth approximation of the underlying signal. Theresulting approximate value associated with profile p ∈{1, . . . , Nprof} we denote by mvd(p), and use as a basisfor our momentum based accumulation function.
1) The Momentum function: If the correct smoothingparameters were known a priori, then front detectioncould be a matter of finding the extrema of the instanta-neous rate of change of the smoothed signal. However,this approach is too highly variable from one dataset tothe next to be practical. Instead, we define an accumu-lated trend based on the notion of momentum to allow usto quantify a natural trend (Fig. 4). For a given segmentof the AUV trajectory, the region over which mvd accu-mulates the most momentum in a given direction (with
1The variability we are interested in is in the vertical dimension, butDorado cannot hover - it must always be moving forward. Hence, theyo-yo pattern is the most efficient mechanism for studying variabilityacross multiple water columns.
Fig. 4: Temperature data from June 2011, in Monterey Bay.Top plot shows mvd (black), DM (cyan), UM (purple), andidentified downward (red box) and upward (green box) fronts.
an upward or downward trend) is the best candidate fora front. The downward momentum, DM(p), at profilep is essentially an approximate integral over the currentdownward trend up to p, moderated by a decelerationterm based on the integral over the intervening upwardtrends. The deceleration gain parameter, r, defines howmuch weight to place on a step in the direction opposedto momentum. Algorithm 1 describes how downwardmomentum is calculated. Upward momentum, UM(p),is treated independently and analogously. Note thatmomentum can never be negative.
Algorithm 1: Downward momentum function. r is de-celeration gain.
1: DM(0)← 02: for p ∈ 1, . . . , Nprof do3: if DM(p− 1) = 0 then4: d← 0 and u← 05: end if6: ∆ = mvd(p)−mvd(p− 1)7: if ∆ < 0 then8: d← d + 19: DM(p)← DM(p− 1) + d|∆|
10: else11: u← u + 112: DM(p)← max(0, DM(p− 1)− ur∆)13: end if14: end for
2) Determining the extent of fronts: Determining theactual extent of a front involves estimating both wherethe trend in mvd begins and ends. We do so in termsof the profile numbers at which momentum departsfrom zero and reaches a peak, respectively. Note thatthe zeros in the momentum function form a naturalpartition of the transect into regions where there is alikely trend and regions where there is not. We begin bydefining index sets which contain potential fronts. LetI1, . . . , Inw ⊂ {0, . . . , Nprof}, nw ∈ N, such that, foreach j ∈ {1, . . . , nw}
DM(min(Ij)) = 0, DM(Ij \min(Ij)) 6= 0 (1)and either
max(Ij) == Nprof, or DM(max(Ij) + 1) = 0. (2)
In other words, each Ij defines a sequence of profileswhich begin with zero momentum and carry through tothe profile just before the momentum goes to zero again.We define Imin and Imax as:
Imin = Imin(Ij) = argmini∈Ij
DM(i) (3)
Imax = Imax(Ij) = argmaxi∈Ij
DM(i), (4)
and note that by definition Imin(Ij) = min(Ij), andDM(Imin) = 0. A first approximation of the extent ofthe potential front is the region [Imin, Imax].
5324
The potential fronts are next filtered according to arelative threshold, Trel ∈ (0, 1) (which ensures that thisis a significant event within the dataset) and an absolutethreshold Tabs ∈ R (which allows for the possibility thatno real front exists within the noisy data).
There are thus four control parameters used for tuningthe MBFD based on historical data (Trel, Tabs, r, and theKalman filter process noise). We used a tagged group ofarchived data sets with well-defined fronts to learn thebest values for these parameters moving forward. For agiven point in the parameter space, the front boundariesthat were the results of MBFD were compared againstthe tagged boundaries and assigned a score based ona function of distance. The best values for our controlparameters were the found using a simple hill-climbingalgorithm to maximize the aggregate scores.
Each of the Ij’s which is likely to contain a front canbe refined further. This is because there may be a gradualchange in momentum at the edges. In many cases,the region may be reduced considerably by taking intoaccount the slope and curvature of the momentum. Wedo so here for one common case; the general treatmentis the subject of ongoing work.
Algorithm 2: Identifying the downward front IFDj
within the potential region Ij
1: Imin ← min(Ij)2: Imax ← argmax
i∈Ij
DM(i)
3: ∂max ← argmaxi∈(Imin,Imax]
(DM(i)−DM(i− 1))
{Maximum change in momentum is likely to be a“center” of the front.}
4: End← argmini∈[∂max,Imax]
(DM(i)−DM(i− 1))
5: IFDj = [Imin, End]
Analysis of past mission data shows that a sharptransition is often followed by a long plateau regionas evident in Fig. 4. For this downward trend example,because the plateau is flat (with a very slight downwardslope), the peak downward momentum value is in themiddle of the plateau. It would be preferable for theend of the front to be identified with the point wherethe momentum first begins to flatten out. To this end, weidentify the point at which the change in momentum ismaximum, then look for the point of minimum changeto the end of the window (Algorithm 2 describes thisprocedure in more detail). We will refer to the results ofAlgorithm 2 as the identified front (IFD for downwardfronts, or IFU for upward fronts).
IV. EXPERIMENTAL RESULTS
A. Trials on Archived Data
MBFD was tested in two distinct ways. The firstwas an application to archived data. The second wasexecuted online, during the course of a mission runin a CANON field experiment in September, 2011.
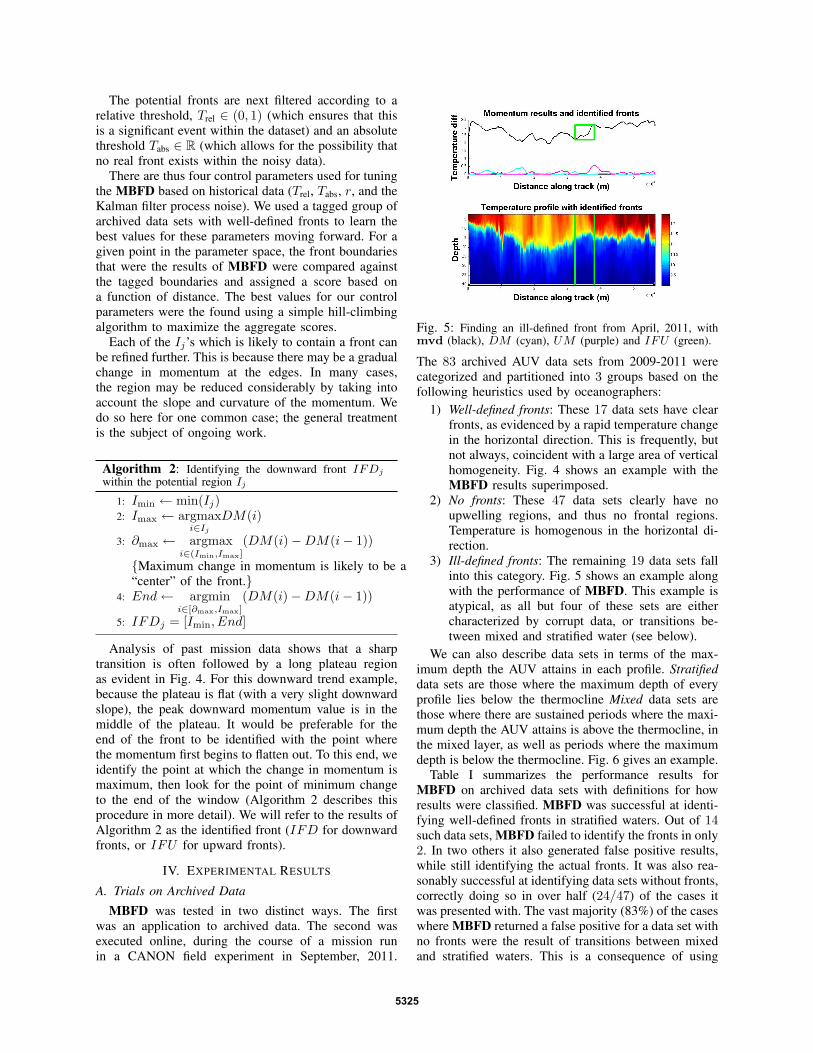
Fig. 5: Finding an ill-defined front from April, 2011, withmvd (black), DM (cyan), UM (purple) and IFU (green).
The 83 archived AUV data sets from 2009-2011 werecategorized and partitioned into 3 groups based on thefollowing heuristics used by oceanographers:
1) Well-defined fronts: These 17 data sets have clearfronts, as evidenced by a rapid temperature changein the horizontal direction. This is frequently, butnot always, coincident with a large area of verticalhomogeneity. Fig. 4 shows an example with theMBFD results superimposed.
2) No fronts: These 47 data sets clearly have noupwelling regions, and thus no frontal regions.Temperature is homogenous in the horizontal di-rection.
3) Ill-defined fronts: The remaining 19 data sets fallinto this category. Fig. 5 shows an example alongwith the performance of MBFD. This example isatypical, as all but four of these sets are eithercharacterized by corrupt data, or transitions be-tween mixed and stratified water (see below).
We can also describe data sets in terms of the max-imum depth the AUV attains in each profile. Stratifieddata sets are those where the maximum depth of everyprofile lies below the thermocline Mixed data sets arethose where there are sustained periods where the maxi-mum depth the AUV attains is above the thermocline, inthe mixed layer, as well as periods where the maximumdepth is below the thermocline. Fig. 6 gives an example.
Table I summarizes the performance results forMBFD on archived data sets with definitions for howresults were classified. MBFD was successful at identi-fying well-defined fronts in stratified waters. Out of 14such data sets, MBFD failed to identify the fronts in only2. In two others it also generated false positive results,while still identifying the actual fronts. It was also rea-sonably successful at identifying data sets without fronts,correctly doing so in over half (24/47) of the cases itwas presented with. The vast majority (83%) of the caseswhere MBFD returned a false positive for a data set withno fronts were the result of transitions between mixedand stratified waters. This is a consequence of using
5325
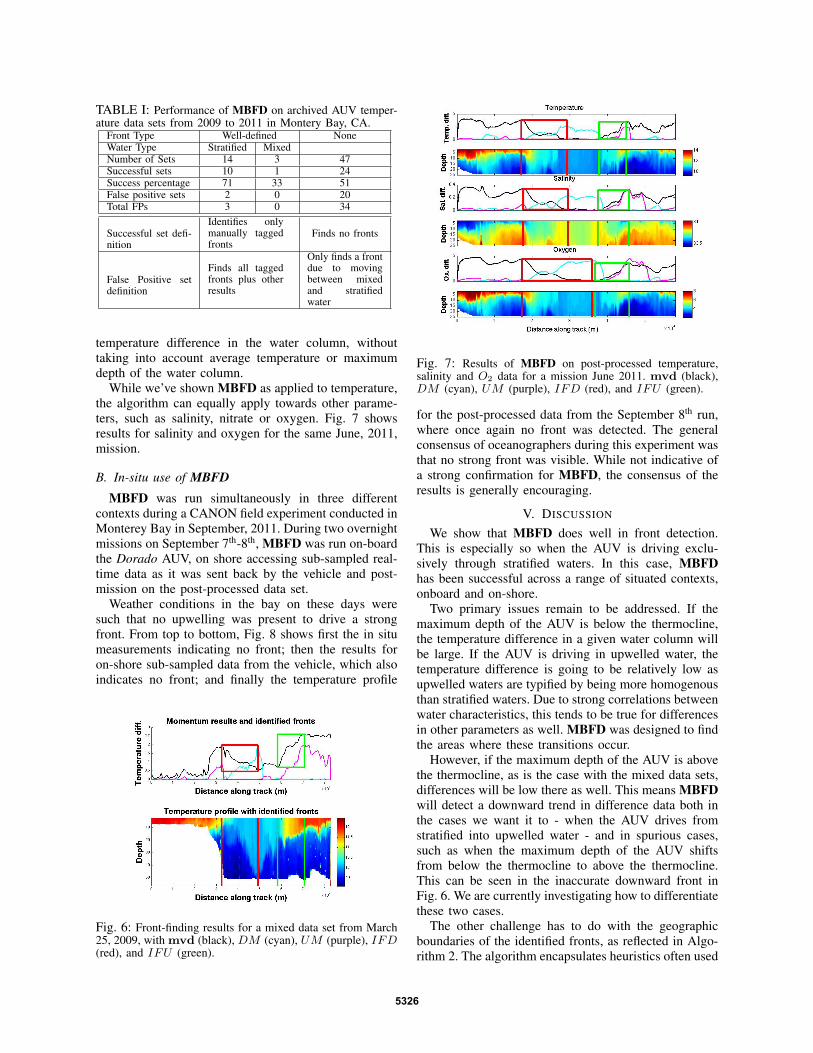
TABLE I: Performance of MBFD on archived AUV temper-ature data sets from 2009 to 2011 in Montery Bay, CA.
Front Type Well-defined NoneWater Type Stratified MixedNumber of Sets 14 3 47Successful sets 10 1 24Success percentage 71 33 51False positive sets 2 0 20Total FPs 3 0 34
Successful set defi-nition
Identifies onlymanually taggedfronts
Finds no fronts
False Positive setdefinition
Finds all taggedfronts plus otherresults
Only finds a frontdue to movingbetween mixedand stratifiedwater
temperature difference in the water column, withouttaking into account average temperature or maximumdepth of the water column.
While we’ve shown MBFD as applied to temperature,the algorithm can equally apply towards other parame-ters, such as salinity, nitrate or oxygen. Fig. 7 showsresults for salinity and oxygen for the same June, 2011,mission.
B. In-situ use of MBFDMBFD was run simultaneously in three different
contexts during a CANON field experiment conducted inMonterey Bay in September, 2011. During two overnightmissions on September 7th-8th, MBFD was run on-boardthe Dorado AUV, on shore accessing sub-sampled real-time data as it was sent back by the vehicle and post-mission on the post-processed data set.
Weather conditions in the bay on these days weresuch that no upwelling was present to drive a strongfront. From top to bottom, Fig. 8 shows first the in situmeasurements indicating no front; then the results foron-shore sub-sampled data from the vehicle, which alsoindicates no front; and finally the temperature profile
Fig. 6: Front-finding results for a mixed data set from March25, 2009, with mvd (black), DM (cyan), UM (purple), IFD(red), and IFU (green).
Fig. 7: Results of MBFD on post-processed temperature,salinity and O2 data for a mission June 2011. mvd (black),DM (cyan), UM (purple), IFD (red), and IFU (green).
for the post-processed data from the September 8th run,where once again no front was detected. The generalconsensus of oceanographers during this experiment wasthat no strong front was visible. While not indicative ofa strong confirmation for MBFD, the consensus of theresults is generally encouraging.
V. DISCUSSION
We show that MBFD does well in front detection.This is especially so when the AUV is driving exclu-sively through stratified waters. In this case, MBFDhas been successful across a range of situated contexts,onboard and on-shore.
Two primary issues remain to be addressed. If themaximum depth of the AUV is below the thermocline,the temperature difference in a given water column willbe large. If the AUV is driving in upwelled water, thetemperature difference is going to be relatively low asupwelled waters are typified by being more homogenousthan stratified waters. Due to strong correlations betweenwater characteristics, this tends to be true for differencesin other parameters as well. MBFD was designed to findthe areas where these transitions occur.
However, if the maximum depth of the AUV is abovethe thermocline, as is the case with the mixed data sets,differences will be low there as well. This means MBFDwill detect a downward trend in difference data both inthe cases we want it to - when the AUV drives fromstratified into upwelled water - and in spurious cases,such as when the maximum depth of the AUV shiftsfrom below the thermocline to above the thermocline.This can be seen in the inaccurate downward front inFig. 6. We are currently investigating how to differentiatethese two cases.
The other challenge has to do with the geographicboundaries of the identified fronts, as reflected in Algo-rithm 2. The algorithm encapsulates heuristics often used
5326
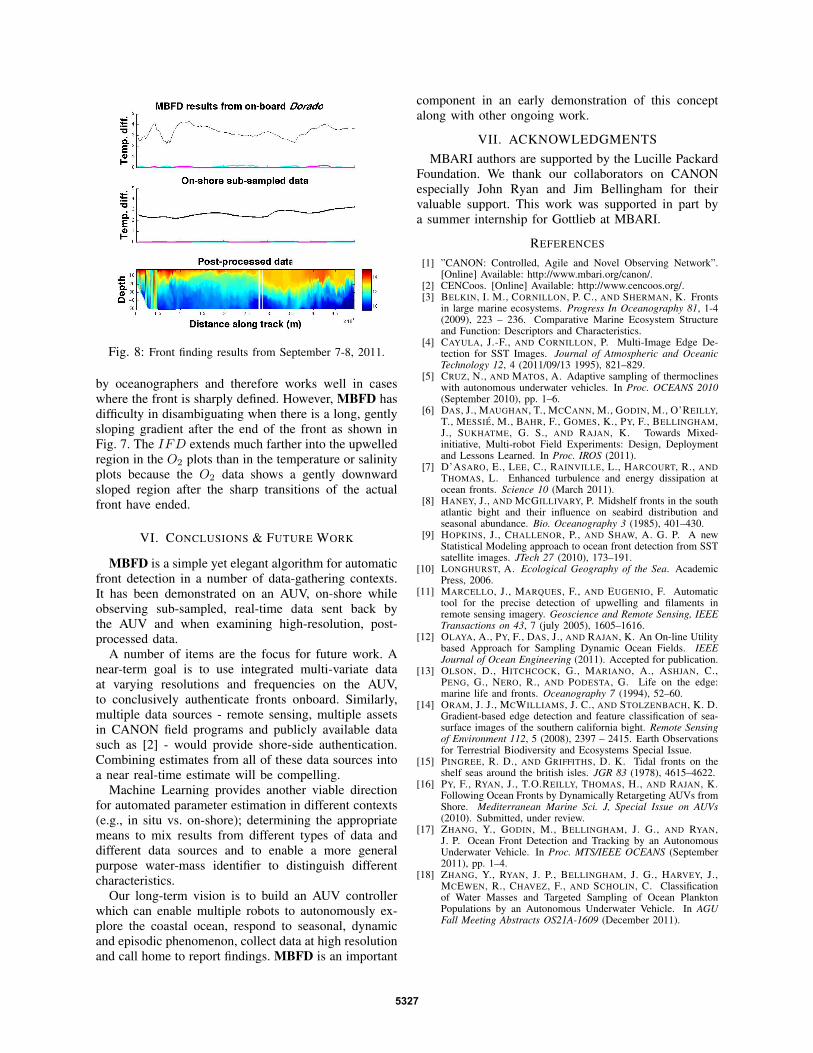
Fig. 8: Front finding results from September 7-8, 2011.
by oceanographers and therefore works well in caseswhere the front is sharply defined. However, MBFD hasdifficulty in disambiguating when there is a long, gentlysloping gradient after the end of the front as shown inFig. 7. The IFD extends much farther into the upwelledregion in the O2 plots than in the temperature or salinityplots because the O2 data shows a gently downwardsloped region after the sharp transitions of the actualfront have ended.
VI. CONCLUSIONS & FUTURE WORK
MBFD is a simple yet elegant algorithm for automaticfront detection in a number of data-gathering contexts.It has been demonstrated on an AUV, on-shore whileobserving sub-sampled, real-time data sent back bythe AUV and when examining high-resolution, post-processed data.
A number of items are the focus for future work. Anear-term goal is to use integrated multi-variate dataat varying resolutions and frequencies on the AUV,to conclusively authenticate fronts onboard. Similarly,multiple data sources - remote sensing, multiple assetsin CANON field programs and publicly available datasuch as [2] - would provide shore-side authentication.Combining estimates from all of these data sources intoa near real-time estimate will be compelling.
Machine Learning provides another viable directionfor automated parameter estimation in different contexts(e.g., in situ vs. on-shore); determining the appropriatemeans to mix results from different types of data anddifferent data sources and to enable a more generalpurpose water-mass identifier to distinguish differentcharacteristics.
Our long-term vision is to build an AUV controllerwhich can enable multiple robots to autonomously ex-plore the coastal ocean, respond to seasonal, dynamicand episodic phenomenon, collect data at high resolutionand call home to report findings. MBFD is an important
component in an early demonstration of this conceptalong with other ongoing work.
VII. ACKNOWLEDGMENTSMBARI authors are supported by the Lucille Packard
Foundation. We thank our collaborators on CANONespecially John Ryan and Jim Bellingham for theirvaluable support. This work was supported in part bya summer internship for Gottlieb at MBARI.
REFERENCES
[1] ”CANON: Controlled, Agile and Novel Observing Network”.[Online] Available: http://www.mbari.org/canon/.
[2] CENCoos. [Online] Available: http://www.cencoos.org/.[3] BELKIN, I. M., CORNILLON, P. C., AND SHERMAN, K. Fronts
in large marine ecosystems. Progress In Oceanography 81, 1-4(2009), 223 – 236. Comparative Marine Ecosystem Structureand Function: Descriptors and Characteristics.
[4] CAYULA, J.-F., AND CORNILLON, P. Multi-Image Edge De-tection for SST Images. Journal of Atmospheric and OceanicTechnology 12, 4 (2011/09/13 1995), 821–829.
[5] CRUZ, N., AND MATOS, A. Adaptive sampling of thermoclineswith autonomous underwater vehicles. In Proc. OCEANS 2010(September 2010), pp. 1–6.
[6] DAS, J., MAUGHAN, T., MCCANN, M., GODIN, M., O’REILLY,T., MESSIE, M., BAHR, F., GOMES, K., PY, F., BELLINGHAM,J., SUKHATME, G. S., AND RAJAN, K. Towards Mixed-initiative, Multi-robot Field Experiments: Design, Deploymentand Lessons Learned. In Proc. IROS (2011).
[7] D’ASARO, E., LEE, C., RAINVILLE, L., HARCOURT, R., ANDTHOMAS, L. Enhanced turbulence and energy dissipation atocean fronts. Science 10 (March 2011).
[8] HANEY, J., AND MCGILLIVARY, P. Midshelf fronts in the southatlantic bight and their influence on seabird distribution andseasonal abundance. Bio. Oceanography 3 (1985), 401–430.
[9] HOPKINS, J., CHALLENOR, P., AND SHAW, A. G. P. A newStatistical Modeling approach to ocean front detection from SSTsatellite images. JTech 27 (2010), 173–191.
[10] LONGHURST, A. Ecological Geography of the Sea. AcademicPress, 2006.
[11] MARCELLO, J., MARQUES, F., AND EUGENIO, F. Automatictool for the precise detection of upwelling and filaments inremote sensing imagery. Geoscience and Remote Sensing, IEEETransactions on 43, 7 (july 2005), 1605–1616.
[12] OLAYA, A., PY, F., DAS, J., AND RAJAN, K. An On-line Utilitybased Approach for Sampling Dynamic Ocean Fields. IEEEJournal of Ocean Engineering (2011). Accepted for publication.
[13] OLSON, D., HITCHCOCK, G., MARIANO, A., ASHJAN, C.,PENG, G., NERO, R., AND PODESTA, G. Life on the edge:marine life and fronts. Oceanography 7 (1994), 52–60.
[14] ORAM, J. J., MCWILLIAMS, J. C., AND STOLZENBACH, K. D.Gradient-based edge detection and feature classification of sea-surface images of the southern california bight. Remote Sensingof Environment 112, 5 (2008), 2397 – 2415. Earth Observationsfor Terrestrial Biodiversity and Ecosystems Special Issue.
[15] PINGREE, R. D., AND GRIFFITHS, D. K. Tidal fronts on theshelf seas around the british isles. JGR 83 (1978), 4615–4622.
[16] PY, F., RYAN, J., T.O.REILLY, THOMAS, H., AND RAJAN, K.Following Ocean Fronts by Dynamically Retargeting AUVs fromShore. Mediterranean Marine Sci. J, Special Issue on AUVs(2010). Submitted, under review.
[17] ZHANG, Y., GODIN, M., BELLINGHAM, J. G., AND RYAN,J. P. Ocean Front Detection and Tracking by an AutonomousUnderwater Vehicle. In Proc. MTS/IEEE OCEANS (September2011), pp. 1–4.
[18] ZHANG, Y., RYAN, J. P., BELLINGHAM, J. G., HARVEY, J.,MCEWEN, R., CHAVEZ, F., AND SCHOLIN, C. Classificationof Water Masses and Targeted Sampling of Ocean PlanktonPopulations by an Autonomous Underwater Vehicle. In AGUFall Meeting Abstracts OS21A-1609 (December 2011).
5327
Related Documents