BELIEF SYSTEMS AND DURABLE INEQUALITIES An Experimental Investigation of Indian Caste Karla Hoff and Priyanka Pandey World Bank This version, November 2005; Last version, June 2004 Abstract . We conducted an experiment in rural North India that shows persistently that publicly revealing individuals’ social identity has significant effects on individuals’ behavior even when that information is unrelated to rewards. These results are of interest because they suggest the possibility that if there is a belief system that stigmatizes members of a particular social group and if individuals are publicly identified as members of that group, their behavior responds by conforming to the belief system. 198 low caste and 198 high caste junior high school male students in rural India performed the task of solving mazes under economic incentives. There were no caste differences in performance when the participants’ names or caste identities were not publicly revealed, but publicly revealing social identities created a large and robust caste gap. When a random draw was introduced to determine who within the group would receive rewards for mazes solved, the caste gap disappeared. The experimental design enables us to exclude socioeconomic differences as explanations of the caste gap in performance. _ ___ *Corresponding author: Hoff (email: [email protected] ). We gratefully thank Muriel Niederle for advice at an early stage of this work. We owe a special debt to Anaka Narayanan and Ram Pratap for their assistance with data collection. We thank members of the MacArthur Foundation Network on the Effects of Inequality, Chris Barrett, Sam Bowles, Jeffrey Carpenter, Jean Drèze, Ernst Fehr, Vijayendra Rao, Michael Walton and, especially, Ken Sokoloff for very helpful comments and discussions. We also thank seminar participants at Boston University, Brookings, Cornell, LSE, the Harvard-MIT development seminar, the MacArthur Research Network on Norms, and the World Bank. This work was made possible by a grant from the World Bank-Netherlands Partnership Program, with additional support from the MacArthur Research Network on the Effects of Inequality..

Welcome message from author
This document is posted to help you gain knowledge. Please leave a comment to let me know what you think about it! Share it to your friends and learn new things together.
Transcript

BELIEF SYSTEMS AND DURABLE INEQUALITIES
An Experimental Investigation of Indian Caste
Karla Hoff and Priyanka Pandey
World Bank
This version, November 2005; Last version, June 2004
Abstract . We conducted an experiment in rural North India that shows
persistently that publicly revealing individuals’ social identity has significant
effects on individuals’ behavior even when that information is unrelated to rewards.
These results are of interest because they suggest the possibility that if there is a
belief system that stigmatizes members of a particular social group and if
individuals are publicly identified as members of that group, their behavior
responds by conforming to the belief system. 198 low caste and 198 high caste
junior high school male students in rural India performed the task of solving mazes
under economic incentives. There were no caste differences in performance when
the participants’ names or caste identities were not publicly revealed, but publicly
revealing social identities created a large and robust caste gap. When a random
draw was introduced to determine who within the group would receive rewards for
mazes solved, the caste gap disappeared. The experimental design enables us to
exclude socioeconomic differences as explanations of the caste gap in performance.
_ ___ *Corresponding author: Hoff (email: [email protected]). We gratefully thank Muriel Niederle for advice at an early stage of this work. We owe a special debt to Anaka Narayanan and Ram Pratap for their assistance with data collection. We thank members of the MacArthur Foundation Network on the Effects of Inequality, Chris Barrett, Sam Bowles, Jeffrey Carpenter, Jean Drèze, Ernst Fehr, Vijayendra Rao, Michael Walton and, especially, Ken Sokoloff for very helpful comments and discussions. We also thank seminar participants at Boston University, Brookings, Cornell, LSE, the Harvard-MIT development seminar, the MacArthur Research Network on Norms, and the World Bank. This work was made possible by a grant from the World Bank-Netherlands Partnership Program, with additional support from the MacArthur Research Network on the Effects of Inequality..

Most studies of discrimination focus on the impact of discrimination on individuals’
opportunities, and do not focus on the impact of social identity on the way individuals
respond to a given opportunity. One important exception is research on “stereotype and
social identity threat,” which has found that when a stereotyped identity—or an ability or
deficiency stereotypically associated with an individual’s social identity—is primed,
performance changes in the direction predicted by the stereotype.1 For example, black
test performance declines when race is primed.2 When a task is described as a test of
natural athletic ability, blacks perform better than whites among a sample of U.S. college
students; but when the same task is described as a test of intelligence, the race gap is
reversed.3 We investigated the effect on behavior of publicly revealing information
about an individual’s social identity. Can revealing such information affect an
individual’s behavior in contexts in which the information is irrelevant to the rewards that
he obtains?
We hypothesized that publicly revealing an individual’s membership in a
discriminated against group would affect his ability to respond to an opportunity. The
following line of argument suggests this hypothesis. Models that incorporate a
preference for fairness predict behavior in many contexts much better than those that do
not,4 which implies that a discriminatory regime is much more likely to survive if the
discrimination has a normative basis rather than being imposed only by the power of
superior arms. History provides many examples in which discriminatory practices were 1 Steele, Spencer, and Aronson , 2002. 2 Steele and Aronson 1995, and ***[golf exp.],. A survey of recent is Steele, Spence, and Aronson (2002). 3 Stone, Lynch, Sjomeling, and Darley 1999. 4 Fehr and Gachter 2000, and Fehr and Schmidt 1999..
1
justified by the unworthiness of the discriminated against group to enjoy the same rights
as others. The denial to free African Americans of the rights of U.S. citizenship under
pre-Civil War Supreme Court interpretations of the U.S. Constitution was justified by the
view that they were “an inferior class of being,”5 and the relegation of the low castes in
India to menial occupations was justified by the Brahminical teachings that castes were
ranked by “spiritual merit accumulated in past existences.”6 Thus in many cases
discrimination not only imposes external constraints, but also creates a “spoiled social
identity”7—which the evidence on social identity threat would predict has additional
effects on behavior.
1. A design to study the effect of belief systems on economic behavior
Our hypothesis predicts that publicly announcing information that reveals an individual’s
membership in a discriminated against group changes his ability or propensity to respond
to opportunity. In order to test the hypothesis, the experiment confronts subjects with an
actual economic opportunity—to solve mazes under piece rate incentives. We
investigated how publicly revealing information that bears on an individual’s
membership in a discriminated against group affects the number of mazes that he solves.
We investigate this hypothesis in the context of a specific example of
discrimination—the Indian caste system. The caste system divides society into mutually
exclusive groups, and caste membership is fixed by birth. Discrimination against low
5 Dred Scott v. Sandford 60 US 393 (1857). 6 Galanter, 1984, p. 18. See Gupta 2000 pp. 1 -7 for the perspective of the low castes. Historical studies of the role of myth making in legitimizing the dominance of one social group over another are Lorcin (1995 (on Algeria) and Dircks 2001 (on British India). 7 Loury, 2002.
2
caste individuals is illegal but remains a visible part of Indian society, especially in rural
areas.8
Subjects were male 6th and 7th graders in the north Indian state of Uttar Pradesh.
Subjects were from the lowest caste, Chamar,9 and the three highest castes: Thakur, Brahmin,
and Vaishya, which respectively constituted 70, 24, and 6 percent of the high-caste subjects.
In a household survey conducted near the site of the experiment, we found that 95 percent of
children of the lowest caste (Chamar) age 11-12 were in school, whereas the fraction of rural
children attending high school in Uttar Pradesh according to the national Sample Survey
(1995-96) is 59 percent. Thus, the 6th and 7th grade males in our sample are likely to be
representative of male children in North India, but older students would not have been..
Available evidence suggests that experimental findings using children may be
generalizable to adult behavior. Ambady et al. (2001) provide evidence that identity
activation affects children at an early age in a way similar to the effect on college
students, as demonstrated in Shih, Pittinsky, and Ambady (1999). There is also a growing
experimental literature on the economic behavior of children, which finds in a number of
domains (rational choice behavior, altruism, and strategic behavior) only small
differences between the behavior of 11-and 12-year olds and adults.10 According to
Harbaugh, Krause, and Berry (2001), in rational choice behavior over consumption,
“college students do no better than 11-year-old children.”
8Thorat 2002. The inequality of status between castes is ritualized in their daily interactions. In a household survey near the site of our experiment, 56 percent of low caste men report that they sit on the ground or remain standing when visiting a high-caste household. Likewise, 58 percent of high-caste men say that when a Schedule Caste person visit their house, he sits on the ground or remains standing (Hoff, Pandey, and Das Gupta 2005). 9Chamars are the principal caste of dalits (Untouchables) in the survey area. Current censuses of India distinguish only very broad caste groups. In 1971, in Uttar Pradesh Chamars numbered 10.1 million or 55 percent of dalits, and dalits represented 21 percent of the total population. 10See, e.g., Murningham and Saxon (1998) and Harbaugh and Krause (2000).
3
In our experiment, for each session we brought subjects into a classroom six at a
time. Children in a session had no opportunity to communicate verbally with each other
before or during an experimental session. The six subjects comprised three low caste and
three high caste children. The method of recruitment, which we describe in an appendix,
was designed to ensure that the children would not in general know each other. The
children also did not know the experimenters, who were high caste women. We
conducted the treatments in January and March 2003 and March 2005.11 In 2003, in
post-play interviews, low and high caste subjects, respectively, reported knowing on
average 1.40 and 1.47 of the other five in the group. In post-play interviews conducted in
2005, subjects reported knowing no other individuals in the group. When we regress,
within each experimental condition, performance on caste, controlling for the number of
other subjects an individual knows in his group as well as family background, we find
that the results on the caste gap are robust (see Table A6 in Hoff and Pandey 2004).
To recruit subjects, our staff went to either their homes or their schools (see
appendix on recruitment). Just before a child boarded the car that brought him and others
in his village to the site of the experiment, a member of our staff privately checked with
him that his name and caste matched the list that the driver had received, and also asked
him, privately, his father’s and grandfather’s name. (Sometimes but not always the child
indicated surnames, and we accepted whatever names the child gave.)
11 The weather was colder in March than in January, and we used a different staff in 2005 than in 2003. To
check for bias arising from differences in experimental conditions across time periods, we use the Mann-
Whitney test for rounds in January 2003, March 2003, and March 2005 with identical reward and
information conditions. We find no significant differences across time.
4
Three conditions generate the contrasts necessary to measure the effect of
publicly revealing information about social identity. In the control condition, termed
“anonymous” (A), the experimenter never publicly refers to the children by name nor
publicly reveals any information about them. In the condition termed “names revealed”
(N), at the beginning of the experimental session the experimenter turns to each of the six
children and states his name, village, father’s name, and paternal grandfather’s name. The
experimenter asks the child to nod if the information is correct. In the condition called
‘caste revealed” (C), the experimenter behaves exactly as in “names revealed” except that
after stating the participant’s paternal grandfather’s name, the experimenter states also the
child’s caste.
An aspect of caste that the experiment exploits is that a child’s caste cannot
generally be discerned from his physical appearance, except in particular cases where a
child’s clothing and grooming (either very poor or very good) may reveal it. Surnames,
in contrast, often reveal caste. One indication of that is that the Congress Party of India
has “in principle” welcomed a proposal to amend the Constitution of India to abolish
Hindu surnames because they denote caste.12
Participants in the experiment were asked to solve mazes in two 15-minute
rounds. In each of the two rounds, the subject received a packet of 15 mazes.13 The
number of mazes solved in each round is the primary dependent variable. The incentive
system was piece rate—1 rupee per maze (2.2 U.S. cents). Before Round 1 and again
before Round 2, the experimenter tested every subject’s understanding of the incentive
12Poornima Joshi, “Slash Surname to Kill Caste,” The Telegraph, October 15, 2005. 13 The mazes can be found at http://games.yahoo.com/games/maze.html. We used mazes of level 2, where 1 = easy and 5 = difficult. The mazes were enlarged to fit A-4 paper.
5
scheme. She did not proceed until each subject could answer the test questions correctly;
see the Instructions in Appendix A. An experimental session lasted one hour, but
transportation and waiting times meant that children lost approximately one-half day’s
time. Average earnings, not counting the show-up fee of 10 rupees, were one third of a
one-half day’s wage (0.16 times a day’s wage, assuming daily wage to be Rs. 50). Not
counting the show-up fee, the top performers earned a one-half day’s unskilled wage (the
top performers earned Rs. 25). The children were paid the show-up fee at the beginning
of the experimental session, and were paid their earnings in sealed envelopes after the
mazes were graded.
A total of 168 low caste and 168 high caste children participated in 56 sessions
under the piece rate incentive: 156 under the A condition, 60 under the N condition, and
120 under the C condition.
2. Predicted differences in performance across treatments
The A, N, and C conditions generate the contrasts necessary to measure the effect on
performance of making social identity salient. The central hypothesis is that as we
increase the salience of social identity, we will increase the caste gap in performance.
Revealing personal information, however, may have various psychological
effects on individuals. It may make individuals self-conscious, create anxiety because the
purpose of naming their fathers and grandfathers is unclear, and remind subjects of a
village of which they might be proud or ashamed. Thus, within the low or the high caste
group, our hypothesis does not make a prediction about the A-N contrast. The N-C
contrast is ideal for examining the role that caste identity plays, since these two
treatments are identical except that in the C treatment the experimenter also publicly
6
reveals the child’s caste. If the N-C contrast is slight, then that implies that if moving
from the A to the N condition creates (or widens) a caste gap in performance, then the
reason that it does so is the effect of making caste identity salient.
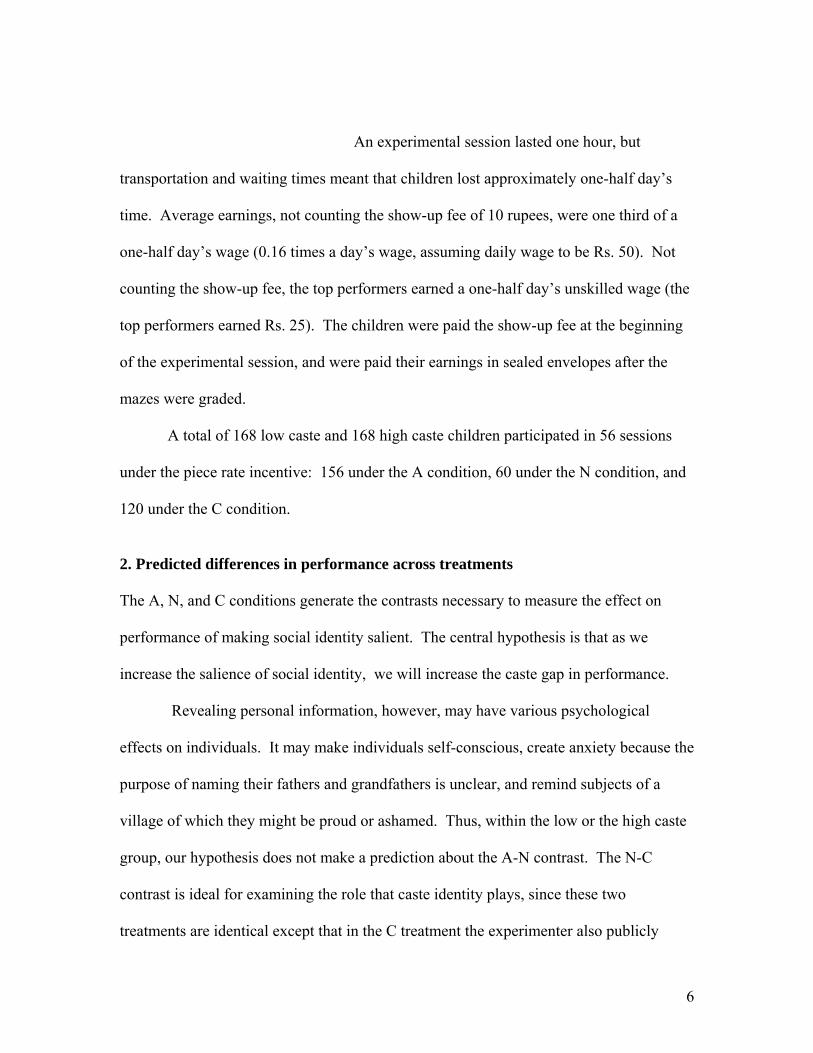
The results provide clear support for the hypothesis that as we increase the
salience of social identity, by moving from condition A to N to C, we increase the caste
gap in performance in both Rounds 1 and Round 2 (Table 1 and Figure 1). We will
compare distributions using the non-parametric two-sided Mann-Whitney U-test. In all
three conditions under the same piece rate incentive (A, N, and C), average performance
of the high caste exceeded the average performance of the low caste, but the gap was
significant only in conditions N and C. In condition A, in which no detail of social
identity is publicly revealed, p = 0.24 and 0.45 for Rounds 1 and 2, respectively. In
condition N, in which names are publicly revealed, p = .0.09 and 0.04 for Rounds 1 and
2, respectively. In condition C, in which caste as well as names are publicly revealed, p
= .0.04 and 0.01 for Rounds 1 and 2, respectively . In Round 2, the average number of
mazes solved by the high caste minus the average number solved by the low caste rises
from 0.33 mazes (condition A) to 1.06 mazes (condition N) to 1.84 mazes (condition C).
The vertical bars in the figure represent statistically significant caste gaps as measured by
the p-values.14
The absence of a significant difference in the performance of low and high caste
subjects in the anonymous condition suggests factors that do not create the caste gap.
Low- and high-caste subjects have different backgrounds. Only 14 percent of low-caste
subjects have a mother with at least primary schooling, whereas 42 percent of high-castes
14 Nothing changes when we measure statistical significance by the t-test, which assumed normality, instead of by the Mann-Whitney test, which is non-parametric.
7
subjects do. Only 50 percent of the low-caste subjects have a father with at least primary
schooling, whereas 80 percent of the high-castes subjects do. But the difference in
parents’ education is not reflected in a caste gap in performance.15 Thus, for the
dimension of performance measured in our experiment (the ability to look ahead to detect
dead ends), developmental disadvantages do not lead to patterns of capacities and
dispositions that perpetuate inequalities. The ability to solve mazes appears to be
unrelated to caste differences in familial or group-based educational experience. The
large improvement on average between rounds is consistent with an important role for
“learning by doing” in this experiment. The average improvement in the anonymous
condition is more than one standard deviation of the average number of mazes solved in
Round 1 score (standard deviation of Round 1 scores in condition A is 1.98, the average
improvement is 2.47 mazes). The proportionate increase is 79.5 percent for the low caste
and 74.4 percent for the high caste.
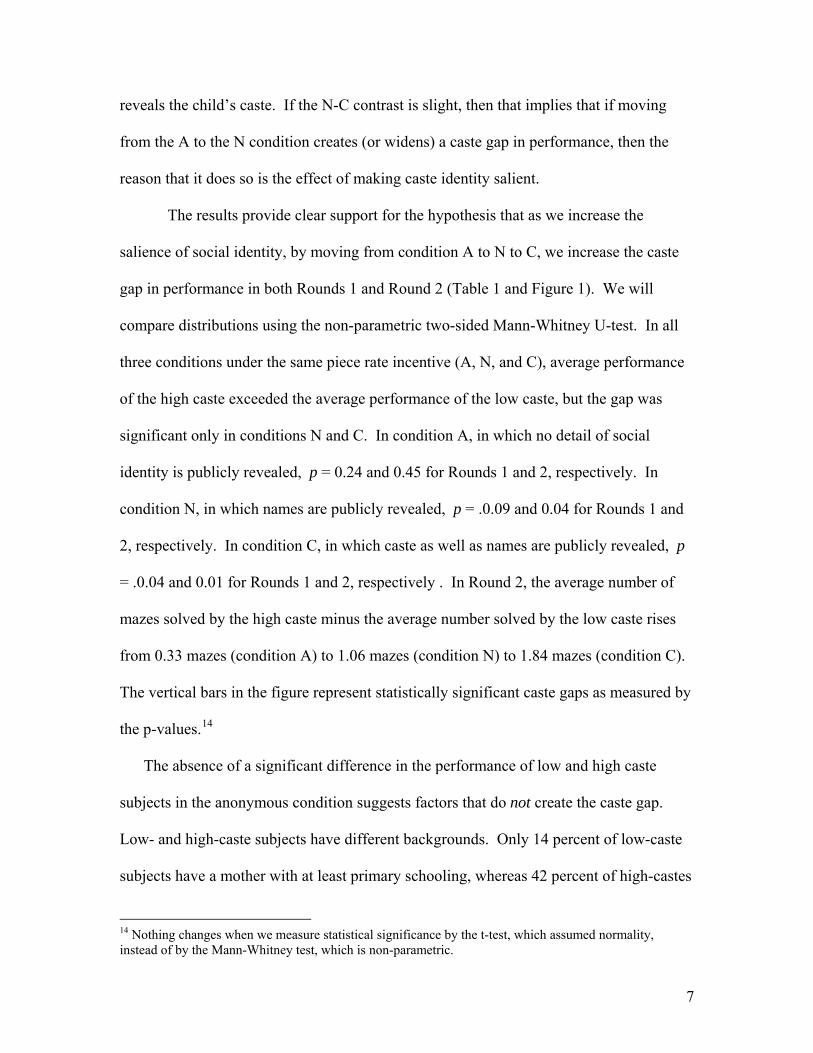
Table 1. Average number of mazes solved, by caste, and statistical tests of the caste gap
Round 1 Round 2
Condition Low caste High caste
p-value of Mann-Whitney test of differences by caste
in the distributions Low caste High caste
p-value of Mann-Whitney test of differences by caste
in the distributions
Anonymous 3.08 3.36 0.24 5.53 5.86 0.45 Names revealed 2.37 2.97 0.09 3.17 4.23 0.04 Caste revealed 2.62 3.43 0.04 4.28 6.12 0.01 Random winner 2.80 3.20 0.42 5.40 5.03 0.61 15This result tallies with our finding in regressions that parents’ education levels are not significant predictors of performance in the maze game, controlling for individual variables (appendix tables available from the authors, and working paper, Tables A-5 – A-9).
8
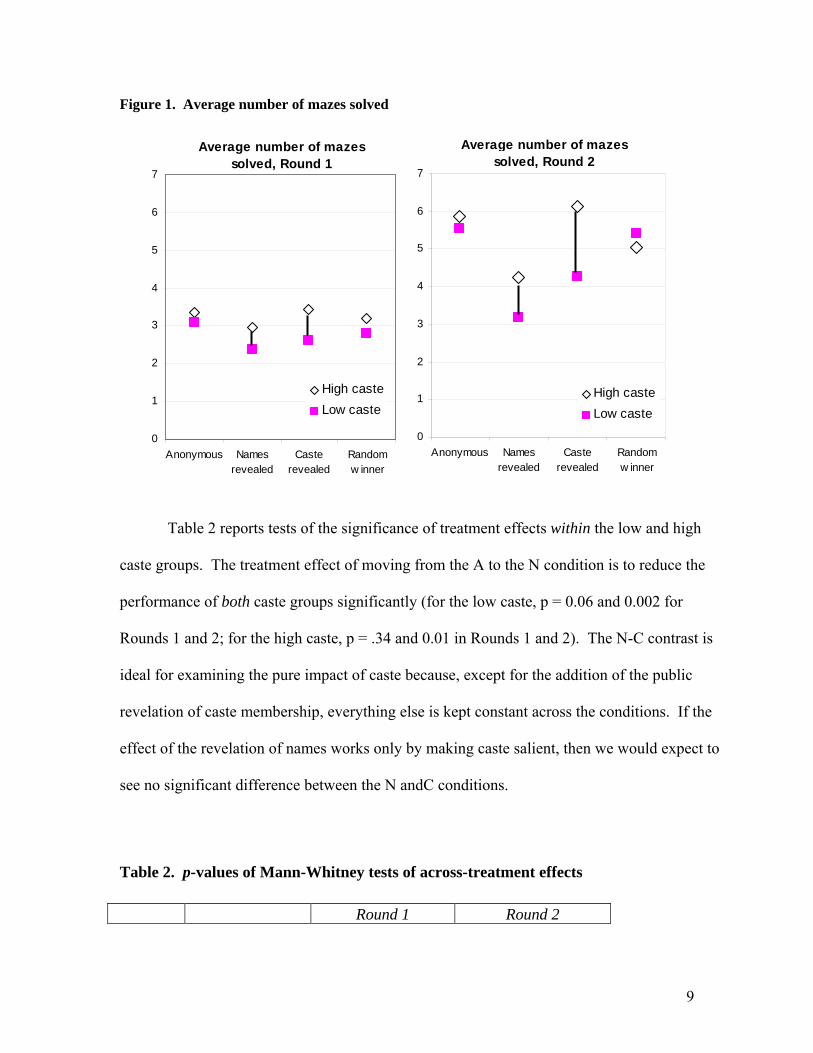
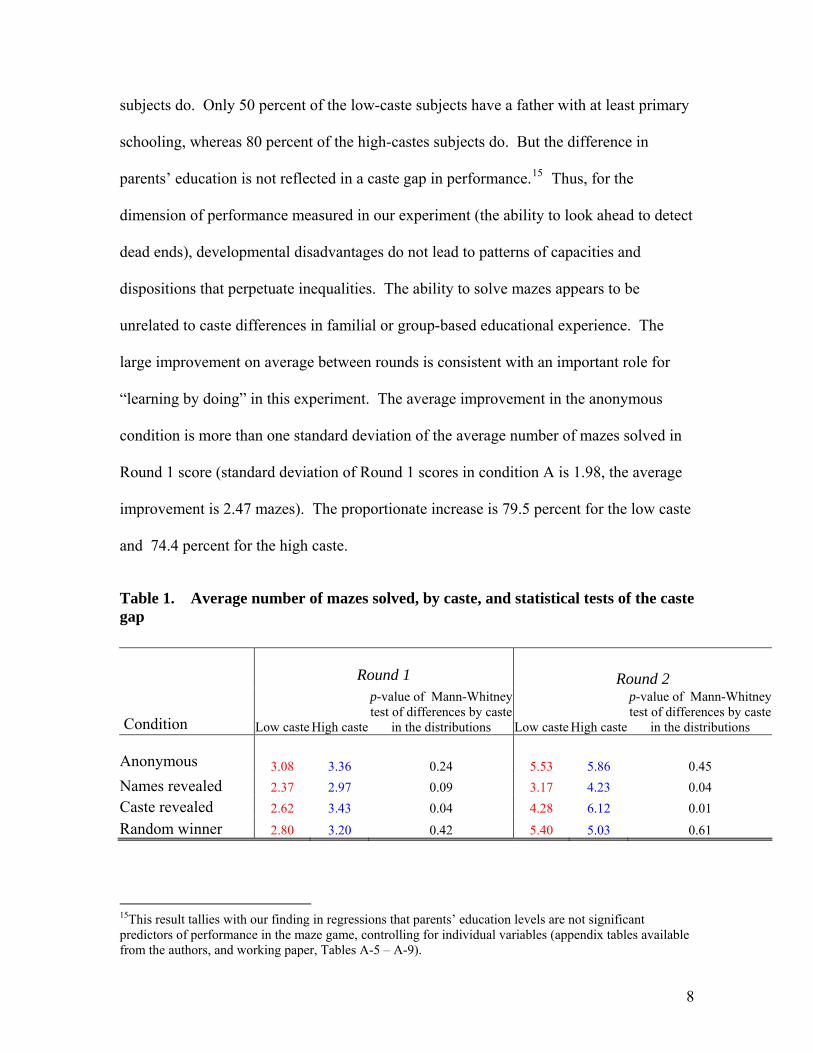
Figure 1. Average number of mazes solved
Average number of mazes solved, Round 1
0
1
2
3
4
5
6
7
Anonymous Namesrevealed
Casterevealed
Randomw inner
High casteLow caste
Average number of mazes solved, Round 2
0
1
2
3
4
5
6
7
Anonymous Namesrevealed
Casterevealed
Randomw inner
High casteLow caste
Table 2 reports tests of the significance of treatment effects within the low and high
caste groups. The treatment effect of moving from the A to the N condition is to reduce the
performance of both caste groups significantly (for the low caste, p = 0.06 and 0.002 for
Rounds 1 and 2; for the high caste, p = .34 and 0.01 in Rounds 1 and 2). The N-C contrast is
ideal for examining the pure impact of caste because, except for the addition of the public
revelation of caste membership, everything else is kept constant across the conditions. If the
effect of the revelation of names works only by making caste salient, then we would expect to
see no significant difference between the N andC conditions.
Table 2. p-values of Mann-Whitney tests of across-treatment effects
Round 1 Round 2
9

Treatment Names revealed
Caste revealed
Names revealed
Caste revealed
Anonymous 0.06 0.14 0.002 0.05 Low caste Names revealed 0.69 0.13
Anonymous 0.34 0.83 0.01 0.85 High caste Names revealed 0.55 0.01
.
For the low caste, there is indeed no significant treatment effect in moving from
condition N to C: (p = 0.69 in Round 1 and 0.13 in Round 2). This is perhaps surprising,
since the experimenter used the traditional name, Chamar, for the low caste, which, while it is
the term commonly used in the village, it is also a term of insult. This name is still in
widespread use in the area where we conducted the experiment.16 The name Chamar is
recorded in the schools’ enrollment books. Villagers, including children, commonly refer to a
village person by the traditional name for his caste: a Chamar caste person is referred to as
Chamar and a Thakur caste person as Thakur. The absence of a significant N-C contrast for
the low caste suggests that revealing caste publicly has no power to influence the behavior of
individuals whose names, father’s name, grandfather’s name, and village have already been
publicly revealed. One interpretation is thus that if a low caste individual feels that his
identity (“where he comes from”) is made public, then he also feels that his caste is publicly
revealed.
16 In the 1998-99 Indian National Family Health Survey, households had to self-name their caste (jati) in one of the questions. Among the low caste households, while most respondents (including those in Uttar Pradesh) gave their actual caste name (Chamar caste households gave their jati as Chamar), only some used the more generic names harijan or Scheduled Caste, and not one respondent chose the term dalit (see Marriott 2003). We believe that our usage of the term Chamar for children of this caste is justified given that it is the commonly used term for this caste in the area. Use of another term like Scheduled Caste or harijan was not feasible for the experiment since these would be inclusive of a number of low castes and moreover, not all 11-12 year olds would have understood what these meant.
10
This statement does not, however, apply to the results we obtained for the high
caste subjects. Names as a vehicle for making caste salient is less powerful for the high
caste than the low caste. For the high caste, the treatment effect of moving from N to C
raises the performance of the high caste significantly (p = 0.01). This is consistent with
the interpretation that publicly revealing (high) caste identity increases effort, perhaps by
improving self-image and thus increasing the returns to effort and thus increasing the
effort that is expended.
We can now consider the treatment effect from condition A to C as the sum of the
treatment effects A-N and N-C. We saw that for both caste groups, the A-N contrast was
associated with a significant decline in performance. For the high caste, but not for the
low caste, the N-C contrast was significant (in Round 2) and led to an increase in
performance. Given that, for the low caste, the A-C contrast is significant in Round 2 (p
= .05), whereas for the high caste, the A-C contrast is not significant (p > 0.80 in both
rounds).
Taken together, the experimental results show that social groups with
demonstrably similar ability to perform under piece rate incentives—when information
about their social identity is not publicly revealed—nonetheless perform very differently
if names and caste are revealed. The debilitating effect on the low caste of publicly
revealing this information is not due to a momentary shock, since the effect is more
important (in proportionate terms and in terms of statistical significance) in Round 2 than
in Round 1.
A possible explanation for these results is that individuals adapt according to how
they expect to be perceived and treated, which is to say that they adapt differently
11
depending on their caste. We can distinguish three impacts of publicly revealing caste
identities: (a) It makes caste identity common knowledge, (b) it shows that the
experimenter is concerned with caste, and (c) it makes caste very salient because the
announcement occurs in the presence of five peers.
We considered one final treatment, “Random Winner,” to explore the effect of
making social identity less salient. In this treatment, Round 1 is exactly the same as in
condition C, but in Round 2, the incentive scheme is new. In the new incentive scheme, a
randomly chosen subject in the group is paid at the rate of 6 rupees per maze; the others
receive nothing. The mean return per maze solved is thus one rupee, as in all other
incentive schemes. To explain the concept of randomness, the experimenter used slips of
paper on which each participant wrote his name. The experimenter’s assistant showed
how the slips would be tossed together in a glass jar, from which one folded slip would
be chosen at the end of the experiment. 30 low caste and 30 high caste subjects
participated in 10 sessions of the Random Winner treatment.
The Random Winner condition preserves the first impact of publicly revealing
caste identities (common knowledge), but mitigates the second and third. It mitigates
experimenter concern by suggesting that she eschews using caste as a basis for assigning
rewards. She conveys this by bringing into play an overtly unbiased mechanism for
assigning rewards. The treatment also mitigates the salience of caste and perhaps the
perception of the social distance between castes because all subjects’ names are tossed
together in a pot from which one name will be chosen.17
We found that moving from condition C to the Random Winner condition raises
the mean performance of the low caste and thereby eliminates the significant negative 17 Bohnet and Frey (1999) show in a different context that even minor changes in social distance affect behavior.
12
caste gap that occurred in condition C. The low caste now outperforms the high caste,
but not significantly18 (p = .61). Figure 1 shows that the Random Winner reward scheme
more than fully closes the caste gap in average performance that emerged in conditions N
and C (where the low caste underperformed the high-caste by an average of 25 percent
and 30 percent, respectively, in Round 2 and the gaps were highly significant—(p=.04
and .01, respectively).
The results in Random Winner cannot plausibly be explained by caste differences
in risk aversion, since the low caste subjects are on average poorer than the high caste
subjects. Most households in these villages depend on agriculture. For the subsample of
our subjects for which we collected land data, the households of the low caste subjects
own only 39 percent as much land on average as those of the high-caste subjects. The
impact of the introduction of randomness in choosing the winner might have a purely
psychological explanation. In this view, making caste identity salient debilitates
performance because of a social psychological response (e.g., self-stereotyping). The
boost to low-caste performance in Random Winner arises because the randomization
process makes social identity less salient. 19
Learning provides another performance measure by which to gauge the effect of
publicly revealing information about identity. Let Δ denote, for each participant, the
number of mazes he solved in Round 2 less the number he solved in Round 1. The
treatment effect of moving from the A to N condition, and also from A to C, is to shift the
18 The p-values comparing performance in Round 2 between Random Winner and the anonymous condition are .91 and .56 respectively for low and high castes. 19 In each condition, before Round 1 and again before Round 2, we tested every subject’s understanding of the incentive scheme—see the Instructions in Appendix A. We believe it is unlikely that the children did not understand the incentive scheme.
13
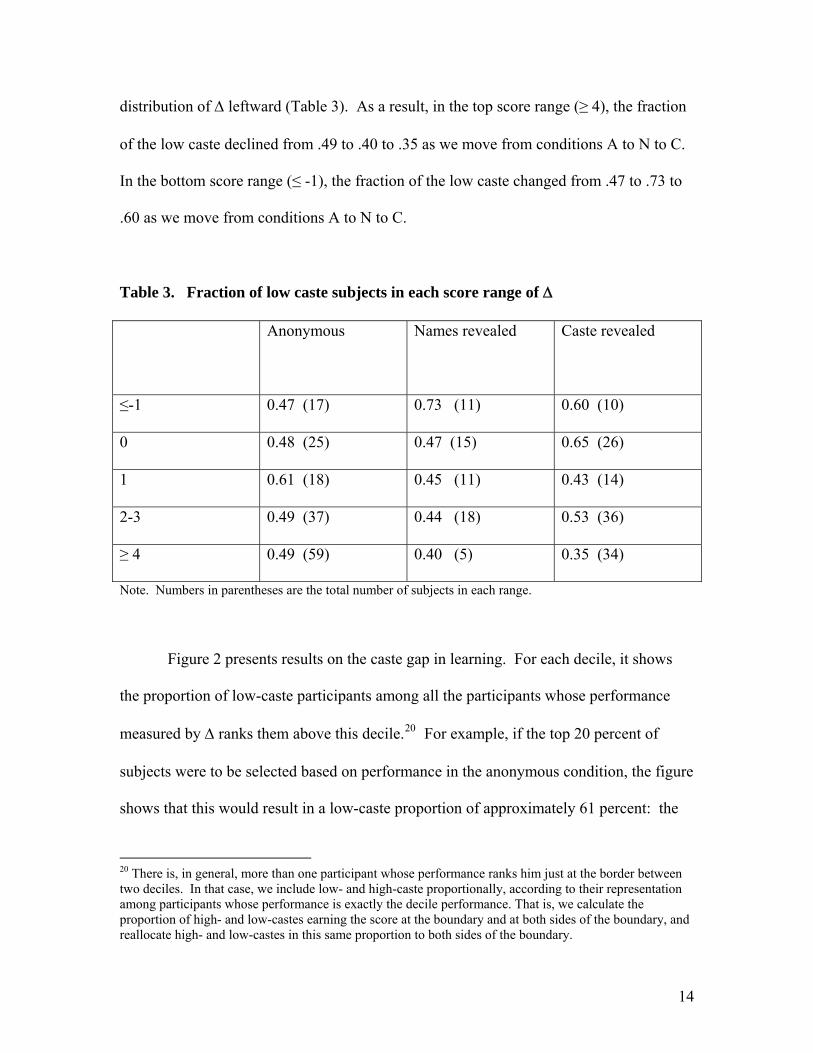
distribution of Δ leftward (Table 3). As a result, in the top score range (≥ 4), the fraction
of the low caste declined from .49 to .40 to .35 as we move from conditions A to N to C.
In the bottom score range (≤ -1), the fraction of the low caste changed from .47 to .73 to
.60 as we move from conditions A to N to C.
Table 3. Fraction of low caste subjects in each score range of Δ
Anonymous
Names revealed Caste revealed
≤-1 0.47 (17) 0.73 (11) 0.60 (10)
0 0.48 (25) 0.47 (15) 0.65 (26)
1 0.61 (18) 0.45 (11) 0.43 (14)
2-3 0.49 (37) 0.44 (18) 0.53 (36)
≥ 4 0.49 (59) 0.40 (5) 0.35 (34)
Note. Numbers in parentheses are the total number of subjects in each range.
Figure 2 presents results on the caste gap in learning. For each decile, it shows
the proportion of low-caste participants among all the participants whose performance
measured by Δ ranks them above this decile.20 For example, if the top 20 percent of
subjects were to be selected based on performance in the anonymous condition, the figure
shows that this would result in a low-caste proportion of approximately 61 percent: the
20 There is, in general, more than one participant whose performance ranks him just at the border between two deciles. In that case, we include low- and high-caste proportionally, according to their representation among participants whose performance is exactly the decile performance. That is, we calculate the proportion of high- and low-castes earning the score at the boundary and at both sides of the boundary, and reallocate high- and low-castes in this same proportion to both sides of the boundary.
14

low caste out-performs the high caste at the highest levels of performance. But the
comparable figure for condition C is 37 percent; in that social context, the low caste is
underrepresented at the highest levels of performance.
If there were no caste differences in performance, all graphs would be at the 50
percent line in Figure 2. The graph of the anonymous condition is at or near the 50
percent line except for the top performers, where the graph is above the line for the top-
scoring deciles, indicating that the low caste is overrepresented among the best
performers. The 50 percent line divides the graphs fairly cleanly into two groups: the
anonymous condition and Random Winner are in the top half; the treatments where
names or (names plus) caste are announced, except for Random Winner, are in the lower
half. As social context changes, subjects adapt differently depending on their caste.21
21 An important distinction, emphasized in Cohen and Steele (2002), is between mistrust in oneself when social identity is salient, and mistrust in the procedural fairness of others when social identity is public. Given that the low caste is considered in the traditional Hindu caste system as unworthy of rights, this experiment cannot distinguish between these two kinds of mistrust. We cannot reject the view that the Random Winner treatment, compared to conditions N and C, improves low-caste performance because the even-handed way that the names of low- and high-caste subjects are tossed into the jar from which the winner’s name is to be chosen, changes the self-image of a low-caste participant from that of an unworthy person to that of a worthy person. One would like to undertake this experiment among Hindus living in a community without a recent history or current experience of discrimination against Untouchables and to use experimenters who were themselves Untouchables. In that setting, if the announcement of caste had no effect on performance, that would provide evidence that distrust of authority figures, not an internalized social identity of unworthiness in the eyes of authority figures, caused the performance differential that we observed in our setting when caste was announced.
15
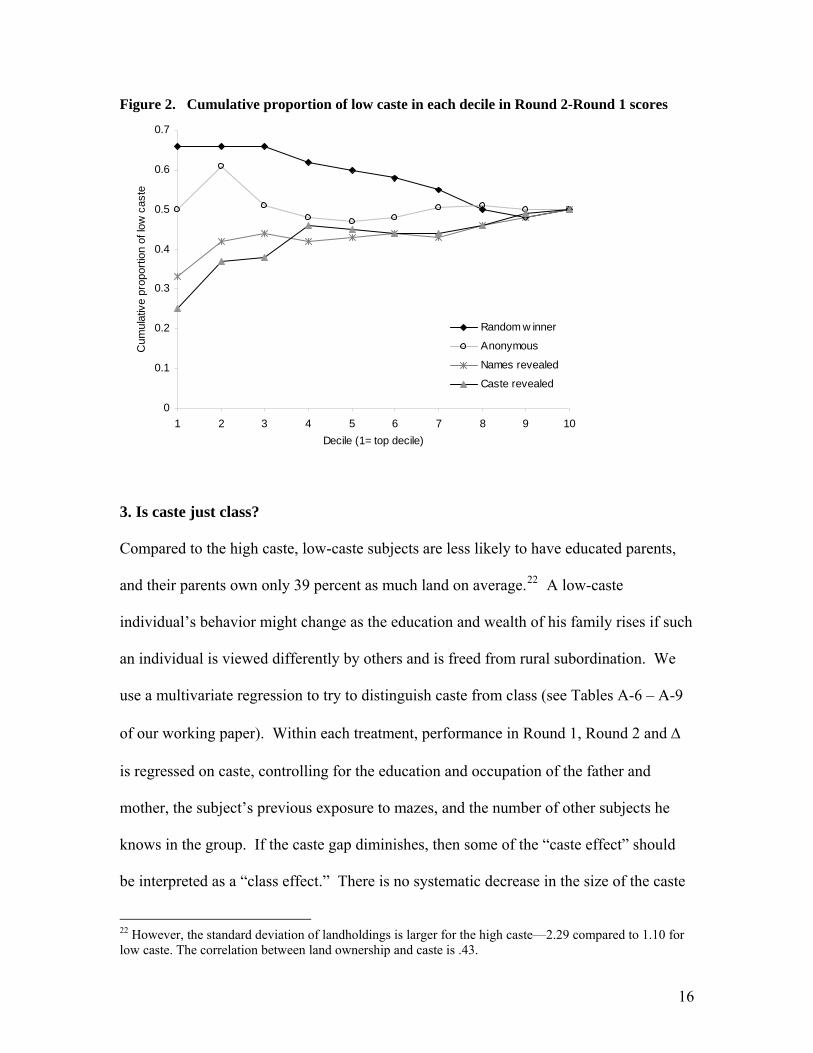
Figure 2. Cumulative proportion of low caste in each decile in Round 2-Round 1 scores
0
0.1
0.2
0.3
0.4
0.5
0.6
0.7
1 2 3 4 5 6 7 8 9 10Decile (1= top decile)
Cum
ulat
ive
prop
ortio
n of
low
cas
te
Random w inner
Anonymous
Names revealed
Caste revealed
3. Is caste just class?
Compared to the high caste, low-caste subjects are less likely to have educated parents,
and their parents own only 39 percent as much land on average.22 A low-caste
individual’s behavior might change as the education and wealth of his family rises if such
an individual is viewed differently by others and is freed from rural subordination. We
use a multivariate regression to try to distinguish caste from class (see Tables A-6 – A-9
of our working paper). Within each treatment, performance in Round 1, Round 2 and Δ
is regressed on caste, controlling for the education and occupation of the father and
mother, the subject’s previous exposure to mazes, and the number of other subjects he
knows in the group. If the caste gap diminishes, then some of the “caste effect” should
be interpreted as a “class effect.” There is no systematic decrease in the size of the caste
22 However, the standard deviation of landholdings is larger for the high caste—2.29 compared to 1.10 for low caste. The correlation between land ownership and caste is .43.
16

gap when one controls for individuals’ backgrounds. In Round 2, we obtain the following
results: In condition A, the caste gap estimated in the regression is 0.77 (p = 0.36),
compared to a raw caste gap of 0.33. In condition N, the caste gap estimated in the
regression is 1.79 (p = 0.09), compared to a raw caste gap of 1.06. In condition C, the
caste gap estimated in the regression is 3.37 (p =0.02), compared to a raw caste gap of
1.84.
Because of the difficulty of obtaining information on land ownership, the sample
size is much smaller when we control for land, and we have land data only for conditions
A and C. 23 We find that the caste gap remains significant in Round 2 of condition C,
but is not significant in Round 1.24 The evidence suggests that the effect of caste is not
an artifact of class differences between low and high castes.
4. Conclusion We conducted an experiment in rural North India that shows persistently that publicly
revealing individuals’ social identity has significant effects on individuals’ behavior even
when that information is unrelated to rewards. These results are of interest because they
suggest the possibility that if there is a belief system that stigmatizes members of a
particular social group and if individuals are publicly identified as members of that group,
then their behavior responds by conforming to the belief system. The results are
consistent with the perpetuation of self-fulfilling discriminatory belief systems.
23We collected the land data independently and checked questionable entries with the Land Records administrator. 24 Controlling for land ownership and other individual and household characteristics, it is estimated that high caste boosts Round 1 performance by 1.63 mazes in Round 1 and 3.05 mazes in Round 2, compared to a raw caste gap of .35 mazes in Round 1 and 1.78 in Round 2.
17

The experiment was designed in such a way that identity itself has no effect on
rewards. A consistent interpretation of the results is that the social context of being
publicly identified makes people feel less self-confident and therefore lowers their
expected returns to effort and therefore the effort that they expend. These results are a
clear rejection of the rational actor model, where an individual’s knowledge of himself at
a moment in time—while it may be imperfect—is fixed. At the very least, these results
=how the power of social identity to shape economic behavior.
18
References Ambady, Nalini, Margaret Shih, A. Kim, and Todd L. Pittinsky, 2001. “Stereotype
Susceptibility in Children: Effects of Identity Activation on Quantitative Performance,” Psychological Science 12: 385-90.
Bohnet, Iris and Bruno S. Frey. 1999. “Social Distance and Other-Regarding Behavior in
Dictator Games: Comment.” American Economic Review 89 (1): 335-339. Cohen, G. L. and Steele, C. M. (2002). ‘A Barrier of Mistrust: How Negative
Stereotypes Affect Cross-Race Mentoring,’ in Aronson, Joshua (ed.), Improving Academic Achievement, Amsterdam: Elsevier Science Publishers.
Dircks, N. B. (2001). Castes of Mind: Colonialism and the Making of Modern India,
Princeton, New Jersey: Princeton University Press. Fehr, E. and Gachter, S. (2000). ‘Cooperation and Punishment in Public Goods
Experiments,’ American Economic Review, 90(4), pp. 980-994. Fehr, E. and Schmidt, K.M. (1999). ‘A Theory of Fairness, Competition, and
Cooperation,’ Quarterly Journal of Economics, 114(3), pp. 817-868. Galanter, Marc. 1984. Competing Equalities: Law and the Backward Classes in India.
Berkeley, CA: University of California Press. Gneezy, Uri, Muriel Niederle, and Aldo Rustichini. 2002. “Performance in Competitive
Environments: Gender Differences,” Quarterly Journal of Economics, 118, 1049-1074.
Gupta, Dipankar. 2000. Interrogating Caste: Understanding Hierarchy and Difference in Indian Society. New Delhi: Penguin Books.
Hoff, Karla, Pandey, Priyanka, and Das Gupta, Monica, “Institutional Inertia in Local Government: Evidence from an Indian Village with Mandated Political Reservations,” World Bank, 2005, manuscript.
Hoff, Karla and Pandey, Priyanka “Belief Systems and Durable Inequalities: An
Experimental Investigation of Indian Caste,,” World Bank Policy Research Working Paper 3351, June 2004.
Harbaugh, W. T, Krause, K. and Berry T.R. (2001). GARP for Kids: On the
Development of Rational Choice Behavior. American Economic Review 91: pp. 1539-45.
Harbaugh, W. T. and Krause K. (2000). Children’s Altruism in Public Good and Dictator Game Experiments. Economic Inquiry 38, pp. 95-109.
19
Lorcin, P. M. E. (1995). Imperial Identities: Stereotyping, Prejudice and Race in Colonial
Algeria. London: I.B. Tauris Publishers. Loury, Glenn C. 2002. The Anatomy of Racial Inequality. Cambridge, MA: Harvard U. Press. Marriott, Alan. “Dalit or Harijan? Self-naming by Scheduled Caste Interviewees.”
Economic and Political Weekly, September 6-12, 2003, 3751-54. Murningham, J. K. and Saxon, M. S. (1998). ‘Ultimatum Bargaining by Children and
Adults’, Journal of Economic Psychology 19: pp. 415-45. Shih, Margaret, Todd Pittinsky, and Nalini Ambady. 1999. “Stereotype Susceptibility:
Identity Salience and Shifts in Quantitative Performance,” Psychological Science 10 (1): 80-83.
Steele, Claude M., Steven J. Spencer, and Joshua Aronson. 2002. “Contending with
Group Image: The Psychology of Stereotype and Social Identity Threat,” Advances in Experimental Social Psychology 34: 379-441.
Steele, C. M., & Aronson, J. (1995). ‘Stereotype threat and the intellectual test
performance of African-Americans,’ Journal of Personality and Social Psychology, 69, pp.797-811.
Stone, Jeff, Christian I. Lynch, Mike Sjomeling, and John M. Darley. 1999. "Stereotype
Threat Effects on Black and White Athletic Performance." Journal of Personality and Social Psychology 77 (6): 1213-27.
Thorat, Sukhadeo (2002). “Oppression and Denial: Dalit Discrimination in the 190s.” Economic and Political Weekly, February 9-15, 2002, pp. 572-578.
20
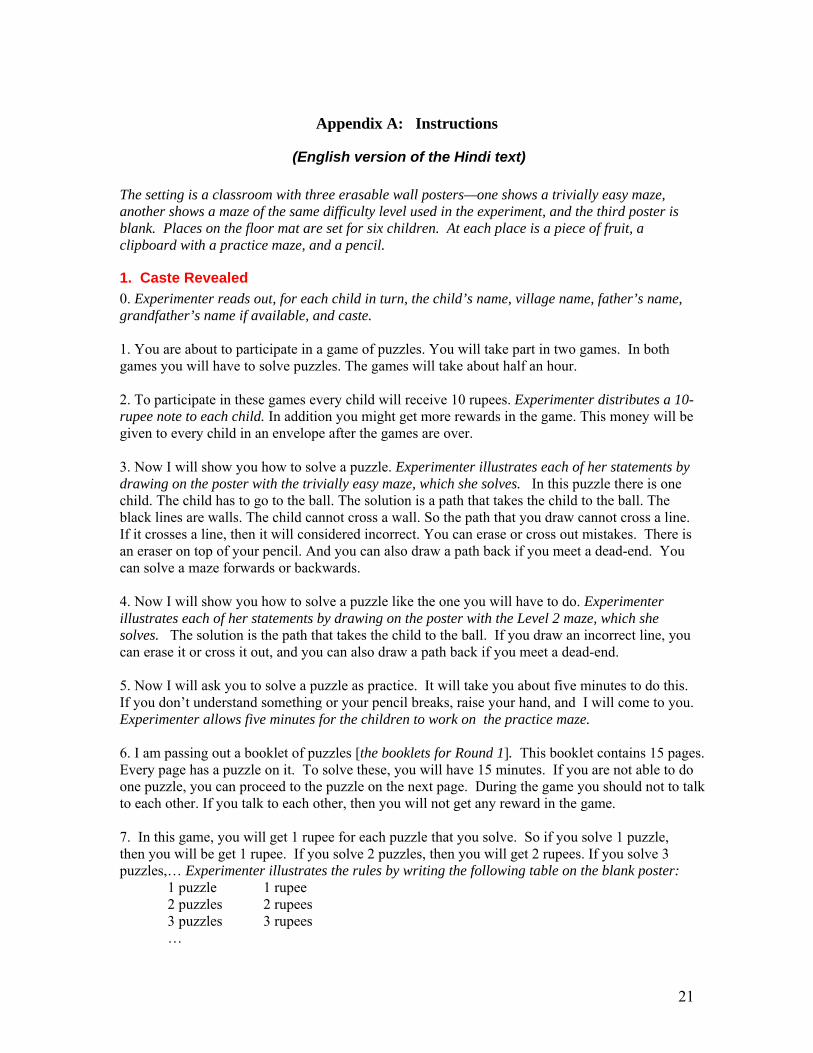
Appendix A: Instructions
(English version of the Hindi text) The setting is a classroom with three erasable wall posters—one shows a trivially easy maze, another shows a maze of the same difficulty level used in the experiment, and the third poster is blank. Places on the floor mat are set for six children. At each place is a piece of fruit, a clipboard with a practice maze, and a pencil.
1. Caste Revealed 0. Experimenter reads out, for each child in turn, the child’s name, village name, father’s name, grandfather’s name if available, and caste. 1. You are about to participate in a game of puzzles. You will take part in two games. In both games you will have to solve puzzles. The games will take about half an hour. 2. To participate in these games every child will receive 10 rupees. Experimenter distributes a 10-rupee note to each child. In addition you might get more rewards in the game. This money will be given to every child in an envelope after the games are over. 3. Now I will show you how to solve a puzzle. Experimenter illustrates each of her statements by drawing on the poster with the trivially easy maze, which she solves. In this puzzle there is one child. The child has to go to the ball. The solution is a path that takes the child to the ball. The black lines are walls. The child cannot cross a wall. So the path that you draw cannot cross a line. If it crosses a line, then it will considered incorrect. You can erase or cross out mistakes. There is an eraser on top of your pencil. And you can also draw a path back if you meet a dead-end. You can solve a maze forwards or backwards. 4. Now I will show you how to solve a puzzle like the one you will have to do. Experimenter illustrates each of her statements by drawing on the poster with the Level 2 maze, which she solves. The solution is the path that takes the child to the ball. If you draw an incorrect line, you can erase it or cross it out, and you can also draw a path back if you meet a dead-end. 5. Now I will ask you to solve a puzzle as practice. It will take you about five minutes to do this. If you don’t understand something or your pencil breaks, raise your hand, and I will come to you. Experimenter allows five minutes for the children to work on the practice maze. 6. I am passing out a booklet of puzzles [the booklets for Round 1]. This booklet contains 15 pages. Every page has a puzzle on it. To solve these, you will have 15 minutes. If you are not able to do one puzzle, you can proceed to the puzzle on the next page. During the game you should not to talk to each other. If you talk to each other, then you will not get any reward in the game. 7. In this game, you will get 1 rupee for each puzzle that you solve. So if you solve 1 puzzle, then you will be get 1 rupee. If you solve 2 puzzles, then you will get 2 rupees. If you solve 3 puzzles,… Experimenter illustrates the rules by writing the following table on the blank poster: 1 puzzle 1 rupee 2 puzzles 2 rupees 3 puzzles 3 rupees …
21
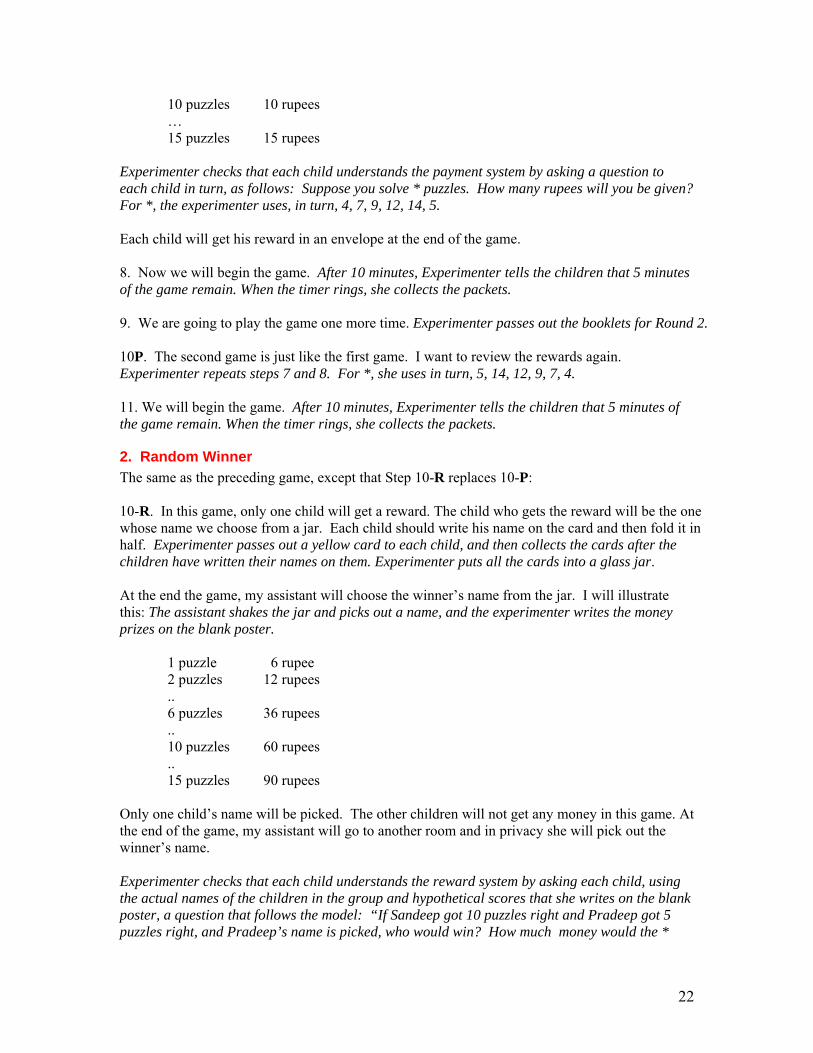
10 puzzles 10 rupees … 15 puzzles 15 rupees
Experimenter checks that each child understands the payment system by asking a question to each child in turn, as follows: Suppose you solve * puzzles. How many rupees will you be given? For *, the experimenter uses, in turn, 4, 7, 9, 12, 14, 5.
Each child will get his reward in an envelope at the end of the game.
8. Now we will begin the game. After 10 minutes, Experimenter tells the children that 5 minutes of the game remain. When the timer rings, she collects the packets. 9. We are going to play the game one more time. Experimenter passes out the booklets for Round 2. 10P. The second game is just like the first game. I want to review the rewards again. Experimenter repeats steps 7 and 8. For *, she uses in turn, 5, 14, 12, 9, 7, 4. 11. We will begin the game. After 10 minutes, Experimenter tells the children that 5 minutes of the game remain. When the timer rings, she collects the packets.
2. Random Winner The same as the preceding game, except that Step 10-R replaces 10-P: 10-R. In this game, only one child will get a reward. The child who gets the reward will be the one whose name we choose from a jar. Each child should write his name on the card and then fold it in half. Experimenter passes out a yellow card to each child, and then collects the cards after the children have written their names on them. Experimenter puts all the cards into a glass jar. At the end the game, my assistant will choose the winner’s name from the jar. I will illustrate this: The assistant shakes the jar and picks out a name, and the experimenter writes the money prizes on the blank poster. 1 puzzle 6 rupee
2 puzzles 12 rupees .. 6 puzzles 36 rupees .. 10 puzzles 60 rupees .. 15 puzzles 90 rupees
Only one child’s name will be picked. The other children will not get any money in this game. At the end of the game, my assistant will go to another room and in privacy she will pick out the winner’s name. Experimenter checks that each child understands the reward system by asking each child, using the actual names of the children in the group and hypothetical scores that she writes on the blank poster, a question that follows the model: “If Sandeep got 10 puzzles right and Pradeep got 5 puzzles right, and Pradeep’s name is picked, who would win? How much money would the *
22
get?” Then she modifies the scores and the hypothetical winner of the random draw, and asks the next child a question following the same model.
23
Appendix A: Recruitment methods
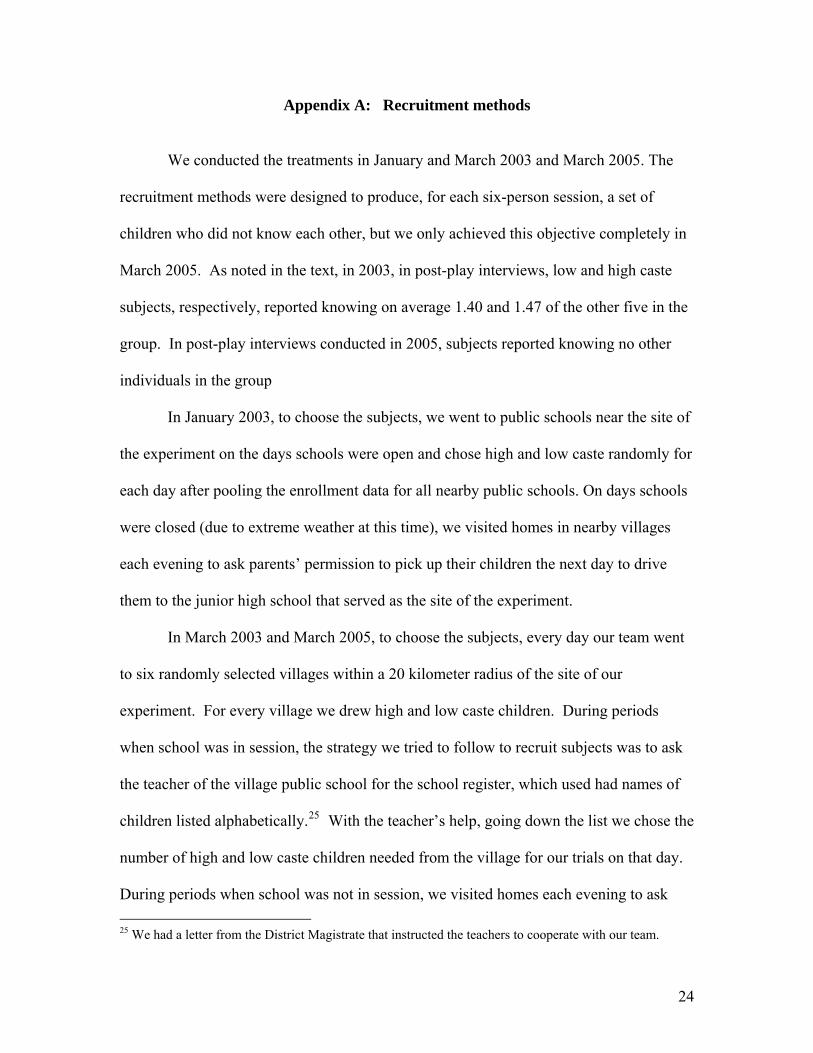
We conducted the treatments in January and March 2003 and March 2005. The
recruitment methods were designed to produce, for each six-person session, a set of
children who did not know each other, but we only achieved this objective completely in
March 2005. As noted in the text, in 2003, in post-play interviews, low and high caste
subjects, respectively, reported knowing on average 1.40 and 1.47 of the other five in the
group. In post-play interviews conducted in 2005, subjects reported knowing no other
individuals in the group
In January 2003, to choose the subjects, we went to public schools near the site of
the experiment on the days schools were open and chose high and low caste randomly for
each day after pooling the enrollment data for all nearby public schools. On days schools
were closed (due to extreme weather at this time), we visited homes in nearby villages
each evening to ask parents’ permission to pick up their children the next day to drive
them to the junior high school that served as the site of the experiment.
In March 2003 and March 2005, to choose the subjects, every day our team went
to six randomly selected villages within a 20 kilometer radius of the site of our
experiment. For every village we drew high and low caste children. During periods
when school was in session, the strategy we tried to follow to recruit subjects was to ask
the teacher of the village public school for the school register, which used had names of
children listed alphabetically.25 With the teacher’s help, going down the list we chose the
number of high and low caste children needed from the village for our trials on that day.
During periods when school was not in session, we visited homes each evening to ask 25 We had a letter from the District Magistrate that instructed the teachers to cooperate with our team.
24
parents’ permission to pick up their children the next day to drive them to the junior high
school that served as the site of the experiment.
25
Related Documents