The Pennsylvania State University The Graduate School College of Earth and Mineral Sciences AN EXPERIMENTAL INVESTIGATION OF FRICTIONAL AND HYDRAULIC PROPERTIES OF SHEAR ZONES, WITH APPLICATION TO EARTHQUAKE FAULTS AND GLACIAL TILL A Dissertation in Geosciences by Andrew Paul Rathbun © 2010 Andrew P. Rathbun Submitted in Partial Fulfillment of the Requirements for the Degree of Doctor of Philosophy December 2010

Welcome message from author
This document is posted to help you gain knowledge. Please leave a comment to let me know what you think about it! Share it to your friends and learn new things together.
Transcript

The Pennsylvania State University
The Graduate School
College of Earth and Mineral Sciences
AN EXPERIMENTAL INVESTIGATION OF FRICTIONAL AND
HYDRAULIC PROPERTIES OF SHEAR ZONES, WITH APPLICATION TO
EARTHQUAKE FAULTS AND GLACIAL TILL
A Dissertation in
Geosciences
by
Andrew Paul Rathbun
© 2010 Andrew P. Rathbun
Submitted in Partial Fulfillment
of the Requirements
for the Degree of
Doctor of Philosophy
December 2010

ii
The dissertation of Andrew P. Rathbun was reviewed and approved* by the
following:
Chris J. Marone
Professor of Geosciences
Associate Head for Graduate Programs and Research
Dissertation Adviser
Sridhar Anandakrishnan
Professor of Geosciences
Richard B. Alley
Evan Pugh Professor of Geosciences
Derek Elsworth
Professor of Energy and Geo-Environmental Engineering
Demian Saffer
Associate Professor of Geosciences
*Signatures are on file in the Graduate School.

iii
ABSTRACT
Faulting in the brittle crust is controlled by rate and state friction (RSF) and fluid
migration. In a series of four manuscripts, this work explores shear zones with a
series of laboratory experiments on both natural and synthetic materials. I conduct
shear experiments to investigate how localization of shear controls the gouge zone of
faults. Experiments show that shear localizes progressively into a central zone.
Localized shear can lead to a change in the RSF parameters where micromechanics of
the shear zone overrides the expectations of the commonly used laws. I also find that
subtle changes in the fabric of the shear zone can enhance the possibility of seismic
slip. I find that slow, seismic slip can be produced in laboratory experiments as creep
rupture rather than strictly RSF and stick-slip sliding. Acoustic emissions of slow-slip
have a similar form to stick-slip; however, the duration is ~1s rather than ~1ks
observed in laboratory stick-slip. In my experiments it is possible to propagate slow-
slip in both velocity-strengthening and weakening materials. Elevated fluid pressure
in gouge zones can mitigate the effects of the frictional behavior by increasing
pressure and thus decreasing effective stress though thermal pressurization or by
decreasing fluid pressure by dilatancy hardening. Tests on fault gouge from the San
Andreas shows that the fault core has low permeability. The San Andreas would act
as a barrier to fluid flow and could behaved as an undrained zone leading to dilantant
hardening or thermal weakening. The results of this dissertation are an important step
in understanding fault behavior from stable (aseismic) sliding to slow-slip and finally
stick-slip (seismic) sliding.

iv
TABLE OF CONTENTS
List of Figures ....................................................................................................... vii
List of Tables ........................................................................................................ viii
Acknowledgements ............................................................................................... ix
Chapter 1. INTRODUCTION................................................................................ 1
1.1. INTRODUCTION.......................................................................................... 1
1.2. BACKGROUND ........................................................................................... 2
1.3. SUMMARY OF CHAPTERS......................................................................... 6
References............................................................................................................. 7
Chapter 2. EFFECT OF STRAIN LOCALIZATION ON FRICTIONAL BEHAVIOR
OF SHEARED GRANULAR MATERIALS......................................................... 9
ABSTRACT.......................................................................................................... 10
2.1. INTRODUCTION.......................................................................................... 11
2.2. EXPERIMENTAL METHODS...................................................................... 14
2.2.1 Procedure for monitoring strain localization .............................................. 17
2.3. PROCEDURE, RESULTS AND ANALYSIS OF EXPERIMENTS............... 18
2.3.1 Creep experiments..................................................................................... 18
2.3.2 Dilation and the onset of localization......................................................... 20
2.3.3 Slip velocity step tests ............................................................................... 21
2.3.4 Evolution of the critical slip distance......................................................... 23
2.3.5 Strain markers and localized deformation.................................................. 26
2.4. DISCUSSION ................................................................................................ 29
2.4.1 Dilation as a proxy for shear localization................................................... 29
2.4.2 Symmetry of frictional behavior for velocity increases and decreases........ 33
2.4.3 Localization and till rheology .................................................................... 36
2.5. CONCLUSIONS ............................................................................................ 37
2.6. ACKNOWLEDGMENTS .............................................................................. 38
REFERENCES...................................................................................................... 38
Chapter 3. SYMMETRY IN RATE AND STATE FRICTION.............................. 58
ABSTRACT.......................................................................................................... 59
3.1. INTRODUCTION.......................................................................................... 60
3.1.1 Comparison of Evolution Laws ................................................................. 63

v
3.2. EXPERIMENTAL METHODS...................................................................... 64
3.3. RESULTS ...................................................................................................... 66
3.3.1 Velocity Stepping Experiments ................................................................. 66
3.3.2 Dilation and Compaction During Velocity Steps ....................................... 69
3.3.3 Bare Surface Experiments ......................................................................... 71
3.3.4 Normal Stress Oscillations......................................................................... 72
3.4. DISCUSSION ................................................................................................ 73
3.4.1 Which Law?.............................................................................................. 73
3.4.2 Layer Controls on Friction Parameters....................................................... 75
3.4.3 Two-State Behavior................................................................................... 78
3.4.4 Implications for the Stability of Fault Zones.............................................. 80
3.5. CONCLUSIONS ............................................................................................ 81
3.6. ACKNOWLEDGMENTS .............................................................................. 82
REFERENCES...................................................................................................... 82
Chapter 4. A NEW MECHANISM FOR SLOW-SLIP .......................................... 97
ABSTRACT.......................................................................................................... 98
METHODS ........................................................................................................... 103
ACKNOWLEDGEMENTS................................................................................... 104
REFERENCES...................................................................................................... 104
Chapter 5. PERMEABILITY OF THE SAN ANDREAS FAULT AT DEPTH...... 115
ABSTRACT.......................................................................................................... 116
5.1. INTRODUCTION.......................................................................................... 117
5.2. METHODS………….. ................................................................................... 119
5.2.1 Experimental Apparatus ............................................................................ 119
5.2.2 Permeability Methods................................................................................ 120
5.3. INTERLAB COMPARISON.......................................................................... 121
5.4. GEOLOGIC SETTING AND SAMPLE DESCRIPTION............................... 123
5.5. PERMEABILITY OF THE SAN ANDREAS FAULT………….. .................. 124
5.5.1 Comparision with other data...................................................................... 126
5.5.2 Implications .............................................................................................. 126
5.6. CONCLUSIONS ............................................................................................ 127
3.6. ACKNOWLEDGMENTS .............................................................................. 128
REFERENCES...................................................................................................... 128

vi
Appendix A: Strain localization in granular fault zones at laboratory and tectonic
scales..................................................................................................................... 146
Appendix B: Earthquake energy budget................................................................. 163
Appendix C: Matlab codes .................................................................................... 193
1. Stick-slip picker ............................................................................................. 193
2. Creep rate calculator....................................................................................... 204

vii
List of Figures
Figure 2.1. Double direct shear configuration................................................... 45
Figure 2.2. Grain size distribution .................................................................... 46
Figure 2.3. Creep experiment ........................................................................... 47
Figure 2.4. Layer and strain response to a stress step........................................ 48
Figure 2.5. Dilation as a function of step size ................................................... 49
Figure 2.6. Dilation as a function of strain........................................................ 50
Figure 2.7. Velocity stepping experiment ......................................................... 51
Figure 2.8. Sensitivity analysis of Dc ............................................................... 52
Figure 2.9. Rate and state parameters of till...................................................... 53
Figure 2.10. Shear localization in a granular experiment .................................... 54
Figure 2.11. Model of localization...................................................................... 55
Figure 2.12. Dilation as a proxy for localization................................................. 56
Figure 2.13. Asymmetry in velocity steps........................................................... 57
Figure 3.1. Expected frictional response to a velocity step................................ 87
Figure 3.2. Grain size distribution .................................................................... 88
Figure 3.3. Velocity stepping experiment and rate and state parameters............ 89
Figure 3.4. Factor of 3 velocity steps................................................................ 90
Figure 3.5. Factor of 30 velocity steps.............................................................. 91
Figure 3.6. Dilation for factor of 3 velocity steps.............................................. 92
Figure 3.7. Dilation for factor of 30 velocity steps............................................ 93
Figure 3.8. Bare surface velocity steps ............................................................. 94
Figure 3.9. Stress oscillation experiment .......................................................... 95
Figure 3.10. Velocity steps before and after oscillations..................................... 96
Figure 4.1. Characteristic duration of seismic events ........................................ 108
Figure 4.2. Laboratory stick-slip....................................................................... 109
Figure 4.3. Slow-slip events vs. rate and state friction ...................................... 110
Figure 4.4. Seismograms of laboratory slip events............................................ 111
Figure 4.5. Stress drop as a control of velocity and slip .................................... 112
Figure 4.S1. Grain size distribution .................................................................... 113
Figure 4.S2. Stick-slip and slow-slip in experiment p2773.................................. 114
Figure 5.1. Permeability apparatus ................................................................... 134
Figure 5.2. Pulse decay method........................................................................ 136
Figure 5.3. Constant rate of strain experiment .................................................. 137
Figure 5.4. Flow-through test ........................................................................... 138
Figure 5.5. Berea Sandstone permeability......................................................... 139
Figure 5.6. Crab Orchard Sandstone permeability ............................................ 140
Figure 5.7. Wilkeson Sandstone permeability................................................... 141
Figure 5.8. Geologic setting ............................................................................. 142
Figure 5.9. Permeability of the San Andreas Fault............................................ 143
Figure 5.10. Specific storage of fault gouge ....................................................... 144
Figure 5.11. Young’s modulus ........................................................................... 145

viii
List of Tables
Table 2.1 Experiment table ............................................................................ 44
Table 3.1 Experiment table ............................................................................ 86
Table 4.1 Experiment table ............................................................................ 107
Table 5.1 Interlab comparison........................................................................ 132
Table 5.2 Experiment table ............................................................................ 133

ix
Acknowledgments
I would like to thank all of the great people I have gotten to work with in the
lab over the years, and they are too numerous to list here. All of their help and
patience both helped advance this dissertation and make my time at Penn State
enjoyable. In particular I want to thank Jon Samuelson who always was a willing
listener to all of my crazy ideas (and many complaints) and the times I couldn’t quite
articulate my thoughts. Doug Edmonds provided a lot of valuable insight both to my
dissertation and on several other things. My parents and family were very
understanding along the way, even if they never quite understood what I do or why I
do it. It was all those trips around the country wondering how the hills got there and
what that funny rock was in Canada with the hard parts sticking out of it that inspired
me to try geology. Without my family, I never would have been able to get here.
My committee has been great. Richard Alley, Sridhar Anandakrishnan and Derek
Elsworth were always ready and willing to help me at any time. Demian Saffer put in
a lot more work than just a committee member and was really a co-advisor during my
last couple years. Chris Marone has really been a great advisor and a lot more. His
willingness to let me go off on my own and fiddle in the lab until I figured something
out was great. I can’t imagine someone that could have been more patient with my
ever-shifting ideas and promises of things to do for this dissertation.
.

1
Chapter 1: INTRODUCTION
1.1 INTRODUCTION
Brittle shear zones control two of the most dynamic systems in the earth,
glacial motion and earthquakes. Mature fault zones contain a gouge zone of crushed
and altered material ranging from microns to meters thick that hosts earthquakes.
Some glacial systems contain a layer of till underneath the ice, which can deform and
lead to rapid motion. While these two environments seem different, the same
underlying physics seems to control them. This thesis aims to understand some of
those fundamental controls in brittle media whether it is the gouge zone of a fault
system or the deformable till beneath a glacier.
This thesis is written as a series of manuscripts. Each manuscript is a
laboratory treatment of brittle shear aimed at understanding the fundamental controls
of gouge and till zones. This chapter is a very brief background of friction and
strength in shear zones. I provide the framework for our understanding of how things
slide and my main interest, how earthquakes begin. I do not attempt to provide a
comprehensive review of friction, but merely to show some background of the tools I
use. Chapter 2 deals with how shear localizes into a narrow zone and introduces the
concept of symmetry and asymmetry in friction. Chapter 3 takes an in-depth look at
Rate and State Friction (RSF) in the lab, attempting to unravel how friction evolves.
Chapter 4 deals with the differences between stick-slip and slow-slip events in the lab
and proposes a new mechanism for studying slow-slip. Chapter 5 looks at the
permeability of the San Andreas Fault by measuring across fault permeability which

2
coupled with RSF is typically invoked as a mechanism for slow-slip. Appendix A
presents a paper in which I am the secondary author on localization at the lab and
fault scale, Appendix B is another paper in which I am a secondary author. It deals
with the energy partitioning in earthquakes. Appendix C is reference codes for
analyzing data.
1.2 BACKGROUND
Our understanding of earthquake propagation in brittle shear zones is based on
the laws of friction. Gillaume Amontons put forth the first two laws: 1) Frictional
force is directly proportional to an applied normal load and 2) Frictional force is
independent of the area of contact. More simply this is expressed as
Ffric = ! Fn (1).
Coulomb extended this idea to include that the frictional force is independent of rate.
Coulomb also explained a larger static friction that kinetic friction by the interlocking
of asperities, the roughness of the shear contact. The assertion of Coulomb that
friction is rate independent is true until you look at fine-scale measurements in ~ the
third decimal place, which forms the basis modern rate and state friction.
Rabinowitz [1958] looked at the evolution of from static to dynamic friction
and formed the basis for modern rate and state friction. The evolution was based on
asperities and contact size. When two surfaces are in contact with each other, the
strength of that contact grows due to an increase in the size of the real area of contact,
Ar.

3
For sliding bodies, two styles of motion are possible 1) steady, stable sliding
in which motion is constant and occurs at a steady rate (aseismic) and 2) stick-slip in
which the bodies are locked together and then suddenly slip past one another
(seismic). We deal with these two situations on daily basis. You can slide your hand
over a smooth table and it is likely to slide stability, if you push down harder it is
likely to start to stick-slip, the sound of a bow on a violin string, or the screeching of
fingernails on a chalkboard are the result of stick-slip.
We describe which style of sliding is likely to occur with the second-order
frictional variations described by the RSF equations [Dieterich, 1978; 1981; Ruina
1983]. RSF forms our basis for understanding earthquake generation. In RSF,
friction is a function of velocity and a state variable such that:
!
µ "µ(V ,#) = µo
+ aln(V
Vo
) + bln(Vo#
Dc
)
(2)
where V is velocity, ! is a state variable, !0 is the background sliding friction at
velocity V0. The direct effect, a, describes the increase (decrease) in friction after a
velocity increase (decrease), the evolution, b, is the decrease (increase) of friction
from the peak (trough) after the velocity change. The e-folding distance to reach the
new steady state from a to b is the critical slip distance, Dc. The time evolution of the
state variable is usually described using one of two common laws:
!
d"
dt=1#
V"
Dc
(3)
!
d"
dt= #
V"
Dc
ln(V"
Dc
)
. (4)

4
At steady state sliding, the combination of (2) and either (3) or (4) gives the velocity
dependence of friction (a-b)
!
a " b =#µ
ss
# lnV . (5)
When (a-b) is positive the material is velocity-strengthening and when (a-b) is
negative the material is velocity-weakening.
Velocity-strengthening, weakening and the possibility of stick-slip can be
understood intuitively. If a body (in our case a fault or glacier) starts to slide faster
and friction, the resistance to motion, increases, it will inhibit motion and serve to
arrest the bodies. In the other case, when sliding velocity is increased and the
frictional strength of the contact decreases an earthquake is possible.
Velocity-weakening can be attributed to a decrease in Ar [Rabinowitz, 1958].
Faster motion decreases the contact time, and as a result the frictional contact does
not grow to as large of a value. The alternative situation when with increased velocity
friction increases another mechanism must control friction. Typically, dilantancy [e.g.
Mead 1925; Frank, 1965] is invoked to explain extra work needed after a change in
velocity to explain strengthening.
The propagation of an earthquake is possible when the critical stiffness, kc,
exceeds the background level, k. Critical stiffness is defined by the rate and state
terms as
!
k < kc
="(a " b)#
n
Dc
. (6)
This is an analogous situation to a simple spring and slider. If the spring is
sufficiently compliant, it stretches before the slip occurs until the pull of the spring

5
exceeds the strength of the contact. Once the stored energy is released the slider stops.
If the spring is stiff the force is transferred to the frictional contact, the amount of
energy stored is smaller and the slider continuously displaces because the pull of the
spring always exceeds the strength of the slider on a surface. Critical stiffness brings
in not only (a-b) but also the normal stress "n and Dc. Understanding the influence of
normal stress is intuitive if you once again think about a hand sliding on table. If you
barely push down your hand is likely to slide stably. If you push harder, and it is a dry
day so no moisture is lubricating the contact, your hand will probably stick-slip. This
process extends to the piece of chalk, a pencil eraser, or many frictional contacts that
we use every day.
It is important to remember that few places in the brittle crust or base of a
glacier exist in the absence of fluids. The presence of fluid can, not only control the
RSF parameters (a-b) and Dc be interacting with the minerals, but also influences the
stresses. Fluids and pore pressure reduce the stress the stress felt by the surrounding
material. Dilation and compaction of a fault zone can decrease and increase the pore
pressure of a shear zone, respectively. The Coulomb-Mohr relation governs brittle
failure.
!f = !("n-Pp) + c (7)
Where #f is a shear strength Pp is pore pressure and c is cohesion. A shear zone with
sufficiently low permeability can behave in the undrained state. If dilation occurs
(increased porosity or void volume) the Pp can decrease due to a greater volume for
the fluid to fill. This can serve to arrest fault motion and is one of the mechanisms
invoked to explain slow-slip.

6
1.3 SUMMARY OF CHAPTERS
The aim of this dissertation is to understand the frictional deformation of shear
zones. Chapter 2 looks at localization in granular media. I explore the evolution of
localization with shear. In granular shear zones containing many particles and
interactions between them, localization reduces shear in to a narrow zone or even a
plane. The grain-to-grain velocity-weakening interactions control the system rather
than dilation and many grains leading to velocity-strengthening. I show that
localization can occur in a velocity-strengthening material that dilates. Localization
occurs progressively into a boundary parallel zone a few grain diameters thick.
Chapter 3 expands on some observations from Chapter 2 in that the frictional
response to a velocity step is asymmetric. I find that the Ruina law (Equation 4) better
fits laboratory data; however variations exist that are not predicted by either of the
two evolution laws. It is also shown that oscillations and variations in the shearing
layer can decrease the critical slip distance, which increases the likelihood of an
earthquake (i.e. Equation 6).
Chapter 4 explores the transition from seismic stick-slip to transient slow-slip
events in the lab. Constant shear stress experiments produce transient events in both
velocity-strengthening and weakening materials, an unexpected result from RSF (i.e.
Equation 6). I do find that the slip duration scales with (a-b) with positive (a-b)
producing the longest slip duration (100’s seconds) and the most negative (a-b)
producing the shortest (seconds). I propose a new mechanism for slow-slip in which

7
creep failure and rupture can lead to transient events rather than purely the interplay
of RSF and high fluid pressure.
The final chapter is unique in this dissertation in that permeability
experiments rather than shear experiments are presented. Experiments were
conducted in multiple configurations to explore faults as fluid barriers or pathways.
These experiments represent the first permeability measurements from the gouge
zone of the San Andreas Fault Observatory at Depth (SAFOD) drilling project. These
experiments help constrain the possibility that fluid pressurization can induce
seismicity on in the fault or that depressurization due to dilation can stabilize the
fault.
Appendices A and B are two papers in which I am the second author. Both
present shear experiments and model results trying to understand the physics of
earthquakes. These two papers relate to all four main chapters of my dissertation and
present new treatments of experimental fault zones.
REFERNCES
Brace, W. F., and J. D. Byerlee (1966), Stick-slip as a mechanism for earthquakes,
Science, 26(153), 990-992.
Dieterich, J. H. (1979), Modeling of rock friction: 1. Experimental results and
constitutive equations. J. Geophys. Res. 84(B5), 2161-2168.
Dieterich, J.H. (1981), Constitutive properties of faults with simulated gouge, in
Mechanical Behavior of Crustal Rocks, Geophys. Mono. Ser. 24 edited by N.L.

8
Carter, M. Friedman, J.M. Logan, and D.W. Stearns, pp. 103-120, AGU,
Washington DC.
Frank, F.C. (1965), On dilatancy in relation to seismic sources, Rev. Geophys., 3(4),
485-503.
Mead, W. J. (1925), The geologic role of dilatancy, J. Geol. 33, 685-698.
Rabinowicz, E. (1958), The intrinsic variables affecting the stick-slip process, Proc.
Phys. Soc London, 71, 668-675.
Ruina, A. (1983), Slip instability and state variable friction laws, J. Geophys. Res.,
88, 10359-10370.

9
Chapter 2: EFFECT OF STRAIN LOCALIZATION ON
FRICTIONAL BEHAVIOR OF SHEARED GRANULAR
MATERIALS
Andrew P. Rathbun and Chris Marone
Rock and Sediment Mechanics Laboratory, Penn State Center for Ice and Climate,
The Pennsylvania State University, University Park, PA 16802, USA
Submitted to the Journal of Geophysical Research, 19 March 2009
Resubmitted to the Journal of Geophysical Research, 24 September 2009
Published in the Journal of Geophysical Research, January 2010

10
ABSTRACT: We performed laboratory experiments to investigate shear localization
and the evolution of frictional behavior as a function of shear strain. Experiments
were conducted on water-saturated layers, 0.3 to 1 cm thick, of Caesar till, a granular
material analogous to fault gouge. We used the double direct shear configuration at
normal stresses ranging from 0.5-5 MPa and shearing velocities of 10-100 !m/s.
Shear localization was assessed via strain markers and two proxies: 1) macroscopic
layer dilation in response to perturbations in shear stress and 2) rate/state friction
response to shear velocity perturbations. In creep-mode experiments, at constant
shear stress, we monitored dilation for perturbations in shear stress. In standard
friction tests, we measured the coefficient of friction during perturbations in
macroscopic strain rate. We find evidence of strain localization beginning at shear
strain $ # 0.15 and continuing until $ # 1. Analysis of strain markers support
interpretations based on the proxies for localization and show that strain is localized
in zones of finite thickness. We also investigate symmetry of the friction response to
step changes in imposed slip velocity and find that the behavior is symmetric. Our
results, favor the Ruina law for friction state evolution, in which slip is the
fundamental variable, rather than the Dieterich law. The critical slip distance for
friction evolution, Dc, is ~140 !m. The Dieterich state evolution law requires
different values of Dc for velocity increases/decreases, 100 !m vs. 175 !m,
respectively, and would imply strain localization/delocalization associated with shear
in a finite zone.

11
2.1 INTRODUCTION
The localization of strain in brittle shear zones has broad implications for the
seismic and aseismic nature of tectonic faulting and the rheology of subglacial till.
Cataclasitic processes, wear, and reworking of sediments form fault gouge and its
analog in the deforming substrate of some glaciers, subglacial till. Field observation
of brittle shear zones [e.g. Logan et al., 1979; Arboleya and Engelder, 1995; Chester
and Chester, 1998; Cashman and Cashman, 2000; Faulkner et al., 2003; Hayman et
al., 2004; Fossen et al., 2007; Cashman et al., 2007] laboratory experiments [e.g.
Mandl et al., 1977; Logan et al., 1979; 1992; Marone et al., 1990; Gu and Wong,
1994; Beeler et al., 1996; Scruggs and Tullis, 1998; Niemeijer and Spiers, 2005], and
numerical simulations [e.g. Antonellini and Pollard, 1995; Morgan and Boettcher,
1999; Mair and Abe, 2008] show that slip often localizes into discrete zones or along
distinct fabrics in the shear zone.
Field observations from exhumed brittle shear zones indicate that large slip
(10’s of km) may occur in zones that range in width from a few centimeters to 10’s of
meters [Mooney and Ginzburg, 1986; Montgomery and Jones, 1992; Chester and
Chester, 1998; Storti et al., 2003; Sibson, 2003; Wibberley and Shimamoto, 2003;
Billi and Storti, 2004; Chester et al., 2004; Di Toro et al., 2005]. Fault zones grow in
width by continued slip and evolve internally due to grain size reduction and mineral
growth along shear bands [e.g. Engelder, 1974; Scholz, 1987; Schleicher et al., 2006].
Such faults often include highly localized principle slip zones, which are hosted in
fault damage regions and gouge zones. Fault zone width is difficult to quantify and

12
exhibits extreme variation along strike, even for a single fault, but generally ranges
from centimeters to 100’s of meters or more [e.g. Scholz, 2002; Sibson, 2003].
Rate and state friction has been used to describe the behavior of brittle
faulting in gouge and rocks [Dieterich, 1979; 1981; Ruina, 1983] based on the idea
that stick-slip motion and interseismic creep is an analog for the seismic cycle [Brace
and Byerlee, 1966]. Frictional instability requires that faults weaken with either
increased slip (slip weakening) or increased velocity (velocity weakening). If the rate
of weakening exceeds a critical value, elastic strain energy is released from the
surrounding materials, causing shear heating and elastic wave radiation. The critical
weakening rate depends on the normal stress and elastic properties of the fault region
[e.g. Scholz, 2002]. For deformation zones that exhibit increased frictional strength
with increasing strain rate (so called velocity strengthening frictional behavior)
aseismic slip and creep are expected. Such behavior is expected for pervasive
deformation prior to strain localization [Marone et al., 1990; 1992]. The term creep is
often used in two different contexts; in this study we will use the word creep to
denote deformation under constant shear stress, rather than to distinguish aseismic
from seismic slip. In a granular material, pervasive shear and velocity strengthening
frictional behavior have been attributed to the dilational work required to expand the
layer [Mead, 1925; Frank, 1965; Marone et al., 1990].
Many of the processes that govern friction and strain localization in fault
gouge also appear to be important in subglacial till. Shear deformation within till
accounts for a large portion of the net displacement of some fast moving glaciers and
ice streams [e.g. Clarke, 2005]. The rheology of subglacial till has been a matter of

13
much debate; see [Alley, 2000] and [Clarke, 2005] for recent reviews. Early
investigators used a power law relationship for glacial till where strain rate is
proportional to shear stress raised to a stress exponent, n [e.g. Boulton and
Hindmarsch, 1987]. For convenience most modeling studies have assumed that till
behaves as a viscous material with n of order 1, whereas most laboratory studies
report a frictional (often termed ‘plastic’) rheology of n > 15 [e.g. Kamb, 1991;
Iverson et al., 1997; 1998]. Work by Rathbun et al. [2008] shows that the rheology of
till evolves from n <10 to n >50 from the onset of motion to steady frictional sliding.
Recent studies show that glaciers exhibit stick-slip motion in some cases
[Anandakrishnan and Bentley, 1993; Ekstrom et al., 2003; 2006] and physical models
have been proposed [Tsai et al. 2008; Winberry et al., 2009]. Basal tills are often
characterized by zones of localized shear, [e.g. Truffer et al., 2000; Kamb 2001;
Evans et al., 2006; Menzies et al., 2006] and laboratory studies indicate that till
rheology is governed in part by the distribution of strain localization [Larsen et al.,
2006; Thomason and Iverson, 2006; Iverson et al., 2008; Rathbun et al., 2008].
However, there are relatively few detailed laboratory studies of strain localization and
its effect on friction constitutive properties of till.
Laboratory studies focused on earthquake faulting have shown that fault
gouge often exhibits a transition from pervasive to localized deformation with
increasing strain and that this transition coincides with a change from stable to stick-
slip frictional sliding [e.g. Logan et al., 1979; 1992; Marone et al., 1990; Beeler et
al., 1996; Marone, 1998]. Similar connections between strain localization and
frictional properties are emerging from studies of glacial till [e.g. Iverson et al., 2008;

14
Rathbun et al., 2008]. However, most studies of till do not include direct information
on friction constitutive behavior or stick-slip.
The purpose of this paper is to report on laboratory investigations of strain
localization and its influence on frictional behavior of till and granular fault gouge.
We employ both constant shear velocity and constant shear stress boundary
conditions, with careful attention to the influence of shear fabric development on
frictional strength, layer dilation, and rate/state friction properties including the
critical slip distance and steady-state frictional strength.
2.2 EXPERIMENTAL METHODS
Experiments were preformed in a servohydraulic, biaxial testing apparatus
using the double-direct shear configuration (Figure 2.1). Two granular layers were
sheared simultaneously between three steel forcing blocks at constant normal stresses
of 0.5, 1, and 5 MPa (Table 2.1). The horizontal ram of the testing machine applies a
constant normal force and the vertical ram imposes shear traction. Both rams can
operate in stress or displacement servocontrol. Layer dimensions were 10 cm x 10
cm (nominal frictional contact area) x a thickness of 0.3, 0.5 or 1 cm (Table 2.1).
Forcing blocks were grooved to a depth of 0.8 mm with wavelength of 1 mm
perpendicular to shear to ensure that deformation occurred within the layer and not at
the layer-block interface.
Granular layers were constructed by applying a wall of cellophane tape
around the forcing blocks to the desired layer thickness. The sample was then added
and planed off to the desired thickness using a precision leveling jig (Table 2.1). This

15
method produced constant initial layer thickness to a tolerance of ±0.2 mm. To
reduce material loss along the front/back layer edges, guide plates were attached to
the side forcing blocks. Molybdenum lubricant was used beneath the side forcing
blocks to facilitate motion and layer dilation/compaction at constant normal stress. To
further reduce material loss, a 0.01” latex sheet was applied to the underside of the
blocks. Calibration experiments show that the latex sheet adds < 20 N (2 kPa) to the
measured shear force [Carpenter, 2007] and we correct for this effect along with the
gravitational force associated with the mass of the center-forcing block (19 N).
Strain markers were constructed in select experiments (Table 2.1) by placing 3
sets of brass sheets (0.005” thick) at equally spaced increments in the layer. Each set
was filled with a 2-mm wide layer of blue sand (Kelly’s Crafts Inc.) and then the
brass sheets were removed leaving a strip blue sand in the layer. The bulk weight
percentage of markers was kept <5% to ensure that this material did not impact bulk
frictional strength of the layer [e.g. Logan and Rauenzahn, 1987].
All experiments were conducted under nominally saturated conditions by
submerging the sample in water using a flexible rubber membrane (Figure 2.1). The
reservoir was left open to the atmosphere at the top, resulting in saturated drained-
conditions for the layer. Before the application of stress, the sample was allowed to
equilibrate with water for at least 45 minutes to ensure complete saturation.
Normal and shear forces were measured with BeCu load cells to 0.1kN
resolution. Displacements were measured by direct current displacement transducers
(DCDT’s) to 0.1 !m resolution. Experiments were recorded with 24-bit analog-to-
digital precision. We used a recording rate of 10 kHz and averaged samples for

16
storage at > 10 sample per micron of shear displacement in all experiments. Shearing
velocity was computer controlled via an analog servo-command signal updated at 100
Hz. The initial layer thickness was measured, in situ under load, to ±0.01 mm.
Measured displacements normal to the layer correspond to changes in layer thickness
at constant normal stress. Both normal and shear displacements reported here have
been corrected for the elastic stiffness of the vertical and horizontal load frames, 5
MN/cm and 3.7 MN/cm, respectively. We measure macroscopic shear strain of the
layer by integrating the measured slip increments, imposed at the layer boundaries,
and dividing by the instantaneous layer thickness.
!
" =xi# x
i#1
hii=1
Xmax
$, 1)
where $ is bulk shear strain, xi is the position of the center forcing block (e.g. shear
offset at the layer edge), h is the instantaneous thickness at slip increment i, and Xmax
is the total displacement.
The experiments were conducted using Caesar till, which is a mixed grain-size
granular material that derives from the Scioto (Ohio) Lobe of the Laurentide Ice
Sheet and dates to ~19,500 years ago [Haefner, 2000]. Samples were air-dried and
then disaggregated by hand before grain-size analysis following the procedures of
Rathbun et al. [2008]. We sieved the till and removed the >1mm fraction, in order to
preserve stress homogeneity at our layer boundaries and to ensure that deformation
was representative of the sample as a whole, rather than a few large grains. The
experimental grain size was 98.7% sand 1.2% silt and 0.1% clay-sized grains (Figure
2.2) with some grains composed of aggregations of several small particles. Grain
sizes less than 63 µm were analyzed using laser obscuration in a Malvern

17
Mastersizer. Sample composition was determined via X-ray diffraction [Underwood
et al., 2003], with relative abundances of 35% quartz, 26% calcite 23% plagioclase,
and 16% clay minerals with the clay particles composed of 35.3% smectite, 38.5%
illite and 26.1% chlorite/kaolinite.
2.2.1 Procedure for monitoring strain localization
Strain localization and shear fabric evolution were investigated by direct
observation of preserved samples, post shear, and by indirect metrics measured in-situ
during the experiment. Layers were impregnated with epoxy for microstructural
evaluation and tracking of strain markers. Experiments at low normal stresses and
with granular particles typically do not show a well-developed shear fabric [e.g. Mair
and Marone, 1999]. Therefore, we developed indirect methods of fabric
characterization based on the layer response to perturbations in shearing rate and
shear stress. These include layer dilation, friction memory effects characterized by the
critical slip distance, and the steady-state rate dependence of kinetic friction.
Layer dilation was used as a proxy for strain localization. That is, we assume
that only the fraction of the layer undergoing active strain exhibits shear dilation upon
a perturbation in loading rate. Pervasive shear, in which the whole layer is actively
involved in shear, results in larger dilation than localized shear, in which only a
fraction of the layer is actively involved in shear. We measure dilation after
accounting for geometric thinning of the layer in direct shear [Scott et al., 1994].

18
2.3 PROCEDURE, RESULTS AND ANALYSIS OF EXPERIMENTS
We conducted two types of experiments for this study (Figure 2.3): 1) creep
mode tests in which layers were sheared at a controlled shear stress value, and 2)
standard friction tests in which layer where sheared at a controlled shear displacement
rate.
2.3.1 Creep experiments
Creep mode shearing (Figure 2.3A) began by first measuring steady state
frictional strength, #res (Figure 2.3B) at constant shear displacement rate. We refer to
the shear strain that accumulated prior to creep loading as preconditioning shear
strain, $i and we varied $i from 0 to 4.3 to investigate its effect on fabric development
and creep rheology. Creep tests began at a shear stress of ~70% of #res and shear
stress was increased in steps equal to 2%, 5% or 7.5% of #res and held for 45 minutes
(Table 2.1). For experiments that did not reach steady shear strength during $i, #res
was estimated using an average value from other experiments [Rathbun et al., 2008]
and then checked after creep loading.
We measured frictional rheology and layer thicknesses changes at each stress
until tertiary creep occurred (Figure 2.3). For shear stresses < 90% of #res, shear
strain was negligible during creep step tests [Rathbun et al., 2008]. However, tertiary
creep produced measurable shear strain for stresses near #res, as shown for the final
stress step in Figure 2.3; note that ~ 18 ks in Figure 2.3A corresponds to $ ~1.2 in
Figure 2.3B. For the conditions of our study, tertiary creep began at 92-100% of #res,
depending on $i [Rathbun et al., 2008].

19
After completion of the creep portion of the experiment, layers were again
sheared at a constant displacement rate of 10 !m/s to investigate strain hardening and
changes in friction (Figure 2.3A). The difference in frictional strength before and
after creep was always <1.5%, and thus we assume that the strain accumulation
during creep tests did not significantly affect fabric development.
Details of the creep behavior during stress steps are given in Figure 2.4. The
stress step rise time was 1-2 sec, during which time shear strain rate increased rapidly.
Layer dilation is clearly evident in the raw data dashed line in (Figure 2.4), but to
improve measurement precision we removed the trend in layer thickness associated
with geometric thinning [Scott et al., 1994]. For a step increase in stress, strain rate
first increased, consistent with primary creep, and then decayed steadily to a steady-
state value within 30 to 40 minutes (Figure 2.4 inset), which we associated with
secondary creep. We did not attempt to verify the establishment of secondary creep
in each case, because many previous works have shown that friction of geomaterials
exhibits log-time creep relaxation for subcritical stresses [e.g. Marone, 1998; Karner
and Marone, 2001; Mitchell and Soga, 2005; Rathbun et al., 2008]. However, for the
resolution of our measurements (< 0.1 !m) layer dilation was complete within 10 to
20 minutes after a stress step (Figure 2.4 inset). We define creep dilation $h* as the
difference between layer thickness 40 minutes after the stress step and initial layer
thickness before the step. Positive $h* represents dilation. The values of $h* do not
vary systematically as a function of shear stress in a given experiment.

20
2.3.2 Dilation and the onset of localization
We investigated the effect of shear localization on creep behavior by
systematically varying preconditioning shear strain $i (Figure 2.3). Figure 2.5 shows
data from 12 experiments in which we compare creep dilation as a function of stress
step magnitude and shear strain. Our three stress step magnitudes range from 0.01 to
0.045 MPa (Figure 2.5). Layer dilation $h* increased strongly with stress change for
layers with low initial strain ($i < 0.2), whereas for higher values of $i dilation was
nearly independent of stress step size (Figure 2.5).
To further investigate shear localization and fabric development, we analyzed
the effect of stress perturbations on layer thickness $h* (e.g. Figure 2.4) as a function
of $i (Figure 2.6). The dilation parameter $h* is a proxy for fabric development if
dilation occurs within only the fraction of the layer thickness where strain is
localized. Figure 2.6 shows data for three layer thicknesses and two normal stresses.
For our range of conditions $h* did not vary systematically with normal stress (Table
2.1). Each point in Figure 2.6 represents the average of all shear stress steps in a
given experiment plotted vs. $i (e.g. Figure 2.3).
The bulk of our experiments were conducted using 1-cm thick layers. In these
experiments, creep dilation decreased systematically as a function of initial shear
strain and reached stable values by $i ~ 1.2-2 (Figure 2.6). Layer dilation was about 6
!m for $i = 0.1 (the lowest values we could study) and decreased to 1 !m for $i " 1.2.
These data are consistent with a logarithmic decrease in $h* as a function of $i,, at
least up to $i = 1.2. Beyond $i = 1.2 dilation remains constant with increasing shear
strain (Figure 2.6 inset).

21
A subset of experiments was conducted with 0.3 or 0.5-cm thick layers
(Figure 2.6). For the thinner layers, layer dilation was about 3 !m for the lowest $i,
values and decreased to 2 !m for $i = 1. These data are consistent with the idea that
shear is distributed across the entire layer thickness at low strains and then becomes
localized, to a thickness that is independent of h, for larger strains. Shear localization
and fabric development also influence the rheology of sheared granular layers
[Rathbun et al., 2008]. In the next section, we extend the investigation of shear
localization and consider results from tests conducted at constant macroscopic strain
rate (e.g. Figure 2.3).
2.3.3 Slip velocity step tests
In addition to velocity step tests conducted after creep-mode loading (e.g.
Figure 2.3) we ran dedicated experiments at controlled shear velocity, which included
stepwise increases and decreases in velocity between 10 !m/s and 30 !m/s (Figure
2.7). These experiments were done with 10-mm thick layers and were designed to
assess variations in rate/state friction parameters as a function of strain. Such
variations have been used as a proxy for fabric development in sheared layers
[Marone and Kilgore, 1993; Beeler et al., 1996]. The shear displacement at each
velocity was 450 !m or 550 !m (Table 2.1). Velocity steps continued until a
maximum displacement of ~ 35 mm corresponding to shear strains of 3.5 to 4. During
the initial phase of shear stress increase, velocity steps were partially obscured by
non-linear strain hardening (Figure 2.7).

22
After friction reached steady state, we imposed step changes in load point
velocity, which caused variations in sliding friction (inset to Figure 2.7). Upon an
increase (decrease) in loading velocity, friction increased (decreased) and then
decayed to a new steady over a critical slip distance, Dc (Figure 2.7). The
dependence of friction on slip rate and state (recent slip history) can be described by
the rate and state friction relation:
!
µ "µ(V ,#) = µo
+ aln(V
Vo
) + bln(Vo#
Dc
)
2)
and one of two evolution laws for the friction state variable [Dieterich, 1979; Ruina,
1983]:
!
d"
dt=1#
V"
Dc
(Dieterich Law) 3a)
!
d"
dt= #
V"
Dc
ln(V"
Dc
)
(Ruina Law) 3b)
where ! is the friction coefficient, !0 is friction at a reference velocity V0, V is the
sliding velocity, ! is a state variable, and a and b are dimensionless constants (Figure
2.7 inset). The friction parameters a, b, and Dc are obtained by solving the coupled
equations (2) and (3a) or (3b) along with a description of elastic interaction with the
testing machine:
!
dµ
dt= k(V
l"V ) , 4)
where k is apparatus stiffness divided by normal stress and Vl is load point velocity
[e.g. Marone, 1998].
In our experiments, we observed that a step increase in loading velocity
causes a rapid increase in shear stress. The rate of stress increase with load point

23
displacement is equal to the system stiffness (Figure 2.7). At some point, the stress
becomes sufficient to cause further slip within the layer and then frictional strength
reaches a maximum, after which it decays to a new steady value (Figure 2.7 inset).
The e-folding distance required to establish the new steady state sliding friction is the
critical slip distance Dc. We observe that decreases in loading rate cause a sudden
drop in frictional stress, followed by strengthening to a new steady state level. When
the steady-state change in friction has the same sign as the velocity change, such as
shown in Figure 2.7, the material is said to exhibit velocity strengthening frictional
behavior. Velocity weakening frictional behavior is defined by a lower steady state
friction value at higher sliding velocity. Friction rate dependence is given by:
!
a " b =#µ
ss
# lnV . 5)
Previous works on granular and clay fault gouge have shown that negative
values of the friction rate parameter, a-b, are associated with localized shear [Marone
et al., 1990; 1992; Beeler et al., 1996]. As fabric develops and shear becomes more
localized the critical slip distance decreases [Marone and Kilgore, 1993]. According
to Marone and Kilgore [1993] the reduction in Dc occurs because a smaller fraction
of the bulk layer and fewer particle-particle contacts are contributing to shear.
2.3.4 Evolution of the critical slip distance
We analyzed velocity step tests to assess evolution of constitutive parameters
with strain and fabric development (Figure 2.7). A non-linear, least-squares inversion
method was used to obtain parameters, following the procedures of Blanpied et al.
[1998]. Each velocity step was modeled separately (Figure 2.8). In a few cases, the

24
data exhibit a small overall trend of strain hardening (or weakening), which we
accounted for by including a linear term in the model. The best-fit model and a
sensitivity analysis for the critical slip distance, Dc, are presented for two
representative velocity steps in Figure 2.8 using both the Dieterich state evolution law
(Equation 3a) and the Ruina evolution law (Equation 3b). For the velocity increase,
the best-fit parameters are: a = 0.0116, b = 0.0106, and Dc = 95 !m using the
Dieterich law and a = 0.0121, b = 0.0102 and Dc = 115 !m using the Ruina law
(Figure 2.8). For the velocity decrease, the best-fit parameters are a = 0.0137, b =
0.0117, and Dc = 152 !m, and a = 0.0131, b = 0.0110 and Dc = 108 !m for the
Dieterich and Ruina laws, respectively (Figure 2.8). For reference, we fix the values
of a and b in each case and compute three forward models using different values of
Dc. Changing the value of Dc by as little as 25 !m results in a significant misfit
(Figure 2.8).
Comparison of forward models with similar values of Dc shows that the
friction behavior is asymmetric for velocity increases and decreases when analyzing
the steps with Dieterich evolution. The value of Dc is nearly a factor of 2 higher for
velocity decreases compared to increases. Whereas the values of Dc are symmetric
when the data are fit using the Ruina law. There is significant covariance between
parameters [e.g. Blanpied et al., 1998], but we focus here on Dc –for fixed values of a
and b– to assess asymmetry and differences between velocity increases and decreases.
Using the procedure shown in Figure 2.8, we assess evolution of constitutive
behavior as a function of shear strain by fitting velocity steps for multiple
experiments. Values of a-b are similar for velocity increases and decreases, with both

25
showing velocity strengthening and a slight reduction in magnitude for $ < 2 (Figure
2.9). The average value of a-b for velocity increases is 0.0023±0.0014 compared to
0.0028±0.0019 for velocity decreases with the Dieterich Law. Using the Ruina Law
these values change slightly to 0.0022±0.0014 and 0.0024±0.0016 for increases and
decreases, respectively. This consistency is expected because a-b represents a steady
state response, which is independent of the details of state evolution. Our
measurements are consistent with previous results for this material [Rathbun et al.,
2008], which show velocity strengthening frictional behavior for normal stresses from
50 kPa to 5 MPa and slip velocities from 1 !m/s to 300 !m/s.
Considering the range of our data, which start at a shear strain of about 1, the
critical slip distance is independent of shear strain, within the scatter in the data.
However, Dc is systematically different for velocity increases and decreases (Figure
2.9A, 2.9C) when using the Dieterich law. Mean values of Dc are 93.3±20.2 !m and
182.9±41.1 !m for velocity increases and decreases, respectively in experiment
p1572. These data and the sensitivity analysis of Figure 2.8 show a clear asymmetry
in the critical slip distance for step increases and decreases in velocity. Friction
approaches steady-state within a shorter slip distance after velocity increases than
velocity decreases.
We modeled the same velocity steps with the Ruina state evolution law and
find that the values of Dc are symmetric for velocity increases/decreases (Figure 2.9).
In experiment p1572, the mean for Dc is 122±53 !m and 140±18 !m for velocity
decreases and increases, respectively. In p1345 increases have a Dc of 139.1±34.7 !m
and decreases 131±19 !m when using the Ruina law. For experiment p1507 the mean

26
for increases is 123±29 !m and 121±13. There is no clear asymmetry within the
scatter in these data.
In all cases the Dieterich law produces significant asymmetry for velocity
increases/decreases. This is consistent with expectation, because the Dieterich law
assumes that steady state is reached within a critical time; thus the slip that
accumulates during that time should be larger for velocity increases than for velocity
decreases. This would predict larger values of Dc for velocity increases than
decreases, which is opposite to what we observe (Figure 2.9). This issue is discussed
further below.
2.3.5 Strain markers and localized deformation
Thin zones of blue sand were added to select experiments (Table 2.1) to track
the strain distribution within the layer. These layers were carefully recovered after
shear, impregnated with a low viscosity epoxy, and cut to expose a plane
perpendicular to the layer and parallel to the shear direction (Figure 2.10).
Photomicrographs in reflected light document offset of the markers and a
combination of pervasive and localized strain (Figure 2.10). These images confirm
that shear occurred within the sample and not at the interface with the rough forcing
blocks. Strain markers are arcuate near the layer edges and curve into a boundary
parallel (Y) orientation toward the center of the layer (Figure 2.10B). The thin zone of
shear marker seen throughout the layer indicates that strain does not localize into a
true Y shear, but into a narrow zone in the center of the sample. This implies that the

27
boundary parallel ‘Y shears’ in these experiments have finite width and that shear
within them is not on an infinitesimally-thin plane.
Curvature of the markers along the layer boundaries indicates progressive
localization with increased macroscopic strain (Figure 2.10B-D). Three transects
were taken across the sheared sample, one at each boundary and one in the center of
the shear marker (Figure 10C). The angular shear strain,
%a = tan &, 6)
where % is the angle between the initial position of the shear marker and current
position, was calculated in the curved portion of the marker using the method of
[Ramsay and Graham, 1970]. The $a can be calculated between each point along the
transect (Figure 2.10D). We may compare angular shear strain, $a, to bulk shear strain
across the layer, $ (Equation 1). Bulk shear strain represents a macroscopic average
whereas $a can be used to infer strain in a localized area of the sample and may have
values much larger than $. We only present calculations of $a along the curved portion
of the strain marker, near the layer boundary (Figure 2.10C,D). In the central, high
strain portion of the layer, Riedel shears and indentations of large grains into our
shear marker preclude calculations of $a.
Figure 2.10D presents $a as a function of position within the sample. Near the
shear zone boundary $a is near zero and increases toward the center of the layer.
Strain is high in the central zone and local variations associated with large grains and
slip surfaces make it difficult to resolve the peak strain value. Thus, Equation (6) does
not give an accurate assessment of strain in the central region. Nevertheless, the
overall strain distribution can be approximated with a normal distribution and

28
compared to measurement of macroscopic layer strain, $, from the experiment. We
integrate the normal distribution to derive a total shear displacement of 16.6 mm. The
value can be compared to the measured shear displacement imposed at the layer
boundaries, which was 30.4 mm, and the bulk shear strain, which was 3.9. We may
assume that the slip derived from local angular shear strain, 16.6 mm, represents only
that which occurred outside the central zone of high strain (Figure 2.10). This amount
of slip corresponds to the outer, curved portion of the shear marker. In this case, the
remaining $ of 1.9 would occur in the central, boundary parallel section, which is
roughly 1.6 mm thick and in the center of the sample. The 1.6 mm thickness
corresponds to a few grain diameters in thickness. To account for the remaining $ in
the layer, a peak shear strain of 8.6 is required for the highly localized section near
the center of the layer, which is reasonable.
Shear markers and the spatial distribution of strain in the layer show that shear
is initially pervasive and becomes localized (Figure 2.11). One possibility is that Y
shear formation could simply cut the markers as shown in Figure 2.11C. However,
the photomicrographs document significant curvature of the markers as expected for
spatially-progressive localization (e.g. Figure 2.11D).
We posit that boundary parallel shear localization begins on multiple surfaces
and progresses to a certain point before one or more of the zones coalesce to form a
master shear band. Our observations suggest that during the initial stages of
localization; shear surfaces nearest the layer boundary arrest first, while those nearer
to the center continue to shear. The low relative amounts of strain on the boundary,

29
progressing to larger relative amounts of strain near the center of our sample causes a
curvature of the strain markers (Figure 2.10).
2.4. DISCUSSION
The results of this study document strain localization and systematic changes
in frictional behavior as a function of accumulated shear strain. Creep-mode tests and
perturbations in shear stress level show consistent layer dilation for an increase in
shear stress, and we use dilation as a proxy for shear localization within the layer.
These results are consistent with previous works, but we add to those and extend the
investigation to show how progressive fabric development affects frictional behavior.
Our work on slip velocity perturbations compares velocity increases and decreases,
and investigates symmetry in the frictional behavior.
2.4.1 Dilation as a proxy for shear localization
For granular materials, dilation occurs when shear-induced grain
rearrangement causes a local increase in porosity [Reynolds, 1885; Mead, 1925]. Our
measurements of macroscopic layer dilation form the basis for assessing shear
localization and the relationship between fabric development and frictional behavior.
We perform two tests of the hypothesis that layer dilation is a valid proxy for shear
localization. These involve: 1) experimentally varying initial layer thickness (Figure
2.6), and 2) using strain markers to document slip distribution within the layers
(Figure 2.10). In addition, we can compare our dilation data to inferences about
localization based on friction constitutive parameters (Figure 2.9).

30
We varied initial layer thickness from 3 mm to 1 cm. Data for 1 cm thick
layers show decreasing dilation with increasing shear strain (Figure 2.6). If this
decrease is the result of shear localization, layer thickness will influence dilation at
low strain, when deformation is pervasive, but at high strain, once deformation is
localized, layer thickness will have no influence on dilation. Experiments on 0.3 and
0.5 cm layers produce half the dilation of 1 cm thick layers at $i ~0.15 (Figure 2.6),
which is consistent with dilation throughout the layer (e.g. distributed shear). At $i
~0.25 our data are less convincing (Figure 2.6 inset). The 0.5-cm thick layers fall
below the line defined by the 1 cm layers, but the data for 1-cm thick layers have
large uncertainty (Figure 2.6 inset). At higher strains, when $i = 1, all layer
thicknesses show equal dilation within experimental uncertainty and reproducibility.
The large variability of dilation at $i suggests that localization may be complete at a
slightly larger value than 1. These data are consistent with the hypothesis that
deformation has localized into the same effective thickness for all macroscopic layer
thicknesses. The micrographs and strain markers also support the conclusion that
shear strain becomes localized within the layer for macroscopic shear strains in the
range ~1-2.
Friction constitutive parameters have been used as a proxy for shear
localization [e.g. Marone and Kilgore, 1993; Beeler et al., 1996; Scruggs and Tullis,
1998; Mair and Marone, 1999; Frye and Marone, 2002; Mitchell and Soga, 2005].
Marone and Kilgore [1993] sheared layers of granular and powdered quartz and
found that the critical slip distance Dc decreased until $ ~ 6. Mair and Marone [1999]
investigated a range of normal stresses and slip rates and found that a-b evolves until

31
$ ~ 4. Beeler et al. [1996] conducted ring shear experiments on granular granite and
found continued evolution of a-b up to $ > 50.
In our experiments evolution of the friction constitutive parameters appears to
be complete by $ # 1-2. The maximum $ we impose is ~ 4, which is lower than other
studies. Also, our material is a glacial till, with inherent heterogeneity of grains and a
large size distribution. We believe this is part of the cause of the scatter in Dc as well
as &h* measurements. The values of a-b display a clear evolution and decreasing
trend until $ ~ 2 (Figure 2.9), consistent with localization assed from the strain
markers (Figure 2.10C). It is possible that continued strain would lead to further
reduction of a-b. In the studies of Marone and Kilgore [1993], Beeler et al. [1996]
and Mair and Marone [1999] most of the evolution of a-b takes place at low strain,
consistent with both our friction constitutive and creep dilation data.
Laboratory studies of till localization using anisotropy of magnetic
susceptibility (AMS) fabric indicate that that localization evolves until $ on the order
of 100 [Larsen et al., 2006; Thomason and Iverson, 2006; Iverson et al., 2008].
Unfortunately these studies do not include data on the friction constitutive parameters
for sheared till, and are all conducted in ring shear apparatuses. This configuration
has a much lower stiffness than our apparatus and is typically used at lower normal
stress. Thus, these tests require higher shear strain to reach steady-state sliding
friction, which makes direct comparison difficult. Past experiments on the tills used
by Thomason and Iverson [2006] and Iverson et al. [2008] indicate velocity-
weakening behavior, but without information on Dc or the evolution of friction
constitutive parameters with strain [e.g. Iverson et al., 1998]. In general, our results

32
are consistent with these studies. We see that strain markers initially rotate in a
manner consistent with distributed deformation and then record progressive
localization in a narrow band of finite width, before slip localizes onto a surface that
offsets the markers (Figure 2.10). The edges of the strain markers that were rotated
during distributed deformation show both curvature and thinning toward the center of
the shear zone, indicating that the transition to localized shear occurred progressively.
It is possible that grains in our experiments continue to rotate and align into a higher-
order preferred orientation than traditional shear fabrics. However, clast rotation and
particle alignment are beyond the scope of this study and we do not attempt to verify
our results using preferred axis orientation.
Our results are consistent with those of Logan et al. [1992], who sheared
granular and clay-rich layers in the triaxial, sawcut configuration. They report
pervasive deformation and the formation of oblique, Riedel shears during the initial,
hardening portion of the stress-strain curve, followed by formation of boundary
parallel Y-shears as frictional strength approaches steady-state. Scruggs and Tullis
[1998] also document localized shear in a boundary parallel zone within layers of
mica and feldspar. They observe velocity weakening frictional behavior and make a
connection with shear localization and possible stick-slip instability.
Strain markers in our experiments indicate that Y-shears have finite thickness
and that they begin to form before the peak frictional strength (Figure 2.12). We find
that dilation begins to decrease at $ ~ 0.15, which is before the peak shear strength
(Figure 2.12). Dilation continues to decrease as the shear stress transitions to a steady
sliding strength at $ ~ 0.3 in most experiments (Figure 2.12B). By $ ~ 1.2, the

33
decrease in dilation is complete and sliding friction is steady. During the decrease in
dilation, the mode of deformation changes from a distributed model to one in which
most shear occurs in a boundary parallel zone in the center of the sample.
2.4.2 Symmetry of frictional behavior for velocity increases and decreases
In the context of rate and state friction, the two main state evolution laws
(Equations 3a and 3b) make different predictions regarding the symmetry of the
response to velocity increases and decreases. The Ruina law predicts symmetric
behavior while the Dieterich law predicts larger values of Dc for velocity increase
than for velocity decreases. We model our results with both laws and find complex
behavior Our experiments show a clear asymmetry in the frictional response to
velocity perturbations when data are fit using the Dieterich state evolution law.
Moreover, the asymmetry is opposite to that predicted for the Dieterich law. The
critical slip distance for velocity decreases are a factor of 2 larger than those for
velocity increases (Figure 2.9), whereas they should be smaller, according to standard
interpretation [e.g., Marone, 1998].
Many previous studies of the evolution of rate/state friction with strain have
focused on only velocity increases or decreases, without considering the question of
symmetry. The experiments by Marone and Kilgore [1993] show decreasing Dc with
increased shear strain in layers of granular quartz. They analyzed velocity decreases
in detail and noted a similar trend for velocity increases; however they did not
compare velocity increases and decreases. The experiments of Mair and Marone
[1999] find that Dc increases with velocity as predicted by the Dieterich law. Marone

34
and Cox [1994] show that Dc increases with displacement for roughened gabbro
blocks due to the production of a gouge zone. Within the reproducibility of their data,
Dc is symmetric for velocity increases and decreases. Asymmetry of velocity
increases and decreases has been observed in dilatancy produced by velocity steps
[e.g. Beeler et al., 1996; Hong and Marone, 2005].
When data for velocity increases and decreases are compared directly, the
frictional evolution we observe is indistinguishable for velocity increases and
decreases (Figure 2.13A). This symmetry between the increase and decrease in
velocity suggests that the Ruina law may be more appropriate for these data. This is
in contrast to the work of Beeler et al. [1994] who preformed experiments on granite
and quartzite and showed that frictional state evolved primarily as a function of time,
as predicted by the Dieterich state evolution law. For comparison we present data
from a second experiment showing asymmetry of the friction evolution (Figure
2.13B). For these data, pure quartz was sheared at a normal stress of 25 MPa.
Velocity decreases appear to reach peak friction at smaller displacements then
velocity increases and friction evolves over a longer distance.
Our data lend clear support for the Ruina law interpretation of frictional state
evolution. However, an alternative hypothesis should be considered, given that we
find evidence for shear localization in a gouge layer. One could argue that the
Dieterich law is correct, and that changes in the degree of shear localization explain
our data. Previous studies have established that the critical slip distance scales with
particle size [e.g. Dieterich, 1981; Marone and Kilgore, 1993] in a manner consistent
with Rabinowicz’s [1958] original interpretation of Dc in terms of the lifetime of

35
adhesive contacts. Marone and Kilgore [1993] extended this idea and proposed that
the critical slip distance for granular shear scales with the number of particles within a
shear band (see also Marone et al. 2009). That is, for a zone of thickness T, the
effective critical slip distance Dcb is given by the sum of contributions from individual
contacts within the zone:
Dcb = n Dc '
where ' is a geometric factor to account for contact orientation and n is the number of
particle contacts in the shear band.
For a fault zone of thickness T, the effective critical slip distance represents
contributions from each contact within the zone. Particle diameter d can be related to
Dc via contact properties as:
Dc = d (
where ( is a constant including elastic and geometric properties and the slip needed
for fully-developed sliding at the contact [Boitnott et al., 1992]. Combining these
relations and the constants, yields a relation between Dcb and shear band thickness:
Dcb = T $c
where $c is the critical strain derived from slip increments on individual surfaces
within the shear zone [Marone and Kilgore, 1993; Marone et al., 2009].
In the context of this model, asymmetry in frictional behavior for velocity
increases vs. decreases can be explained by dynamic variation in shear band
thickness. Larger values of the effective critical slip distance imply that a larger
number of contacts, and a thicker shear band, are actively slipping. Thus, we posit
that a transient increase in the imposed shearing rate causes contacts to strengthen, via
7)
)
8)
9)

36
the friction direct effect, followed by weakening. This would cause a transient
widening of the shear band, as interparticle slip was temporarily arrested and particles
rotated, with attendant local dilation. With continued slip, and contact weakening via
the friction evolution effect, the shear band would thin. We assume that interparticle
contacts undergo velocity weakening, even where the macroscopic friction response
is velocity strengthening [e.g. Marone et al., 1990], and thus the shear band thins as
slip is focused on weaker contacts. On the other hand, a transient decrease in the
imposed shearing rate has the effect of, effectively, delocalizing shear by equalizing
age (frictional state) of interparticle contacts within the active shearing zone relative
to those outside the zone. This growth (thickening) of the actively shearing zone as it
incorporated more material from ‘spectator’ regions [e.g. Mair et al., 2002; Mair and
Abe, 2008] would produce larger Dcb.
2.4.3 Localization and till rheology
The progressive localization that we observe is consistent with the changes in
till rheology noted by Rathbun et al. [2008]. They observe a gradual change from a
pseudo-viscous rheology with a stress exponent of order 1 at $ ~ 0, to values > 30 as a
function of accumulated shear strain. Our experiments were conducted using the same
experimental configuration and on the same material as those of Rathbun et al.
[2008]. The change in the stress exponent and transition of the stress exponent occurs
over the same interval as our decrease in $h*. Our data support the idea that the
rheology of till is a function of shear localization. These results suggest that as long as
shear remains localized in till a frictional (Coulomb-plastic) rheology is appropriate

37
rather than a viscous rheology. In the case that pore pressure or some other feedback
destroys localization, a viscous rheology could apply until shear strain accumulates.
2.5 CONCLUSIONS
Laboratory experiments on a saturated, mixed grain-size granular media show
that shear begins to localize prior to the peak frictional strength. Dilation of the layer
in creep experiments and the evolution of the friction constitutive parameters (a-b and
critical slip distance) all show a progressive transition from distributed shear to
localized deformation. Passive strain markers in the layer confirm that distributed
deformation occurs at the lowest shear strain, and then deformation occurs in a
localized zone in the center of the sample. This localization occurs progressively
starting at a strain of ~0.15 and continues after the peak strength until a shear strain of
~1-2. The localized zone is similar to boundary parallel Y-shears in the sample.
Mapping shear strain across of the deforming layer using embedded shear markers
shows that the formation of the boundary parallel layer occurs at shear strain < 1.9.
These localization features occur despite the material showing velocity strengthening
frictional behavior at all shear strains. Step increases and decreases in velocity
indicate an asymmetry in some of the rate and state friction constitutive parameters.
The asymmetry is observed in the critical slip distance, while the velocity dependence
of friction remains constant for velocity increases and decreases when the data are
modeled with the Dieterich law. If the data are modeled using the Ruina law,
asymmetry is not observed or is obscured by scatter in the data owing to the
heterogeneous nature of the material. Since the velocity dependence of friction

38
remains constant for increases and decreases in velocity, asymmetry could be the
result of changes in the degree of shear localization within the bulk layer. However,
direct comparison of velocity increases and decreases shows nearly identical
evolution of the critical slip distance, leading us to favor the Ruina law for friction
state evolution.
The results of this study imply that localization of strain can occur at low
shear strains in preexisting faults and glacial deformation zones. The bulk rheology of
subglacial till may be the result, and not the cause, of localization in the shearing till
layer. Highly localized zones within fault gouge such as the principle slip surface may
begin to form at low shear strain, regardless of velocity weakening or strengthening
behavior.
2.6. ACKNOWLEDGMENTS
This work was funded by: ANT-0538195. We thank Hitoshi Banno and Mike
Underwood for providing XRD analysis. Particle size analysis was conducted at the
Materials Research Institute, at Penn State. This manuscript was greatly improved by
the comments of two anonymous reviews, Associate Editor Dan Faulkner and
comments on early versions by André Niemeijer and Sébastien Boutareaud.
REFERENCES
Alley, R. B. (2000), Continuity comes first: recent progress in understanding
subglacial deformation, in Deformation of Glacial Materials Geol., Soc.
London, Spec. Publ. Ser. vol. 176, edited by A.J. Maltman, B. Hubbard, and
M.J. Hambrey 171-179, Geol Soc of London, London.

39
Anandakrishnan, S., and C. R. Bentley (1993), Micro-earthquakes beneath Ice
Streams B and C, West Antarctica: observations and implications, J. Glaciol.
39(133), 455-462.
Antonellini, M.A. and D. D. Pollard (1995), Distinct element modeling of
deformation bands in sandstone, J. Struct. Geol. 17(8), 1165-1182.
Arboleya, M. L., and T. Engelder (1995), Concentrated slip zones with subsidiary
shears: their development on three scales in the Cerro Brass fault zone,
Appalachian valley and ridge, J. Struct. Geol., 17(4), 519-532.
Beeler, N. M., T. E. Tullis, M. L. Blanpied, and J. D. Weeks (1996), Frictional
behavior of large displacement experimental faults, J. Geophys. Res. 101(B4),
8697-8715.
Beeler, N. M., T. E. Tullis, and J. D. Weeks (1994), The roles of time and
displacement in the evolution effect in rock friction, Geophys. Res. Lett. 21(18),
1987-1990.
Billi, A., and F. Storti (2004), Fractal distribution of particle size in carbonate
cataclastic rocks from the core of a regional strike-slip fault zone, Tectonophys.
384, 115-128.
Blanpied, M.L., C. Marone, D. A. Lockner, J. D. Byerlee, and D. P. King (1998),
Quantitative measure of the variation in fault rheology due to fluid-rock
interactions, J. Geophys. Res. 103, 9691-9712.
Boitnott, G. N., R. L. Biegel, C. H. Scholz, N. Yosioka, and W. Wang (1992),
Micromechanics of rock friction 2: quantitative modeling of initial friction with
contact theory, J. Geophys. Res. 97, 8965-8978.
Boulton, G. S., and R. C. A. Hindmarsh (1987), Sediment deformation beneath
glaciers: rheology and geological consequences, J. Geophys. Res., 92(B9),
9059-9082.
Brace, W. F., and J. D. Byerlee (1966), Stick-slip as a mechanism for earthquakes,
Science, 26(153), 990-992.
Carpenter, B.M. (2007), The Transition from Jamming to Rolling in Sheared
Granular Media: The Formation of Force Chains and Effects of Normal Load
and Velocity, M.Sc. Thesis, Department of Geosciences, The Pennsylvania
State University
Cashman, S.M., and K.V. Cashman (2000), Cataclasis and deformation-band
formation in unconsolidated marine terrace sand, Humboldt County, California,
Geology 28, 111–114.
Cashman, S.M., J. N. Baldwin, K. V. Casman, K. Swanson, and R. Crawford (2007),
Microstructures developed by coseismic and aseismic faulting in near-surface
sediments, San Andreas fault, California, Geology 35, 611–614.
Chester, F. M., and J. S. Chester (1998), Ultracataclasite structure and friction
processes of the Punchbowl fault, San Andreas system, California,
Tectonophys. 295, 199-221.
Chester, F.M., J. S. Chester, D. L. Kirschner, S. E. Schulz, and J. P. Evans (2004),
Structure of large-displacement, strike-slip fault zones in the brittle continental
crust, in Rheology and Deformation in the Lithosphere at Continental Margins,
edited by G.D. Karner, B. Taylor, N.W. Driscoll, and D.L. Kohlstedt, Columbia
University Press, New York.

40
Clarke, G. K. C. (2005), Subglacial processes, Annu. Rev. Earth Planet Sci. 33, 247-
276 doi:10.1146/annurev.earth.33.092203.122621.
Di Toro, G., S. Nielsen, and G. Pennacchioni (2005), Earthquake rupture dynamics
frozen in exhumed ancient faults, Nature 436, 1009-1012.
Dieterich, J. H. (1979), Modeling of rock friction: 1. Experimental results and
constitutive equations. J. Geophys. Res. 84(B5), 2161-2168.
Dieterich, J.H. (1981), Constitutive properties of faults with simulated gouge, in
Mechanical Behavior of Crustal Rocks, Geophys. Mono. Ser. 24 edited by N.L.
Carter, M. Friedman, J.M. Logan, and D.W. Stearns, pp. 103-120, AGU,
Washington DC.
Ekstrom, G., M. Nettles, and J. A. Abers (2003), Glacial Earthquakes, Science
302(5645), 622-624.
Ekstrom, G. M. Nettles, and V. C. Tsai (2006), Seasonality and increasing frequency
of Greenland glacial earthquakes, Science, 311, 1756-1758.
Engelder, J. T. (1974), Cataclasis and the generation of fault gouge, Geol. Soc. Am
Bull. 85, 1515-1522.
Evans, D.J.A., E. R. Phillips, J. F. Hiemstra and C. A. Auton (2006), Subglacial till:
Formation, sedimentary characteristics and classification, Earth-Sci. Rev.,
78(1), 115-176, doi:10.1016/j.earscirev.2006.04.001
Faulkner, D. R., A. C. Lewis, and E. H. Rutter (2003), On the internal structure and
mechanics of large strike-slip fault zones: field observations of the Carboneras
fault in southeastern Spain, Tectonophys. 367, 235-251.
Fossen, H., R. A. Schultz, Z. K. Shipton, and K. Mair (2007), Deformation bands in
sandstone - a review, J. Geol. Soc. 164(4), 755-769.
Frank, F.C. (1965), On dilatancy in relation to seismic sources, Rev. Geophys., 3(4),
485-503.
Frye, K. M., and C. Marone (2002), Effect of humidity on granular friction at room
temperature, J. Geophys. Res., 107(B11).
Gu, Y., and T-f. Wong (1994), Development of shear localization in simulated quartz
gouge: Effect of cumulative slip and gouge particle size, Pure Appl. Geophys.
143, 377-423.
Haefner, R. J. (2000), A Conference on Fractured Glacial Tills, Field Trip Guide to
Selected Fractured Glacial Till Sites and Soils in Central Ohio.
Hayman, N. W., B. A. Housen, T. T. Cladouhos, and K. Livi (2004), Magnetic and
clast fabrics as measurements of grain-scale processes within the Death Valley
shallow crustal detachment faults, J. Geophys. Res. 109(B05409)
Kamb, B. (1991), Rheological nonlinearity and flow instability in the deforming bed
mechanism of ice stream motion, J. Geophys. Res. 96(B10), 16,585-16,595.
Kamb, B. (2001), Basal zone of the West Antarctic ice streams and its role in
lubrication of their rapid motion, in The West Antarctic Ice Sheet, edited by R.
B. Alley, and R. A. Bindschadler, pp 99-157, AGU, Washington, DC.
Karner, S. L., and C. Marone (2001), Frictional restrengthening in simulated fault
gouge: Effect of shear load perturbations, J. Geophys. Res. 106(B9), 19,319-
19,337.

41
Hong, T., and C. Marone (2005), Effects of normal stress perturbations on the
frictional properties of simulated faults, Geochem. Geophys. Geosyst. 6,
Q03012DOI 10.1029/2004GC000821.
Iverson, N. R., R. W. Baker, and T. S. Hooyer (1997), A ring-shear device for the
study of till deformation: tests on tills with contrasting clay contents, Quat. Sci.
Rev., 16(9): 1057-1066.
Iverson, N. R., T. S. Hooyer, and R. W. Baker (1998), Ring-shear studies of till
deformation: Coulomb-plastic behavior and distributed strain in glacier beds, J.
Glaciol., 44(148), 634-642.
Iverson, N. R., T. S. Hooyer, J. F. Thomason, M. Graesch, and J. R. Shumway
(2008), The experimental basis for interpreting particle and magnetic fabrics of
sheared till, Earth Surf. Proc. Landforms 33: 627-645.
Larsen, N. K., J. A. Piotrowski, and F. Christiansen (2006), Microstructures and
microshears as a proxy for strain in subglacial diamicts: Implications for basal
till formation, Geology 34(10), 889-902.
Logan, J. M., C. A. Dengo, N. G. Higgs, and Z. Z. Wang (1992), Fabrics of
experimental fault zones: Their development and relationship to mechanical
behavior, in Fault Mechanics and Transport Properties of Rocks, edited by B.
Evans and T. Wong, 33-68, Academic Press, London.
Logan, J. M., and K. A. Rauenzahn (1987), Frictional dependence of gouge mixtures
of quartz and montmorillonite on velocity, composition, and fabric, Tectonophy.
144, 87-108.
Logan, J. M., M. Friedman, N. Higgs, C. Dengo, and T. Shimamodo (1979),
Experimental studies of simulated fault gouges and their application to studies
of natural fault zones, in Analysis of Actual Fault Zones in Bedrock, US Geol.
Surv. Open File Rep., 1239, 305-343.
Mair, K., and S. Abe (2008), 3D numerical simulations of fault gouge evolution
during shear: Grain size reduction and strain localization, Earth Planet. Sci.
Lett., 274 (1): 72-81. doi:10.1016/j.epsl.2008.07.010.
Mair, K., K. M. Frye and C. Marone (2002), Influence of grain characteristics on the
friction of granular shear zones, J. Geophys Res. 107(10),
doi:10.1028/2001JB000516.
Mair, K., and C. Marone (1999), Friction of simulated fault gouge for a wide range of
velocities and normal stress, J. Geophys. Res., 104(B12), 28,899-28,914.
Mandl, G., L., N. J. de Jong, and A. Maltha (1977), Shear zones in granular material,
an experimental study of their structure and mechanical genesis, Rock Mech., 9,
95-144.
Marone, C. (1998), Laboratory-derived friction constitutive laws and their application
to seismic faulting, Ann. Rev. Earth Planet. Sci., 26, 643-696.
Marone, C., and S. J. D. Cox (1994), Scaling of rock friction constitutive parameters:
the effects of surface roughness and cumulative offset on friction of gabbro,
Pure Appl. Geophy. 143, 359-386.
Marone, C., Cocco, M., Richardson, E., and E. Tinti (2009), The critical slip distance
for seismic and aseismic fault zones of finite width, in: Fault-zone Properties
and Earthquake Rupture Dynamics, edited by E. Fukuyama, International
Geophysics Series, 94, 135-162, Elsevier.

42
Marone, C., B. E. Hobbs, and A. Ord (1992), Coulomb constitutive laws for friction:
contrasts in frictional behavior and localized shear, Pure Appl. Geophy. 139,
195-214.
Marone, C. and B. Kilgore (1993), Scaling of the critical slip distance for seismic
faulting with shear strain in fault zones, Nature 362, 618-622.
Marone, C., C. B. Raleigh, and C. H. Scholz (1990), Frictional behavior and
constitutive modeling of simulated fault gouge, J. Geophys. Res., 95(B5), 7007-
7025.
Menzies, J., J. J. M. van der Meer, and J. Rose (2006), Till-as a glacial “tectomict”,
its internal architecture, and the development of a “typing” method for till
differentiation, Geomorph. 75(2), 172-200,
doi:10.1016/j.geomorph.2004.02.017.
Mead, W. J. (1925), The geologic role of dilatancy, J. Geol. 33, 685-698.
Mitchell, J. K., and K. Soga (2005), Fundamentals of Soil Behavior, Third Edition,
John Wiley and Sons, Inc., Hoboken.
Montgomery, D.R. and D. L. Jones (1992), How wide is the Calaveras fault zone? -
Evidence for distributed shear along a major fault in central California, Geol.
20, 55-58.
Mooney, W. D., and A. Ginzburg (1986), Seismic measurements of the internal
properties of fault zones, Pure Appl. Geophy. 124, 141-157.
Morgan, J. K. and M. S. Boettcher (1999), Numerical simulations of granular shear
zones using the distinct element method 1. Shear zone kinematics and the
micromechanics of localization, J. Geophys. Res. 104(B2), 2703-2719.
Niemeiijer, A. R. and C. J. Spiers (2005), Influence of phyllosilicates on fault
strength in the brittle-ductile transition: insights from rock analogue
experiments, in High-Strain Zones: Structure and Physical Properties, Geol.
Soc., London, Special Pub. (245) edited by D. Bruhn and L. Burlini, 303-327.
Rabinowicz, E. (1958), The intrinsic variables affecting the stick-slip process, Proc.
Phys. Soc London, 71, 668-675.
Ramsay, J. G. and R. H. Graham (1970), Strain variation in shear belts, Can. J. Earth
Sci. 7(3), 786-813.
Rathbun, A. P., C. Marone, R. B. Alley, and S. Anandakrishnan (2008), Laboratory
study of the frictional rheology of sheared till, J. Geophys. Res, 113(F02020),
doi:10.1029/2007JF000815.
Reynolds, O. (1885), On the dilatancy of media composed of rigid particles in
contact, Phil. Mag. S 5 20, 469-481.
Ruina, A. (1983), Slip instability and state variable friction laws, J. Geophys. Res.,
88, 10359-10370.
Schleicher, A.M., B. A. van der Pluijm, J. G. Solum, and L. N. Warr (2006), Origin
and significance of clay-coated fractures in mudrock fragments of the SAFOD
borehole (Parkfield, California), Geophys. Res. Lett. 33,
doi:10.1029/2006GL026505.
Scholz, C.H. (1987), Wear and gouge formation in brittle faulting, Geol. 15, 493.
Scholz, C. H. (2002), The Mechanics of Earthquakes and Faulting, Second Edition,
Cambridge University Press, Cambridge.

43
Scott, D., C. Marone, and C. Sammis (1994), The apparent friction of granular fault
gouge in sheared layers, J. Geophys. Res. 99(B4), 7231-7247.
Scruggs, V.J. and T.E Tullis (1998), Correlation between velocity dependence of
friction and strain localization in large displacement experiments on feldspar,
muscovite and biotite gouge, Tectonophys. 295, 15-40.
Sibson, R. H. (2003), Thickness of the seismic slip zone, Bull. Seism. Soc. Am. 93(3),
1169-1178.
Storti, F., A. Billi, and F. Salvini (2003), Particle size distributions in natural
carbonate fault rocks: insights for non-self-similar cataclasis, Earth Plan. Sci.
Let. 206, 173-186.
Thomason, J. F., and N. R. Iverson (2006), Microfabric and microshear evolution in
deformed till, Quat. Sci. Rev. 25: 1027-1038.
Truffer, M., W. D. Harrison, and K. A. Echelmeyer (2000), Glacier motion
dominated by processes deep in underlying till, J. Glaciol. 46(153), 213-221.
Tsai, V. C., J. R. Rice, and M. Fahnestock (2008), Possible mechanisms for glacial
earthquakes. J. Geophys. Res. 113(F03014), doi:10.1029/2007JF000944.
Underwood, M.B., N. Basu, J. Steurer and S. Udas (2003), Data report:
Normalization factors for semi-quantitative X-ray diffraction analysis, with
application to DSDP Site 297, Shikoku Basin, in Proceeding of the Ocean
Drilling Program, Scientific Results 190/196, edited by Mikada, H., et al.,
Ocean Drilling Program: College Station, Texas, 1-26.
Winberry, J. P., S. Anandakrishnan, R. B. Alley, R. A. Bindschadler, and M. A. King
(2009), Basal mechanics of ice streams: Insights from the stick-slip motion of
Whillans Ice Stream, West Antarctica, J. Geophys. Res., 114, F01016,
doi:10.1029/2008JF001035.

44
Experiment "n (MPa) Exp. Type hi (mm) % i
p729 1 Creep- 2% steps 10 1.12
p731 1 Creep- 5% steps 10 1.15
p732 1 Creep- 5% steps 10 1.12
p737 1 Creep- 2% steps 10 1.13
p746 1 Creep- 2% steps 10 1.19
p750 1 Creep- 5% steps 10 1.14
p757 1 Creep- 5% steps 10 0.1
p760 1 Creep- 2% steps 10 0.18
p761 1 Creep- 5% steps 10 0.16
p1125 1 Creep- 5% steps 10 0.15
p1131 1 Creep- 5% steps 10 0.25
p1167 1 Creep- 5% steps 10 0; 2.65
p1194 1 Creep- 5% steps 10 0.19; 1.78
p1215 1 Creep- 5% steps 5 0.25
p1216 1 Creep- 5% steps 5 0.95
p1228 1 Creep- 5% steps 10 0.56
p1229 1 Creep- 5% steps 5 0.3
p1230 5 Creep- 5% steps 10 0.87
p1231 5 Creep- 5% steps 10 0.3
p1253 0.5 Creep- 5% steps 10 1.05
p1263 0.5 Creep- 5% steps 10 0.09
p1345 1 V-Steps- 10-30 !m/s 10 N/A
p1494* 1 Const. Disp. 10 N/A
p1507 1 V-Steps- 10-30 !m/s 10 N/A
p1508* 1 V-Steps- 10-30 !m/s 10 N/A
p1513 1 Creep- 5% steps 10 0.52
p1572 1 V-Steps- 10-30 !m/s 10 N/A
p1814 1 Creep-7.5% steps 10 0.24; 1.27
p1824 1 Creep- 5% steps 10 1.07
p1906 1 Creep- 5% steps 10 1.17
p1910 1 Creep- 5% steps 3 0.7
p1938 1 Creep- 5% steps 10 0.17; 0.56
p1940 1 Creep- 5% steps 3 0.15; 0.92
p1942 1 Creep- 5% steps 10 4.3
Table 2.1. Experiment details. *denotes experiments that included strain markers. hi
is initial layer thickness. $i is initial shear strain.

45
Figure 2.1. Double-direct shear configuration. The nominal frictional contact area
was 10 cm x 10 cm and did not change with shear. Initial layer thickness was 0.3, 0.5
or 1 cm. The block arrangement was surrounded by a rubber membrane and filled
with water. The reservoir was open to the atmosphere leading to saturated, drained
conditions.

46
0
20
40
60
80
100
10-50.00010.0010.010.1110100
Mat Site 4Mat Site 2Caesar
Pe
rce
nt
Fin
er
Grain Size (mm)
Experimental Range
ClaySilt
Figure 2.2. Grain-size distribution for Caesar till. Samples were air-dried and
sieved. Fine fraction (< 63 !m) was analyzed using Laser Diffraction. Experiments
are conducted on all grains that passed through a 1 mm sieve.

47
0
0.1
0.2
0.3
0.4
0.5
0.6
0
0.5
1
1.5
2
0 5 10 15 20
Shear
Str
ess, ! (M
Pa)
Shear
Str
ain
, "
Time (kiloseconds)
Stress Control
p722
a
"
!
"i
0
0.1
0.2
0.3
0.4
0.5
0.6
0 0.5 1 1.5 2 2.5
Shear Strain, !
"res
b
!i
Shear
Str
ess, " (M
Pa)
Figure 2.3. Complete stress-strain history for a representative experiment. Layers
were sheared under controlled shear stress or constant shear displacement rate (boxed
areas). (A) Shear stress and strain vs. time to highlight creep mode section. (B) Shear
stress vs. shear strain for the same experiment. The preconditioning shear strain, $i
was varied systematically to study the effect of shear localization on creep behavior.
We measured #res during the (preconditioning) run-in, prior to creep tests under stress
control. After completion of creep testing, we switched back to constant shear
displacement rate. Modified from Rathbun et al. [2008].

48
0.35
0.4
0.45
0.5
0.55
0.6
0.26 0.27 0.28 0.29 0.3
Sh
ea
r S
tre
ss, ! (
MP
a)
La
ye
r T
hic
kn
ess, h
Shear Strain
10 µm
p1167
"h*
!
h
Rathbun and Marone! Strain Localization in Granular Materials, Figure 4
0 20 40Time (min)
h
10 µm
Figure 2.4. Layer thickness data for two representative shear stress steps during creep
loading. Dashed line shows raw layer thickness. Lower line shows change in layer
thickness, $h* corrected for geometric thinning. Note rapid dilation and steady-state
change in thickness caused by stress steps. (Inset) temporal evolution of corrected
layer thickness during one complete stress step.

49
0
4
8
12
16
20
0.005 0.015 0.025 0.035 0.045
High StrainLow Strain
!h
* (µ
m)
Change in Shear Stress (MPa)
Figure 2.5. Scaling of dilation "h* with magnitude of shear stress change. Note that
"h* increases with stress step size for low shear strain ($i < 0.2) but not for higher
shear strain. High strain corresponds to $i = 1-1.2 for 0.01 MPa and 0.025 MPa steps
and $i = 1.28 for 0.045 MPa steps. Low strain corresponds to $i < 0.02 for 0.01 MPa
and 0.025 MPa steps and $i = 0.026 for 0.045 MPa steps.
50
0
2
4
6
8
0 1 2 3 4
1 cm, ! = 1 MPa
0.5 cm, ! = 1 MPa
1 cm, ! = 0.5 MPa
0.3 cm ! = 1 MPa
Shear Strain, "i
#h
* (µ
m)
0
2
4
6
0.1 1
Figure 2.6. Layer dilation $h* induced by shear stress perturbations of magnitude
0.05 !res (e.g. Figure 2.4) plotted versus $i, the initial shear strain prior to creep tests
(e.g. Figure 2.3). Inset shows data versus the log of $i. Dilation is largest at low $i,
where shear is expected to be pervasive, and decreases systematically as a function of
$i. The 0.5-cm thick layers show about half the dilation of 1-cm thick layers at low
strain, ~ 3 !m and 6 !m, respectively, but the values are about the same for a shear
strain of 1. Each data point represents several stress steps. Error bars show one
standard deviation from the mean and data with error > 30% of the mean are not
plotted.

51
0
0.2
0.4
0.6
0 1 2 3 4
Fri
ctio
n C
oe
ffic
ien
t, !
p1345
Shear Strain, !
0.54
0.55
0.56
0.57
2.6 2.65 2.7
Shear Strain
10
a ln(v/v0)
b ln(v/v0)
Dc
30 µm/s30
Figure 2.7. Controlled slip velocity experiment. Velocity is stepped between 10-30
!m/s and held for either 450 !m or 550 !m for the entire displacement range of the
apparatus. Each velocity step causes a spike, then decay in friction. (Inset) Frictional
response to a step increase in velocity. When velocity is increased, frictional strength
increases instantaneously and then decays over a characteristic slip distance (Dc). In
this example, the instantaneous increase is larger than the subsequent decay, and
therefore steady state sliding friction exhibits positive a-b and velocity-strengthening
behavior.

52
Figure 2.8. Two velocity steps
with velocity increased (A, B)
and decreased (C, D) for
experiment p1572. (A) Velocity
is instantaneously increased
from 10 !m/s to 30 !m/s. After
the increase, friction increases
then decays to a new steady
value over the critical slip
distance (Dc). Inverse modeling
using the Dieterich law (thick,
grey line) produces values of
0.0116, 0.0106, and 94.7 !m for
the parameters a, b, and Dc,
respectively. Forward models
with different values for the
critical slip distance are shown
for reference. (B) Analysis
using the Ruina law. Inverse
modeling produces values of
0.0121, 0.0102, and 114.7 !m
for a, b, and Dc, respectively.
(C) Velocity is decreased to 10
!m/s and modeled with the
Dieterich law. Values are
0.0137, 0.0117, and 151.5 !m
for a, b, and Dc, respectively.
Reference forward models are
shown for different critical slip.
(D) Velocity decrease modeled
with the Ruina law. Values are
0.0131, 0.0110, and 108.0 !m
for a, b, and Dc, respectively.
0.595
0.6
0.605
0.61
DataD
c = 75 !m
Dc = 95 !m
Dc = 150 !m
Dc = 200 !m
Frictio
n C
oe
ffic
ien
t, !
p1572Dieterich Law
10 30 !m/s
A
100 !m
0.595
0.6
0.605
0.61
Data
Dc = 75 !m
Dc = 115 !m
Dc = 150 !m
Dc = 200 !m
Frictio
n C
oe
ffic
ien
t, !
p1572Ruina Law
10 30 !m/s
B
100 !m
0.58
0.585
0.59
0.595
DataD
c = 200 !m
Dc= 151 !m
Dc = 100 !m
Dc = 75 !m
Frictio
n C
oe
ffic
ien
t, !
p1572Dieterich Law
30 10 !m/s
100 !m
C
0.58
0.585
0.59
0.595
Data
Dc = 75 !m
Dc = 108 !m
Dc = 150 !m
Dc = 200 !m
Frictio
n C
oe
ffic
ien
t, !
p1572Ruina Law
30 10 !m/s
Loadpoint Displacement
100 !m
D

53
100
150
200
250
300
-0.025
-0.02
-0.015
-0.01
-0.005
0
0.005
1 2 3 4Critical S
lip D
ista
nce, D
c (!
m)
a-b
Shear Strain
Velocity Decrease
Velocity Increase
p1572
Dieterich Law
A
100
150
200
250
300
-0.025
-0.02
-0.015
-0.01
-0.005
0
0.005
1 2 3 4
a-b
p1572
Shear Strain
B
Critc
ial S
lip D
ista
nce, D
c (!
m)
Ruina Law
Velocity Decrease
Velocity Increase
100
150
200
250
300
-0.025
-0.02
-0.015
-0.01
-0.005
0
0.005
1 2 3 4Critc
ial S
lip D
ista
nce, D
c (!
m)
a-b
Shear Strain
Velocity Decrease
Velocity Increase
p1507
Dieterich Law
C
100
150
200
250
300
-0.025
-0.02
-0.015
-0.01
-0.005
0
0.005
1 2 3 4Critc
ial S
lip D
ista
nce, D
c (!
m)
a-b
Shear Strain
Velocity Decrease
Velocity Increase p1507
Ruina Law
D
Figure 2.9. Friction constitutive parameters for two select experiments. Velocity
decreases and increases are presented for the Dieterich law (A, C) and Ruina law (B,
D). The velocity dependence of friction (a-b) decreases with increased shear strain in
all cases. Values for a-b show no variation between velocity increases or decreases
when using either law. Values of the critical slip distance are dependent on the sign of
the velocity step when modeled with the Dieterich Law (A, C). Modeling the data
with the Ruina law produces equivalent Dc for both velocity increases and decreases.

54
Figure 2.10. Photomicrograph showing shear strain within the layer. Total bulk shear
strain in the experiment was 3.9. (A) The strain markers were initially vertical; arrows
on the top and bottom indicate sense of shear. (B) The 3 sets of strain markers are
outlined. Due to the large displacement in the sample, only the central marker is
complete. During disassembly, the sample parted on the left most strain marker. The
shear marker curves into a boundary parallel zone in the center of the sample.
Fiducial lines represent the angular shear strain from the rotation of a vertical line.
(C) Enlarged image of (A) with three transects across the shear zone. The angular
shear strain, $a, is calculated between each point and presented in (D). (D) Angular
shear strain as a function of position across the sample. Data symbols and position
correspond to (C) and the thickness of the sample. The displacement from the
overlaid normal distribution (solid black line) corresponds to bulk shear strain, $, ~ 2
leaving $ ~ 1.9 in the center 1.6 mm of the sample. Micrograph from experiment
p1508; no vertical exaggeration.

55
Figure 2.11. Idealized strain distribution for localized and distributed deformation.
(A) Layer before shear with two theoretical strain markers. (B) During distributed
deformation passive strain markers are continuously offset in simple shear. (C) After
initially distributed deformation, markers are offset by localized deformation in a thin
zone or plane. (D) Distributed deformation transitioning into localized strain.
Boundary zones stop contributing to layer deformation and neighboring grains
continue to shear resulting in a slight offset of the marker. This process continues
causing an apparent curvature of the strain marker until all shear occurs in the center
of the sample.

56
Figure 2.12. Layer dilation data with corresponding stress-strain curves for
experiments at a normal stress of 1 MPa and initial layer thickness of 1 cm. Dilation
begins at $i ~0.15 and continues until $i ~1. During the low strain portion distributed
deformation is occurring throughout the layer. During the decrease in dilation shear is
progressing into the localized state. This transition begins before the peak frictional
strength and continues until after steady sliding friction has been achieved. Grey scale
represents the progression from distributed shear (grey) to localized deformation
(white).

57
Frictio
n
Loadpoint Displacement (µm)
p1345
Velocity Decrease, n=4
0.008
100 µm
Velocity Increase, n=3
Inverted Velocity Decrease, n=4F
riction
Load Point Displacement
p2415
F110 Quartz
!n = 25 MPa0.006
25 µm
Velocity Increase, n=4
Inverted Velocity Decrease, n=3
Velocity Decrease, n=3
Figure 2.13. (A) Velocity increases and decreases for experiment p1345 on Caesar
till at a normal stress of 1 MPa. Seven steps are shown: three velocity increases
(black) and four decreases (red). Velocity decreases are inverted (green) for
comparison. Peak friction, and the evolution to steady-state are indistinguishable for
increases and inverted decreases. (B) Velocity increases and decreases for pure
quartz samples shear at a normal stress of 25 MPa. Velocity increases and decreases
exhibit differing behavior with the decreases reaching peak friction at smaller
displacements and evolving to steady state and larger slip. Peak friction is slightly
small for decreases than increases.

58
Chapter 3. SYMMETRY IN RATE AND STATE
FRICTION
Andrew P. Rathbun1, 2
Chris Marone1, 2
1Department of Geosciences, Penn State University, University Park, PA 16802
2Penn State Sediment and Rock Mechanics Laboratory
To be submitted JGR

59
ABSTRACT
We performed experiments to investigate the symmetry/asymmetry of rate and state
friction (RSF). Experiments were conducted in double-direct shear at 1 or 25 MPa
normal stress with shear velocity stepped by a factor of 3 or 30. Experiments were
conducted on one of three granular materials or on bare surfaces of Westerly granite;
each of these materials has different frictional behavior. We find that the Ruina slip
law, which predicts frictional symmetry between velocity increases and decreases,
better matches our data than the Dieterich ageing law, which predicts that velocity
decreases should evolve to steady state at smaller displacement. Conversely, some
increases reach steady state friction at smaller displacement than decreases, an
unexpected result from RSF. On bare surfaces the frictional response is symmetric.
For factor of 30 velocity steps in granular materials, two distinct length scales are
required to reach steady state. We hypothesize that asymmetry and two-state behavior
is caused by changes in the localized shearing layer during the velocity step. In all
cases dilation after a velocity increase is smaller than compaction after a decrease. In
select experiments shear was stopped and normal stress was oscillated before
repeating the velocity steps. In all cases we find that these oscillations decrease the
critical slip distance, Dc. Reduction of Dc reduces the stability of a shearing media,
enhancing the possibility of seismic slip. Our experiments show that changes in the
localized shearing zone of fault gouge can influence the RSF parameters that control
earthquake rupture.

60
3.1. INTRODUCTION
Earthquakes in the brittle crust are controlled by frictional processes [e.g.
Scholz, 2002] with observations from both exhumed faults [e.g. Logan et al., 1979;
Chester and Chester, 1998; Cashman and Cashman, 2000; Faulkner et al., 2003;
Hayman et al., 2004; Cashman et al., 2007] and faults at depth [Zoback, et al., 2010]
indicating that earthquakes are hosted in gouge zones. Fault gouge is typically
unconsolidated near the surface with the amount of lithification increasing with depth.
The gouge zone can range in thickness from the micron to 10’s of meters scale
[Scholz, 2002; Sibson, 2003].
Typically, brittle faulting is described using the rate and state friction (RSF)
laws [Dieterich, 1979; 1981; Ruina, 1983]. In these empirical formalizations, second
order friction variations are dependent on both slip velocity and a variable of state,
thought to be the average contact lifetime between asperities [e.g. Rabinowitz, 1958],
and the slip history of the sample. In its simplest form the RSF equation is
!
µ(V ,") = µ0 + aln(V
V0
) + biln(V0"i
Dci
) (i=1,2) (1)
where ! is sliding friction at a velocity, V, and !0 is sliding friction at a reference
velocity, V0. The constitutive constant, a, often referred to the as the direct effect, is
thought to be the result of Arrhenius processes resulting from breaking bonds at the
atomic level [Rice et al., 2001]. The evolution effect, b, is related to the reference
sliding velocity, a variable of state, !, and a critical length scale, Dc. Equation (1) can
be written as either 1-state behavior when i=1 or two-state with i=2. In the case the
two-state behavior, two evolution effects with two distinct length scales are present.
In most cases only one length scale is considered and b2 is taken to be 0. Two-state

61
behavior is thought to arise from complex shear fabric in the sample; however, two-
state variable behavior is usually ignored due to complications of interpreting two
length scales.
The rate and state friction equation is usually coupled with one of two
common evolution laws for the state variable:
!
d"i
dt=1#
V"i
Dci
(i=1,2) Dieterich “aging” law (2)
!
d"i
dt= #
V"i
Dci
ln(V"
i
Dci
) (i=1,2) Ruina “slip” law (3)
These laws differ in their behavior at V=0. In this case, the aging law predicts
evolution of the state variable due to aging at grain-to-grain contacts, while the slip
law is undefined. In the aging law, contact lifetime is the dominant factor, while in
the slip law velocity and slip have a greater effect on state evolution.
The finite stiffness of the earth’s crust and experimental apparatuses requires
that the RSF equation (1) and the evolution laws (2, 3) be coupled with a term
describing the elastic stiffness of the loading apparatus. Written in terms of friction
[e.g. Gu et al., 1984] the change in stiffness with time is:
!
dµ
dt= k(V
l" V ) (4)
where k is the elastic loading stiffness of the loading apparatus, Vl is the loadpoint
velocity and V is velocity at the slip surface.
Figure 3.1 presents two synthetic velocity steps with different k, but the same
RSF parameters and velocities, Figure 3.1a is the Dieterich aging law and Figure 3.1b
is the Ruina slip law. Velocity increases with stiffness ranging k = 0.004 !m-1
to

62
0.0005!m-1
are presented along with decreases. Both increases and decreases also
include the theoretical case of k = %. The decreases are inverted for comparison to the
increases and presented as a mirror image. At low stiffness, a pronounced difference
exists between the peak friction for the velocity increases and decreases with the
increasing having a greater amplitude (Figure 3.1). Also, there is a difference in a
pre-peak behavior of velocity increases and decreases; the velocity decreases require
a smaller slip to reach peak friction than increases, indicating a higher apparent
stiffness. The differences in pre-peak behavior become less pronounced with
increased stiffness, with no difference in the infinitely stiff material. Contrasting
Figures 3.1a and 3.1b shows that the effects of stiffness are less pronounced for both
peak friction and the displacement required for peak friction in the Ruina formulation.
Also evident from Figure 3.1 is the different displacements required for the friction
evolution of the velocity increases and decreases to match. For the Dieterich law
(Figure 3.1a) the friction curves match starting at displacement ~110 !m whereas for
the Ruina law (Figure 3.1b) the increase/decrease curves begin to match at
displacement ~ 50 !m. The Dieterich law’s prediction of time as the controlling
variable in state evolution leads to steady state friction at a smaller relative
displacement for velocity decreases versus increases, whereas in the Ruina
formulation, slip is the controlling factor causing both decreases and increases to
reach steady state at equal displacements (Figure 3.1).

63
3.1.1 Comparison of Evolution Laws
While similar in form, the different approach of each evolution law yields
important distinctions in predictions of seismic behavior and at large velocity
perturbations. For small velocity steps, the two evolution laws show unique, but not
vastly different behavior (i.e. Figure 3.1). As the size of velocity steps increases the
behavior of the laws diverges [i.e. Ampuero and Rubin, 2008]. Several investigators
have noted that to reproduce Gutenberg-Richter phenomena and slip-pulses, contact
aging, and thus the Dieterich law is required [e.g. Heaton, 1990; Rice, 1993; Perrin et
al., 1995; Beeler and Tullis, 1996]. Ampuero and Rubin [2008] found that the
nucleation length varies considerably depending on which law is used. They show
that the nucleation zone for the Dieterich law should approach ~1 km, which could be
observable while the nucleation zone when using the Ruina law is ~100x smaller.
Previous laboratory experiments have been inconclusive in separating which
law should be used. Early experiments tended to favor the Ruina law due to its
prediction of symmetry between velocity increases and decreases [e.g. Tullis and
Weeks, 1986; Marone et al., 1990]. Imaging experiments by Dieterich and Kilgore
[1994] showed that real contact area evolved with normal stress and time, favoring
the Dieterich law. Beeler et al. [1994] preformed experiments in which the stiffness
of the loading apparatus was varied. They found that the Dieterich law better fit their
data over a range of hold times from ~3s to 105 s. Blanpied et al. [1998] observed a
better match with the Ruina law and two-state behavior in both room temperature and
experiments up to 800 °C. In low-stress experiments (normal stress equal to 1 MPa)
on glacial till Rathbun and Marone [2010] observed that modeling for the RSF

64
parameters yielded a longer Dc for velocity decreases than increases, opposite
Dieterich’s prediction; hence they favored the symmetric Ruina law. They also
proposed an alternative model in which the shear zone changes in width for velocity
increases and decreases. In such a model, interactions in the out-of-shear material or
porosity change in the shear zone works to override the commonly used laws.
Rathbun and Marone [2010] proposed that changing shear zone width within
a localized sample might cause samples that exhibit time-dependent effects to better
match the slip law. They hypothesized that the shear zone widens or out-of-shear
materials interact with the localized zone to lengthen the critical slip distance after a
velocity decrease. In this study we aim to investigate this hypothesis by monitoring
the friction evolution in several granular materials and bare surfaces. We compare
velocity increases and decreases in both large and small velocity steps and investigate
the role of out of shear material and shear zone thickness on brittle faulting.
3.2. EXPERIMENTAL METHODS
Experiments were conducted on three unique granular materials with varying
grain sizes (Figure 3.2) and bare surfaces of Westerly granite. Quartz samples were
obtained from the U.S. Silica Company, Rolla, MO. F110 quartz is medium-grained
pure quartz sand and Min-U-Sil 40 is silt- to clay-sized pure quartz powder, and
hereafter is referred to as fine-grained quartz. Caesar till is coarse grained sand
obtained from the former Scioto Lobe of the Laurentide Ice Sheet, and composed of
35% quartz, 26% calcite 23% plagioclase, and 16% clay minerals, with clay mineral
abundances of 35.3% smectite, 38.5% illite and 26.1% chlorite/kaolinite [Rathbun et

65
al., 2008; Rathbun and Marone, 2010]. Westerly granite was precision ground to
make square and parallel blocks to within 0.001” then sandblasted with 200 grit glass
beads for roughness to promote stable sliding.
The use of F110 quartz provides us with the advantage of comparing our data
with those of several other research groups and studies. This material is commonly
used in laboratory studies of granular friction [e.g. Mair and Marone, 1999; Frye and
Marone; Anthony and Marone, 2005; Samuelson et al., submitted] and is one the
materials being used in the on-going SAFOD (San Andreas Fault Observatory at
Depth) interlab comparison study [Lockner et al., 2009;
http://www.geosc.psu.edu/~cjm/safod/]. Additionally, Westerly granite has a long
history of use in experimental rock mechanics experiments dating back to the early
1900’s.
All experiments were conducted in a servohydraulic testing apparatus in the
double-direct shear configuration. This configuration consists of two parallel shear
zones with equal thicknesses and contact areas sandwiched between three steel blocks
(Figure 3.3). Force was measured via BeCu load cells attached to each loading ram
and displacement was measured external to the shear zone by Direct Current
Displacement Transducers (DCDT). Details of the experimental apparatus can be
found in [Mair and Marone, 1999; Karner and Marone, 2001; Frye and Marone,
2002; Rathbun et al., 2008]. Normal stress ranged from 1-40 MPa and was kept
constant during shear. In all experiments the nominal contact area was kept constant
at 10 cm x 10 cm. In our experiments the initial macroscopic shear zone thickness
ranged from 1 cm in granular samples to 0 on bare surface experiments. Shearing

66
velocity was varied in a series of step changes ranging from 1 !m/s to 300 !m/s.
Complete normal stress, layer thickness and shear velocity history for each
experiment is presented in Table 3.1.
3.3. RESULTS
3.3.1 Velocity Stepping Experiments
We conducted a series of velocity step experiments on several materials under
variable layer thickness and stress conditions to probe how localization affects RSF
and to evaluate which law may be most applicable to our experiments. Velocity steps
began at the initiation of the experiment. Initially, the coefficient of friction rapidly
increases at low strain then becomes steady (Figure 3.3). We only consider velocity
steps after friction has reached steady-state. Each velocity step results in a change in
friction with velocity increases (decreases) leading to pronounced peaks (troughs) in
friction followed by evolution back to steady-state sliding friction (Figure 3.3, inset).
The difference between friction before the steps and the peak is associated with a,
whereas b is associated with the difference between the peak and the new steady state
friction. The evolution from peak friction to the new steady state is controlled by Dc
which is the e-folding length from peak to steady state (Figure 3.3, inset). Due to the
finite stiffness of the loading apparatus, the RSF parameters cannot be measured from
a velocity step and must be modeled, accounting for the elastic loading stiffness (e.g.
Equation 4, Figure 3.1).
To assess asymmetry or symmetry of frictional responses to velocity
perturbations and to evaluate the RSF laws, we compare a series of velocity steps.

67
Figure 3.4a presents 10 consecutive velocity steps (five increases and five decreases)
from an experiment conducted on F110 quartz at 25 MPa normal stress. Each step is
plotted by lining up the point at which the velocity step occurs for easy comparison,
with the velocity increases shown in black and decreases in red. The velocity
decreases are inverted and shown as mirror images in green, e.g. Figure 3.1. Each
velocity increase (decrease) shows remarkable reproducibility during the loadup
portion before peak friction and the evolution to steady state. Similar to the synthetic
steps presented in Figure 3.1, the velocity decreases have a higher apparent stiffness,
as expected, as well as a smaller peak friction value. The measured k in these
experiments was 0.001 !m-1
, corresponding to the intermediate case of k in Figure
3.1. During the decrease to steady sliding friction, the two types of steps match and
evolve together beginning at ~25 !m, well before they reach steady state. Velocity
steps for F110 quartz are near velocity neutral with some steps slightly velocity
strengthening and some slightly weakening.
Caesar till (Figure 3.4b) displays similar behavior to F110 quartz. As with
F110 quartz, velocity decreases and increases come to steady state at similar
displacements, not with velocity decreases leading increases as predicted by the
Dieterich law. The peak friction is larger for till than for quartz. The length of Dc is
also longer for till than for F110 quartz. In all cases velocity steps on till are velocity
strengthening [e.g. Rathbun et al., 2008; Rathbun and Marone, 2010].
Velocity steps on fine-grained quartz (Figure 3.4c) again show reproducibility
for velocity increases and decreases. Due to velocity weakening and stick-slip
behavior at high normal stress, data for fine-grained quartz are only presented at 1

68
MPa normal stress. In experiments on the fine-grained quartz, velocity increases
reach steady state sliding friction at ~10 !m of slip while velocity decreases reach
steady sliding friction at ~25!m, contrary to the predictions of the Ruina and
Dieterich laws.
For the three granular materials presented in Figure 3.4, the length of Dc for
steady sliding friction correlates with the average grain size. For the finest grained
material, fine-grained quartz, steady friction is established by ~10 !m for velocity
increases and ~ 25 !m for decreases. Increasing the average grain size to that of F110
quartz lengthens the distance to steady sliding friction to ~100 !m for both velocity
increases and decreases. In the case of our largest grain sized material, glacial till,
steady friction is not established until >200 !m.
Increasing the size of the velocity perturbation by an order of magnitude to
10-300 !m/s increases the size of the friction peak for both velocity increases and
decreases and lengthens the displacement needed to reach a new steady friction level
(Figure 3.5a). Again, each step is nearly indistinguishable for velocity decreases;
however, the increases show minima ~75 !m after the velocity step. The step with the
lowest friction minimum is the first step and they follow, in order, to the last step,
which occurs at the largest displacement. This minimum in the friction is only
observed for the velocity increases. The decreases show a smooth evolution to steady
state, as in the smaller steps.
Till displays differences in behavior between increases and decreases for large
steps (Figure 3.5b). Velocity decreases again show a smooth transition from steady
state while increases display a break in the trend similar to Figure 3.5a. In both

69
Figures 3.5a and 3.5b, the first length scale associated with friction evolution in the
velocity increases evolves at a shorter displacement for velocity increases than
decreases. The second length scale increases the total displacement required to
establish steady friction. As a result of the second length scale, velocity increases and
decreases reach steady state at approximately the same displacement, but with
different shapes. As with experiments at large normal stress, large steps on the fine-
grained quartz display unstable behavior on velocity increases and therefore are not
presented. The velocity decreases on fine-grained quartz display a smooth transition
to steady sliding friction similar to both till and F110 quartz.
3.3.2 Dilation and Compaction During Velocity Steps
Each perturbation in velocity causes an associated change in layer thickness.
Velocity increases dilate the layer and decreases compact the layer (e.g. Figure 3.6).
Previous investigators have used the amount of dilation as a proxy for localization in
a shearing layer [Marone and Kilgore, 1993]. We follow this work, comparing the
relative amounts of dilation and compaction for the velocity steps in our experiments.
Following standard procedure [i.e. Scott et al., 1994] we remove a linear trend of
decreasing layer thickness produced from a geometric thinning in some shear
apparatuses. Layer thickness change is presented for 10 consecutive steps in Figure
3.6. As with plots of friction evolution, the velocity step that perturbs layer thickness
occurs at the first tick mark on the plot, and each step is offset to the same
displacement for comparison. Figure 3.6a presents the change in layer thickness for
representative steps on F110 quartz at 25 MPa with velocity steps between 10 and 30

70
!m/s. Dilation is given as a positive change in layer thickness and compaction as a
negative change. As with the friction curves (Figures 3.4, 3.5) the compaction
associated with velocity decreases is mirrored for comparison to velocity increases.
After a velocity increase the layer dilates ~1 !m for an initially 10 mm thick sample,
while after a decrease the layer compacts ~1.5 !m (Figure 3.6a). As with the friction
curves, layer thickness trends are reproducible. Experiments on Caesar till have
larger values for dilation/compaction and more variability between each step (Figure
3.6b). As with F110 quartz, the largest values of layer thickness change are
associated with velocity decreases, but the two populations show overlap in layer
thickness change. Experiments on fine-grained quartz display the largest disparity
between velocity increases and decreases (Figure 3.6c). Decreases in velocity
compact the layer ~2x as much as increases dilate the layer.
The change in layer thickness and the difference between compaction and
dilation scales with grain size in our experiments. The largest grain size, till, has the
largest dilation/compaction, followed by F110 quartz and then fine-grained quartz
(Figure 3.6). The separation between the dilation and compaction in till is unclear;
however, it appears that compaction is slightly larger than dilation (Figure 3.4b). In
F110 quartz, compaction is generally larger than dilation with some overlap between
the two, while in fine-grained quartz there is clear separation between dilation and
compaction. [e.g. Samuelson et al. submitted]
Increasing the size of the velocity steps to 10 to 300 !m/s highlights the
difference between velocity increases and decreases (Figure 3.7). Large velocity
increases and decreases on F110 quartz show ~2x more compaction than dilation after

71
a velocity step (Figure 3.7a). The compaction increases from ~1.5 !m on small steps
to 4 !m on large steps, while the dilation increases from 1 !m to ~2 !m for small and
large steps, respectively. Comparing the increases vs. decreases in the large steps
indicates that the rate of change of layer thickness is larger for velocity decreases. As
with the dilation/compaction with small velocity steps, till displays less disparity than
F110 quartz between velocity increases and decreases (Figure 3.7b), with greater
changes in layer thickness in the larger grain sized till. As with the small steps till has
a greater variability in the change in layer thickness than in F110 quartz.
3.3.3 Bare Surface Experiments
Two experiments on roughened bare granite surfaces show equal
displacements needed to reach steady state for order-of-magnitude steps (Figure 3.8).
Both bare-surface experiments show more variability than experiments on granular
materials, but still yield reproducible results both between and within individual
experiments. Velocity increases do show a tendency to produce unstable slip after, as
evidenced by the trough in friction at ~ 8!m displacement after the velocity step
(Figure 3.8a) Steps from experiment p2646 (Figure 3.8b) stably slide at 11 !m/s. This
difference is likely caused by subtle differences in surface roughness during sand
blasting.
Velocity increases and decreases required similar slip to reach steady state
(Figure 3.8b). As predicted by the RSF laws coupled with elastic stiffness (Figure
3.1), velocity decreases reach peak friction at a smaller displacement than increases.
Also, peak friction is smaller for decreases than increases. The evolution to steady

72
state then occurs with both increases and decreases reaching steady sliding friction at
~ 8 !m. As with the experiments on granular materials, the velocity decreases do not
evolve to steady friction at smaller displacements. This evolution is most consistent
with the Ruina slip law (Figure 3.1b). In contrast to the experiments on granular
samples, the displacement needed to reach steady state is equal for all cases in bare
surface experiments.
3.3.4 Normal Stress Oscillations
To evaluate the role of so-called spectator regions within shear zones [e.g.
Mair and Hazzard, 2007] we conducted a series of experiments in which velocity
steps were imposed on the sample, and then normal stress was oscillated to ensure
that the layer was fully compacted, followed by another series of velocity steps. In
one experiment normal stress was oscillated in 64 cycles between 25 and 15 MPa,
with all shear conducted at 25 MPa (Figure 3.9). Figure 3.9a presents the complete
history for experiment p2648. Shear occurs until ~13mm at 25 MPa (Figure 3.9a) and
then shear stress is removed. During the normal stress oscillations (Figure 3.9c) the
layer compacted from ~7.65 mm to ~7.59mm corresponding to a porosity loss of 0.8
porosity units (Figure 3.9b). In another experiment stress was increased in a series of
8 cycles between 25 and 35 MPa, corresponding to a thickness change of 30 !m or
0.4 porosity units with all velocity steps conducted at 25 MPa normal stress before
and after oscillations.
Velocity steps before and after stress oscillations are presented in Figure 3.10.
The oscillations reduce both the peak friction and the distance required to evolve back

73
to steady state (Figure 3.10a, b). Figure 3.10b presents forward models overlying the
two populations of velocity steps. RSF parameters are a = 0.0073, b = 0.00625 and Dc
= 36 !m before oscillations and a = 0.0075, b = 0.007 and Dc = 16 !m after
oscillations using the Ruina law. We choose to only use one state variable in the
models that are shown even though there is considerable misfit (Figure 3.9b). This
highlights the effects of the normal stress oscillations changing the behavior of the
shearing layer. In both experiments the peak friction associated with a is smaller after
the stress oscillations. Oscillations also decrease the size of the layer dilation. Before
normal stress was oscillated the layer dilated ~1.5 !m, and after the oscillations ~0.75
!m. This difference can be interpreted as a decrease in the thickness of the active
shear zone, or localization.
3.4. DISCUSSION
3.4.1 Which Law?
The Ruina slip law best matches our experimental data. The Dieterich law
predicts that velocity decreases should reach steady sliding friction at a smaller
displacement than increases. Our experiments on three different granular materials
and bare granite surfaces produces result contrary to this prediction of the Dieterich
law. Conversely, we observe that velocity increases and decreases reach steady state
at similar displacements (Figure 3.4a, 3.8), or that velocity decreases reach steady
state at smaller displacements than increases (Figure 3.4c) in experiments with small
velocity steps. Increasing the size of the velocity steps from 10-fold to a 30-fold
causes velocity increases to display two-state behavior while decreases still only have

74
one length scale to reach steady state (Figure 3.5). The first length scale on the large
increases evolves friction at a much smaller slip than velocity decreases. The second
length scale then evolves friction at a similar displacement as decreases.
These data agree with the hypothesis of Rathbun and Marone [2010], who
showed that for experiments at 1 MPa normal stress, a longer critical slip distance
was required to fit their data with velocity decreases when using the Dieterich law.
This led to the assertion that the Ruina law best described their experiments. This is in
contrast to the healing experiments of Beeler et al. [1996], which showed that the
Dieterich law best matched their data. We observe behavior consistent with neither
the Ruina nor Dieterich laws in that velocity increases can evolve to steady sliding
friction at smaller displacement than velocity decreases, i.e. Figure 3.4c.
Several other attempts have been made to update the evolution laws. Neither
of the commonly used laws has been adequate in describing all laboratory data and
different variables that may control the natural system. In the standard RSF equation
no term is included for variations in normal stress; however, work by Linker and
Dieterich [1992] has extended Equation 1 to include normal stress. Chester and
Higgs [1992] incorporated temperature in the RSF equations. Perrin et al. [1995]
extended the evolution laws to include symmetry between velocity increases and
decreases similar to the Ruina law, but with time-dependent aging like the Dieterich
law. A composite law was proposed by Kato and Tullis [2001] to explain the
experiments of Beeler et al. [1994]. The RSF laws also do not include chemical
effects that have been shown to interact with frictional interactions [e.g. Bos et al.,
2000; Niemeijer et al., 2008]. In our study we only attempt to evaluate the two most

75
commonly used laws that form the basis for most models of earthquake rupture [e.g.
Heaton, 1990; Beeler and Tullis, 1996; Ampuero et al., 2002; Lapusta and Rice,
2003; Ziv and Rubin, 2003] not test all of the alternative forms.
Sleep [2005] attempts to attach a physical meaning to the RSF friction laws,
contrasting the physical basis for each of the two common laws. They concentrate on
healing when V=0, rather than sliding. Sleep [2005] shows that the slip law arises
from exponential creep at contacts and scales with contact size, while the aging law
from creep for both shear and compaction at the subgranular scale. They attempt to
place bounds on the applicability of each law with the slip law occurring at low
humidity and the aging law at high humidity [i.e. Frye and Marone, 2002]. We find
that the slip law better approximates our data in experiments conducted at room
temperature and humidity.
3.4.2 Layer Controls on Friction Parameters
We propose that differences between velocity increases and decreases are
caused by changes in the shearing layer. Both suites of experiments, velocity step
comparison of increases and decreases and normal stress oscillations show that grain-
to-grain interactions and the characteristics of the localized shear zone control the rate
and state friction parameters.
For both large and small velocity steps an inequality in the dilation verses
compaction exists. During a velocity decrease, shear slows within the active,
localized zone. Both the localized zone and the passive, out-of-shear zone feel the
same normal traction. Because an equal traction occurs on both the localized and

76
passive zone, the entire layer is available to compact, with the possibility of a
difference in compaction between the active and passive zones of the layer. During a
velocity increase, grains in the active zone must move around each other to allow for
shear, while the out-of-shear material is not affected by the change in driving
velocity. This movement results in the macroscopic dilation observed in experiments.
With the case of a localized shear zone, we expect that dilation will be smaller than
compaction because only the localized zone can dilate but the entire layer can
compact. For the factor of three steps the layer compacts slightly more than it dilates
after a velocity step (Figure 3.6). When the step size is increased to 30x the separation
between dilation and compaction widens (Figure 3.7). The difference between
dilation and compaction suggests differences in the micromechanics of the layer
during each of the directional changes in velocity. During dilation, only the active
portion of the layer needs to dilate as a result of the velocity change. This is in
contrast to the velocity decreases and compaction when the entire layer is available to
change in width.
The velocity stepping experiments show two-state behavior with dilatancy
controlling one length scale and the evolution of frictional contacts controlling the
other. In the case of comparing velocity increases and decreases, the combination of
dilatancy and contact evolution work to produce an asymmetry in the frictional
response. This asymmetry is not predicted by either the Ruina slip law, which
predicts symmetry, or the Dieterich aging law, which predicts asymmetry opposite
that of our experiments.

77
The idea that layer effects obscure the traditional RSF laws is supported by
experiments in which normal stress was oscillated. Performing these normal stress
oscillations reduced porosity and compacted our layer. After the oscillations the
dilation decreased and the critical slip distance required to reestablish steady sliding
friction shortened. Both the displacement needed to establish steady friction (Figure
3.10c) and the dilation associated with a velocity step (Figure 3.10b) decreased by
approximately a factor of two after normal stress oscillations.
The decrease in both Dc and a is consistent with a decreasing shear zone
thickness after the stress oscillations. A thicker active shear zone and more distributed
deformation promotes a larger a as more bonds need to be broken after the velocity
perturbation. The evolution of the Dc also points to an increase to the degree of
localization after the stress oscillations. Marone and Kilgore [1993] showed that Dc
can be correlated to shear zone thickness. In our experiments Dc decreases by ~2x as
a result of compacting the macroscopic layer. This reduction in Dc suggests that the
shear zone becomes more localized as the result of the normal stress vibrations. This
enhanced localization decreases both the direct effect and critical slip distance.
The slip required to reach steady driving friction (i.e. Figure 3.4) can be
understood in terms of shear zone thickness. In granular materials shear localizes into
discrete zones several to ~20 particles thick [e.g. Muhlhaus and Vardoulakis, 1987;
Tordesillas et al., 2005; Rathbun and Marone, 2010]. The length of Dc has been
shown to correlate with the thickness of the active shear zone of a material [Marone
and Kilgore, 1993]. We propose a model in which slight changes in the active shear
zone overrides the expectations of the evolution laws.

78
During a velocity increase the layer initially dilates (Figure 3.6, 3.7). This
dilation slightly decreases the contact area, Ar, between particles in the granular shear
zone. Each particle contact is likely velocity weakening [Marone et al., 1990], which
promotes shear to further localize. Initial dilatancy leads to a localized system and a
more rapid evolution to steady friction. After a velocity decrease the layer compacts
(Figure 3.6, 3.7) increasing the contact area of particles in the active zone leading to
grain strengthening and locking. The growth of Ar between particles dominates the
system and the central portion of the sample is no longer the weakest area.
Compaction increases the sliding friction of the system by increasing Ar. Because
contacts need to be evolved, Dc lengthens in the velocity decrease. In granite block
experiments, with no variation in shear zone thickness, we see no observable dilation
or compaction and the expected RSF response occurs. Dilation leads to a narrowing
of an active zone by the reduction of Ar and localization while compaction leads to
thickening of the shear zone by increasing Ar, between grains and widening the shear
zone.
3.4.3 Two-State Behavior
The large velocity increases show two distinct length scales to reach steady
state (Figure 3.5). Velocity increases have a pronounced, sharp, frictional peak that
decays toward a steady state, and then incorporates another length scale for both F110
quartz and till. Two-state behavior is not uncommon and has been noted by many
investigators [e.g. Tullis and Weeks, 1986; Cox, 1990; Marone and Cox, 1994;
Blanpied et al., 1998]. Cox [1990] argued that two-state behavior was caused by a

79
longer Dc related to structure in the gouge zone while the shorter Dc was related to the
evolution of surface properties. Marone and Cox [1994] conducted experiments on
bare surfaces of gabbro with varying surface roughness. They found that the second
Dc disappeared with increasing displacement. This led Marone and Cox [1994] to
conclude that their Dc2 was a surface effect and that Dc1 was a property of the gouge.
They concluded that Dc in granular experiments could be thought of as the
accumulation of several Dc from grain-to-grain interaction [i.e. Marone and Kilgore,
1993].
In our experiments we observe a difference in the compaction/dilation of the
layer associated with velocity steps, which we argue is the result of localization.
Caesar till has been shown to localize shear into a finite boundary-parallel zone
[Rathbun and Marone, 2010], whereas F110 quartz is well known to localize shear
onto Y and R shears [Mair and Marone, 2000]. We infer that the two-state behavior
observed is the result of changes in the micromechanics of the localized shear zone.
During velocity increases, the first length scale is associated with grain-to-grain
contacts and frictional evolution and the second with a length to dilate the localized
shear zone. It seems likely that a length scale to dilate the layer is present in steps of
all sizes; however, that Dc is only observed when the step size increases to a large
enough magnitude.
The large velocity increases also highlight the asymmetry in friction
evolution. In contrast to the break in the evolution to steady state for velocity
increases, velocity decreases show a smooth transition to steady state. This behavior
agrees with changes in the localized zone, as the result of dilation, controlling the

80
friction evolution. The first length scale for state evolution suggests a shorter
displacement to steady state for the velocity increases vs. the decreases until the
second state evolution dominates. This behavior matches with the Dieterich
formulation of the state evolution law until the second length scale dominates.
3.4.4 Implications for the Stability of Fault Zones
Fault zone stability is often thought of in terms of critical stiffness. The fault
is unstable when a critical stiffness exceeds the loading stiffness [Rice and Ruina,
1983],
!
k < kc
=(b " a)#
n
Dc
[1+mV
2
#naD
c
] (5)
where a, b and Dc are the RSF parameters, m is the mass per unit area and V is
velocity. The first term is sufficiently large that the second-order term is often
ignored, yielding:
!
k < kc
=(b " a)#
n
Dc
. (6)
In this formulation the RSF parameters a, b, Dc and the normal stress, "n, define a
critical stiffness, kc. When the critical stiffness exceeds the stiffness of the laboratory
apparatus and sample or the stiffness of the crustal rocks in natural systems,
conditions are sufficient for earthquakes to occur.
In experiments where shear is stopped and normal stress is oscillated, both a
and Dc decrease after the vibrations leading to a more unstable fault zone. It is a
necessary, but insufficient condition that the (b-a) term in Equation 5 is positive, the
velocity weakening condition, for an earthquake to occur. A decrease in the peak

81
friction as shown in Figure 3.10, yields a larger term for (b-a) and could transition a
material from velocity strengthening to velocity weakening.
The decrease in Dc promotes seismic behavior in the fault zone. It should be
assumed that seismogenic fault zones are already velocity weakening, satisfying the
necessary conditions of Equation 5. The reduction of Dc promotes unstable slip and
the possibility of the occurrence of an earthquake by increasing the critical stiffness,
kc, of the fault zone. It is possible that this grain rearrangement may be a mechanism
for earthquake triggering.
3.5.CONCLUSIONS
We find that in velocity stepping experiments on three unique granular
materials that the Ruina slip law better approximates our data than the Dieterich aging
law. We show that on velocity-strengthening glacial till, weakening fine-grained
quartz and F110 quartz which transitions from strengthening to weakening that an
asymmetry between velocity increases and decreases can occur. Experiments on bare
surfaces of Westerly granite blocks produce a symmetric or near symmetric response
for both velocity increases and decreases. The asymmetry we observe is not predicted
by either of the commonly used laws. We propose a new conceptual model based on
the micromechanics of the granular shear zone to explain this asymmetry. An
additional suite of experiments was conducted in which normal stress was oscillated
in between two series of standard velocity steps. We find that both the critical slip
distance and the direct effect decrease as a result of these oscillations supporting a
model in which shear localization in an active zone controls the frictional response.

82
Shear localization also works to produce two distinct length scales for frictional
evolution, causing two-state behavior in our experiments. Localization produces a
smaller critical slip distance, which enhances the likelihood of seismic slip.
3.6. ACKOWLEDGEMENTS
Grain size characterization was conducted at the Materials Characterization Lab
(MCL) at Penn State University. This work benefited from comments by Bryan
Kaproth.
REFERENCES
Ampuero, J.-P. and A. M. Rubin (2008), Earthquake nucleation on rate-and-state
faults: aging and slip laws, J. Geophys. Res. 113, B01302,
doi:10.1029/2007JB005082.
Ampuero, J.-P., J.-P. Vilotte and F.-J. Sánches-Sesma (2002), Nucleation of rupture
under slip dependent friction law: simple models of fault zone, J. Geophys. Res.
107(B12), doi:10.1029/2001JB000452.
Beeler, N. M., and T. E. Tullis (1996), Self-healing slip pulses in dynamic rupture
models due to velocity dependent strength, Bull. Seismol. Soc. Am. 86, 1130-
1148.
Beeler, N. M., T. E. Tullis, M. L. Blanpied, and J. D. Weeks (1996), Frictional
behavior of large displacement experimental faults, J. Geophys. Res. 101, B4,
8697-8715.
Bos, B., C. J. Peach and C. J. Spiers (2000), Slip behavior of simulated gouge-bearing
faults under conditions favoring pressure solution, J. Geophys. Res. 105, 16669-
16718.
Blanpied, M.L., C. Marone, D. A. Lockner, J. D. Byerlee, and D. P. King (1998),
Quantitative measure of the variation in fault rheology due to fluid-rock
interactions, J. Geophys. Res. 103, 9691-9712.

83
Cashman, S.M., and K.V. Cashman (2000), Cataclasis and deformation-band
formation in unconsolidated marine terrace sand, Humboldt County, California,
Geology 28, 111–114.
Cashman, S.M., J. N. Baldwin, K. V. Casman, K. Swanson, and R. Crawford (2007),
Microstructures developed by coseismic and aseismic faulting in near-surface
sediments, San Andreas fault, California, Geology 35, 611–614.
Chester, F. M., and J. S. Chester (1998), Ultracataclasite structure and friction
processes of the Punchbowl fault, San Andreas system, California,
Tectonophys. 295, 199-221.
Dieterich, J. H. (1979), Modeling of rock friction: 1. Experimental results and
constitutive equations. J. Geophys. Res. 84, B5, 2161-2168.
Dieterich, J.H. (1981), Constitutive properties of faults with simulated gouge, in
Mechanical Behavior of Crustal Rocks, Geophys. Mono. Ser. 24 edited by N.L.
Carter, M. Friedman, J.M. Logan, and D.W. Stearns, pp. 103-120, AGU,
Washington DC.
Dieterich, J.H., and Kilgore, B. (1994), Direct observation of frictional contacts –
new insights for state-dependent properties, Pure Appl. Geophys. 143, 283-302.
Faulkner, D. R., A. C. Lewis, and E. H. Rutter (2003), On the internal structure and
mechanics of large strike-slip fault zones: field observations of the Carboneras
fault in southeastern Spain, Tectonophys. 367, 235-251.
Gu, J.C., J.R. Rice, A.L. Ruina, and S.T. Tse (1984), Slip motion and stability of a
single degree of freedom elastic ssystem with rate and state dependant friction,
J. Mech. Phys. Solids, 32, 167-196.
Hayman, N. W., B. A. Housen, T. T. Cladouhos, and K. Livi (2004), Magnetic and
clast fabrics as measurements of grain-scale processes within the Death Valley
shallow crustal detachment faults, J. Geophys. Res. 109(B05409).
Heaton, T.H (1990), Evidence for and implications of self-healing pulses of slip in
earthquake rupture, phys. Earth Planet Inter. 64, 1-20.
Lapusta, N. and J. R. Rice (2003), Nucleation and early seismic propagation of small
and large events in a crustal earthquake model, J. Geophys. Res. 108(B4), 2205,
doi:10.1029/2001JB000793.
Linker, M. F. and J. H. Dieterich (1992), Effects of variable normal stress on rock
friction: Observations and constitutive equations, J. Geophys. Res., 97, 4923-
4940.
Logan, J. M., M. Friedman, N. Higgs, C. Dengo, and T. Shimamodo (1979),
Experimental studies of simulated fault gouges and their application to studies
of natural fault zones, in Analysis of Actual Fault Zones in Bedrock, US Geol.
Surv. Open File Rep., 1239, 305-343.
Niemeijer, A. C. Marone and D. Elsworth (2008), Healing of simulated fault gouges
aided by pressure solution: results from rock analog experiments, J. Geophys.
Res., 113, B04204, doi:1029/2007JB005376.

84
Mair, K. and J. F. Hazzard (2007), Nature of stress accommodation in sheared
granular material: insights from 3D numerical modeling, Earth Planet. Sci. Lett.
30, 469-485, doi:10.1016/j.epsl.2007.05.006.
Mair, K., and C. Marone (1999), Friction of simulated fault gouge for a wide range of
velocities and normal stress, J. Geophys. Res., 104(B12), 28,899-28,914.
Marone, C. (1998), Laboratory-derived friction constitutive laws and their application
to seismic faulting, Ann. Rev. Earth Planet. Sci., 26, 643-696.
Marone, C. and B. Kilgore (1993), Scaling of the critical slip distance for seismic
faulting with shear strain in fault zones, Nature 362, 618-622.
Marone, C., C. B. Raleigh, and C. H. Scholz (1990), Frictional behavior and
constitutive modeling of simulated fault gouge, J. Geophys. Res., 95(B5), 7007-
7025.
Muhlhaus, H.B. and I. Vardoulakis (1987), Thickness of shear bands in granular
materials, Geotechnique, 37(3), 271-283.
Rabinowicz, E. (1958), The intrinsic variables affecting the stick-slip process, Proc.
Phys. Soc London, 71, 668-675.
Rathbun, A. P., C. Marone, R. B. Alley, and S. Anandakrishnan (2008), Laboratory
study of the frictional rheology of sheared till, J. Geophys. Res, 113, F02020,
doi:10.1029/2007JF000815.
Rathbun, A. P., and C. Marone, (2010), Effect of strain localization on frictional
behavior of granular materials, J. Geophys. Res, 115, B01204,
doi:10.1029/2009JB006466.
Rice, J. R., N. Lapusta, and K. Ranjith (2001), Rate and state dependent friction and
the stability of sliding between elastically deformable solids, J. Mech. Phys.
Solids 49m 1865-1898.
Rubin, A. M. and J.-P. Ampuero (2005), Earthquake nucleation on (aging) rate-and-
state faults, J. Geophys. Res. 110, B11312, doi:10.1029/2005JB003686.
Ruina, A. (1983), Slip instability and state variable friction laws, J. Geophys. Res.,
88, 10359-10370.
Scholz, C. H. (2002), The Mechanics of Earthquakes and Faulting, Second Edition,
Cambridge University Press, Cambridge.
Scott, D., C. Marone, and C. Sammis (1994), The apparent friction of granular fault
gouge in sheared layers, J. Geophys. Res. 99(B4), 7231-7247.
Sibson, R. H. (2003), Thickness of the seismic slip zone, Bull. Seism. Soc. Am. 93(3),
1169-1178.
Sleep, N. H. (2005), Physical basis of evolution laws for rate and state friction,
Geochem, Geophys. Geosyst.,6, Q11008, doi:10.1029/2005GC000991.
Tordesillas, A., J. F. Peters and B. S. Gardiner (2004), Shear band evolution and
accumulated microstructural development in Cosserat media, Int. J. Num. Anal.
Methods Geomech. 28, 981-1010, doi:10.1002/nag.343.
Ziv, A., and A.M. Rubin (2003), Implications of rate-and-state friction for properties
of aftershock sequences: Quasi-static inherently discrete simulations, J.
Geophys. Res., 108, B1, doi:10.1029/2001JB001219.

85
Zoback, M., S. Hickman and W. Ellsworth (2010), Scientific drilling into the San
Andreas fault zone, EOS Trans. AGU 91(22), 197-199.

86
Experiment Condition Material
Layer
Thickness
!m
Normal
Stress MPa
p1345 Sat C. Till 10 1
p1507 Sat C. Till 10 1
p1968 Dry F110 Quartz 1
p1969 Dry F110 Quartz 1
p1970 Dry F.G. Quartz 1
p1971 Sat F110 Quartz 1
p2064 Dry F110 Quartz 10 1
p2065 Dry F110 Quartz 3 1
p2410 Dry F110 Quartz 10 25
p2411 Dry F110 Quartz 10 25
p2412 Dry F110 Quartz 10 1
p2413 Dry F.G. Quartz 10 25
p2414 Dry F110 Quartz 10 1
p2415 Dry F110 Quartz 10 25
p2416 Dry F110 Quartz 10 1
p2443 Dry F.G. Quartz 10 1
p2444 Dry F.G. Quartz 10 1
p2445 Dry F110 Quartz 10 1
p2447 Dry C. Till 10 25
p2636 Dry F110 Quartz 10
25-35
8 cycles
p2637 Dry F110 Quartz 10 35
p2638 Dry
Granite
Blocks 0 5
p2645 Dry F110 Quartz 7 25
p2646 Dry
Granite
Blocks 0 5
p2647 Dry F110 Quartz 3 25
p2648 Dry F110 Quartz 10
25-15
64 cycles
p2649 Dry F110 Quartz 10 25
p2650 Dry F110 Quartz 10 25
Table 3.1 Experiment table.

87
Figure 3.1. Synthetic velocity steps for the Dieterich law (a) and Ruina law (b). Four
velocity increases (black) and four decreases (red) occur at displacement equal to 0,
between 10-30 !m/s. Velocity decreases are flipped and presented as mirror images
for comparison to increases (green). Rate and state parameters are a = b = 0.007, and
Dc = 30 !m. Elastic loading stiffnesses are 0.004 !m-1
, 0.0005 !m-1
, the stiffness of
our experiments, 0.001 !m-1
and a theoretical infinitely stiff case. The infinitely stiff
case is dashed to highlight the identical behavior pre-peak of increases and decreases
and evolution in (b).

88
Figure 3.2. Grain size distribution of the three granular materials used in this study.
Grain size is determined via the laser absorption method for F110 and fine-grained
quartz samples. Caesar till is sieved to 0.064mm then measured via laser absorption.

89
Figure 3.3. Friction-displacement curve for an entire experiment. Normal stress, "n,
is held constant horizontally (bottom right) with a constant shear velocity applied at
the top of the three block arrangement. Shearing velocity was stepped between values
indicated on the top of the figure. Velocity steps begin at the initiation of shear with
each step last 450 !m. Rate and state friction parameters are given in the inset.

90
Figure 3.4. Velocity increases
(black) decreases (red), and
mirrored decreases (green) for
F110 quartz (a), Caesar till (b)
and fine-grained quartz (c). For
each panel, n corresponds to the
number of steps. In all cases the
velocity steps were preformed
between 10 and 30 !m/s with (a)
and (b) at 25 MPa normal stress
and (c) at 1 MPa. All steps are
consecutive and offset such that
the displacement and friction
equal 0 at the point in which the
velocity step occurs. Friction is
plotted as the change from steady
state sliding friction prior to the
velocity step.
-0.01
-0.005
0
0.005
0.01
Ch
an
ge
in
Fri
ctio
n
Loadpoint Displacement
p2447C. Till
!n = 25 MPa
v = 10-30 !m/s
Velocity Increase, n=5Velocity Decrease, n=5
Mirrored Velocity Decrease, n=5
100 !m
b
-0.005
0
0.005C
ha
ng
e in
Fri
ctio
n
Loadpoint Displacement
p2647F110
!n = 25 MPa
v = 10-30 !m/s
Velocity Increase, n=5Velocity Decrease, n=5
Mirrored Velocity Decrease, n=5
50 !m
a
-0.01
-0.005
0
0.005
0.01
Ch
an
ge
in
Fri
ctio
n
Loadpoint Displacement
p2444Fine-grained Quartz
!n = 1 MPa
v = 10-30 !m/s
Velocity Increase, n=5Velocity Decrease, n=5
Mirrored Velocity Decrease, n=5
20 !m
c

91
Figure 3.5. Ten consecutive velocity steps between 10-300 !m/s for each of F110
quartz (a) and Caesar till (b). In both panels, velocity increases are shown in black,
decreases in red and decreases are mirrored in green. In both experiments the normal
stress was 25 MPa. For each panel, n corresponds to the number of steps.

92
Figure 3.6. Change in layer
thickness as a result of a
velocity increase (black) or
decrease (red) with the
decreases mirrored (green).
Upon a velocity increase the
layer dilates, a positive
change in thickness, and
after a decrease the layer
compacts. The legend in
panel (a) applies to all three
panels, with 5 consecutive
steps of increases and
decreases presented with all
steps between 10-30 !m. (a)
F110 quartz at 25 MPa
normal stress, (b) Caesar till
at 25 MPa (c) fine-grained
quartz at 1 MPa.
-2
-1
0
1
2
3
Ch
an
ge
in
La
ye
r T
hic
kn
ess (!
m)
Loadpoint Displacement
p2415F110
!n = 25 MPa
v = 10-30 !m/s
Vel. Increase, n=5Vel. Decrease, n=5
Mirrored Vel. Decrease, n=5
50 !m
a
-3
-2
-1
0
1
2
3
Ch
an
ge
in
La
ye
r T
hic
kn
ess (!
m)
Loadpoint Displacement
50 !m
p2447C Till
!n = 25 MPa
v = 10-30 !m/s
b
-1
0
1
2
Ch
an
ge
in
La
ye
r T
hic
kn
ess (!
m)
Loadpoint Displacement
p2444Fine-grained Quartz
!n = 1 MPa
v = 10-30 !m/s
20 !m
c

93
Figure 3.7. Change in layer thickness for velocity steps between 10-300 !m/s in
F110 quartz (a) and Caesar till (b) with the layer thickness changes corresponding to
the velocity steps presented in Figure 3.5.

94
Figure 3.8. Comparison of order of magnitude velocity increases and decreases for
two experiments on bare Westerly granite surfaces. Normal stress was 5 MPa in both
experiments. In experiment p2638 (a) the drop in friction at ~10 !m displacement is
related to untable behavior. In both panels n corresponds to the number of velocity
steps.

95
Figure 3.9. Stress oscillations in experiment p2648. (a) Velocity steps are conducted
at a constant normal stress of 25 MPa before and after normal stress oscillations.
Shear stress is removed after ~13 mm of displacement and normal stress is oscillated
(b) at a constant rate between 25 and 15 MPa for 64 cycles. Normal stress is then held
constant during velocity steps. (c) Layer thickness change as a result of layer
compaction during the stress oscillations.

96
Figure 3.10. Velocity steps before
and after normal stress oscillations.
Velocity is increased from 10 to 30
!m/s, (a) Five steps (n) immediately
preceeding (thin black lines)
following (thin blue) the
oscillations. Oscillations work to
decrease the peak friction and
decrease the length to a new steady
sliding friction. (b) The velocity
steps presented in (a) along with
forward models for the RSF
parameters (bold lines) using one
state variable. Parameters for the
reference models are a = 0.0073, b
= 0.00625 (a-b = 0.00105) and Dc =
36 !m and a = 0.0075, b = 0.007 (a-
b = 0.0005) and Dc = 16 !m for
before and after normal stress
oscillations, respectively. (c)
Change in layer thickness
associated with the velocity steps
presented in (a, b).
0
0.002
0.004
0.006
Ch
an
ge
in
Fri
ctio
n
Loadpoint Displacement
p2648F110 Quartz
!n = 25 MPa
v = 10-30 !m/s
Velocity Increase, n=5Before Stress Cycles
Velocity Increase, n=5After Stress Cycles
100 !m
a
0
0.002
0.004
0.006
Ch
an
ge
in
Fri
ctio
n
Loadpoint Displacement
p2648F110 Quartz
!n = 25 MPa
v = 10-30 !m/s
20 !m
b
-0.5
0
0.5
1
1.5
2
2.5
3
Ch
an
ge
in
La
ye
r T
hic
kn
ess (!
m)
Loadpoint Displacement
p2648F110 Quartz
!n = 25 MPa
v = 10-30 !m/s
Velocity Increase, n=5Before Stress Cycles
Velocity Increase, n=5After Stress Cycles20 !m
b

97
Chapter 4. A NEW MECHANISM FOR SLOW-SLIP
Andrew P. Rathbun1, 2
Chris Marone1, 2
1Department of Geosciences, Penn State University, University Park, PA 16802
2Penn State Sediment and Rock Mechanics Laboratory

98
ABSTRACT
Slow-slip and earthquakes have been documented in both strike-slip and
subduction zone faults around the world [Rogers & Dragert, 2003; Obara, 2002;
Shelly et al. 2010; Delahaye, 2008], yet the understanding of the slow-slip
mechanisms is incomplete. Elevated pore-fluid conditions and dilatancy coupled
with rate and state friction are usually invoked to explain slow-slip [Rubin, 2008;
Segall et al. in press] and the arrest of fast glacial slip [Moore & Iverson, 2002].
We show that slow-slip can be produced in laboratory shear experiments with a
duration ranging from 1s to 100’s s in configurations similar to laboratory
earthquakes in the absence of pore fluid. We compare slip, stress drop and
seismograms of these events to typical laboratory stick-slip with slip duration <
0.001 s. We find that slip velocity scales with stress drop for many materials and
that slip roughly scales with the rate and state friction parameter (a-b); for both
positive values, which are expected to slide stably and negative values, which
may stick-slip. We propose an alternative model for slow-slip where accelerating
creep rupture leads to slip rather than rate and state friction and fluid
pressurization. Our results in the creep configuration have unique implications
for glacial sliding [Moore & Iverson, 2002], landslides [Voight, 1989],
earthquake triggering, earthquake prediction [Voight, 1989] and as an
explanation of Omari’s Law [Main, 2000] versus traditional laboratory sliding
experiments.

99
Slow-slip and non-volcanic tremor have been documented in Cascadia
[Rogers & Dragert, 2003], Nankai [Obara, 2002], New Zealand [Delahaye et al.
2009], and the San Andreas Fault [Shelly et al. 2010]. Several modes of non-
impulsive slip events have been documented (we will now refer to the family of these
events as slow-slip) with magnitude scaling with duration [Ide et al. 2007]. Slow-slip
events can last from seconds to years [Ide et al, 2007] Fig. 4.1. While these events
represent up to ~M8, no theory has been able to explain all aspects of their
occurrence. Proposed models for slow-slip typically invoke fluid pressurization of the
fault zone coupled with rate and state friction [Rubin, 2008; Segall et al 2010];
however, modeling is yet to capture the rupture velocity in slow-slip.
The current understanding of brittle faulting hinges on the rate and state
friction laws [Deiterich 1978; 1979; Ruina 1981] in which a decrease in friction is
required with increased slip velocity, also known as a velocity-weakening. Stick-slip
(Fig. 4.2) may occur when both the frictional strength at the interface is exceeded by
the shear stress and the critical stiffness of the shear zone (kc) exceeds the stiffness (k)
of the loading system [Ruina, 1981, Gu et al. 1984].
!
k < kc
="(a " b)#
n
Dc
(1)
The critical stiffness is defined by the velocity dependence of friction (a-b), normal
stress "n and the critical slip distance Dc of the frictional contact area. When an
increase of driving velocity results in an increase in sliding friction (a-b is positive)
the contact is velocity-strengthening, when increased velocity results in lower friction
(a-b is negative) the contact is velocity-weakening and the nucleation of slip is
possible [Scholz, 1998; Marone, 1998].

100
We conduct standard experiments where shear rate is controlled to produce
stick-slip (Fig. 4.2) as well as constant loading stress (creep) experiments to produce
slow-slip. While creep experiments are common in soil mechanics and rock fracture
they typically involve only compression with no shear component. The slow-slip we
report on was created in the creep configuration in double-direct shear (Fig. 4.2 inset).
During the slip event (Fig. 4.3) displacement rapidly accelerates in tertiary creep, then
transitions back to primary and secondary creep, with the stress drop occurring during
the tertiary creep phase. During the slip event the material lacks sufficient strength to
support the applied shear stress, resulting in acceleration. After some time, stored
strain energy is released and stress begins to accumulate towards the imposed value.
As the transition from stress drop to stress accumulation occurs, the resulting change
in velocity produces a switch from a positive acceleration to negative acceleration.
We use four materials covering the spectrum of rate and state behavior. Till is
strongly velocity-strengthening [Rathbun et al 2008], F110 and fine-grained pure
quartz transition from velocity-strengthening at low strain to velocity-weakening at
high strain. Fine-grained quartz displayed stick-slip at normal stress > 5 MPa and
spherical glass beads stick-slip at all stress and strain conditions, which indicates
extreme velocity-weakening. Despite a wide range of friction behavior, all the
materials display the same form of slip and stress drop in slow-slip events (Fig. 4.3)
an unexpected result from rate and state friction.
The duration of the slip event scales with (a-b) for the materials (Fig. 4.3).
Events in till take 100’s s for stress to drop and recover, F110 quartz events 10’s s,
seconds in fine-grained quartz and ~1s in glass beads. The slow-slip of glass beads is

101
accompanied by audible stress drops typical of stick-slips. Traditional stick-slips in
beads (presented in Fig. 4.2) occur faster than our highest recording rate of 1000Hz
indicating a slip duration ~ 1 ks.
An accelerometer records an acceleration seismic record (Fig. 4.4). Our slow-
slip events are more impulsive with larger amplitude and shorter duration than stick-
slip. We observe a ~100x greater amplitude for the stick-slip than slow-slip event in
the acceleration seismogram. In the stick-slip a short ~0.001 s precursory release is
observed followed by most of the seismic release over another ~0.001 s, and then
another ~0.001 s of low amplitude seismic displacement. The slow-slip event is
correlated with the shear stress record by aligning the first motion in both records.
Two precursory stress drops are accompanied by seismic energy at t = 0 and t=0.1 s.
As the amplitude of the seismic record approaches the peak value, the shear stress
release accelerates. The transition to recovery begins just after the peak seismic
amplitude. The envelope of the seismic record decreases with the cessation of the
event when shear stress is recovered. The entire event lasts ~1 s with stress evolution
lasting longer than the release of seismic energy.
Stress drop size controls the slip velocity over several orders of magnitude in
our slow events (Fig. 4.5a). For approximately equal stress drops slow-slip events
achieve a slip velocity up to 2.5 mm/s, while stick-slips slip up to 45 mm/s when a
duration of 0.001s is assumed. These velocities are in line with other published
durations and velocities in laboratory experiments [Okubo & Dieterich, 1981]. All
materials follow the same trend, indicating that this process is controlled by an
alternative factor than material properties. For stick-slips, the stress drop defines the
102
displacement of an event while slow-slip events are more scattered (Fig. 4.5b). We
find that the stored strain energy controls the slip velocity. When a large stress drop
occurs, the strength of the slipping region is far from the imposed stress of the loading
system, which results in faster motion.
Rock fracture has been described in terms of constant stress rupture [Reches
& Lockner, 1994; Lockner, 1998; Main 2000]. In these models, the components of
creep are described as the interplay of distributed tensional microcracking in primary
creep and the coalescence of microcracks into a plane during tertiary creep with the
two processes approximately balanced during secondary creep. In a granular material
this same process can be thought of as the failure of grain-to-grain contacts. During
shear, bonds break and form between particles. During primary creep bond formation
dominates while in tertiary creep bond destruction dominates [Mitchell & Soga,
2005]. Locker, 1998 presents a model for rock failure in creep similar in form as rate
and state friction, albeit with no form of healing, which is required for repeated
events. We propose that slow-slip events in the laboratory can be thought of as the
release of elastic strain energy stored at frictionally governed contacts. These contacts
fail throughout the layer yielding primary and secondary creep until they coalesce at a
localized area leading to tertiary creep. Once tertiary creep relieves the critically
stressed contacts, slip transitions back to the stable phase.
We show that in laboratory experiments slow-slip and stick-slip can be
propagated spontaneously under simple conditions. As with natural events, slip
duration for out slow-slip lasts several orders of magnitude longer and contains more
relative energy at low frequency. These events occur in both velocity-strengthening

103
and weakening materials, which is inconsistent of the predictions of earthquake
propagation from rate and state friction and dilatant hardening. Events in glacial till
occur in both the presence and absence of pore fluid and all other experiments are
conducted with no fluids.
Methods
Experiments are conducted in the double-direct shear configuration with two
granular shear layers sandwiched between three grooved steel forcing blocks (Fig. 4.2
inset). Normal and shear tractions are applied via two servo-hydraulic rams with
normal stress held constant (horizontal ram) and shear velocity controlled to produce
stick-slip or shear stress controlled to produce slow-slip. In all cases the nominal
frictional contact area is kept constant at 10cm x 10cm with initial layer thicknesses
of 1cm, normal stress is held constant at 1 MPa to prevent grain breaking and
associated effects. All experiments on glass beads and quartz are conducted at room
humidity while experiments on till were conducted in either drained saturated
conditions or at room humidity. A Brüel & Kjaer type 4393 accelerometer is attached
to side of the center block (in and out of the paper Fig. 4.2 inset) in all experiments
except for p2774 in which it is placed on the top of one side block.
Forces are measured via BeCu load cells to a resolution better than 0.1 kN,
and displacement is measured on each loading ram to a precision better than 0.1 !m.
Stresses and displacements are recorded at 10 kHz and averaged to a 10-1000Hz
depending on the experiment and slip duration. The accelerometer has a frequency
range of 0.1Hz to 16.5 kHz and is recorded at 1 MHz.

104
Creep experiments were conducted by first running a constant shear
displacement rate to measure the frictional strength and subsequently the machine
was switched to a constant shear force [Rathbun et al. 2008, Rathbun and Marone
2010]. Shear stress was then stepped until reaching ~90-105% of the frictional
strength. Tertiary, accelerating creep occurs at either the completion of the stress step
or during the stress hold. In experiments on glass beads we often obtain more than 15
slip events at the same shear stress. Caesar till is obtained from the former Scioto lobe
of the Lauerentide ice sheet, Columbus Ohio, F110 and Min-U-Sil 40 pure quartz
samples were obtained from the US Silica Company, Ottawa, Illinois and soda-lime
glass beads from Mo-Sci Corporation, Rolla Missouri. Grain size distributions are
presented as supplementary Figure S1.
Acknowledgments
We thank Matt Knuth for assistance with recording and Mike Cleveland with help
processing seismic signals. Grain size measurements were conducted in the Materials
Characterization Lab (MCL) at Penn State University. This paper benefited from
comments by Luke Zoet.
References
1. Brace, W.F. & Byerlee, J.D. Stick-slip as a mechanism for earthquakes.
Science 153, 990-992 (1966).
2. Brodsky, E. E. and Mori, J. Creep events slip less than ordinary earthquakes,
Geophys Res. Lett. 34, L16309 (2007).
3. Delahaye, E.J., Townend, J., Reyners, M.E., & Rogers, G. Microseismicity
but no tremor accompanying slow-slip in the Hikurangi subduction zone, New
Zealand. Earth. Planet. Sci. Lett. 277, 21-28 doi:10.1016/j.epsl.2008.09.038
(2008).
105
4. Dieterich, J. H. Modeling of rock friction: 1. Experimental results and
constitutive equations. J. Geophys. Res. 84, B5, 2161-2168 (1979).
5. Dieterich, J.H. Constitutive properties of faults with simulated gouge, in
Mechanical Behavior of Crustal Rocks, Geophys. Mono. Ser. 24 edited by
N.L. Carter, M. Friedman, J.M. Logan, and D.W. Stearns, pp. 103-120, AGU,
Washington DC (1981).
6. Gu, J.C., Rice, J.R., Ruina, A.L. & Tse, S.T. Slip motion and stability of a
single degree of freedom elastic system with rate and state dependent friction.
J. Mech. Phys. Solids 32, 167-196 (1984).
7. Ide, S., Beroza, G.C., Shelly, D.R., & Uchide, T. A scaling law for slow
earthquakes. Nature 447, 76-79, doi:10.1038/nature05780 (2007).
8. Ide, S., Shelly, D.R., & Beroza, G.C. Mechanism of deep low frequency
earthquakes: Further evidence that deep non-volcanic tremor is generated by
shear slip on a plane interface. Geophys. Res. Let. 34, L03308
doi:10.1029/2006GL028890 (2007).
9. Kodaira, S. Iidaka, T., Kato, A., Park, J.-O., Iwassaki, T., & Kaneda, Y. High
pore pressure may cause silent slip in the Nankai Trough. Science, 304, 1295-
1298 doi:10.1126/science1096535.
10. Lockner, D.A. A generalized law for brittle deformation of Westerly granite.
J. Geophys. Res. 103, B3, 5107-5123 (1998).
11. Main, I.G. A damage mechanics model for power-law creep and earthquake
aftershock and foreshock sequences. Geophys. J. Int. 142 151-161 (2000)
12. Marone, C. Laboratory-derived friction constitutive laws and their application
to seismic faulting. Ann. Rev. Earth Planet. Sci., 26, 643-696 (2008).
13. Moore, P.L. & Iverson, N. R. Slow episodic shear of granular materials
regulated by dilatant strengthening. Geology 30, 9, 843-846 (2002).
14. Mitchell, J.K & Soga, K. Fundamentals of Soil Behavior, Third Ed. John
Wiley and Sons, Inc. Hoboken.
15. Obara, K. Nonvolcanic deep tremor associated with subduction in southwest
Japan. Science, 296, 1679-1681, doi:10.1126/science.1070378 (2002).
16. Okubo, P. G. & Dieterich, J.H. Fracture energy of stick-slip events in large
scale biaxial experiment. Geophys. Res. Lett. 8, 8, 887-890 (1981).
17. Nadeau, R.M. & Dolenc, D. Nonvolcanic tremors deep beneath the San
Andreas Fault. Science 307, 389, 305 (2008)
18. Peng, Z. & Gomberg, J. An integrated perspective of the continuum between
earthquakes and slow-slip phenomena, Nat. Geosc. 3, doi:10.1038/NGEO940
(2010).
19. Rathbun, A. P., Marone, C., Alley, R.B. & Anandakrishnan, S. Laboratory
study of the frictional rheology of sheared till. J. Geophys. Res, 113, F02020,
doi:10.1029/2007JF000815 0(2008).
20. Rathbun, A. P., & Marone, C. Effect of strain localization on frictional
behavior of granular materials. J. Geophys. Res, 115, B01204,
doi:10.1029/2009JB006466 (2010).
21. Rogers, G. & Dragert, H. Episodic tremor and slip on the Cascadia subduction
zone: The chatter of silent slip, Science, 300, 1942-1943 (2003).

106
22. Reches, Z & Lockner, D.L. Nucleation and growth of faults in brittle rocks. J.
Geophys. Res. 99 18,159-18,173 (1994).
23. Rubin, A.M. Episodic slow-slip events and rate-and-state friction. J. Geophys.
Res. 113 B11414 (2008).
24. Ruina, A. Slip instability and state variable friction laws. J. Geophys. Res., 88,
10359-10370 (1981).
25. Scholz, C. Earthquakes and friction laws. Nature 391, 37-41 (1998).
26. Segall, P. Rubin, A.M. Bradley, A. M. Rice, J.R. (in press). Dilatant
strengthening as a mechanism for slow slip events. J. Geophys Res.
27. Shelly, D.R. Migrating tremors illuminate complex deformation beneath the
seismogenic San Andreas Fault. Nature 463, 648-653 (2010).
28. Voight, B. A relation to describe rate-dependent material failure. Science 243,
200-203 (1989).
29. Voisin, C., Grasso, J.-R. Larose, E. & F. Renard. Evolution of seismic signals
and slip patterns along subduction zones: Insights from a friction lab scale
experiment, Geophys Res. Lett. 35 L08302 (2008).

107
Experiment Material
Layer
Thickness(mm)
Norm.
Stress
(MPa)
p757 C. Till (Dry) 10 1
p758
C. Till
(Saturated) 10 1
p761 C. Till (Dry) 10 1
p2748
Fine-grained
quartz 10 1
p2749 Beads 10 1
p2758 Beads 10 1
p2771 Beads 10 1
p2772 Beads 10 1
p2773 Beads 10 1
p2774 Beads 10 1
p2823 F110 10 1
p2824 F110 10 1
p2910
Fine-grained
quartz 10 1
Table 4.1 Experiment table.

108
Figure 1. Characteristic slip duration for natural events and laboratory earthquakes,
after Ide et al. [2007]. Low frequency earthquakes (LFE), Very low frequency
earthquakes (VLF), slow-slip events (SSE) episodic tremor (ETS) and other natural
events are taken from Ide et al. [2007], laboratory stick-slip and slow-slip are from
this study.

109
Figure 2. Typical laboratory stick-slip. Normal stress ("n) is held constant and shear
velocity in controlled. Stress drop (presented as sliding friction) occurs in <0.001 s
during which time rapid slip occurs. The acceleration seismogram for this event is
presented in Fig. 4.4b. The imposed slip rate is 20 !m/s. (inset) Double-direct shear
geometry. Two granular layers are sandwiched between three steel forcing blocks.
The accelerometer is placed either on the side or the center block or top of the side
block, indicated by triangles.

110
Figure 3. Friction (!) and fault slip, presented as both displacement and strain for
four materials ranging from velocity-strengthening glacial till (a), F110 quartz which
transitions from velocity strengthening to weakening (b), fine-grained quartz which
transitions from strengthening to weakening and stick-slips at normal stress > 5 MPa
(c), glass beads which stick-slip in constant shear velocity experiments (d). During
the stress drop, slip accelerates then slows during the recovery of shear stress. Slip
duration scales with the rate and state parameter, a-b. Time, displacement and shear
strain are set to zero at the initiation of the stress drop for comparison between
materials.

111
Figure 4. Acceleration seismograms for the slow-slip (a) presented in Fig. 4.3d and
stick-slip from Fig. 4.2 (b) from experiment p2773. Both are aligned with the first
seismic energy appearing at t = 0 s. Super imposed on the slow-slip signal is the
friction-time function. Both slow-slip and stick-slip display the same shape with
different time scales for energy release. Small and precursory events are observed in
the friction and acceleration records.

112
Figure 5. (a) Maximum slip velocity and stress drop (presented as friction) define a
linear relationship for slow-slip events. Velocity is calculated as a running average of
time and displacement and likely does not capture the largest values above 2 mm/s.
The inset shows the same data on log scales for comparison with stick-slips. Velocity
is calculated on stick-slips by assuming a time of 0.001s and using the measured slip.
(b) Stick-slips define a line of slip against stress drop. Fiducial lines are fit through
the average value for each material with an intercept equal to zero.

113
S1. Grain size distribution. Till is sieved to <0.5 mm and then the laser absorption
method is used. To preserve boundary conditions and ensure shear within the layer all
grains > 1 mm are discarded. All other materials are analyzed by laser absorption.

114
S2. Complete history of experiment p2773. Initially shear displacement rate is
controlled at 20 !m/s and then the experiment is switched to shear stress control
(indicated by vertical line at t = 900 s). The thick vertical lines in shear stress
correspond to stress drops as stick-slip (n = 22) in rate control and slow-slip (n = 27)
is stress controlled portions of the experiment. Each slow-slip event is accompanied
by displacement of the fault and is seen as the step increase in displacement. The step
increases in shear stress during the stress control portion of the experiment are
increases in shear stress to near the frictional strength. The two vertical arrows
indicate the stick-slip shown as Fig. 4.2,4.4a and the slow-slip shown in Fig. 4.3d,
4.4b.

115
Chapter 5: Permeability of the San Andreas Fault at depth
Andrew P. Rathbun1, 2
Insun Song3, 2, 3
Demian M. Saffer1, 2
Chris Marone1, 2
1Department of Geosciences, Penn State University, University Park, PA 16802
2Penn State Sediment and Rock Mechanics Laboratory
3The Korea Institute of Geoscience and Mineral Resources, Daejeon 305-350, Korea.

116
ABSTRACT
Quantifying fault-rock permeability is important toward understanding both the
regional hydrologic behavior of fault zones, and poro-elastic processes that affect
fault mechanics by mediating effective stress. We conducted experiments on fault
core from ~2.7 km depth from the San Andreas Fault (SAF) collected during the
SAFOD drilling project. Experiments were conducted on the Central Deformation
Zone (CDZ) which accounts for ~90% of the casing deformation measured between
drilling phases. The CDZ is 2.6 m thick with a matrix grain size < 10 !m and ~5%
vol. clasts. Permeability experiments were conducted as constant rate of strain (CRS)
tests in uniaxial stress conditions or flow-though and constant pressure differential
experiments in isostatic conditions on sub-cores perpendicular to the CDZ. We found
that the permeability, k, of the CDZ decreases rapidly to ~1019
m2 at an effective
stress of 20 MPa. At an effective stress of 75 MPa, k ranges from 8x10-21
to 4x10-20
m2. Our results are consistent with published geochemical data from SAFOD mud gas
samples and inferred pore pressures during drilling [Zoback et al., 2010], which
together suggest that the fault is a barrier to regional fluid flow. Our results also
indicate that the permeability of the fault core is sufficiently low to result in
effectively undrained behavior during slip, thus allowing dynamic processes
including thermal pressurization and dilatancy hardening to affect slip behavior.

117
5.1. INTRODUCTION
Fluid flow and pressure in fault zones are two of the most important controls
on fault strength and plate boundary motion. For the San Andreas Fault (SAF), both
mechanical [Zoback et al., 1987; Hickman, 1991; Hickman and Zoback, 2004;
Townend and Zoback, 2004] and thermal studies [Lachenbruch and Sass, 1980;
Lachenbruch and McGarr, 1990; Fulton et al. 2004] imply that the fault is weak such
that total resolved shear stress is on the order of earthquake stress drop (~10-20MPa
or less) not the 50-100 MPa predicted by Byerlee’s Law and laboratory
measurements.
High pore pressure reducing the effective stress has been invoked to explain
the apparent weakness of many large fault zones [e.g. Hubbert and Rubey, 1959]. A
common explanation for the apparent weakness of the SAF is that elevated fluid
pressure is localized within the fault zone [Rice, 1992; Byerlee, 1990]. Fluid sources
[e.g. Irwin and Barnes, 1975; Rice, 1992], porosity loss [e.g. Sleep and Blanpied,
1992], and dynamic weakening [e.g. Segall and Rice, 1995; Andrews, 2002] have all
been presented as hypotheses for pore pressure generation. Evaluating each of these
models requires knowledge of the permeability of the fault and surrounding material.
Models of the SAF have been constructed with large regional features of fluid
and host rock properties and evaluated by sensitivity analysis [e.g. Saffer et al., 2003;
Fulton et al., 2004; Fulton and Saffer, 2009]. These studies show that pore pressure
development is highly dependent on both the permeability of the fault zone and
difference of the permeability of the fault zone to the surrounding crust [e.g. Rice,

118
1992; Byerlee, 1990; Segall and Rice, 1995; Fulton and Saffer, 2009]. To better
constrain modeling results and our understanding of the potential for pore pressure
generation to explain fault weakness it is necessary to characterize the permeability of
rocks within the crust and the fault zone.
A fault zone can act as either a fluid conduit or barrier [Caine et al., 1996].
Fault zone permeability has been established from surface samples on the Carbonaras
fault, Spain [Faulkner and Rutter, 2003], Median Tectonic Line, Japan [Wibberly and
Shimamoto, 2003], on thin fault zones from core samples on the Nojima fault, Japan
[Lockner et al., 2000], Aegion Fault gouge [Sulem et al., 2004], or from subduction
zone drilling. Wiersburg and Erzinger [2007] used 3He/
4He during San Andreas Fault
Observatory at Depth (SAFOD) drilling to conclude that the SAF was a barrier to
flow. Measurements during drilling showed no over pressure in the fault zone
[Zoback et al. 2010]. We report on laboratory experiments collected on in situ
samples of fault gouge from the SAF to quantify the observations that the SAF is low
permeability hydrologic barrier.
Gouge samples from SAFOD are unique among fault zone samples in that
they are collected from depth and at in situ conditions on a thick large displacement
fault zone. Our samples are chosen from two sections of fault gouge from the SAFOD
core in the Central Deformation Zone (CDZ) a 2.6 m thick strand of the SAF
occurring ~2.7 km below the surface. These sections are characterized by significant
casing deformation during the SAFOD project. See Zoback et al. [2010] and
references therein for a description of drilling and the samples.

119
5.2. METHODS
5.2.1 Experimental Apparatus
Experiments are conducted in either a 10,000 psi Temco triaxial core holder
or 50 kN GDS load frame with a uniaxial pressure cell (Figure 5.1.) Uniaxial
conditions are imposed as a zero radial strain boundary condition by surrounding the
sample with a rigid steel ring (Figure 5.1a). A vertical load, !v, is applied by a steel
piston at up to 50 kN. Fluid pressure is delivered to the top and bottom of the sample
by GDS pumps (Figure 5.1a). The fluid pressure is monitored at the base of the
sample during constant rate of strain tests, and in each pump during flow-through
tests.
In our triaxial experiments, axial stress, !a, is kept equal to confining pressure,
Pc, in an isostatic condition such that ! 1 = !2 = !3. The pressure is applied via an
ISCO 10,000 psi pump. The sample is jacketed with a viton rubber tube that fits over
two end caps with a 1” diameter. Pore pressure is supplied from two GDS, 3 MPa
pumps. They can be operated in tandem for flow through tests or with one pump
removed in transient permeability tests. The entire assembly is housed in a
temperature control box with control of ± 0.1°C at 30°C. The core holder can
accommodate samples from 0.75” to 3” long and 1” in diameter, corresponding to !1
= !2 = !3 ! 69 MPa.
5.2.2 Permeability Methods

120
Permeability experiments were conducted as transient pulse-decays, constant
rate of strain (CRS) and flow-through tests (as both constant flow rate and constant
pressure differential). For Interlab Comparison samples, we used deaerated, de-
ionized water, and on fault zone samples we use ddeaerated water with fluid
chemistry equivalent to the SAFOD borehole. All tests were conducted on 1”
diameter samples with lengths of 25-40 mm and 15-20 mm for triaxial and uniaxial
stress experiments, respectively.
Pulse-decay tests were preformed in the Temco triaxial core-holder at Pc’, of
5-60 MPa. Pore pressure was increased along with the isostatic stress to an initial
value of 1 MPa. Pulse sizes ranged from 0.2 to 1 MPa from either an infinite
upstream or small (~ 1.5 cm3) reservoir into a downstream reservoir ~ 1 cm
3. The
pressure was monitored both upstream and downstream. Permeability and specific
storage were calculated via curve matching [Hsieh et al., 1981]. Models of
permeability and storage are compared with the response of the downstream reservoir
with the curve that minimizes the difference between the data and the model (Figure
5.2).
Constant rate of strain and constant head permeability experiments were
conducted in the GDS uniaxial load frame. The sample is deformed at a constant rate
of displacement with the increase in pore pressure monitored [e.g. ASTM
International, 2006; Saffer and McKiernan, 2005; Skarbek and Saffer, 2009]. The
sample was allowed to back pressure for over 24 h before beginning the CRS test. An
example of one experiment is given in Figure 5.3. As strain increases, the sample
length decreases and an excess pressure builds above the background value. From the

121
strain rate, length, and excess pressure, permeability, k, can be calculated
continuously by:
!
k =" #
˙ ˙
$ # l # l0
2Ub
(1)
where " is dynamic viscosity of water at 20° C, # is strain rate, l is sample length, l0 is
initial sample length and Ub is the excess pore pressure from the ambient state.
We calculate the volumetric compressibility, mv from the ratio of change in
strain to effective stress during each increment. The coefficient of consolidation, cv,
can then be found from the relation:
!
cv
= kmv" . (2)
Constant pressure differential flow-through experiments, were conducted to
confirm measurements from the transient methods. Permeability was calculated using
Darcy’s law:
!
k = "Q
A
l
dP (3)
where Q is the flow rate and dP is pressure differential across a sample of cross
sectional area A. In all cases, multiple pressure differentials were used to minimize
error in our calculation (Figure 5.4).
5.3. INTERLAB COMPARISON
To evaluate the reliability of our measurements and provide a set of laboratory
standards, we conducted a series of experiments on samples of various permeabilities
with multiple methods. These samples represent a coordinated effort by labs around
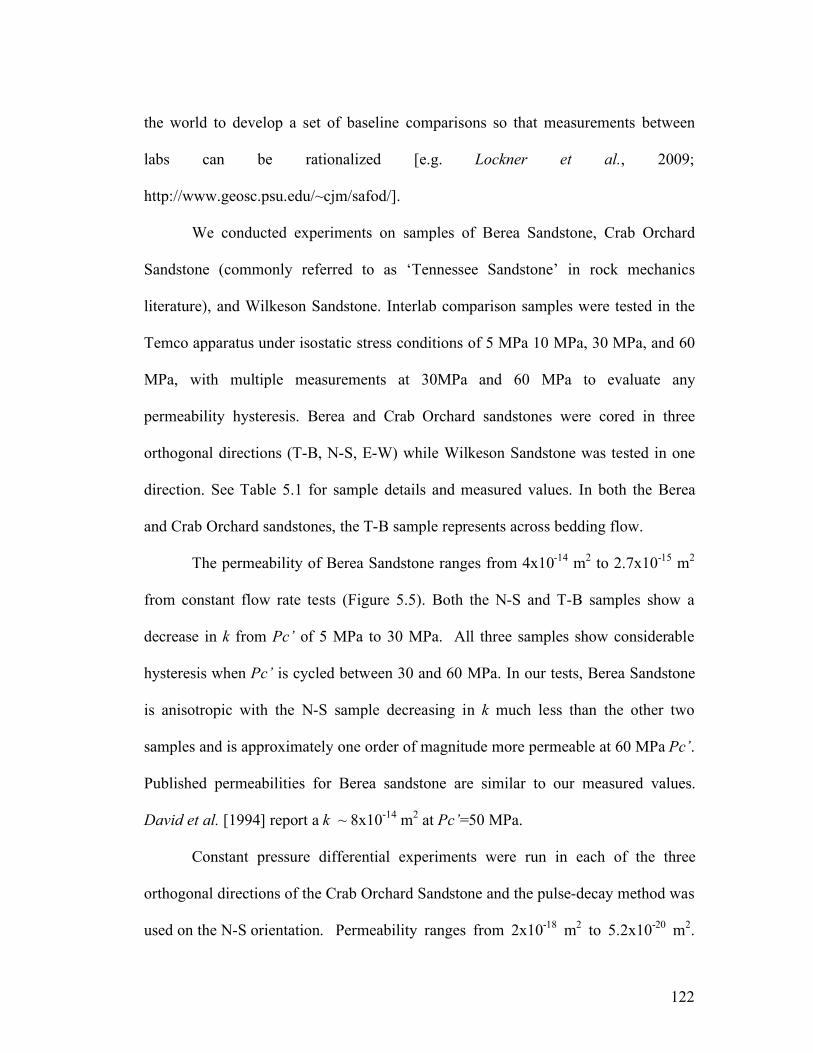
122
the world to develop a set of baseline comparisons so that measurements between
labs can be rationalized [e.g. Lockner et al., 2009;
http://www.geosc.psu.edu/~cjm/safod/].
We conducted experiments on samples of Berea Sandstone, Crab Orchard
Sandstone (commonly referred to as ‘Tennessee Sandstone’ in rock mechanics
literature), and Wilkeson Sandstone. Interlab comparison samples were tested in the
Temco apparatus under isostatic stress conditions of 5 MPa 10 MPa, 30 MPa, and 60
MPa, with multiple measurements at 30MPa and 60 MPa to evaluate any
permeability hysteresis. Berea and Crab Orchard sandstones were cored in three
orthogonal directions (T-B, N-S, E-W) while Wilkeson Sandstone was tested in one
direction. See Table 5.1 for sample details and measured values. In both the Berea
and Crab Orchard sandstones, the T-B sample represents across bedding flow.
The permeability of Berea Sandstone ranges from 4x10-14
m2 to 2.7x10
-15 m
2
from constant flow rate tests (Figure 5.5). Both the N-S and T-B samples show a
decrease in k from Pc’ of 5 MPa to 30 MPa. All three samples show considerable
hysteresis when Pc’ is cycled between 30 and 60 MPa. In our tests, Berea Sandstone
is anisotropic with the N-S sample decreasing in k much less than the other two
samples and is approximately one order of magnitude more permeable at 60 MPa Pc’.
Published permeabilities for Berea sandstone are similar to our measured values.
David et al. [1994] report a k ~ 8x10-14
m2 at Pc’=50 MPa.
Constant pressure differential experiments were run in each of the three
orthogonal directions of the Crab Orchard Sandstone and the pulse-decay method was
used on the N-S orientation. Permeability ranges from 2x10-18
m2 to 5.2x10
-20 m
2.

123
Similar to Berea Sandstone, Crab Orchard decrease in permeability with increased
Pc’ (Figure 5.6). The N-S and E-W sample decrease by about an order of magnitude
with the T-B sample displaying more stress dependence. The high stress dependence
is likely the result of the bedding in the sample and closing of permeable pathways.
Crab Orchard Sandstone shows anisotropy and hysteresis in all of the flow-through
tests. Pulse-decay tests yield a smaller permeability than flow-through at low Pc’
(Figure 5.6). When Pc’ reaches 60 MPa the results from both tests are similar.
Keaney et al. [2004] report k = 3x10-18
m2 at 20 MPa Pc’ from pulse tests while
Benson et al. [2005] report a highly anisotropic and pressure dependent permeability
for the Crab Orchard Sandstone. They find k ~ 1x10-19
m2 perpendicular to bedding
and 3x10-19
m2 with bedding. Benson et al. [2005] report a permeability anisotropy of
~100% from Pc’=5 to 90 MPa, similar to our results.
Tests on the Wilkeson Sandstone were completed in the E-W orientation and
as with the other two sandstones, considerable stress dependence is observed in k with
some hysteresis. Permeability starts at 3.3x10⁻¹⁸
m2 at Pc’ = 5 MPa and evolves to
2x10-19
m2 at a Pc’ = 60 MPa. Cycling of Pc’ shows considerable hysteresis similar to
the other sandstones.
5.4. GEOLOGIC SETTING AND SAMPLE DESCRIPTION
The SAFOD project was located in central California in the creeping section
of the SAF near Parkfield. The SAF is a ~1300 km long right lateral strike-slip fault
that is seismogenic in the southern and northern segments and aseismic in the central
portion. In the Parkfield region, the upper portion of the fault is in contact with

124
Tertiary sediments. At depth, the Pacific side is in contact with arkosic sandstone and
conglomerates while on the continental side, the Great Valley Formation is adjacent
to the fault with the Franciscian Complex further to the east (Figure 5.8a).
The SAFOD borehole is ~3km from the surface trace of the fault with the
borehole vertical until ~1.5 km and then deviates to intersect the fault perpendicular
to dip (Figure 5.8). A 200m thick damage zone containing fractured rock with low P
and S wave velocity surrounds the fault zone [Zoback et al., 2010]. Drilling
intersected two gouge zones, termed the Southwestern (SDZ) and Central
Deformation Zones (CDZ) at ~2.7 km below the surface. Both of these zones
underwent active casing deformation between October 2005 and June 2007, the time
period between Phase 2 and 3 drilling. Caliper logs indicate ~90% of the total
deformation occurred in the CDZ.
We conduct experiments on the 2.6 m thick CDZ. Our samples are from two
sections (4, 5) of the side lateral Hole G, Run 4 of Phase 3 drilling. The gouge is
foliated with a wavy-fabric, highly altered and sheared throughout with surface
striations (Figure 5.8b). The matrix is composed of particles <10 !m is diameter with
~5% porphyroclasts up to several cm in diameter. Porphyroclast lithogies are
serpentinite, very fine-grained sandstone, siltstone and white vein fragments.
5.5. PERMEABILITY OF THE SAN ANDREAS FAULT
Flow-through and CRS tests indicate that the permeability of the CDZ is low.
CRS experiments on core intervals Hole G, Run 4, section 4 and 5 and a repeat of G,
4, 4 show remarkable similarity in k. For all samples the permeability starts at ~10-17

125
m2 at Pc’ ~ 1 MPa and decreases rapidly to ~10
-19 m
2 by !v’ = 20 MPa. Below 20
MPa, k shows little to no change with increased !v’ for experiments U163 and U164
and decreases slightly in U173 (Figure 5.9). The values at low Pc’ (<5 MPa) are
likely the result of fluid pressurization during the early stages of the experiment. To
check the viability of CRS tests our values are compared to flow-through tests at low
stress. At 5 MPa Pc’, k = 2.2x10⁻¹⁹
m2 an equivalent value to the CRS test. At 10
MPa permeability is slightly lower, but similar to CRS (Figure 5.9). See Table 5.2 for
a complete list of all experiments and methods for tests on the CDZ.
The specific storage of the gouge can be calculated from
Ss = g"f(mv + #$) (4)
where g is the gravitational constant, $f fluid density, % porosity and & is the fluid
compressibility. As with k and compressibility, Ss rapidly decreases until !v’ ~ 20
MPa then remains near constant at Ss % 10-5
m -1
(Figure 5.10).
The initial low values of storage and permeability are the result of stiffening
of the sample at the onset of the experiment. At low stress and strain, Young’s
Modulus, E, changes considerably with strain (Figure 5.11). After !v’ > 20 MPa, E
remains near constant at ~1.5 GPa-1
, a typical value for sediment and mud samples.
The amount of strain required to reach !v’ = 20 MPa varies from test to test (Figure
5.11). Based on this stiffening, only values for k and Ss after a constant E has been
achieved should be used.
5.5.1 Comparison with other data

126
Our data agree with other fault studies from both surface sample and core
measurements. Helium isotope studies indicate that the SAF is a barrier to regional
fluid flow [Wiersberg and Erzinger, 2007]. Work on surface samples of the SAF in
Cienga Valley found that permeability ranged from ~10-20
to 10-21
from ~10-20 MPa
until 100 MPa and decreased to ~10-22
m2 by 200 MPa [Morrow et al., 1981].
Morrow et al. [1984] tested a variety of gouges from different portions of the SAF
with varied mineralogy ranging from serpentinite to montmorillonite-rich. They
found that permeability ranged from 10-18
m2 to 10
-21 m
2. Surface samples from other
fault zones show similar values [e.g. Faulkner and Rutter, 2003; Sulem et al., 2004].
Wibberley and Shimamoto [2003] show that the permeability and structure of the
Median Tectonic Lines is complex both in and around the fault. At it’s core the
Median Tectonic Line has k ~ 10-19
m2 increasing as much as 4 orders of magnitude
away from the fault. Experiments by Faulkner and Rutter [1998] indicate that fault
zone permeability can be highly dependent on foliation. Permeability in the direction
of foliation is 2-3 orders of magnitude larger in phyllosilicate-rich samples than
permeability across foliation. Our experiments are conducted perpendicular to the
fault zone and the wavy foliation of the gouge (Figure 5.8b).
5.5.2 Implications
The permeability of fault zones is key in constraining models of earthquake
rupture and slow slip. Thermal pressurization has been hypothesized as a mechanism
for rupture [i.e. Andrews, 2002]. Segall and Rice [2006] show for a low permeability
fault, that thermal pressurization alone is insufficient rupture propagation. Andrews

127
[2002] assumes a more permeable bulk fault zone with k = 5x10-17
m2. From these
values it is concluded that frictional heating can raise the fluid pressure and reduce
friction.
Dilantancy hardening has been invoked to explain the regulation of glacial
slip [Moore and Iverson, 2002], aseismic creep and slow-slip [e.g. Seront et al., 1998;
Rubin, 2008; Samuelson et al., 2009; Segall et al., in press]. The coupled low
permeability and large thickness of the SAF the fault zone can cause the fault to
behave essentially undrained. Permeability in the range of 10-20
to 10-21
m2
coupled
with dilation ccould depressurize the fault by as much as 50% [Samuelson et al.,
2009]. Our data show that the SAF can act undrained which allows for the possibility
of thermal weakening or dilatancy hardening. A fault zone on the order of k ~ 10-20
m2 surrounded by fractured crust would act as a barrier to fluid and affect the regional
hydrology.
5.6 CONCLUSIONS
Permeability experiments in several configurations show that the San Andreas
fault has a low permeability and would act as a regional barrier to fluid migration.
The low permeability of the Central Deformation Zone of the fault would facilitate
coupled hydro-mechanical processes such as thermal weakening and dilatancy
hardening. We also present the permeability on a suite of known samples for direct
comparison of our results with other studies. We find that the permeability of the
main strand of the SAF has a permeability of ~10-20
m2.

128
5.7 ACKNOWLEDGEMENTS
We thank Steve Swavley for technical assistance and Sam Haines for SEM images.
REFERENCES
Andrews, J. (2002), A fault constitutive relation accounting for thermal pressurization
of pore fluid, J. Geophys. Res.,107(B12), doi:10.1029/2002JB001942.
ASTM International (2006), Standard test method for one-dimensional consolidation
properties of saturated cohesive soils using controlled-strain loading (Standard
D4186-06), in Annual Book of ASTM Standards: Soil and Rock (I), vol. 04.08,
West Conshocken, PA.
Benson, P.M., P.G. Meredith, E.S. Platzman and R.E. White (2005) Pore fabric shape
anisotropy in porous sandstones and its relation to elastic wave velocity and
permeability anisotropy under hydrostatic pressure, Int. J. Rock Mech. &
Mining Sci. 42, 890-899.
Byerlee, J. (1990), Friction, overpressure and fault normal compression, J. Geophys.
Res., 17(12), 2109-2112.
Caine, J. S., J. P. Evans, C. B. Forester (1996), Fault zone architecture and
permeability structure, Geology, 24(11), 1025-1028
David, C., T.-f. Wong, W. Shu and J. Zhang (1994) Laboratory measurement o
compaction-induced permeability change in porous rocks: Implications for the
generation and maintenance of pore pressure excess in the crust, PAGEOPH
134, 425-
Faulkner, D.R and E. H. Rutter (2003), The effect of temperature, the nature of pore
fluid, and subyield differential stress on the permeability of phyllosilicate-rich
fault gouge, J. Geophys. Res 108(B5), doi:10.1029/2001/JB001581.
Fulton, P.M. and D. M. Saffer (2009), Potential role of mantle-derived fluids in
weakening the San Andreas Fault, J. Geophys. Res. 114(B07408,
doi:10.1029/2008JB006087.

129
Fulton P., D. M. Saffer, and B. A. Bekins (2004), Re-evaluation of heat flow data
near Parkfield, CA: Evidence for a weak San Andreas Fault, Geophys. Res.
Lett., 31, L15S15.
Fulton, P.M., D. M. Saffer and B. A. Bekins (2009), A critical evaluation of crustal
dehydration as the cause of a overpressured and weak An Andreas Fault, Ear.
Planet. Sci. Lett. 284, 447-454.
Hickman, S. (1991), Stress in the lithospehere and the strength of active faults, Rev.
Geophys. 29, 759-775.
Hickman, S. and M. Zoback (2004), Stress orientations and magnitudes in the
SAFOD pilot hole, Geophys Res. Lett. 31, L15S12,
doi:10.1029/2004GL020043.
Hsieh, P.A., J.V. Tracy, C. E. Neuzil, J.D. Bredehoeft and S.E. Silliman (1981), A
transient laboratory method for determining the hydraulic properties of tight
rocks-I. Theory, Int. J. Rock Mech. Min Sci & Geomech. Abstr. 18, 245-252.
Hubbert, M. K., and W.W. Rubey (1959), Role of fluid pressure in mechanics of
overthrust faulting, Bull, Geol. Soc Am., 70, 115-166.
Irwin, W.P., and Barnes (1975), Effect of geologic structure and metamorphic fluids
on seismic behavior of the San Andreas Fault system in central and northern
California, Geology, 3, 713-716.
Keaney, G.M., P. Meredith, S. Murrell and J. Barker (2004) Determintation of the
effective laws for permeability and specific storage in low porosity sandstone,
Proceedings of the 2004 Gulfrock ARMA/NARMS meeting, Houston USA,
ARMA/NARMS 04-537.
Lachenbruch, A.H. and A. McGarr (1990), Stress amd heat flow, The San Andreas
Fault System, California, edited by R. E. Wallace, U.S. Geol. Surv. Prof. Pap.,
1515, 261-277.
Lachenbruch, A.H. and J.H. Sass (1980), Haet flow and energetic of the San Andreas
fault zone, J. Geophys. Res. 85, 6185-6222.
Lockner, D.H., H. Naka, H. Tanaka, H. Ito and R. Ikeda (2000), Permeability and
strength of core samples from the Nojima fault of the 1995 Kobe earthquake, in
Proceedings of the International Workshop on the Nojima Fault Core and
Borehole Data Analysis, Tsukuba, Japan, Nov 22-23 (1999), edited by H, Ito et
al., U.S> Geol. Surv. Open File Rep., 00-129, 147-152.

130
Morrow, C.A., and D. A. Lockner (1994), Permeability differences between surface-
derived and deep borehole core samples, Geophys. Res. Lett., 21 2151-2154.
Morrow, C.A., L.Q. Shi and J.D. Byerlee (1981), Permeability and strength of San
Andreas fault gouge under high pressure, Geophys. Res. Lett., 8, 325-328.
Morrow, C.A., L.Q. Shi and J.D. Byerlee (1984), Permeability of fault gouge under
confining pressure and shear stress, J. Geophys, Res., 89, 3193-3200.
Olsen. R.E. (1986), State of the art: Consolidation testing, in Consolidation of Soils:
Testing and Evaluation: A Symposium, edited by R. N. Young and F. C.
Townsend, pp. 7-70, Am. Soc. For Test. and Mater., Philadelphia, PA.
Rice, J.R. (1992), Fault stress states, pore pressure distributions, and the weakness of
the San Andreas Fault, in Fault Mechanics and Transport Properties of Rocks
edited by B. Evans, and T.F. Wong, pp. 475-503, Academic, San Diego, CA.
Rice, J. R. (2006), Heating and weakening of faults during earthquake slip, J.
Geophys. Res., 111(B05311).
Saffer, D. M., B. A. Bekins, and S. H. Hickman (2003), Topographically driven
groundwater flow and the San Andreas heat flow paradox revisited, J. Geophys.
Res., 108(B5).
Saffer, D. M., and A. W. McKiernan (2005), Permeability of underthrust sediments at
the Costa Rican subduction zone: Scale dependence and implications for
dewatering, Geophys. Res. Lett., 32(L02302).
Samuelson, J., D. Elsworth and C. Marone (2009), Shear-induced dilatancy of fluid
saturated faults: Experiment and theory, J. Geophys. Res. 114(B12404),
doi:10.1029/2008JB006273.
Segall, P., and J. R. Rice (1995), Dilatancy, compaction, and slip instability if a fluid-
infiltrated fault, J. Geophys, Res., 100, 22,155-22,172.
Skarbek, R. M. and D. M. Saffer (2009), pore pressure development beneath the
décollement at the Nankai subduction zone: Implications for plate boundary
fault strength and sediment dewatering, J. Geophys. Res. 114(B07401),
doi:10.1029/2008JB006205.
Sleep, N. H., and M. L. Blanpied, Creep, compaction and the weak rheology of major
faults, Nature 359, 687-692.
Sulem. J., I. Vardoulakis, H. Ouffroukh, M. Boulon and J. Hans (2004), Experimental
characterization of the thermo-poro-mechanical properties of the Aegion Fault
gouge, C.R. Geosc., 336, 455-466.

131
Townend, J. and M.D. Zoback (2004), Regional tectonic stress near the San Andreas
Fault in central and southern California, Geophys. Res. Lett. 30, L15S11,
doi:10.10299/2003GL019405.
Wiersberg, T. and J. Erzinger (2007), A helium isotope cross-section study through
the San Andreas Fault at seismogenic depths, Geochem. Geophys. Geosyst., 8,
Q01002, doi:10.1029/2006GC001388.
Wibberly, C. and T. Shimamoto (2002), Internal structure and permeability of major
strike-slip fault zones: The median Tectonic line in W. Mie Prefecture, SW
Japan, J. Struct. Geol. 25, 59-78.
Zoback, M., S. Hickman and W. Ellsworth (2010), Scientific drilling into the San
Andreas fault zone, Eos Trans. AGU 91(22), 197-199.
Zoback, M.D., M.L. Zoback, J. P. Eaton, V.S. Mount and J. Suppe (1987), New
evidence on the state of stress near the San Andreas Fault, Science, 238, 1105-
1111, doi:10.1126/science.238.4830.1105.

132
Test Material Orientation Method Pc' (MPa) k (m2)
T_101 Berea N-S Const. Flow 5 3.66x10⁻¹⁴
T_101 Berea N-S Const. Flow 10 3.54x10⁻¹⁴
T_101 Berea N-S Const. Flow 30 3.69x10⁻¹⁴
T_101 Berea N-S Const. Flow 60 3.54x10⁻¹⁴
T_101 Berea N-S Const. Flow 30 3.45x10⁻¹⁴
T_101 Berea N-S Const. Flow 60 2.6x10⁻¹⁴
T_101 Berea N-S Const. Flow 30 2.62x10⁻¹⁴
T_101 Berea N-S Const. Flow 60 2.73x10⁻¹⁴
T_98 Berea E-W Const. Flow 5 4.35x10⁻¹⁴
T_98 Berea E-W Const. Flow 10 2.96x10⁻¹⁴
T_98 Berea E-W Const. Flow 30 2.46x10⁻¹⁴
T_98 Berea E-W Const. Flow 60 5.06x10⁻¹⁵
T_98 Berea E-W Const. Flow 30 6.62x10⁻¹⁵
T_98 Berea E-W Const. Flow 60 4.57x10⁻¹⁵
T_98 Berea E-W Const. Flow 30 5.83x10⁻¹⁵
T_98 Berea E-W Const. Flow 60 4.51x10⁻¹⁵
T_99 Berea T-B Const. Flow 5 2.19x10⁻¹⁴
T_99 Berea T-B Const. Flow 10 1.24x10⁻¹⁴
T_99 Berea T-B Const. Flow 30 6.82x10⁻¹⁵
T_99 Berea T-B Const. Flow 60 5.23x10⁻¹⁵
T_99 Berea T-B Const. Flow 30 3.95x10⁻¹⁵
T_99 Berea T-B Const. Flow 60 3.38x10⁻¹⁵
T_99 Berea T-B Const. Flow 30 3.1x10⁻¹⁵
T_99 Berea T-B Const. Flow 60 2.67x10⁻¹⁵
T_121 Crab Orchard N-S Pulse 10 1.0x10⁻¹⁹
T_121 Crab Orchard N-S Pulse 30 1.85x10⁻¹⁹
T_121 Crab Orchard N-S Pulse 60 1.1x10⁻¹⁹
T_121 Crab Orchard N-S Pulse 30 2.0x10⁻¹⁹
T_121 Crab Orchard N-S Pulse 60 1.2x10⁻¹⁹
T_121 Crab Orchard N-S Pulse 30 1.2x10⁻¹⁹
T_108 Crab Orchard N-S Const. Head 5 2.09x10⁻¹⁸
T_108 Crab Orchard N-S Const. Head 10 1.18x10⁻¹⁸
T_108 Crab Orchard N-S Const. Head 30 6.21x10⁻¹⁹
T_108 Crab Orchard N-S Const. Head 60 1.98x10⁻¹⁹
T_108 Crab Orchard N-S Const. Head 30 3.02x10⁻¹⁹
T_108 Crab Orchard N-S Const. Head 60 2.0x10⁻¹⁹
T_108 Crab Orchard N-S Const. Head 30 3.55x10⁻¹⁹
T_108 Crab Orchard N-S Const. Head 60 1.73x10⁻¹⁹
T_109 Crab Orchard T-B Const. Head 5 1.23x10⁻¹⁸
T_109 Crab Orchard T-B Const. Head 10 1.96x10⁻¹⁹
T_109 Crab Orchard T-B Const. Head 30 9.39x10⁻²⁰
T_109 Crab Orchard T-B Const. Head 60 5.26x10⁻²⁰
T_109 Crab Orchard T-B Const. Head 30 8.0x10⁻²⁰

133
T_109 Crab Orchard T-B Const. Head 60 6.12x10⁻²⁰
T_109 Crab Orchard T-B Const. Head 30 7.72x10⁻²⁰
T_109 Crab Orchard T-B Const. Head 60 5.06x10⁻²⁰
T_103 Crab Orchard E-W Const. Head 5 1.11x10⁻¹⁸
T_103 Crab Orchard E-W Const. Head 10 6.5x10⁻¹⁹
T_103 Crab Orchard E-W Const. Head 30 2.75x10⁻¹⁹
T_103 Crab Orchard E-W Const. Head 60 1.05x10⁻¹⁹
T_103 Crab Orchard E-W Const. Head 30 1.41x10⁻¹⁹
T_103 Crab Orchard E-W Const. Head 60 1.08x10⁻¹⁹
T_103 Crab Orchard E-W Const. Head 30 1.52x10⁻¹⁹
T_103 Crab Orchard E-W Const. Head 60 8.4x10⁻²⁰
T_114 Wilkeson E-W Const. Head 5 3.34x10⁻¹⁸
T_114 Wilkeson E-W Const. Head 10 1.39x10⁻¹⁸
T_114 Wilkeson E-W Const. Head 30 4.16x10⁻¹⁹
T_114 Wilkeson E-W Const. Head 30 2.08x10⁻¹⁹
T_114 Wilkeson E-W Const. Head 60 2.32x10⁻¹⁹
T_114 Wilkeson E-W Const. Head 30 2.58x10⁻¹⁹
T_114 Wilkeson E-W Const. Head 60 1.42x10⁻¹⁹
Table 5.1. Interlab comparison results.
Test Sample Method
T162 G 4, 5 Triax, Const. Head
U163 G 4, 5 Uniax, CRS
U164 G 4, 4 Uniax, CRS
U173 G 4, 4 Uniax, CRS
Table 5.2 Experiment list.

134

135
Figure 5.1. Permeability apparatuses. (a) Uniaxial pressured conditions are
maintained by placing the sample in a solid steel ring inside of a pressure vessel.
Vertical stress is applied via a steel ram with a flow distribution cap. Pore pressure is
controlled independently at the top at the bottom of the sample. (b) Triaxial core
holder. Axial stress and confining pressure are kept equal to maintain isostatic
conditions. Pore pressure is delivered through end caps at each end with a porous
metal frit attached.

136
(a)
(b)
Figure 5.2. Pulse decay curve matching. (a) Curves are matched for three reservoir
sizes when possible. The curve for with the smallest error for storage and
permeability is chosen. In cases when the reservoir storage is & sample storage the
specific storage of the sample is unconstrained.

137
Figure 5.3. Constant rate of strain uniaxial permeability test. A constant displacement
rate is imposed on the top of a sample, which is drained to a pump holding a constant
pressure. The pore pressure build-up from an initial value (0.5 MPa in this test) is
monitored at the bottom of the sample. (inset) Zoomed version of the pore pressure
increase.

138
Figure 5.4. Permeability calculation from constant flow test. Pressure differential,
dP, across the sample is controlled and the flow rate, Q is monitored in two pumps.
The slope of the best-fit line is proportional to the permeability, k. In all cases
multiple dP are used to minimize error with zero flow assumed at dP = 0.

139
Figure 5.5. Permeability of Berea Sandstone in three orthogonal directions.
Permeability is calculated from holding the flow rate constant at an effective pressure
of 5-60 MPa. Pressure is cycled between 30 and 60 MPa to monitor the hysteresis of
the sample. Dashed lines indicate the order of the measurement. The T-B sample is
across formation bedding.

140
Figure 5.6. Permeability of Crab Orchard (often called Tennessee) Sandstone in three
orthogonal directions. Permeability is calculated from holding the pressure
differential constant at an effective pressure of 5-60 MPa and in a repeat experiment,
from the pulse decay method. Pressure is cycled between 30 and 60 MPa to monitor
the hysteresis of the sample. Dashed lines indicate the order of the measurement. The
T-B sample is across formation bedding.

141
Figure 5.7. Permeability of the Wilkeson Sandstone in one direction. Permeability is
calculated from holding the pressure differential constant at an effective pressure of
5-60 MPa. Pressure is cycled between 30 and 60 MPa to monitor the hysteresis of the
sample. Dashed lines indicate the order of the measurement. No bedding is present in
our sample.

142
Figure 5.8. (a) Geologic cross-section of the SAFOD project, from Zoback et al.
[2010]. The borehole deviates to intersect that the zones at ~90°. Fault zones are
marked in red at ~2.7 km depth. Earthquakes are indicated by circles. The first fault
zone is the SDZ and the second is the CDZ. (b), (c) SEM images of the CDZ from
cuttings of permeability sample preparation.

143
Figure 5.9. Permeability, k, drops rapidly in the three CRS tests until effective stress
~20 MPa then remains near constant. Triaxial flow-through tests show equal
permeability at 5 MPa and lower values at 10 MPa.
10-21
10-20
10-19
10-18
10-17
0 20 40 60 80 100
G45 U163G44 U164G44 U173G45 T162
Pe
rme
ab
ility
, k (
m2)
Effective Stress, Pc' (MPa)

144
Figure 5.10. Specific storage, Ss, with vertical stress, !v’. Ss rapidly decreases at low
stress and then decreases slightly after !v’ ~ 20 MPa. Both experiments show
consistent values at 10-5
m-1
.
10-6
10-5
0.0001
0.001
0 20 40 60 80 100
U163U164
Specific
Sto
rage, S
s (
m-1
)
Effective Vertical Stress, !v' (MPa)

145
0
20
40
60
80
100
0.05 0.1 0.15 0.2 0.25
U163, G, 4, 5U164, G, 4, 4U173, G, 4, 4
Effective V
ert
ical S
tress, !
v' (
MP
a)
Strain, "
E = 1.5 GPa-1
E = 0.12 GPa-1
Figure 5.11. Young’s Modulus, E, rapidly increases until 20 MPa and then remains
constant. Fiducial lines are given for reference values of E. The amount of strain
varies from test to test to reach constant E. 1.5 GPa-1
corresponds is the best-fit line of
experiment U164 at !v’ > 40 MPa.

146
APPENDIX A
This appendix represents work in which I am a co-author but not the primary author.
This paper was published in Meso-Scale Shear Physics in Earthquake and Landslide
Mechanics and deals with localization in fault zones and relates to Chapters 2-4 of my
thesis.
Marone, C. and A. P. Rathbun (2009), Strain localization in granular fault zones at
laboratory and tectonic scales, in Meso-Scale Shear Physics in Earthquake and
Landslide Mechanics, edited by J. Sulem and I. Vardoulakis, CRC Press, 2009,
978-0-415-47558-7.
Strain Localization in Granular Fault Zones at Laboratory and Tectonic Scales
C. Marone & A. P. Rathbun Dept. of Geosciences and Center for Geomechanics, Geofluids, and Geohazards, The Pennsylvania State University, University Park PA, USA

147
1 INTRODUCTION
Laboratory and field evidence indicate that strain localization is accompanied by significant changes in hydraulic and mechanical properties of rocks (e.g., Wood 2002, Song et al. 2004, Rice 2006). Strain localization occurs at a broad range of scales and involves both formation of faults and, upon continued shear, confinement of shear to narrow bands within the wear and gouge materials that constitute the fault zone. Of particular interest is the connection between strain localization and the transition from stable to unstable frictional sliding within shear zones of finite width (e.g., Anand & Gu 2000, Rice & Cocco 2007).
2 SHEAR LOCALIZATION IN GRANULAR LAYERS In this paper we focus on layers composed of granulated rock. Granular layers were sheared in a biaxial deformation apparatus using the double-direct shear configuration. Details of the testing apparatus and experimental procedures are reported in Rathbun et al. (2008). Layers were initially 3 to 10 mm-thick and we imposed slip velocities of 10 to 100 !m/s at the layer boundary. Normal stress was held constant during shear via a fast-acting servo-hydraulic control mechanism. We discuss experiments conducted at normal stresses in the range 0.5 to 5 MPa, which is high enough to result in inelastic yield at grain to grain contacts, on the upper end, and low enough to inhibit grain crushing, on the lower end.
2.1 Dilation as a proxy for shear localization
Previous studies of granular layers have established that upon shear loading, shear stress rises linearly before undergoing a progressive transition from elastic to inelastic behavior (e.g., Anthony & Marone 2005). Inelastic yield is associated with grain rearrangement, compaction, and bulk shear strain of the layer (e.g., Marone 1998). Figure 1 illustrates this behavior for a granular layer that was initially 10 mm thick and sheared at a normal stress of 1 MPa. Note the steep rise in shear stress followed by strain hardening and a transition to steady frictional sliding at a shear strain of ~ 0.5. Layers compact during the initial rise in shear stress and dilation beings at a normalized stress (friction) level of 0.35 to 0.4 (Fig. 1). In this experiment we evaluated the effects of changes in slip velocity at the layer boundary. The systematic variation in friction seen throughout the experiment is associated with step changes in loading rate between 10 and 30 !m/s, as discussed further below.
ABSTRACT: We present results from laboratory experiments and a numerical model for frictional weakening and shear localization. Experiments document strain localization in sheared layers at normal stresses of 0.5 to 5 MPa, layer thicknesses of 3 to 10 mm, and imposed slip velocities of 10 to 100 !m/s. Passive strain markers and the response to load perturbations indicate that the degree of shear localization increases for shear strains ' of 0.15 < ' < 1. Our numerical model employs rate-state friction and uses 1D elasto-frictional coupling with radiation damping. We interrogate the model frictional behavior by imposing perturbations in shearing rate at the fault zone boundary. The spatial distribution of shear strain depends strongly on frictional behavior of surfaces within the shear zone. We discuss the onset of strain localization and the width of active shear strain for conditions relevant to earthquake faulting and landslides. state relevant to earthquake faulting and landslides.

148
Figure 1. Complete stress-strain curve for a granular layer sheared at a 1 MPa normal stress. Initial layer thickness was 10 mm. Normalized shear stress is plotted versus engineering shear strain computed from incremental displacement at the layer boundary divided by instantaneous layer thickness. Note the steep, quasi-linear, initial rise in shear stress followed by hardening and fully-mobilized shear at strains of 0.4 to 0.5. Beginning at a shear stain of 0.3, the shearing rate at the layer boundary was toggled between 10 and 30 !m/s. Inset shows detail of the friction response to step changes in slip velocity. The material is glacial till, (Caesar till, Ohio, USA) which is a mixed-size granular material (Particle size D: Dmax = 1 mm, D50 ~ 0.3 mm, 90% of the particles > 0.1 mm) similar to natural fault gouge (after Rathbun et al. 2008).
In granular layers, the transition from initial strain hardening to steady-state (fully
mobilized) frictional sliding is associated with the development of localized shear
(e.g., Logan et al. 1979, Marone et al. 1992). Recently, Rathbun et al. (2008) showed
that stress perturbations, and layer dilation, provide a more precise measure of the
degree of shear localization. They showed that small perturbations in the shear stress
level during creep friction tests provide a proxy for shear localization (Fig. 2). Creep
friction tests were carried out at a constant shear stress level below that for stable

149
sliding. Using this approach, the degree of shear localization can be assessed with the
parameter "h*, which is the layer dilation for a unit increase in shear stress. We
measured "h*
as a function of shear strain for a range of conditions (Fig. 2). Dilation
scales with layer thickness below a critical value of shear strain. For shear strains # ~
0.5, thicker layers exhibit larger values of "h*
than thinner layers (Fig. 2). However
for shear strains greater than ~ 1, dilation is independent of layer thickness. These
data show that, initially, shear is distributed across the full thickness of the layer, but
that shear becomes localized beyond a critical shear strain. The data of Figure 2
indicate that shear is fully localized by shear strains of roughly unity.
Figure 2. Data showing layer dilation "h
*, used as a proxy for shear localization, as a function of shear
strain. The parameter "h* is the layer dilation for an increase in shear stress equal to 5% of the strength
during stable frictional sliding. Data are shown from multiple experiments with initial layer thicknesses ranging from 3 to 10 mm. Normal stress was 1 MPa in all cases. During steady-state frictional sliding, friction is typically 0.55 to 0.6 (e.g. Fig. 1); thus the shear stress perturbations were of order 0.03 MPa.
Figure 3 shows additional details of the relationship between shear stress, shear
strain, and layer thickness. This figure shows stress-strain curves for representative
experiments and one data set for changes in layer thickness as a function of shear
strain (experiment p1025). Layer dilation occurs early in the strain history and then
the layers compact slightly before reaching a steady level, consistent with a critical
state, for shear strains of 0.3 and greater (Fig. 3).

150
2.2 Rate/State friction and shear localization
Slip velocity step tests have emerged as a powerful tool for interrogating friction constitutive behavior (Dieterich 1979, Ruina 1983, Scholz, 1998). A large body of literature shows that frictional strength of a wide range of materials exhibits two responses to a step increase in the imposed loading rate (e.g., Dieterich & Kilgore 1994, Tullis 1996, Marone, 1998). First, there is an instantaneous change in frictional resistance of the same sign as the velocity change. This is referred to as the friction direct effect and it is described by the friction parameter a. Figure 4 defines the key parameters and outlines the rate and state friction equations. The direct effect is followed by a gradual evolution of strength, scaled by the friction parameter b (Fig. 4). The evolution effect is typically of the same as the change in velocity (Fig. 1). Existing studies show that the evolution effect occurs over a characteristic slip distance, Dc (sometimes referred to as L), for initially-bare solid surfaces or a characteristic strain for layers of granular/clay particles (e.g., Marone 1998). The values of Dc are typically larger for shear within a granular layer than for shear between solid surfaces (e.g., Marone & Kilgore 1993, Marone et al. 2009).
Figure 3. Complete stress strain curves for five experiments along with a representative data set (experiment p1025) for changes in layer thickness as a function of shear strain. The layer thickness started at 10 mm in experiment p1025 and the thickness was measured continuously during shear with a DCDT. Note that dilation occurs during the initial increase in stress but that compaction begins prior to fully-mobilized shear within the granular layer.

151
Figure 4. The equations describing the rate and state friction constitutive law along with a schematic showing this behavior.
To the extent that the friction evolution effect is truly driven by shear displacement,
step velocity increases and decreases are expected to yield symmetric behavior. Such
symmetry was found by Ruina (1983) and Marone et al. (1990). Other studies have
favored a model in which friction evolution occurs over a characteristic time (Beeler
et al. 1994, Sleep 1997). Finally, a large number of works have evaluated only
velocity increases or decreases, without considering the issue of symmetry (e.g.,
Marone & Kilgore 1993). Few studies have systematically evaluated symmetry of the
friction response to changes in loading velocity.
2.3 Mechanics of the critical slip distance for friction of granular materials
For solid surfaces in contact, the critical slip distance for friction evolution can be thought of in terms of the asperity contact lifetime, given by the contact size divided by the average slip rate (Rabinowicz 1951, Dieterich 1979). When coupled with the adhesive theory of friction (e.g., Bowden & Tabor 1950), in which asperity strength (and size) is proportional to time of contact (lifetime), this model predicts that frictional strength during steady-sliding should decrease with increasing slip velocity, because contact lifetime (hence strength) is inversely proportional to sliding velocity. In the context of a velocity step test, the critical friction distance is the slip necessary to replace contacts with a lifetime given by the initial velocity by contacts corresponding to the final velocity (Dieterich 1979, Ruina1983).
For granular materials the situation is slightly more complex. The model for
solid friction can be applied directly for asperity contacts between grains. However,
granular interactions and stress transmission via particle contacts lead to a second
characteristic length scale, in addition to the asperity contact junction size. The work
by Marone & Kilgore (1993) shows that the critical slip distance for granular shear
depends on both the particle size and the shear localization dimension (Fig. 5).

152
Figure 5. Measurements of the critical slip distance for granular layers as a function of shear strain. Data are shown for three particle size distributions. Note that the critical slip distance is greatest for larger particles at all values of shear strain. Coarse: Ottawa sand ASTM C-190 all particles are 600 to 800 !m. Fine: Silcosil 400 mesh (US Silica Co.) with median and maximum diameter of 1.4 and 10 !m, respectively. Fractal: given by N(n) = b n
–D, where N(n) is the number of particles of size n, b is a
constant and D is the fractal dimension 2.6, made using particles in the range < 45 !m to 700 m. Data from Marone & Kilgore (1993).
The data of Figure 5 show measurements of the critical slip distance as a function of
shear strain for granular layers sheared in the double-direct shear geometry. The
average particle sizes ranged from 700 !m (Coarse) to 5 !m (Fine); fractal is a
power-law size distribution between 45 and 720 !m. The critical slip distance is
greatest for larger particles at all values of shear strain (Fig. 5). Fine particles, with an
average size that is roughly 100 times smaller than the coarse particles, have a critical
slip distance that is roughly 10 times smaller than the coarse particles, consistent with
the expected scaling between contact junction dimension and particle diameter. It is
important to note, however, that the difference in Dc values for coarse and fine
particles is small compared to the observed evolution of Dc with shear strain (Fig. 5).
The Dc values for layers of both coarse and fine particles decrease by more than
100% of the final value at shear strains greater than ~ 7. The decrease in Dc with
shear strain is consistent with the effects of shear localization.
2.4 Observations of shear localization
Laboratory investigations of shear localization often include post-experiment examination of preserved microstructures (e.g., Mair & Marone 1999). In the experiments described here, we used passive markers in some experiments to record the strain distribution across layers (Figure 6). The markers were constructed with blue sand grains. Following the shear experiment, layers were impregnated with

153
epoxy and then cut parallel to the shear direction. Figure 6 shows a layer that was sheared, top to the left, to a strain of 3.9. The layer had three markers that were initially vertical in the orientation of the photograph. The original image is shown below a copy (above) that has been marked to highlight the offset marker. Note that: 1) the marker is offset primarily along a zone near the center of the layer and 2) that the segments above and below the primary offset show distinct curvature. This curvature indicates a progressive localization process prior to development of the main shear zone in the center of the layer. By measuring offset of the top and bottom limbs of the marker, we calculated a shear strain of 3.25 along the shear zone at the center of the layer. Based on the total shear strain of 3.9, we estimate initiation of this shear band at a shear strain of 0.65, which is within the range indicated by our layer dilation measurements (Fig 2).
Figure 6. Thin section of a granular layer that was subject to a shear strain of 3.9. The layer contains three passive markers that were initially vertical, in this orientation, formed by darker particles. Top image is annotated to show shear of the central marker. Lower image is unmarked photograph.
Figure 7 is a schematic illustration of two modes by which shear could become
localized. In panels a-c the marker is first subject to uniform strain and then cut by a
shear zone. In this scenario, shear localizes abruptly. The markers are first rotated by
simple shear and then cut and offset along a narrow zone at the center of the layer.
Panels d-f show a more progressive localization process (Fig. 7). The markers are
initially subject to uniform strain, but localization occurs gradually and on several
surfaces near the center of the zone. The markers are bent into an arcuate shape by
progressively greater strain concentration with increasing distance from the layer
boundaries (Fig. 7). Eventually, the strained markers are offset along a primary shear
band. This type of localization process, with a gradual transition from pervasive to
localized strain is consistent with our dilation measurements, which indicate
progressively greater localization over the range of macroscopic shear strain from
0.15 to 1.0. Moreover, thin sections from our experiments (Fig. 6) indicate a
progressive localization process, like panels d-f of Figure 7, rather than an abrupt
transition.

154
Figure 7. Schematic representations of two models for shear localization in a granular layer. Darker particles are passive markers. Panels a and d show initial, un-deformed state. Panels a-c show pervasive shear followed by abrupt shear localization. Panels d-f show progressive shear and localization. Strain is pervasive for the interval from panel d to panel e, but then shear localizes between e and f. Panel f shows one marker that is deformed and offset. Note similarity between panel f and micrograph in Figure 6.
3 A NUMERICAL MODEL FOR FRICTIONAL WEAKENING AND SHEAR LOCALIZATION
To address shear localization in tectonic fault zones and to improve our understanding of the scaling problem associated with applying laboratory observations to faults in Earth's crust, we employ a numerical model. The model describes frictional shear in a fault zone composed of multiple, parallel surfaces that obey rate and state friction (Fig. 8). The model used here is based on that described by Marone et al. (2009). We extend that model and focus on coupling between friction properties and shear localization.
3.1 Elasto-Frictional Model for a Fault Zone of Finite Thickness
A typical tectonic fault zone consists of a highly damaged zone surrounded by progressively less damaged country rock (e.g., Chester & Chester 1998). Thus, in the context of the seismic cycle, the zone of slip deformation is defined by a critical fracture density, above which slip and deformation occurs, and below which the rock behaves as intact material. One could

155
imagine a model in which this critical fracture density depended on strain rate and other factors, such that the effective fault zone width varied throughout the seismic cycle, but we make the simplifying assumption of constant width T (Fig. 8).
Figure 8. Fault zone model and schematic of shear zone composed of multiple sub-parallel surfaces. The fault zone width is T. Kext represents elastic stiffness of the crust surrounding the fault. Kint represents elastic coupling between surfaces in the model, which are separated by distance h. The model is symmetric about the center.
Within the model fault zone, shear may occur on one or more sub-parallel surfaces
(Fig. 8). Our aim is to investigate spatio-temporal complexity of shear localization in
a fault zone that experiences a rapid change in imposed slip rate; for example due to
earthquake propagation into the region of interest. Therefore we employ a simplistic
geometry and elastic model. As an initial condition, we assume homogeneous creep
within the fault zone, such that all surfaces are slipping at a background rate. We
investigate the fault response to perturbations in slip rate imposed at the fault zone
boundary at ±T/2 relative to the center of the zone (Fig. 8).
Potential slip surfaces within the fault zone interact via elasto-frictional coupling.
Stress is transmitted between surfaces only when: 1) the frictional strength of a
surface exceeds the current stress level, or 2) a surface slips and its strength changes.
In the models described here, stresses and frictional strengths are initially equal on all
surfaces. Slip surfaces obey laboratory-based rate and state friction laws, and we

156
focus here on the case of state evolution via the Ruina law (Dieterich 1979, Ruina
1983). A one-dimensional elastic model is used with radiation damping to solve the
equations of motion.
Each surface i in the model shear zone obeys rate and state frictional behavior, such
that friction !i is a function of state 'i and slip velocity vi according to:
!
µi("
i,v
i) = µ0 + aln(
vi
v0
) + bln(v0"i
L) (1)
where !o is a reference friction value at slip velocity vo, and the parameters a, b, and
L are empirically-derived friction constitutive parameters (e.g., Marone 1998). Note
that we use L for the model critical slip distance, rather than Dc, which is the effective
parameter measured from laboratory experiments. Tectonic fault zones are likely to
include spatial variations of the friction constitutive parameters within the shear zone,
and thus we allow such behaviors.
The model includes ns parallel surfaces, where i = 0 is at the fault zone boundary.
Surfaces are coupled elastically to their neighbors via stiffness Kint. We assume Kint =
G/h, where G is shear modulus and h is layer spacing (Fig. 8) and use G = 30 GPa.
We assume that remote tectonic loading of the shear zone boundary is compliant
relative to Kint and take Kint/Kext equal to 10.0. This is equivalent to assuming a
constant spacing between surfaces and means that wider shear zones, with more
internal surfaces, are effectively more compliant than narrower zones. Another
approach would be to take Kint/Kext equal to the number of surfaces in the shear zone.
Details of the parameters used are report in Table 1.
Table 1. Model parameters. For all cases, G=30 GPa, ( = 100 MPa, Kint= G/h; Kint/Kext =10; vo = 1e-6 m. ns/2 is the number of surfaces in the fault zone half width T/2.
a b L (m)
h (m)
Kext/(n (m
-1)
ns/2 T (m)
v (m/s)
0.012 0.016 1e-5 6e-3 5e4 30 0.60 0.01
We analyze friction state evolution according to:
!
d"i
dt= #
vi"i
Lln(vi"i
L). (Ruina Law) (2)
Frictional slip on each surface satisfies the quasi-dynamic equation of motion with
radiation damping (Rice 1993):
!
µi ="0
# n
$G
2%# n
(vi $ vpl ) + k(vpl t $ vit) (3)
where !i is the frictional stress, )o is an initial stress, $ is shear wave speed, (n is
normal stress, k is stiffness divided by normal stress, and t is time. Differentiating
Equations 1 and 3 with respect to time and solving for dvi/dt yields:

157
!
dvi
dt=
k(vpl " vi) "bd#idt
#ia
vi+
G
2$% n
, (4)
which applies for each surface within the shear zone. Our approach for including
radiation damping is similar to that described in previous works (Perfettini & Avouac
2004, Ziv 2007).
We assume that the model begins with steady creep, and thus each surface of the
fault zone undergoes steady state slip at velocity vi = vo with !o = 0.6 and 'ss = L/vo.
The effective stiffness ki between the load point and surface i within the fault zone is
given by:
!
1
ki=1
Kext
+1
Kint jj=1
i
" . (5)
To determine shear motion within the fault zone, we solve the coupled Equations 2,
4-5, using a 4th order Runga-Kutta numerical scheme. As noted above, perturbations
in slip velocity are imposed at the shear zone boundary. This is assumed to occur via
a remote loading stiffness Kext. Then, for each time step in the calculation, the surface
with the lowest frictional strength is allowed to slip.
Our initial conditions are that shear and normal stress are the same on each surface.
We ensure that time steps are small compared to the ratio of slip surface separation, h,
to elastic wave speed. Thus, within a given time step, only one surface slips and it is
coupled elastically to the remote loading velocity via the spring stiffness given in
Equation 5.
3.2 Frictional Response to Changes in Imposed Slip Rate
Figure 9 shows macroscopic shear strength of the fault zone as a function of slip at the fault zone boundary. Shear stresses are equal on all slip surfaces, however frictional strengths are not. Thus, Figure 9 shows friction of the weakest surface within the fault zone as a function of offset at the fault zone boundary. This case shows behavior of a fault zone that has homogeneous frictional properties.

158
Figure 9. Results form the model runs showing friction as a function of slip. For comparison, the intrinsic frictional response for a single surface is shown together with the frictional response of the shear zone. Note that the shear zone exhibits a prolonged phase of hardening, associated with the rate/state friction response of each layer, followed by weakening. See Table 1 for parameter values.
The macroscopic frictional response of the fault zone differs from the constitutive
response of the individual surfaces within it. In particular, the fault zone exhibits a
protracted phase of strain hardening prior to reaching the maximum yield strength
(Fig. 9). The peak strength is reached in a slip displacement of < 5% of Dc for a
single surface, whereas the fault as a whole requires slip equal to 200% of Dc before
weakening begins. As a result, the effective critical friction distance for the fault
zone significantly exceeds that for an individual slip surface (Fig. 9). The maximum
yield strength of the fault zone, which is proportional to the friction parameter a, is
nearly identical to that for an individual surface. Finally, the steady-state frictional
strength is the same in both cases (Fig. 9).
The relationship between the intrinsic frictional behavior of a surface and the zone
of active shear, as a whole, is important for several aspects of earthquake rupture and
shear localization. Figure 10 shows this relationship for a series of model runs to
different shear strains. In each case the intrinsic frictional response of a single surface
is shown versus slip on that surface. In addition, the frictional strength for the shear
zone is plotted versus boundary slip. The two curves are plotted on the same scale;
but note that the single surface is subject to larger total slip displacement, so as to
illustrate the complete behavior. The panels of Figure 10 show three different
amounts of shear applied at the boundary and below each plot is the spatial
distribution of slip across the full shear zone.

159
Figure 10. Three snap shots of the relation between frictional behavior and slip distribution
within a model fault zone. In each case the response of a single surface is plotted together
with the behavior for the complete shear zone. The single surface is the same in each panel.
The shear zone response in panels a-c is shown for progressively greater boundary shear.
Images below each plot show slip distribution, via offset of markers that were initially
vertical in this orientation. Note that strain is initially pervasive but that localization occurs
abruptly during frictional weakening. See Table 1 for parameter values.

160
The frictional model indicates that a perturbation in slip rate at the shear zone
boundary results first in pervasive shear, up to a point, followed by localization along
a single surface (Fig. 10). Comparison of the friction curves and slip distribution
shows that localization occurs at the point that frictional weakening begins. The
initial period of hardening, dictated by the friction rate parameter a, is prolonged in
the shear zone, compared to a single surface, because each surface must proceed
through this hardening phase before the zone as a whole can weaken.
4 DISCUSSION
4.1 Shear localization and frictional behavior of granular layers
Our observations indicate that the critical slip distance for friction of granular materials represents the combined effect of multiple particle-particle contact interfaces. This is evident in the laboratory data on shear localization (Fig. 2) showing that dilation is confined to a fraction of the layer once shear becomes localized. Laboratory data for granular layers also show evidence of localization in the form of the critical slip distance for friction Dc (Fig. 5). Our data show that laboratory measurements of Dc represent the effective critical slip distance for the zone of active shear, which points the way toward a model for upscaling laboratory results to tectonic faults. Indeed, these laboratory data are one of the motivations for the numerical model presented here.
4.2 Spatio-temporal complexity of shear localization and delocalization
One of the enduring puzzles of shear localization in granular fault zones is that of shear band migration and delocalization. A typical fault zone in nature, and in the laboratory, includes multiple zones of shear localization, rather than a single zone. This may indicate a progressive process of localization, where one type of feature is active for a limited time and then another takes over. Or, it may indicate that a set of shear zones operate simultaneously, to produce a penetrative shear fabric. However, in either case, the existence of multiple slip surfaces raises a fundamental question: why does shear concentrate in one location and then switch locations? Is there a strain hardening process that begins once a shear band forms and, if so, does each shear band accommodate the same critical strain prior to abandonment? Another possibility is that strain localization is a local process within the bulk, and a given shear band minimizes the rate of work for only a confined region. In this case, it is important to know what sets the length scale of this region.
Our experiments involve simultaneous shear and comminution of granular
materials. Previous works have documented the relationship between comminution
and strain under conditions similar to ours (e.g., Mandl et al. 1977, Marone & Scholz
1989). Although our experiments include detailed measurements of macroscopic
stress and layer strain, these data are of limited value in answering the most important
questions raised above. One would like to have independent assessment of the spatial
distribution of shear strain as a function of imposed shear on the layer. While this is
beyond the scope of the present data, our measurements of layer dilation as a proxy
for shear localization offer some information, and the numerical model provides some
insight about how the intrinsic frictional response of surfaces within a zone effect the
overall response of a fault zone.

161
5 CONCLUSIONS
Laboratory friction experiments combined with constitutive modeling provide a powerful means of investigating problems in shear localization. Our laboratory data show that layer dilation, in response to small perturbations in creep stress rate or strain rate, can be used as a sensitive proxy for the degree of strain localization. For granular layers sheared at normal stresses up to a few MPa, shear strain becomes fully localized prior to engineering shear strains of 1. Thin section analysis shows that shear localization is a progressive, rather than abrupt, process within a granular layer. Our experiments included velocity step tests, which probe the friction constitutive behavior and its relation to shear localization. We present a numerical model for shear within fault zones composed of multiple slip surfaces and use the model to evaluate shear localization. The spatial distribution of fault zone shear depends strongly on the intrinsic frictional properties of the materials and on elasto-frictional interaction. The model shear distribution is strikingly similar to the slip distribution documented in thin sections from experiment. Frictional processes determine the onset of strain localization and the width of active shear strain in granular shear zones. Our work has important implications for a range of conditions relevant to earthquake faulting and landslides
ACKNOWLEDGMENTS
We thank Y. H. Hatzor and the other organizers of the Batshiva de Rothschild seminar on shear physics at the meso-scale in earthquake and landslide mechanics. The workshop was extremely stimulating and very enjoyable. We gratefully acknowledge support from the National Science Foundation under grant numbers ANT-0538195. EAR-0510182, and OCE-064833. J. Samuelson, A. Niemeijer, and B. Carpenter are thanked for stimulating discussions during the course of this work.
REFERENCES
Anand, L. & Gu, C. 2000. Granular materials: constitutive equations and strain localization. Journal of Mechanics and Physics of Solids 48: 1701-1733, 10.1016/S0022-5096(99)00066-6.
Anthony, J.L. & Marone, C. 2005. Influence of particle characteristics on granular friction. Journal Geophysical Research 110(B08409): 10.1029/2004JB003399.
Beeler, N.M., Tullis, T.E., & Weeks, J.D., 1994. The roles of time and displacement in evolution effect in rock friction. Geophysical Research Letters 21: 1987-1990.
Bowden, F.P. & Tabor, D. 1950. The Friction and Lubrication of Solids. Part I. Oxford: Clarenden Press.
Chester F.M., & Chester, J.S. 1998. Ultracataclasite structure and friction processes of the Punchbowl fault, San Andreas system, California. Tectonophysics 295: 199-221.
Dieterich, J.H. 1979. Modeling of rock friction: 1. Experimental results and constitutive equations. Journal Geophysical Research 84: 2161-2168.
Dieterich J.H. & Kilgore, B. 1994. Direct observation of frictional contacts: new insights for state-dependent properties. Pure Applied Geophysics 143: 283-302.
Gajo, A., Bigoni, D. & Wood, D.M. 2004. Multiple shear band development and related instabilities in granular materials. Journal of Mechanics and Physics of Solids. 52: 2683-2724, 10.1016/j.jmps.2004.05.010.
Karner, S.L., Chester, F.M., & Chester, J.S. 2005. Towards a general state-variable constitutive relation to describe granular deformation. Earth and Planetary Science Letters 237: 940-950, 10.1016/j.epsl.2005.06.056.
Lade, P.V. 2002. Instability, shear banding, and failure in granular materials. International Journal of Solids and Structures 39: 3337-3357.
Logan, J.M., Friedman, M., Higgs, N., Dengo, C., & Shimamoto, T. 1979. Experimental studies of simulated gouge and their application to studies of natural fault zones, Analyses of Actual Fault Zones in Bedrock. U.S. Geol. Surv. Open File Rep. 1239:305-43

162
Mair, K. & Marone, C. 1999. Friction of simulated fault gouge for a wide range of velocities and normal stresses. Journal Geophysical Research 104: 28,899-28,914.
Mandl, G., L. N. J. de Jong, and A. Maltha, 1977. Shear zones in granular material, an experimental study of their structure and mechanical genesis, Rock Mech., 9, 95-144.
Marone, C. 1998. Laboratory-derived friction laws and their application to seismic faulting. Annual Reviews of Earth & Planetary Science 26: 643-696.
Marone, C., Cocco, M., Richardson, E., & Tinti, E. 2009. The critical slip distance for seismic and aseismic fault zones of finite width. In E. Fukuyama (ed.) Fault-zone Properties and Earthquake Rupture Dynamics, International Geophysics Series 94: 135-162, Elsevier.
Marone, C., Hobbs, B.E. & Ord, A. 1992. Coulomb constitutive laws for friction: contrasts in frictional behavior for distributed and localized shear. Pure and Applied Geophysics. 139: 195-214.
Marone, C., & Kilgore, B. 1993. Scaling of the critical slip distance for seismic faulting with shear strain in fault zones. Nature 362: 618-621.
Marone, C., Raleigh, C.B. & Scholz, C.H. 1990. Frictional behavior and constitutive modeling of simulated fault gouge. Journal Geophysical Research 95: 7007-7025.
Marone, C., & Scholz, C.H. 1989. Particle-size distribution and microstructures within simulated fault gouge. Journal of Structural Geology 11: 799-814.
Perfettini, H. & Avouac, J.-P. 2004. Stress transfer and strain rate variations during the seismic cycle. Journal Geophysical Research 109: 10.1029/2003JB002917.
Rabinowicz E. 1951. The nature of static and kinetic coefficients of friction. Journal Applied Physics 22: 1373-1379.
Rathbun, A.P., Marone, C., Alley, R.B. & Anandakrishnan, S. 2008. Laboratory study of the frictional rheology of sheared till. Journal Geophysical Research 113(F02020): 10.1029/2007JF000815.
Rice, J. R. 1993. Spatio-temporal complexity of slip on a fault. Journal Geophysical Research 98: 9885 – 9907.
Rice J. R. 2006. Heating and weakening of faults during earthquake slip. Journal Geophysical Research 111(B05311): 10.1029/2005JB004006.
Rice, J. R., and Cocco, M. 2007. Seismic fault rheology and earthquake dynamics. In Handy, M.R., Hirth, G. & Hovius, N. (eds.), Tectonic Faults: Agents of Change on a Dynamic Earth; Dahlem Workshop 95, Berlin, January 2005, on The Dynamics of Fault Zones. The MIT Press: Cambridge, MA, USA.
Richefeu, V., El Youssoufi, M.S., & Radjaï, F. 2006. Shear strength properties of wet granular materials. Physical Review E 73: 051304, 10.1103/PhysRevE.73.051304.
Ruina, A. 1983. Slip instability and state variable friction laws. Journal Geophysical Research 88: 10359-10370.
Scholz, C. H. 1998. Earthquakes and friction laws. Nature 391: 37-42. Sleep, N.H. 1997. Application of a unified rate and state friction theory to the mechanics of fault zones
with strain localization. Journal Geophysical Research 102: 2875-95. Song, I., Elphick, S.C., Odling, N., Main, I. G., & Ngwenya, B. T. 2004. Hydromechanical behaviour
of fine-grained calcilutite and fault gouge from the Aigion Fault Zone, Greece. Comptes Rendus Geosciences 336: 445-454, 10.1016/j.crte.2003.11.019.
Tullis, T.E. 1996. Rock friction and its implications for earthquake prediction examined via models of parkfield earthqauakes. Proc. Natl. Acad. Sci. USA 93:3803-10
Wood, D. M. 2002. Some observations of volumetric instabilities in soils. International Journal of Solids and Structures 39: 3429-3449.
Ziv, A. 2007. On the nucleation of creep and the interaction between creep and seismic slip on rate- and state-dependent faults. Geophysical Research Letters 34: 10.1029/2007GL030337.

163
Appendix B
This appendix represents work in which I am a second author, but in which I
conducted the experiments for and contributed many of the ideas. This work
considers the energy budget of earthquakes and is related to many aspects of my
thesis, especially Chapter 4. Future work is planned combining the methods of this
Appendix of measuring temperature increase and grain size reduction and the
acoustic emission to look at seismic efficiency, as is possible with the data in Chapter
4. The following manuscript will be submitted to Earth and Planetary Science Letters.
Experimental constraints on energy partitioning during stick-slip
and stable sliding within analog fault gouge
Patrick M. Fulton 1,2
Andrew P. Rathbun1
1Department of Geosciences, Pennsylvania State University, University Park, PA
16802
2College of Oceanic and Atmospheric Sciences, Oregon State University, Corvallis,
OR 97331
Abstract
The lack of substantial frictional heat anomalies across major fault zones has been a
key observation suggesting that faults support low shear stress during slip. Some
studies have suggested that the lack of large heat anomalies may be a result of
considerably less energy going to frictional heat than generally thought and that a
large fraction of energy is dissipated by other processes such as the creation of new
surface area. We evaluate this hypothesis through the analysis of 19 laboratory shear

164
experiments for both stick-slip (seismic) and stably sliding (aseismic) analog fault
gouges. These experiments differ from previous laboratory studies in that they 1)
provide independent constraints on frictional heat generation and energy consumed
generating new surface area, 2) cover a broader range of shear stresses than most
previous studies (2 – 20 MPa), and 3) evaluate both stick-slip and stable sliding
within granular material. Based on the analysis of high-precision temperature
measurements and comparisons with numerical model simulations, we show that
>90% of the total energy goes to frictional heat generation (EH) for all of our
experiments, and based on grain size analysis that ~1% of total work is consumed
generating new surface area (ESA). These results are consistent with assumptions
allowing frictional resistance to be inferred from thermal data and suggest there is no
relationship between stick-slip or stable sliding within fault gouge and large fractions
of total energy going to new surface area generation and/or small fractions to
frictional heat.
1 Introduction
Thermal data have played an important role in evaluating the mechanics of
earthquakes and faulting. The lack of large frictional heat anomalies across major
fault zones in regional heat flow data or in borehole temperature profiles that intersect
faults after a large earthquake has been one of the primary observations suggesting
that many faults support low shear stress during slip, considerably less than expected
by laboratory-derived friction laws and hydrostatic pore pressure [e.g., Brune et al.,
1969; Lachenbruch and Sass, 1980; Wang et al., 1995; Kano et al., 2006; Tanaka et

165
al., 2006]. An important assumption that allows for frictional resistance during slip to
be inferred from thermal observations is that nearly all of the dissipated energy during
fault slip goes to frictional heat generation [e.g., Brune et al., 1969; Lachenbruch and
Sass, 1980]. Figure 1 illustrates how work during slip is partitioned to elastic
radiation (e.g., seismic waves) and dissipated energy.
Total work during slip is defined by the sum of the work due to shear and the sum
of work due to slip-induced dilation or compaction. This is expressed by equation 1,
!
W = A "d# + A $ndw
0
L
% = A" 0
D
% D+ A$nL
Equation 1,
where A is the fault surface area,
!
" is the displacement-averaged shear stress in the
direction of slip, D is the total displacement, and L is the change in thickness due to
compaction or dilation during slip. The total work during slip is balanced by
dissipated energy Ef and radiated energy Ea. Elastic radiated energy Ea is related to
the stress drop during stick-slip unstable sliding and the apparent stress (a which can
be determined seismologically. It is generally considered to account for <6% of the
total work during slip [McGarr, 1999], whereas dissipated energy Ef is thought to
account for ~95% of the total work [e.g., Lachenbruch and Sass, 1980; Lockner and
Okubo, 1983]. Dissipated energy includes both frictional heat and fracture energy,
which can include work done by chemical processes, dilation, and grain rolling, in
addition to the energy consumed making new surface area through rock fracture and
grain breakage. Dissipated energy Ef is a function of the displacement-averaged
frictional resistance along the fault during slip
!
" f and cannot be directly determined

166
seismologically, although it is a critical parameter in controlling the mechanics of
fault slip.
Some studies have argued that the lack of thermal anomalies across major fault
zones may not necessarily imply that the average frictional resistance and shear stress
during slip has been low, but rather that the fraction of dissipated energy going to
frictional heat (i.e., the thermal efficiency) may be considerably less than ~90 - 95%
of the total work, and that the missing heat energy is partitioned to other processes
[e.g., Brown et al., 1998; Wilson et al., 2005]. Understanding how energy during slip
is partitioned between frictional heat, seismic radiation, and the generation of new
surface area and other processes is important not only for characterizing fault
strength, but also for our general understanding of the mechanics of earthquakes and
faulting and for assessing seismic hazard.
Here we investigate how energy is partitioned during slip through the use of
laboratory experiments of shear within analog fault gouge material. Although
laboratory experiments may be an effective way to put constraints on the energy
budget of fault slip, few experimental studies within the geosciences literature have
tried to directly constrain the amount of frictional heat generation during slip
[Lockner & Okubo, 1983; Yoshioka, 1985; Blanpied et al., 1998; Brown, 1998; Mair
& Marone, 2000] or the amount of energy consumed in generating new surface area
[e.g., Engelder et al., 1975; Yoshioka, 1986]. The few experimental studies of
thermal efficiency (i.e. the fraction of total work during slip that is spent generating
frictional heat) have generally been performed on granite slabs and the detrital
material generated during the experiment [Lockner and Okubo, 1983; Yoshioka, 1985;

167
Brown, 1998] or on stably sliding granular material [Lockner and Okubo, 1983; Mair
and Marone, 2000]. The results of these experiments have generally supported
estimates of > 90 - 95% of the total work during slip going to frictional heat
generation.
Some observations, however, have raised questions regarding our understanding
of the earthquake energy budget [e.g., Yoshioka, 1985; Brown, 1998; Mora and
Place, 1998; Wilson et al., 2005]. For example, the grain size distribution of some
natural fault gouges have been interpreted to suggest that the creation of new surface
area through grain breakage may amount to as much as 50% or more of the total work
during slip rather than ~ 1% as is more commonly thought [Wilson et al., 2005]. This
interpretation, although controversial [e.g., Chester et al., 2005; Rockwell et al.,
2009], has been used to suggest that considerably less energy goes to frictional heat
generation and may thus explain the lack of large frictional heat anomalies across
major fault zones without the need for low shear stress during slip.
Some experimental results of frictional heat generation during stick-slip
(earthquake-like) sliding of granite slabs have also suggested that thermal efficiency
may be less than conventionally thought [Yoshioka, 1985; Brown, 1998]. The
experimental results of Brown [1998] reveal a significantly large difference in the rate
of temperature rise, a proxy for frictional heat generation rate, between stick-slip and
stable sliding, suggesting a thermal efficiency ~50% for stick-slip failure rather than
>90% interpreted for stable sliding under similar stress conditions. Brown [1998]
argues that the discrepancy between stick-slip and stable sliding systems is not a
result of pulsed versus continuous heat generation, rate and state friction, or thermal

168
pressurization. It was also presumed that the generation of new surface area through
grain size reduction was negligible, based on the small amount of detrital material
between the layers after each experiment, although it was not directly verified
through analysis. The abnormal thermal efficiency in these experiments is interpreted
to only occur at normal stresses > ~ 7 MPa, and thus would explain why this behavior
was not seen in similar experiments by Lockner and Okuba [1983] which were
conducted at normal stresses < 3.45 MPa. Similar interpretations of low thermal
efficiency have also been determined within laboratory experiments of slip between
granite slabs that exhibit chaotic stick-slip behavior and stress drops that are very
large in both total magnitude (~20 MPa) and in relation to the average background
stress [Yoshioka, 1985]. These results appear to be largely a function of an absence
of abundant gouge / detrital material within the slip zone during the experiment.
Large earthquakes, however, are generally hosted within mature fault zones that have
well-established gouge zones that support slip [e.g., Scholz, 2002]. Results of
numerical models of shear within granular gouge material have suggested that grain
interactions including bouncing and rolling of grains may have a significant influence
in reducing thermal efficiency [Mora and Place, 1998], although the models do not
include the effects of grain size reduction in either consuming energy or restricting
rolling of grains. Experiments of shear heating for stably sliding (aseismic) gouge
material do not reveal low thermal efficiency [Mair and Marone, 2000].
Although interpretations of low thermal efficiency and/or large fractions of
energy consumed by grain breakage are unusual, the examples described above
illustrate a level of uncertainty in our understanding of the partitioning of energy

169
during fault slip, particularly that associated with frictional heat generation and the
generation of new surface area. These studies raise the question of whether the
creation of new surface area may be a considerably larger fraction of total energy
during stick-slip sliding than generally considered and whether this or similar
processes contribute toward significantly reducing the thermal efficiency of
earthquakes to levels ~ 50% or less, as some have hypothesized [e.g., Brown, 1998;
Wilson et al., 2005].
Here, we evaluate the partitioning of energy during slip through the analysis of 19
laboratory shear experiments of both stick-slip (seismic) and stable (aseismic) sliding
within analog fault gouge (Table 1). These experiments are particularly relevant in
that 1) they were designed such that constraints on both the amount of frictional heat
generation and energy consumed in making new surface area can be independently
determined, 2) the sliding behavior for each material used is consistently similar
between experiments, 3) they cover a greater range and magnitude of stress
conditions than most previous experiments of frictional heat generation during stick-
slip sliding, and 4) they cover both stick-slip and stable styles of sliding within analog
fault gouge, whereas previous laboratory studies of thermal efficiency have been
performed on granite slabs and the detrital material generated during the experiment
or on only stably sliding granular material [Lockner and Okubo, 1983; Yoshioka,
1985; Brown, 1998; Mair and Marone, 2000].
The objective of this study is to test the hypothesis that the generation of new
surface area through grain breakage during stick-slip sliding within fault gouge
accounts for a significantly large portion of the total energy budget during slip and

170
thus reduces the amount of energy partitioned to frictional heat. Fundamental
questions we seek to address include: 1) Does frictional heat consistently account for
~ 90% or more of the total slip energy budget for a range of different stress
conditions? 2) Is the generation of new surface area through grain breakage a large,
yet overlooked, component of the energy budget? 3) Is there a significant difference
in the partitioning of energy to frictional heat or to new surface area depending on the
mechanism of slip (stick-slip vs. stable sliding)?
In the following sections we describe our experimental setup and discuss the data
and related analysis that quantifies the amount of energy associated with stress drops,
creation of new surface area, and frictional heat for each experiment. We then
discuss how our findings address the questions above, relate to other studies of slip
energy budgets, and may help inform our understanding of earthquake mechanics.
2. Experimental Setup
Our experiments were conducted at the Penn State Rock and Sediment Mechanics
Laboratory in a servo-controlled, double-direct shear apparatus (Figure 2A, inset) at
normal stresses ranging from 5 to 50 MPa and a driving velocity of 200 !m/s for all
experiments except p1901 which was run with a driving velocity of 100 !m/s in order
to evaluate any effect on the stick-slip behavior. This velocity range produced stress
drops during stick-stick sliding experiments similar to those determined in natural
events [Allman and Shearer, 2009]. For the purposes of this study, we do not attempt
to further explore the range of driving velocities and stress drop size. Table 1 lists
many of the relevant details for each experiment. In order to evaluate differences

171
between stick-slip and stable sliding, experiments were conducted on two separate
materials with similar initial grain size distribution uniformly around 120 µm. Soda
lime glass beads which exhibit stick-slip sliding behavior were obtained from the Mo-
Sci Corporation, Rolla, Missouri and stably sliding Ottawa sand of >99% pure
angular quartz was obtained from US Silica Company, Ottawa, Illinois. By using two
granular materials with similar initial grain size, but different sliding stability, we are
able to evaluate both stick-slip and stable sliding for similar stress conditions and
loading rates without having to make ad hoc changes to the shear apparatus and
system stiffness [e.g., Brown, 1998]. For each experiment two granular layers, 2 mm
thick were sandwiched within a three-block arrangement in a manner similar to the
experiments of Mair and Marone [2000] (Figure 2A, inset). The side blocks were
held stationary and the center block was driven downward at a constant rate, causing
shear. Nominal contact area was held constant at 10 cm by 10 cm with each steel
block grooved perpendicular to the shear direction to ensure deformation happens
within the gouge zone, not at the steel-gouge interface. Most experiments were run
for ~100-140 seconds for total displacements of > 20 mm (Table 1), corresponding to
shear strain values >10. Repeat experiments were conducted with shorter
displacements so that first-order differences in energy partitioning as a function of
total displacement and grain breakage could be assessed.
To measure the thermal response of frictional heating during the experiments four
T-type thermocouples were placed inside one steel side block 3 mm, 4 mm, and 10
mm from the shear zone and with a redundant measurement at 3 mm. With the use of
amplifier circuits the thermocouples have an effective measurement precision of ~ 0.1

172
°C throughout the experiments (Figure 2A). Thermocouples were calibrated at 0 and
24 °C. Values of shear stress, normal stress, layer thickness, shear displacement and
temperature were recorded at a constant rate of 1 kHz or greater throughout each
experiment. The resulting data allow for the calculation of total work based on
Equations 1 and 2 and the summing of work during displacement by stick-slip events
and the work during displacement by creep. To account for apparatus effects we
remove displacement associated with the elastic stretching from the measured load
point displacement of the horizontal and vertical rams. Measured elastic stiffnesses
are 5 and 3.7 MN/cm for the vertical and horizontal rams, respectively. Displacement
and work during stick-slip experiments are mostly accumulated through stick-slip
(stress-drop) events, whereas stable sliding experiments they are entirely accumulated
through creep.
3 Experimental Results and Analysis
3.1 Energy associated with stress drops
Figure 2 shows results typical of one of our stick-slip sliding experiments. The
vertical width of the shear stress vs. displacement curve in Figure 2A and panels A
and B of Figure 3, reflects the magnitude of the stress drops associated with several
hundred stick-slip events recorded during each stick-slip sliding experiment. A more
detailed view of data from a typical series of stick-slip events is shown in Figure 2B.
The high-resolution of the measurements allows us to calculate the amount of energy
released by the stress drop, E*):

173
!
E"# ="#uA
2 Equation 3,
where *( is the stress drop, u is the displacement during the stress drop and A is the
rupture area which we assume to be equal to the experimental contact area. This
energy is illustrated by triangle ABC in Figure 1. Assuming a simple slip-weakening
model [e.g., Andrews, 1976] this energy would consist of a combination of seismic
radiation along with fracture energy, which is a combination of work done from grain
interactions, dilation, and the creation of new surface area. For more complex slip
weakening this estimate may not account for all the fracture energy during slip
(Figure 1) [Kanamori and Rivera, 2006]. Calculation of E)( allows for the fraction of
total energy associated with stress drops and presumably changes in overall energy
partitioning to be monitored over the duration of each experiment. The total work
during the experiments are calculated by Equation 1 where we calculate the work
done from displacement during stick-slip events as well as work done during aseismic
creep displacement.
Figure 3C shows results of these calculations for stick-slip sliding experiments
at two different applied normal stresses, p1553 with 40 MPa (blue data) and p1826
with 7.5 MPa (red data). The results of p1826 are typical of our stick-slip
experiments with normal stresses < 15 MPa; estimates of the energy associated with
the stress drop for each stick-slip event are consistently ~ 6% of the total coseismic
work. In contrast, higher stress experiments such as p1553 show a substantial change
in values over the course of the experiment, with the fraction of total coseismic work
associated with the stress drop reducing to levels considerably less than in the lower

174
stress experiments later in the experiment. The values are still consistently around
6% and less.
The changes in energy associated with stress drops during the higher stress
experiments also correspond to changes in shear stress. Figure 3A shows how after
the initial runup of shear stress for p1553, shear stress increases until ~50 s into the
experiment while the fraction of total energy associated with the stress drops
decreases due to both an increase in shear stress leading to larger total work and
smaller magnitude stress drops. In contrast, lower stress experiments such as p1828
show roughly no change in shear stress or the fraction of work associated with stress
drops after the initial shear stress runup (Figure 3B). We interpret the changes in the
higher stress experiments as a change in energy partitioning which likely results from
large amounts of grain breakage during the beginning of the high stress experiments
and reduces after a certain degree of grain size reduction. As grains fracture, the
overall grain size distribution and angularity increases, both of which promote stable
sliding, leading to an increase in friction and shear strength, as well as smaller stress
drops [e.g., Mair et al., 2002; Anthony and Marone, 2005].
Figure 4 illustrates that the amount of work done by co-seismic slip and dilation
considerably decreases at ~50 s and that stable preseismic creep begins to account for
an increasing fraction of the total work consistent with this interpretation. For the
lower stress experiments, such as p1828, the different sources of work remain at a
similar fraction throughout the experiment. For p1828 with normal stress of 7.5 MPa,
the amount of work from preseismic slip is comparable to coseismic slip. Amongst

175
the stick-slip experiments the fraction of work done by preseismic slip decreases as a
function of increasing normal stress.
3.2 Energy Consumed in Generating New Surface Area
To determine the amount of energy partitioned to the creation of new surface area
through grain size reduction, we conducted grain size analysis on post-shear material
from each experiment using a Malvern Mastersizer 2000 laser diffraction grain size
analyzer. Following standard practices, samples were sonicated to disaggregate the
particles prior to placing them into the Mastersizer and then were kept in the machine
for <1-2 minutes in order to avoid settling [e.g., Rockwell et al., 2009]. Figure 5A
shows an example of the grain size distribution of both pre- and post-shear material.
The energy consumed in creating new surface area ESA is computed using
Equation 4 [e.g., Wilson et al., 2005; Chester et al., 2005; Ma et al., 2006; Rockwell
et al., 2009],
!
ESA
= "#S Equation 4,
where * is the material specific surface energy (J/m2) and )S is the difference in
surface area (m2) between pre- and post-shear material. Quartz and soda-lime glass
have specific surface energies of 1 and 4 J/m2, respectively [Iler, 1979; Wiederhorn,
1969]. The surface area S of both pre- and post-shear sample material is computed
from grain size distribution data by:

176
!
S = R6
di
%ViV
i
" Equation 5,
where V is the total volume of the sample used during the shear experiments, ~ 1 x
10-5
m3, d and %V is the grain diameter and volume percent of for each grain size bin
i, and R is a roughness factor. Grain size distribution is measured in bins for a range
grain size diameters that increase stepwise by a factor of 1.165 from 5.82 x 10⁻⁸
m2 to
8.79 x 10⁻³
m2. Both of our sample materials have relatively uniform initial grain size
of ~1.2 x 10⁻⁴
m2 (Figure 5A). The change in surface area from the grain size
distribution data is calculated assuming the shape of each grain is spherical and
multiplying by an average grain roughness factor, R [e.g., Wilson et al., 2005; Chester
et al., 2005; Ma et al., 2006]. Grain roughness factor is poorly constrained for
pulverized material and is often assumed based on values determined for
mechanically ground material or natural field samples, which may be greatly affected
by the effects of weathering [e.g., Hochella and Banfield, 1995]. Previous studies
that have determined energy estimates from grain size distributions of natural fault
gouge have either determined or assumed values ~ 5 for grain roughness factor [e.g.,
Wilson et al., 2005; Chester et al., 2005; Ma et al., 2006]. Here, we report the results
without multiplying by a grain roughness factor because our starting materials start as
nearly-spherical grains and the degree of grain breakage and roughening is not
consistent between experiments under different stress conditions. However, for one
of the larger normal stress strike-slip experiments, p1553, an independent measure of
post-shear surface area was determined by Barrett-Emmett-Teller (BET) N2
adsorption analysis [Gregg and Sing, 1982; Hochella and Banfield, 1995].

177
Comparison of the results of this analysis with the estimate of surface area from grain
size analysis suggests a maximum grain roughness factor of ~3 for our experiments.
This result is consistent with other grain size roughness determinations for post-shear
material from laboratory experiments of stick-slip sliding [Yoshioka, 1986].
Estimates of the energy consumed by creating new surface area through grain size
reduction determined from grain size analysis, Esa, are illustrated in Figure 5B as the
fraction of total work against the average shear stress for each experiment. All of the
results are < 1% of the total work except experiment p1584, which was a repeat
experiment of p1553 performed at the same applied normal stress, but with a shorter
total displacement and slightly smaller average shear stress (Table 1). Although the
results of p1553 and p1584 with similar stress conditions, but different total
displacements support the interpretation that grain size reduction is more significant
earlier in the experiments, because the shorter displacement experiment appears to
contribute a slightly larger fraction of energy to new surface area, this result is likely
a reflection of p1584 being an outlier within the range of uncertainty in the method of
determining Esa from grain size analysis. Experiment p1562, which is also a high
stress, low-displacement experiment, does not appear to have a percent work to new
surface area estimate much different than the other experiments.
Changes in the amount of energy consumed by grain breakage, however, likely do
exist as a function of displacement during our experiments; as grain size distribution
widens, smaller particles work to buffer large ones and create complex force chains
that distribute stress leading to less fracture and probably lead to the smaller stress
drops noted above in our higher stress stick-slip experiments [e.g., Anthony et al.,

178
2005; Sammis and Ben-Zion, 2008]. These changes, if present, appear to be beyond
the resolution of our analysis here, largely due to the likely small magnitude of these
changes and the small fraction of total work the process appears to consume overall.
Based on the grain roughness estimate described above, our estimates of the
percent work consumed by the creation of new surface area (Figure 5B) may be
scaled by as much as a factor of 3. Even with this multiplication factor, these
estimates would still be consistent with most previous analyses of laboratory
experiments, natural fault gouge, and numerical models that have determined values
~1% [e.g. Chester et al., 2005; Shi et al., 2008; Rockwell et al., 2009]. In order to
obtain values as high as 50% as interpreted for fault gouge sampled from a freshly
formed fault [Wilson et al., 2005], our particle size distribution would require a
considerably large volume percent of material with particle diameters ~10-1
µm or
smaller for experiments such as p1553. Our results do not reveal much in terms of
volume fraction of grains this small for any of our experiments (e.g., Figure 5A).
3.3 Frictional Heat Generation
Unlike most previous experiments that have compared thermal efficiency
between stick-slip and stable sliding of granite slabs [Brown, 1998], our experiments
are preformed on granular gouge and cover a broad range of different stress
conditions. Figure 6 shows the rate of initial temperature rise determined for each of
our stick-slip and stable sliding experiments for the range of average shear stress
conditions covered. The results show a linear trend in the rate of initial temperature
rise as a function of average shear stress. In addition, they do not reveal any

179
significant difference between stick-slip and stable sliding for similar shear stress
conditions and loading velocity (Figure 6). These results suggest that experiments of
stable sliding and stick slip motion consistently have similar thermal efficiency as a
function of stress and for both styles of sliding.
To constrain the values of thermal efficiency during our experiments, we
compare the observed temperature signal to numerical model simulations of frictional
heating based on the shear stress and displacement data for each experiment. The
model consists of a 3D model domain representative of our three-block experiment
arrangement and contains thermal conductivity and diffusivity values appropriate for
the steel blocks and sample layers. Room temperature is set as a boundary condition
along each external face and frictional heating is prescribed within two 1 mm thick
layers, representative of our sample material undergoing shear. The volumetric
frictional heat generation rate is calculated based on the shear stress and loading rate
(constant) measured during each experiment and is updated within the model
simulations every one second of simulation time. The model simulations are run for
different thermal efficiency values from 10% of the total work going to frictional heat
to 100%. Based on comparisons between model results and observed temperatures
during stable sliding at a range of normal stresses, the model results appear to give
consistent and reasonable results. We do not attempt to resolve the thermal efficiency
to values less than 10% for several reasons – the models are simplifications of the
shear heating process and do not take into account material transport during shearing,
heterogeneity in frictional heat sources or strain localization less than 1 mm, and in
addition, the model does not account for the possibility of changes in thermal

180
efficiency during the experiment. The models, however, appear sufficiently adequate
for the purpose of testing whether frictional heat generation accounts for ~90% or
more of the total slip energy or ~50%.
For both stick-slip and stable sliding a comparison between simulated
temperatures and the observed temperatures within the side block consistently support
the interpretation of ~90% or more of the total work during slip going to frictional
heat generation as opposed to ~50% (e.g. Figure 6 inset). In the higher stress
experiments, such as p1553, a subtle change in the temperature rise pattern that
deviates from the pattern predicted by the models is apparent at ~50 s (Figure 2 and
Figure 6 inset). It is unclear whether this pattern reflects complexities not accounted
for in the model or rather a small (<10%) change in thermal efficiency during the
experiment. This transition also appears to correspond to the cessation in the rise of
shear stress associated with grain fracture (e.g., Figure 3) and changes in energy
associated with stress drops, which encourages us to make the latter interpretation
suggesting a subtle change in thermal efficiency.
4. Discussion and Conclusions
The objective of this study was to determine whether frictional heat consistently
accounted for ~ 90% of the total slip energy during both stick-slip and stable sliding
of granular material analogous to fault gouge for a range of stress conditions and
whether the energy consumed in making new surface area through grain breakage
was a significantly larger component of the energy budget then generally thought.
We find roughly equivalent rates of temperature rise between stick-slip and stable

181
sliding for all stress conditions evaluated, from an average initial shear stress of 2 to
21 MPa, implying that there is not a considerable difference in thermal efficiency
between styles of sliding and no significant change as a function of average shear
stress. In addition, comparison of the observed temperature signals during
experiments with numerical models of heat transfer based on the stress and
displacement data suggest the observed heat signals for both sliding styles are most
consistent with thermal efficiency values ~90% or greater.
This determination of large thermal efficiency during stick-slip sliding is
consistent with analysis of exhumed pseudotachylite-bearing fault rocks and
numerical simulations of fault rupture processes [Pittarello et al., 2008; Shi et al.,
2008]. Similar values have also been indirectly inferred based on constraints for
other significant components to the earthquake energy budget that suggest <~6% of
the slip energy goes toward seismic radiation [McGarr, 1999] and <~1% to the
creation of new surface area through grain breakage [Engelder et al., 1975; Yoshioka,
1986; Chester et al., 2005; Rockwell et al., 2009].
The results of our analysis also suggest that the generation of new surface area
through grain breakage does not consume a significantly large fraction of the total
slip energy. Estimates of new surface area, determined by both grain size analysis
and gas absorption methods correspond to ~ 1% of the total work due to slip. We
find only a small fraction of total energy is being consumed in making new surface
area, which is consistent with previous determinations based on both laboratory and
field data [e.g., Engelder et al., 1975; Yoshioka, 1986; Chester et al., 2005; Rockwell
et al., 2009], as well as estimates of fracture energy inferred from models of ground

182
motion waveforms [Tinti et al., 2005] and numerical models of rupture mechanics
[Shi et al., 2009]. These results, however, are in marked contrast to the
interpretations of fault gouge by Wilson et al. [2005] that suggest values ~50% of the
total slip energy. One possible explanation for the discrepancy with Wilson et al.’s
unusually large estimate is that this value was determined based on gouge from the
1997 M 3.7 Bosman earthquake that ruptured through intact rock creating a new fault
zone. In the present study, we have focused on the energetics of slip within fault
gouge, similar to how we expect most large earthquakes to be supported by existing
fault zones within established gouge zones.
Overall, our interpretations of energy partitioning during stick-slip sliding are
consistent between each independently constrained quantity of the energy budget. In
our experiments >90% of the total energy appears to go to frictional heat generation
(EH), ~1% to generating new surface area (ESA), and ~4% associated with the stress
drop (E)(), which may include energy that contributes to grain breakage in addition to
the elastic radiation. The results suggest that for these experiments nearly all of the
dissipated energy during slip (i.e., total work minus elastic radiation) goes to
frictional heat generation. This supports the assumption used in interpreting thermal
data along major active fault zones in terms of frictional resistance during slip,
although we note that directly relating our laboratory results to earthquake mechanics
is not trivial since our experiments do not include many temperature-related processes
including co-seismic chemical alteration and dynamic weakening due to thermal
pressurization that may be active during natural earthquakes [e.g., Andrews, 2002;
Hamada and Hirona, 2010]. Our results do, however, suggest that there is not a

183
fundamental relationship between stick-slip or stable sliding within fault gouge and
large fractions of energy consumed in the generation of new surface area and/or low
thermal efficiency.
Acknowledgements
Grain size analysis and N2 BET measurements were conducted at the Materials
Characterization Lab, Penn State University.
References
Allmann, B. P., and P. M. Shearer (2009), Global variations of stress drop for
moderate to large earthquakes, J. Geophys. Res., 114, B01310,
doi:10.1029/2008JB005821.
Brown, S. R. (1998), Frictional heating on faults: Stable sliding versus stick slip, J.
Geophys. Res., 103, 7413–7420, doi:10.1029/98JB00200.
Chester, J. S., F. M. Chester, and A. K. Kronenberg (2005), Fracture surface energy
of the Punchbowl fault, San Andreas system, Nature, 437, 133–136,
doi:10.1038/nature03942.
Engelder, J.T., Logan, J.M., and Handin, J. (1975), The sliding characteristics of
sandstone on quartz fault-gouge, Pure Appl. Geophys., 113, 69-86.
Gregg, S. J. & Sing, K. S. W. (1982), Adsorption, Surface Area and Porosity,
Academic, London.

184
Hochella, M.F., Jr. and J. Banfield (1995), Chemical weathering of silicates in nature:
A microscopic perspective with theoretical considerations, Rev. Mineral., 31, pp.
353–406.
Iler, R.K. (1979), The Chemistry of Silica, Wiley, New York.
Kano, Y., J. Mori, R. Fujio, H. Ito, T. Yanagidani, S. Nakao, and K.-F. Ma (2006),
Heat signature on the Chelungpu fault associated with the 1999 Chi-Chi, Taiwan
earthquake, Geophys. Res. Lett., 33, L14306, doi:10.1029/2006GL026733.
Lachenbruch, A. H., and J. H. Sass (1980), Heat flow and energetics of the San
Andreas fault zone, J. Geophys. Res., 85, 6185–6222,
doi:10.1029/JB085iB11p06185.
Lockner, D., and P. Okubo (1983), Measurements of frictional heating in granite, J.
Geophys. Res., 88, 4313–4320, doi:10.1029/JB088iB05p04313.
Mair, K., and C. Marone (2000), Shear heating in granular layers, Pure Appl.
Geophys., 157, 1847–1866, doi:10.1007/PL00001064.
McGarr, A. (1999), On relating apparent stress to the stress causing earthquake fault
slip, J. Geophys. Res., 104(B2), 3003-3012, doi:10.1029/1998JB900083.
Pittarello, L., G. Di Toro, A. Bizzarri, G. Pennacchioni, J. Hadizadeh, and M. Cocco
(2008), Energy partitioning during seismic slip in pseudotachylyte-bearing faults
(Gole Larghe Fault, Adamello, Italy), Earth. Planet. Sci. Lett., 269, 131–139,
doi:10.1016/j.epsl.2008.01.052.
Rockwell, T., M. Sisk, G. Girty, O. Dor, N. Wechsler, and Y. Ben-Zion (2009),
Chemical and physical characteristics of pulverized Tejon Lookout Granite

185
adjacent to the San Andreas and Garlock faults: Implications for earthquake
physics, Pure Appl. Geophys., 166, doi:10.1007/s00024-009-0514-1.
Shi, Z., Y. Ben-Zion, and A. Needleman (2008), Properties of dynamic rupture and
energy partition in a solid with a frictional interface, J. Mech. Phys. Solids, 56, 5–
24, doi:10.1016/j.jmps.2007.04.006.
Wang, K., T. Mulder, G. C. Rogers, and R. D. Hyndman (1995), Case for very low
coupling stress on the Cascadia subduction fault, J. Geophys. Res., 100(B7),
12,907–12,918.
Wilson, B., T. Dewers, Z. Reches, and J. Brune (2005), Particle size and energetics of
gouge from earthquake rupture zones, Nature, 434, 749–752,
doi:10.1038/nature03433.
Yoshioka, N. (1985), Temperature Measurements during Frictional Sliding of Rocks,
J. Phys. Earth, 33, 295–322.
Yoshioka, N. (1986), Fracture energy and the variation of gouge and surface
roughness during frictional sliding of rocks, J. Phys. Earth, 34, 335–355.

186
Figure 1: The total work per unit area of fault during a stick-slip event. The total
work is defined by Equation 1 and represented by the total area shown in the
figure. The bold line represents the shear stress felt by the fault during slip based
on an idealized simple slip-weakening model [e.g., Andrews, 1976]. The dashed
curve illustrates how this slip-weakening may be considerably more complex.
The area beneath the slip-weakening curve represents the dissipated energy which
is made of frictional heat EH, and fracture energy EG consisting of energy making
new surface area ESA and may also include additional energy consumed by
dilation, grain rolling and other grain interactions. The difference in total and
dissipated energy is released as elastic radiation ER.

187
Figure 2: Representative data measured during a high normal stress shear
experiment. Panel A illustrates the three-block double direct shear arrangement
and a temperature measurement from a thermocouple 3 mm from the sliding
surface and shear stress for a stick-slip sliding experiment. The width of the shear
stress curve illustrates the magnitude of stress drops during stick-slip events. The
arrow points to the location of subsample of typical stick-slip events shown in
detail in Panel B. The elastic stretching of the apparatus is removed from the load
point displacement curve to produce the fault displacement, as described in the
text.
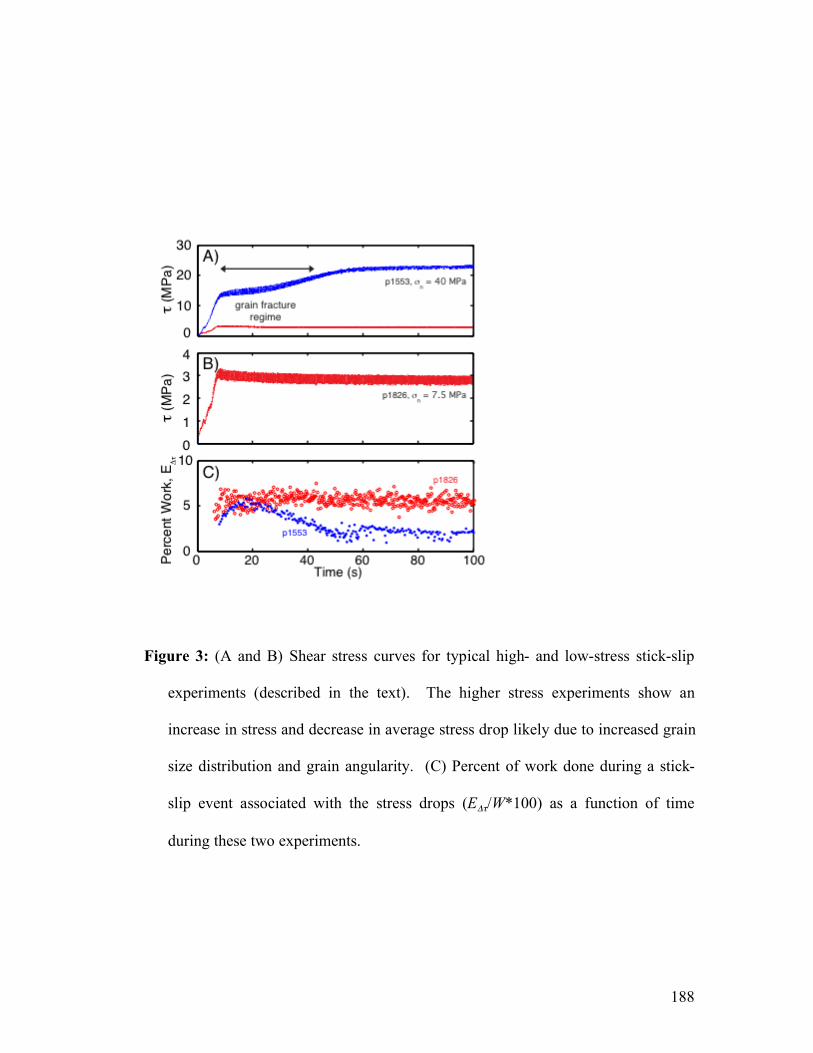
188
Figure 3: (A and B) Shear stress curves for typical high- and low-stress stick-slip
experiments (described in the text). The higher stress experiments show an
increase in stress and decrease in average stress drop likely due to increased grain
size distribution and grain angularity. (C) Percent of work done during a stick-
slip event associated with the stress drops (E)(/W*100) as a function of time
during these two experiments.

189
Figure 4: The relative source of work as a percentage for each stick-slip event during
a typical high- (panel A) and low-stress (panel B) stick-slip experiment, as
defined in the text. For each event the total work includes the work due to co-
seismic slip (closed blue circles) and dilation/compaction (green open circles) and
pre-seismic creep (red x’s).

190
Figure 5: (A) Typical results of grain size analysis and on pre-shear (dashed curve)
and post-shear (solid curve) sample material for our stick-sliding material. The
stably sliding material has a similar initial pre-shear grain size distribution. (B)
Percent of the total work during the experiment estimated to be consumed
creating new surface area (ESA/Wtotal*100) for each experiment versus the average
shear stress. The estimates presented assume spherical grains or a roughness
factor R equal to 1. The scatter in data is likely a reflection of methodological
uncertainty.

191
Figure 6: The rate of initial temperature rise is plotted against the average shear
stress each calculated during a 10 second interval after the initial runup in shear
stress for each experiment. Stick-slip experiments (red circles) and stable-sliding
experiments (blue X’s) both show linear trends that do not significantly differ for
each other suggesting consistent values of thermal efficiency for both styles of
sliding at a range of shear stress conditions. The inset shows an example
temperature record compared with numerical models of temperature rise. The
models consistently suggest that 90% or more of the total work during each
experiment goes to frictional heat (EH/Wtotal*100) rather than smaller values such
as 50%.

192
Table 1: Experiment Table. Stable sliding and stick-slip experiments are conducted on soda-lime glass beads and Ottawa sand, respectively.
Experiment Normal Stress
(MPa)
Average Shear
Stress (MPa)
Sliding Style
Displacement (mm)
p1492 10 3.1 Stable 28
p1493 5 6.6 Stable 28
p1510 15 5.2 Stick-slip 28
p1515 5 1.9 Stick-slip 22
p1516 10 3.8 Stick-slip 21
p1518 25 9.1 Stick-slip 21
p1552 10 3.8 Stick-slip 21
p1553 40 18.7 Stick-slip 21
p1562 50 15.4 Stick-slip 7
p1563 20 7.5 Stick-slip 21
p1564 27 15.7 Stable 21
p1580 20 12.1 Stable 21
p1581 30 13.5 Stick-slip 21
p1582 33.3 19.5 Stable 21
p1583 8.3 4.9 Stable 21
p1584 40 13.9 Stick-slip 8
p1826 7.5 2.8 Stick-slip 21
p1828 25 9.7 Stick-slip 21
p1829 16 9.9 Stable 21

193
Appendix C: Matlab codes
1. Stick slip picker
Code to pick stick slips. Input is a text file. The user updates terms in the first section
and the rest of the code runs. The user defines and window size of how many points
to consider at a time, and a tolerance or how big of a change in shear stress in that
window. If the change exceeds the tolerance a stick slip is picked. The code outputs 9
plots, shown as Figures 1-9, and a text file. The given code is for experiment p1553.
clear all
close all
%%%%%%%%%%%%%%%%%%%%%%%%%%%%%%%%%%%%%%%%%
% Code to pick stick slip and calc energy %
% %
% A. Rathbun June 16th 2008 various updates %
% Version June 24 2010 %
%%%%%%%%%%%%%%%%%%%%%%%%%%%%%%%%%%%%%%%%%
%%%%%%%%%%%%%%%%%%%%%%%%%%%%%%%%%%%%%%%%%
% %
% User defined variables will change these for each experiment %
% %
%%%%%%%%%%%%%%%%%%%%%%%%%%%%%%%%%%%%%%%%%
record=1000; %Recording rate (Hz);
name='p1553'; %Experiment number
normstress = 40; %Normal Stress
velocity = 200; %Velocity
experiment = load ('../../p1553.txt');
window=50; % How many records to consider when looking for stickslips
tolerence=0.5; % Tolerance for picking stick-slips. This will take them if
% stress drop is greater than 0.5 MPa
begin=8; %Time to start looking at stick slips around
%8 seconds into the experiment for p1553
plotter='y'; % Bool variables to plot stick slips y to plot
%if plotter = 'y' calc must ='y'
saver='y'; % Save data file y to save
calc='y'; % Calculate parameters y to calculate
layertrend='n'; %Take out trend in layer?
area = 0.1 ; %m2

194
%%%%%%%%%%%%%%%%%%%%%%%%%%%%%%%%%%%%%%%%%
% %
% Load the experiment and set up parameters %
% %
%%%%%%%%%%%%%%%%%%%%%%%%%%%%%%%%%%%%%%%%%
rec = experiment(:,1); % Load data
lp_disp = experiment(:,2);
shear_stress = experiment(:,3);
layer = experiment(:,4);
%norm = experiment(:,5);
time = experiment(:,6);
friction = experiment(:,7);
%strain = experiment(:,8);
ec_disp = experiment(:,9);
%T1 = experiment(:,10); T2 = experiment(:,11);
%T3 = experiment(:,12); T4 = experiment(:,13);
clear experiment %Clear big variable for memory
posit = find(time<100);
othertime=time(posit);
%%%%%%%%%%%%%%%%%%%%%%%%%%%%%%%%%%%%%%%%%
% %
% Loop to pick stickslips, takes the rec of the event from the %
% tolerance between a max and a min over the window, then uses that %
% record to find tike, disp, stess, friction, save data if set above %
% %
%%%%%%%%%%%%%%%%%%%%%%%%%%%%%%%%%%%%%%%%%
count=1; % Counter for populating vectors each count will be one stick slip
finish=floor(length(time)/window)*window-window; %Find the end of the data
start=begin*record; %offset to the portion you want to start looking at.
for i=start:window:finish; %Loop to find stick slips
[temptop,temprec1]=max(shear_stress(i:i+window)); %[max/min, position]
[tempbottom,temprec2]=min(shear_stress(i:i+window)); % Looks at shear
%stress and takes the max and min over the window. Stores these in
%temp variables. Will be stored if max-min exceeds the user tolerence
diff=temptop-tempbottom;
if diff > tolerence % Store data if the condition is meet
b(count)=temprec1; %Store the position of the max

195
d(count)=temprec2; %min
b(count)=b(count)+i-1; %Change to real position not just in each
d(count)=d(count)+i-1; %iteration of i, a dumby variable.
avestress(count)=mean(shear_stress(i:i+window));
count=count+1; %Update counter, counts each stickslip, starts at 1.
end
end
if layertrend == 'y'
a=polyfit(othertime, layer(1:length(othertime)),1);
d_y = polyval(a,othertime);
aver=mean(d_y);
for count = 1:length(othertime);
layer(count)=layer(count)-d_y(count)+aver;
end
end
%newy=layer(1:length(othertime))- d_y;% + mean(d_y);
%layer = newy;
% plotyy(othertime, layer(1:length(othertime)), othertime,
% shear_stress(1:length(othertime)))
% plot(othertime,d_y, othertime,layer(1:length(othertime)),
% othertime,newy);
for counter=1:length(d);
stickslip(counter,1)=rec(b(counter)); %Rec at peak
stickslip(counter,2)=rec(d(counter)); %Rec at min
stickslip(counter,3)=time(b(counter));
stickslip(counter,4)=time(d(counter));
stickslip(counter,5)=shear_stress(b(counter));
stickslip(counter,6)=mean(shear_stress(d(counter):d(counter)+20));
stickslip(counter,7)=friction(b(counter));
stickslip(counter,8)=mean(friction(d(counter):d(counter)+20));
stickslip(counter,9)=ec_disp(b(counter));
stickslip(counter,10)=mean(ec_disp(d(counter):d(counter)+20));
layerbefore(counter)=layer(b(counter));
layerafter(counter)=mean(layer(d(counter):d(counter)+20));
stickslip(counter,11)=layerbefore(counter);
stickslip(counter,12)=layerafter(counter);
end
% Use the stored positions to make a master variable to be saved
%stickslip(:,1)=rec(b); %Rec at peak
%stickslip(:,2)=rec(d); %Rec at min
%stickslip(:,3)=time(b); %Time at peak

196
%stickslip(:,4)=time(d); %Time at min
%stickslip(:,5)=shear_stress(b); %Stress at peak
%stickslip(:,6)=shear_stress(d); %Stress at min
%stickslip(:,7)=friction(b); %friction at peak
%stickslip(:,8)=friction(d); %friction at min
%stickslip(:,9)=ec_disp(b); %Displacement at peak
%stickslip(:,10)=ec_disp(d+3); %Displacement at min
dummytime=time(d+3); %Time for articical displacement
fname=strcat(name,'stickslips.txt'); %user defined experiment name above
if saver == 'y'
save (fname, 'stickslip', '-ASCII', '-tabs')
Output=strvcat('Data saved to file:',fname)
else
'No file created'
end
%%%%%%%%%%%%%%%%%%%%%%%%%%%%%%%%%%%%%%%%%
% %
% Calculated parameters %
% messes up the last stick slip so that dimesions will agree %
% %
%%%%%%%%%%%%%%%%%%%%%%%%%%%%%%%%%%%%%%%%%
if calc == 'y'
for n=1:length(stickslip)-1;
totalslip(n)=stickslip(n+1,9)-stickslip(n,9);
recurrence(n)=stickslip(n+1,3)-stickslip(n,3);
stressdrop(n)=stickslip(n,5)-stickslip(n,6);
seis(n)=stickslip(n,10)-stickslip(n,9);
layerchange(n)=layerbefore(n)-layerafter(n);
end
preseis = totalslip-seis;
seisenergy=1/2*stressdrop/1000/1000.*seis*1000*1000; %Joules/m2
Es_v = seisenergy./layerafter(1:length(layerafter)-1);
Es_a = seisenergy *area;
totenergy=avestress(1:length(avestress)-1)/1000/1000.*totalslip...
*1000*1000; %Joules
W_v=totenergy./layerafter(1:length(layerafter)-1);
W_a=totenergy*area;
percentseis=seisenergy./totenergy*100; %No units
layerenergy=normstress/1000/1000*layerchange*1000*1000;
Wl_v = layerenergy./layerafter(1:length(layerafter)-1);
Wl_a = layerenergy*area;

197
perct_tot = Es_v./(W_v + Wl_v)*100;
else
'No calculations completed'
end
%%%%%%%%%%%%%%%%%%%%%%%%%%%%%%%%%%%%%%%%%
% %
% Plotting -turn into functions if computer run time takes too long %
% %
%%%%%%%%%%%%%%%%%%%%%%%%%%%%%%%%%%%%%%%%%
if plotter == 'y' & calc == 'y'
figure(1)
subplot(3,1,1)
plot(stickslip(1:length(stickslip)-1,3),stressdrop, '.')
xlim([0,100]); xlabel('Time at event (s)'); ylabel('Stress Drop (MPa)')
title(['Experiment ', name,' \sigma_n = ',num2str(normstress),'MPa',...
' v =', num2str(velocity), '\mum/s'])
subplot(3,1,3)
plot(time,shear_stress)
xlim([0,100]); xlabel('Time (s)'); ylabel('Shear Stress(MPa)')
subplot(3,1,2)
plot(stickslip(1:length(stickslip)-1,3),recurrence, '.')
xlim([0,100]); ylim([0, 1]);
xlabel('Time at event (s)'); ylabel('Recurrence(s)')
plotname = strcat(name,'F1');
hgsave(plotname)
figure(2)
plot(stickslip(:,3),stickslip(:,5),'rx',stickslip(:,4)...
,stickslip(:,6),'go', time,shear_stress)
legend('Peaks','Troughs', 4); xlim([0,100]);
xlabel('Time (s)'); ylabel('Shear Stress(MPa)')
title(['Experiment ', name,' \sigma_n = ',num2str(normstress),'MPa',...
' v = ', num2str(velocity), '{\mu}m/s'])
plotname = strcat(name,'F2');
hgsave(plotname)
%stickslip(:,4)
figure(3)
plot(stickslip(:,3),stickslip(:,9),'rx',dummytime...
,stickslip(:,10),'go', time,ec_disp)
legend('Peaks','Troughs', 4); xlim([0,100]);
xlabel('Time (s)'); ylabel('Elastic Corrected Displacement ({\mu}m)')

198
title(['Experiment ', name,' \sigma_n = ',num2str(normstress),'MPa',...
' v = ', num2str(velocity), '{\mu}m/s'])
plotname = strcat(name,'F3');
hgsave(plotname)
figure(4)
subplot(4,1,1)
plot(stickslip(1:length(stickslip)-1,3),seis, '.')
xlim([0,100]); ylim([-10 150]);
xlabel('Time at event (s)'); ylabel({'Seismic Slip ({\mu}m)'})
title(['Experiment ', name,' \sigma_n = ',num2str(normstress),'MPa',...
' v = ', num2str(velocity), '{\mu}m/s'])
subplot(4,1,2)
plot(stickslip(1:length(stickslip)-1,3),totalslip,'.')
hold on
stem(stickslip(1:length(stickslip)-1,3),preseis,'r.')
xlim([0,100]);ylim([-10 150]); legend ('Total','Preseismic')
xlabel('Time at event (s)'); ylabel('Total Slip ({\mu}m)')
hold off
subplot(4,1,3)
plot(stickslip(1:length(stickslip)-1,3),layerchange, '.')
xlim([0,100]);ylim([0 10]);
xlabel('Time at event (s)'); ylabel({'{\Delta}Layer ({\mu}m)'})
subplot(4,1,4)
plot(time,shear_stress)
xlim([0,100]); xlabel('Time (s)'); ylabel('Shear Stress(MPa)')
plotname = strcat(name,'F4');
hgsave(plotname)
figure(5)
subplot(4,1,1)
plot(stickslip(1:length(stickslip)-1,3),seisenergy, '.')
xlim([0,100]);
xlabel('Time at event (s)'); ylabel({'Seismic Energy, E_s (J/m2)'})
title(['Experiment ', name,' \sigma_n = ',num2str(normstress),'MPa',...
' v = ', num2str(velocity), '{\mu}m/s'])
subplot(4,1,2)
plot(stickslip(1:length(stickslip)-1,3),totenergy,'.')
xlim([0,100]);
xlabel('Time at event (s)'); ylabel('Total Work, W_{tot} (J/m2)')
subplot(4,1,3)
plot(stickslip(1:length(stickslip)-1,3),layerenergy,'.')
xlim([0,100]);ylim([0 500])
xlabel('Time at event (s)'); ylabel('Layer Work (J/m2)')
subplot(4,1,4)
plot(stickslip(1:length(stickslip)-1,3),percentseis,'.')

199
xlim([0,100]); ylim([0,10]);
xlabel('Time at event (s)'); ylabel('E_s/W_{tot}*100')
plotname = strcat(name,'F5');
hgsave(plotname)
figure(6)
subplot(4,1,1)
plot(stickslip(1:length(stickslip)-1,3),Es_v, '.')
xlim([0,100]);
xlabel('Time at event (s)'); ylabel({'Seismic Energy, E_s (J/m3)'})
title(['Experiment ', name,' \sigma_n = ',num2str(normstress),'MPa',...
' v = ', num2str(velocity), '{\mu}m/s'])
subplot(4,1,2)
plot(stickslip(1:length(stickslip)-1,3),W_v,'.')
xlim([0,100]);
xlabel('Time at event (s)'); ylabel('Total Work, W_{tot} (J/m3)')
subplot(4,1,3)
plot(stickslip(1:length(stickslip)-1,3),Wl_v,'.')
xlim([0,100]);ylim([0 0.2])
xlabel('Time at event (s)'); ylabel('Layer Work (J/m3)')
subplot(4,1,4)
plot(stickslip(1:length(stickslip)-1,3),percentseis,'.')
xlim([0,100]); ylim([0,10]);
xlabel('Time at event (s)'); ylabel('E_s/W_{tot}*100')
plotname = strcat(name,'F6');
hgsave(plotname)
figure(7)
subplot(4,1,1)
plot(stickslip(1:length(stickslip)-1,3),Es_a, '.')
xlim([0,100]);
xlabel('Time at event (s)'); ylabel({'Seismic Energy, E_s (J)'})
title(['Experiment ', name,' \sigma_n = ',num2str(normstress),'MPa',...
' v = ', num2str(velocity), '{\mu}m/s'])
subplot(4,1,2)
plot(stickslip(1:length(stickslip)-1,3),W_a,'.')
xlim([0,100]);
xlabel('Time at event (s)'); ylabel('Total Work, W_{tot} (J)')
subplot(4,1,3)
plot(stickslip(1:length(stickslip)-1,3),Wl_a,'.')
xlim([0,100]);ylim([0 50])
xlabel('Time at event (s)'); ylabel('Layer Work (J)')
subplot(4,1,4)
plot(stickslip(1:length(stickslip)-1,3),percentseis,'.')
xlim([0,100]); %ylim([0,10]);
xlabel('Time at event (s)'); ylabel('E_s/W_{tot}*100')

200
plotname = strcat(name,'F7');
hgsave(plotname)
figure(8)
subplot(3,1,1)
plot(stickslip(1:length(stickslip)-1,3),Es_v, '.')
xlim([0,100]); ylim([0 0.1]);
xlabel('Time at event (s)'); ylabel({'Seismic Energy, E_s (J/m3)'})
title(['Experiment ', name,' \sigma_n = ',num2str(normstress),'MPa',...
' v = ', num2str(velocity), '{\mu}m/s'])
subplot(3,1,2)
plot(stickslip(1:length(stickslip)-1,3),W_v + Wl_v,'.')
xlim([0,100]);
xlabel('Time at event (s)'); ylabel('W_{tot} + W_{comp} (J/m3)')
subplot(3,1,3)
plot(stickslip(1:length(stickslip)-1,3),perct_tot,'.')
xlim([0,100]); ylim([0,10]);
xlabel('Time at event (s)'); ylabel('E_s/(W_{tot} + W_{comp})*100')
plotname = strcat(name,'F8');
hgsave(plotname)
figure(9)
plot(othertime,layer(1:length(othertime)), stickslip(:,3), ...
layerbefore, 'o', stickslip(:,4), layerafter, 'x')
xlabel('Time (s)'); ylabel('Layer Thickness (microns)');
title(['Experiment ', name,' \sigma_n = ',num2str(normstress),'MPa',...
' v = ', num2str(velocity), '{\mu}m/s'])
plotname = strcat(name,'F9');
hgsave(plotname)
else
'No plotting'
end

201
Figure 1. Stress drop, recurrence interval and shear stress against time.
Figure 2. Stress against time for the experiment with the picks that the code takes as
the peak and trough.

202

203

204
2. Creep rate calculator
clear all
close all
%%%%%%%%%%%%%%%%%%%%%%%%%%%%%%%%%%%%%%%%%
% Written by Andy Rathbun, Jun 24 2005
% Line Fitting Program to Read in and Calculate Strain Rate and
% Stress Exponent
%%%%%%%%%%%%%%%%%%%%%%%%%%%%%%%%%%%%%%%%%
p758=dlmread('/barre/s0/data/p758/p758.txt',' ');
shear_stress=p758(:,3)'; %MPa
time=p758(:,7)'; % Sec
strain=p758(:,5)';
name='p758';
clear p758
%%%%%%%%%%%%%%%%%%%%%%%%%%%%%%%%%%%%%%%%%
%inputs: Row number of the start and end of each disp
tau=[1502 2856; 2858 4211; 4214 5642; 5644 6996; 6998 8457; 8459 9811; ...
9813 10053];
stress=[0.435 0.462 0.488 0.515 0.541 0.567 0.593];
s_tau=[1502 2856; 2858 4211; 4214 5642; 5644 6996; 6998 8457; 8459 9811];
%Stable stresses that
%shold be fit
s_stress=[0.435 0.462 0.488 0.515 0.541 0.567];
strength=0.61658; %Shear stress at the end of the run in (MPa)
normstress=1.001; %MPa
%stress=stress/strength; %Normalize shear stress
number=length(s_stress); %Number of stress intervals, subrtact 1 to keep out
%the tertiary unstable stress step
samplinginterval=10; %Samples/sec
decimation=20; %Decimation times
samp_sec=samplinginterval/decimation; %New samples per sec
min=2; %Input the number of minutes for your fit
min=min*60; %Convert to sec
points=min*samp_sec;
t1=20*60*samp_sec; t2=40*60*samp_sec; %Times for each fit to start In this
%case it is
%20 min, 40 min and the min interval before the end of timing for each stress
%%%%%%%%%%%%%%%%%%%%%%%%%%%%%%%%%%%%%%%%%

205
%Fitting section
i=1;
p1=[2,number];
p2=[2,number];
p3=[2,number];
A=[2,number];
B=[2,number];
sigmaY=[2,number];
sigmaA=[2,number];
sigmaB=[2,number];
for k=1:number
for counter=(s_tau(k,1)):1:(s_tau(k,1)+points)
j1=counter+t1;
x(i) = time(j1);
y(i) = strain(j1);
j2=counter+t2;
x2(i) = time(j2);
y2(i) = strain(j2);
i=i+1;
end
i=1;
format short
q=polyfit(x,y,1);
p1(1,k)=q(1,1);
p1(2,k)=q(1,2);
q2=polyfit(x2,y2,1);
p2(1,k)=q2(1,1);
p2(2,k)=q2(1,2);
%%%%%%%%%%%%%%%%%%%%%%%%%%%%%%%%%%%%%%%%%
% My calculation of slope (B), intercept (A) and error (sigma)
% Makes a 2 by number matrix for A,B,sigmaY,sigmaA,sigmaB
% Top row is 20 m, bottom is 40 m
%%%%%%%%%%%%%%%%%%%%%%%%%%%%%%%%%%%%%%%%%
N=length(x);
N2=length(x2);
sumX=sum(x);
sumX2=sum(x2);
sumY=sum(y);
sumY2=sum(y2);
sumXsq=sum(x.*x);
sumX2sq=sum(x2.*x2);
sumXY=sum(x.*y);
sumXY2=sum(x2.*y2);

206
delta=N*sumXsq-sumX^2;
delta2=N2*sumX2sq-sumX2^2;
A(1,k)=(sumXsq*sumY-sumX*sumXY)/delta; %intercept 20m
B(1,k)=(N*sumXY-sumX*sumY)/delta; %slope 20 m
A(2,k)=(sumX2sq*sumY2-sumX2*sumXY2)/delta; %intercept 40m
B(2,k)=(N2*sumXY2-sumX2*sumY2)/delta2; %slope 40 m
sigmaY(1,k)=sqrt((1/(N-2))*sum((y-A(1,k)-B(1,k)*x).^2));
%Caclulated error in y comes from residuals
%sigmaY(1,k)=.00004; %My estimate of error in y to use instead
sigmaA(1,k)=sigmaY(1,k)*sqrt(sumXsq/delta); % + - value of intercept
sigmaB(1,k)=sigmaY(1,k)*sqrt(N/delta); %+ - value of slope
sigmaY(2,k)=sqrt((1/(N2-2))*sum((y2-A(2,k)-B(2,k)*x2).^2));
%sigmaY(2,k)=.00004;
sigmaA(2,k)=sigmaY(2,k)*sqrt(sumX2sq/delta2);
sigmaB(2,k)=sigmaY(2,k)*sqrt(N2/delta2);
%%%%%%%%%%%%%%%%%%%%%%%%%%%%%%%%%%%%%%%%%
f1=polyval(q,x);
figure()
subplot(2,1,1)
plot(x,y*100,'o',x,f1*100)
xlim([x(1,1), max(x)])
title(['20 min after step ',num2str(min/60),...
' min fit \tau = ', num2str(s_stress(k)), ' MPa'])
ylabel('Percent Strain')
plusminus=sigmaB(1,k);
if q(1,1)<0
stringmatrix(1,1:5)='Data ';
stringmatrix(2,1:9)=num2str(q(1,1),'%2.2e');
stringmatrix(2,10:12)='\pm';
stringmatrix(2,13:19)=num2str(plusminus,'%2.1e');
legend(stringmatrix,-1)
else
stringmatrix(1,1:5)='Data ';
stringmatrix(2,1:8)=num2str(q(1,1),'%2.2e');
stringmatrix(2,9:11)='\pm';
stringmatrix(2,12:18)=num2str(plusminus,'%2.1e');
legend(stringmatrix,-1)
end
clear stringmatrix
f2=polyval(q2,x2);
subplot(2,1,2)
plot(x2,y2*100,'o',x2,f2*100)
xlim([x2(1,1), max(x2)])
207
title(['40 min after step ',num2str(min/60),...
' min fit \tau = ', num2str(s_stress(k)), ' MPa'])
ylabel('Percent Strain')
plusminus=sigmaB(2,k);
if q2(1,1)<0
stringmatrix(1,1:5)='Data ';
stringmatrix(2,1:9)=num2str(q2(1,1),'%2.2e');
stringmatrix(2,10:12)='\pm';
stringmatrix(2,13:19)=num2str(plusminus,'%2.1e');
legend(stringmatrix,-1)
else
stringmatrix(1,1:5)='Data ';
stringmatrix(2,1:8)=num2str(q2(1,1),'%2.2e');
stringmatrix(2,9:11)='\pm';
stringmatrix(2,12:18)=num2str(plusminus,'%2.1e');
legend(stringmatrix,-1)
end
clear stringmatrix
% stringmatrix(1,1:5)='Data ';
% stringmatrix(2,1:8)=num2str(q2(1,1),'%2.2e');
% stringmatrix(2,9:11)='\pm';
% stringmatrix(2,12:18)=num2str(sigmaB(2,k),'%2.1e');
% legend(stringmatrix,-1)
ii=1;
clear xax
clear yax
for ploter=s_tau(k,1):1:s_tau(k,2)
xax(ii)=time(ploter);
yax(ii)=strain(ploter);
ii=ii+1;
end
figure()
plot(x,f1*100,'xg',x2,f2*100,'xk',xax,yax*100)
title(['Fits and strain \tau = ', num2str(s_stress(k)),...
' MPa']), ylabel('Percent Strain')
xlabel('Time (s)')
legend('20 min', '40 min', 'Entire Stress Step',4)
xlim([xax(1,1), max(xax)])
end
regres1=polyfit(log10(s_stress),log10(p1(1,:)),1);
%Fits the data points of stress
regres2=polyfit(log10(s_stress),log10(p2(1,:)),1);

208
%and strain rate to find n and b
fit1=10.^polyval((regres1),log10(s_stress));
fit2=10.^polyval((regres2),log10(s_stress));
figure()
loglog(s_stress,p1(1,:),'bx',s_stress,p2(1,:),'kd', s_stress,fit1,'b',...
s_stress, fit2, 'k')
reg1=num2str(regres1(1,1),'%2.2f');
reg2=num2str(regres2(1,1),'%2.2f');
xlabel('Shear Stress (MPa)'), ylabel('Strain Rate (1/s)')
title('p758 Saturated NO run in')
stringmatrix1(1,1:10)= '20 min n= ';
stringmatrix1(1,11:10+length(reg1))= reg1;
stringmatrix2(1,1:10)= '40 min n= ';
stringmatrix2(1,11:10+length(reg2))= reg2;
legend(stringmatrix1, stringmatrix2, 2)
hold on
errorbar(s_stress,B(1,:),sigmaB(1,:),'bx')
hold on
errorbar(s_stress,B(2,:),sigmaB(2,:),'ko')
hold off
[i]=strainplots(stress,tau,time,strain,name);
function [i]=strainplots(stress,tau,time,strain,name)
colors='rgbcmyk-+d';
figure
number=length(stress);
for count=1:number
i=1;
clear x
clear y
for counter=(tau(count,1)):1:(tau(count,2))
x(i) = time(counter);
y(i) = strain(counter);
i=i+1;
end
x=x-x(1);%Nomralize to have 0 as point of stress bump by subtracting
y=y-y(1);
plot(x,y,colors(count))
hold on
strs=num2str(stress(count),'%2.3f');
stringmatr(count,1:length(strs))=strs
stringmatr(count,(length(strs)+1):(length(strs)+4))=' MPa';

209
end
title(name)
xlabel('Time (s)'), ylabel('Strain'), legend(stringmatr,2)
hold off

210
Andrew Paul Rathbun
Education
2010 Ph.D. The Pennsylvania State University, Chris Marone, Advisor
Dissertation:
2006 M.S., The Pennsylvania State University, Chris Marone, Advisor
Thesis: Laboratory Study of Till Deformation: Comparison of Creep and Strength
Characteristics
2003 B.S. with Distinction in the Geological Sciences, The Ohio State University,
Hallan Noltimier, Advisor
Senior Thesis: The Possible Common Origin of the Stillwater Complex, Montana,
and the Bushveld Complex, Republic of South Africa.
Professional Experience
2008 Research Scientist at ExxonMobil Upstream Research
2007 Teaching assistantship, Physical Processes in Geology, Penn State
2004-2005 Teaching assistantship, Oceanography, Penn State
2001-2004 Teaching assistant, Math 151, 152, 153, Ohio State
2003 Teaching assistant, Physical Geology, Ohio State
2002-2003 NSF REU for the McMurdo Dry Valleys, Antarctic LTER
Publications
Rathbun, A. P., and C. Marone (2010), Effect of strain localization on frictional
behavior of sheared granular materials, J. Geophys. Res., 115, B01204,
doi:10.1029/2009JB006466.
Marone, C. and A. P. Rathbun (2009), Strain localization in granular fault zones at
laboratory and tectonic scales, in Meso-Scale Shear Physics in Earthquake and
Landslide Mechanics, edited by. Y. Hatzor, J. Sulem and I. Vardoulakis, CRC
Press.
Rathbun, A. P., C. Marone, R. B. Alley, and S. Anandakrishnan (2008), Laboratory
study of the frictional rheology of sheared till, J. Geophys. Res., 113, F02020,
doi:10.1029/2007JF000815.
Awards
2009 Euro Conference of Rock Deformation, Outstanding Young Scientist
2009 Penn State Geosciences Graduate Student Colloquium 1st Place Poster
2009 Shell Geosciences Energy Research Facilities Award
2007 ConocoPhilips Field Research Grant
2007 Penn State Geosciences Student Colloquium 2nd
Place Pre-Comps PhD Talk
2005 Penn State Geosciences Student Colloquium 2nd
Place Master’s Talk
2003 Sigma-Xi Grants-In-Aid of Research
2003 Ohio State Geology Department, Undergraduate Book Award
2003 Ohio State Honors College, Undergraduate Research Scholarship
Related Documents