applied sciences Article An Experimental Approach for the Direct Measurement of Temperatures in the Vicinity of the Keyhole Front Wall during Deep-Penetration Laser Welding Ronald Pordzik * and Peer Woizeschke BIAS—Bremer Institut für angewandte Strahltechnik GmbH, Klagenfurter Str. 5, 28359 Bremen, Germany; [email protected] * Correspondence: [email protected]; Tel.: +49-421-218-58078 Received: 8 May 2020; Accepted: 4 June 2020; Published: 6 June 2020 Abstract: The formation of defects such as pores during deep-penetration laser welding processes is governed by the melt pool dynamics and the stability of the vapor capillary, also referred to as the keyhole. In order to gain an insight into the dynamics of the keyhole, the temperature in the transition region from the liquid to the gaseous phase, i.e., near the keyhole wall, is a physical value of fundamental importance. In this paper, a novel method is presented for directly measuring temperatures in the close vicinity of the keyhole front wall during deep-penetration laser welding. The weld samples consist of pure aluminum with a boiling point of 2743 K. The measurement is performed using high-speed pyrometry with a refractory tantalum probe capable of detecting temperatures that significantly exceed the boiling point of the sample material. Temperature curves are recorded from the beginning of the welding process until the moment the probe is finally destroyed through direct laser-tantalum interaction. With an effective spatial resolution up to 0.3 μm in the welding direction, a detailed investigation into the temperature ranging from the prerunning melt pool front to the keyhole center is possible, exhibiting temperatures of up to 3300 K in the vicinity of the keyhole front wall. Keywords: deep-penetration laser welding; keyhole behavior; keyhole dynamics; keyhole wall temperature; pyrometry; Knudsen layer 1. Introduction Deep-penetration laser welding is a well-established yet still promising joining technology with a broad field of applications in the automotive, aerospace, and many other industries of great economic significance. Allowing for high-aspect ratios, it has proven to be an ideal method for generating deep and narrow weld seams at comparatively low energy inputs [1]. High welding velocities and low thermal distortion of the joined parts qualify this technology for applications in manufacturing processes, e.g., for automated welding tasks or complex welding contours [2]. At a certain material-dependent intensity threshold of the laser beam, the material evaporation induces a recoil pressure onto the molten material, allowing the laser to penetrate the formerly flat workpiece surface [3]. Thereby, a long and narrow vapor capillary, also referred to as a keyhole, is formed in which the laser beam can propagate through multiple reflections so that the energy is absorbed along the complete depth of the capillary [4]. The keyhole diameter is approximately one to one and a half times the size of the beam diameter at the material surface [5] and is filled with metal vapor and shielding gas. Appl. Sci. 2020, 10, 3951; doi:10.3390/app10113951 www.mdpi.com/journal/applsci

Welcome message from author
This document is posted to help you gain knowledge. Please leave a comment to let me know what you think about it! Share it to your friends and learn new things together.
Transcript
applied sciences
Article
An Experimental Approach for the DirectMeasurement of Temperatures in the Vicinityof the Keyhole Front Wall during Deep-PenetrationLaser Welding
Ronald Pordzik * and Peer Woizeschke
BIAS—Bremer Institut für angewandte Strahltechnik GmbH, Klagenfurter Str. 5, 28359 Bremen, Germany;[email protected]* Correspondence: [email protected]; Tel.: +49-421-218-58078
Received: 8 May 2020; Accepted: 4 June 2020; Published: 6 June 2020�����������������
Abstract: The formation of defects such as pores during deep-penetration laser welding processesis governed by the melt pool dynamics and the stability of the vapor capillary, also referred to asthe keyhole. In order to gain an insight into the dynamics of the keyhole, the temperature in thetransition region from the liquid to the gaseous phase, i.e., near the keyhole wall, is a physicalvalue of fundamental importance. In this paper, a novel method is presented for directly measuringtemperatures in the close vicinity of the keyhole front wall during deep-penetration laser welding.The weld samples consist of pure aluminum with a boiling point of 2743 K. The measurementis performed using high-speed pyrometry with a refractory tantalum probe capable of detectingtemperatures that significantly exceed the boiling point of the sample material. Temperature curvesare recorded from the beginning of the welding process until the moment the probe is finally destroyedthrough direct laser-tantalum interaction. With an effective spatial resolution up to 0.3 µm in thewelding direction, a detailed investigation into the temperature ranging from the prerunning meltpool front to the keyhole center is possible, exhibiting temperatures of up to 3300 K in the vicinity ofthe keyhole front wall.
Keywords: deep-penetration laser welding; keyhole behavior; keyhole dynamics; keyhole walltemperature; pyrometry; Knudsen layer
1. Introduction
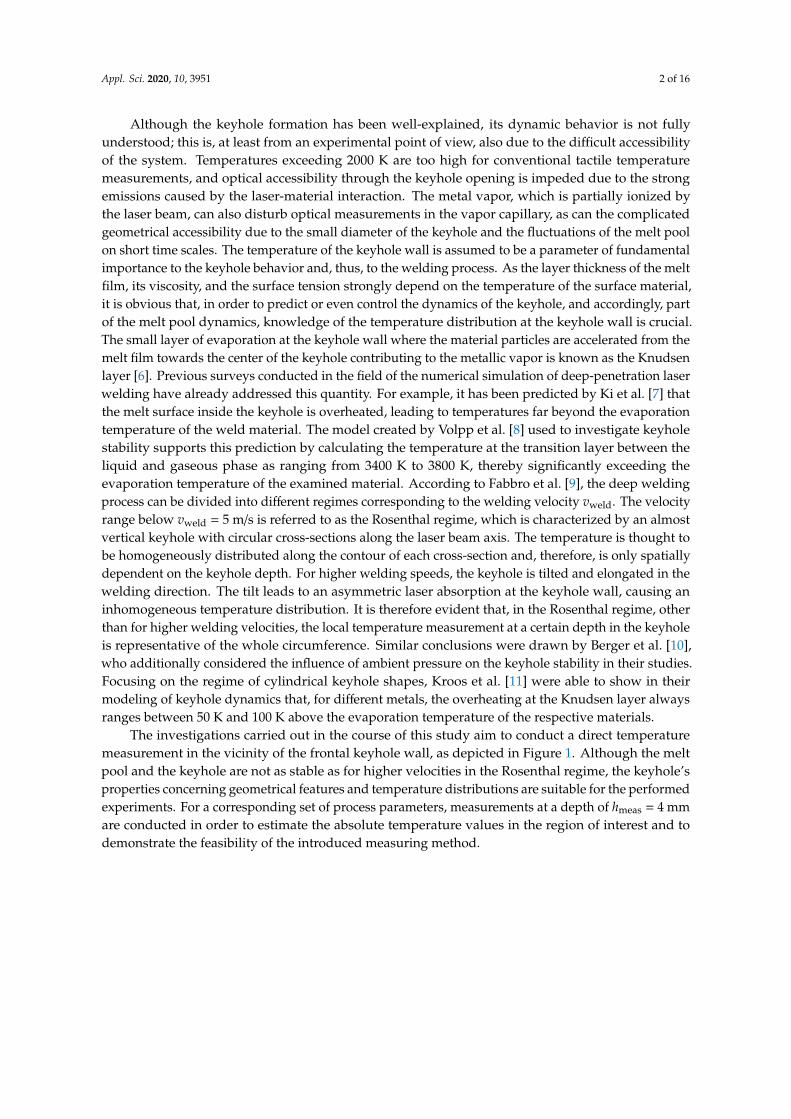
Deep-penetration laser welding is a well-established yet still promising joining technologywith a broad field of applications in the automotive, aerospace, and many other industries of greateconomic significance. Allowing for high-aspect ratios, it has proven to be an ideal method forgenerating deep and narrow weld seams at comparatively low energy inputs [1]. High weldingvelocities and low thermal distortion of the joined parts qualify this technology for applications inmanufacturing processes, e.g., for automated welding tasks or complex welding contours [2]. At acertain material-dependent intensity threshold of the laser beam, the material evaporation induces arecoil pressure onto the molten material, allowing the laser to penetrate the formerly flat workpiecesurface [3]. Thereby, a long and narrow vapor capillary, also referred to as a keyhole, is formed inwhich the laser beam can propagate through multiple reflections so that the energy is absorbed alongthe complete depth of the capillary [4]. The keyhole diameter is approximately one to one and a halftimes the size of the beam diameter at the material surface [5] and is filled with metal vapor andshielding gas.
Appl. Sci. 2020, 10, 3951; doi:10.3390/app10113951 www.mdpi.com/journal/applsci
Appl. Sci. 2020, 10, 3951 2 of 16
Although the keyhole formation has been well-explained, its dynamic behavior is not fullyunderstood; this is, at least from an experimental point of view, also due to the difficult accessibilityof the system. Temperatures exceeding 2000 K are too high for conventional tactile temperaturemeasurements, and optical accessibility through the keyhole opening is impeded due to the strongemissions caused by the laser-material interaction. The metal vapor, which is partially ionized bythe laser beam, can also disturb optical measurements in the vapor capillary, as can the complicatedgeometrical accessibility due to the small diameter of the keyhole and the fluctuations of the melt poolon short time scales. The temperature of the keyhole wall is assumed to be a parameter of fundamentalimportance to the keyhole behavior and, thus, to the welding process. As the layer thickness of the meltfilm, its viscosity, and the surface tension strongly depend on the temperature of the surface material,it is obvious that, in order to predict or even control the dynamics of the keyhole, and accordingly, partof the melt pool dynamics, knowledge of the temperature distribution at the keyhole wall is crucial.The small layer of evaporation at the keyhole wall where the material particles are accelerated from themelt film towards the center of the keyhole contributing to the metallic vapor is known as the Knudsenlayer [6]. Previous surveys conducted in the field of the numerical simulation of deep-penetration laserwelding have already addressed this quantity. For example, it has been predicted by Ki et al. [7] thatthe melt surface inside the keyhole is overheated, leading to temperatures far beyond the evaporationtemperature of the weld material. The model created by Volpp et al. [8] used to investigate keyholestability supports this prediction by calculating the temperature at the transition layer between theliquid and gaseous phase as ranging from 3400 K to 3800 K, thereby significantly exceeding theevaporation temperature of the examined material. According to Fabbro et al. [9], the deep weldingprocess can be divided into different regimes corresponding to the welding velocity vweld. The velocityrange below vweld = 5 m/s is referred to as the Rosenthal regime, which is characterized by an almostvertical keyhole with circular cross-sections along the laser beam axis. The temperature is thought tobe homogeneously distributed along the contour of each cross-section and, therefore, is only spatiallydependent on the keyhole depth. For higher welding speeds, the keyhole is tilted and elongated in thewelding direction. The tilt leads to an asymmetric laser absorption at the keyhole wall, causing aninhomogeneous temperature distribution. It is therefore evident that, in the Rosenthal regime, otherthan for higher welding velocities, the local temperature measurement at a certain depth in the keyholeis representative of the whole circumference. Similar conclusions were drawn by Berger et al. [10],who additionally considered the influence of ambient pressure on the keyhole stability in their studies.Focusing on the regime of cylindrical keyhole shapes, Kroos et al. [11] were able to show in theirmodeling of keyhole dynamics that, for different metals, the overheating at the Knudsen layer alwaysranges between 50 K and 100 K above the evaporation temperature of the respective materials.
The investigations carried out in the course of this study aim to conduct a direct temperaturemeasurement in the vicinity of the frontal keyhole wall, as depicted in Figure 1. Although the meltpool and the keyhole are not as stable as for higher velocities in the Rosenthal regime, the keyhole’sproperties concerning geometrical features and temperature distributions are suitable for the performedexperiments. For a corresponding set of process parameters, measurements at a depth of hmeas = 4 mmare conducted in order to estimate the absolute temperature values in the region of interest and todemonstrate the feasibility of the introduced measuring method.
Appl. Sci. 2020, 10, 3951 3 of 16Appl. Sci. 2020, 10, x FOR PEER REVIEW 3 of 17
Figure 1. Schematic of the process observation: (a) total view of the sample showing pyrometry and
high-speed imaging methods during the welding process, and (b) close-up on the melt pool probing.
2. Materials and Methods
2.1. Specimen Design
The specimens used during the experiments consist of two parts. The first part is a block of pure
aluminum EN AW-1050A (BIKAR-Metalle GmbH, Bad Berleburg, Germany) with the dimensions
60 × 40 × 10 mm3, which acts as the base material for the bead-on-plate welding during the
experimental process. This size is chosen as it is big enough to diminish any boundary effects on the
temperature propagation on the timescale of the performed measurements. Therefore, on the
timescale of interest, the specimen can be treated as a semi-infinite body. Regarding the aluminum
and the process laser system used, the intensity threshold for initializing a deep penetration welding
process is Ikey = 5 × 10⁶ W/cm2 according to [12]. The second part of the specimen comprises the
refractory probe, which consists of a high-purity tantalum tube (Goodfellow GmbH, Hamburg,
Germany) sealed at the front end with 20-µm tantalum foil (Goodfellow GmbH, Hamburg, Germany)
using micro deep-drawing, as depicted in Figure 2. With an outer diameter of dout = 1.05 mm and an
inner diameter of din = 0.6 mm, the size of the tube is chosen in order to minimize the disturbance to the
melt pool system as much as possible while leaving enough space for the measuring spots of the
pyrometers to fit inside completely. The foil is force-fit onto the tantalum tube, establishing only a
mechanical connection between the two parts. A drill hole with a diameter slightly bigger than the outer
diameter of the probe and with a depth corresponding to the length of the tube lprobe = 8 mm is drilled
into the front side of the aluminum block and equipped with the tantalum tube with the sealed end
facing the drill hole, as shown in Figure 3.
BIAS ID 200204Pordzik 2020
x
y
z
laser beam
PoI
melt pooIx y
zmelt pool
vapor capillary
refractory probe
pyrometric
beam path(a) (b)
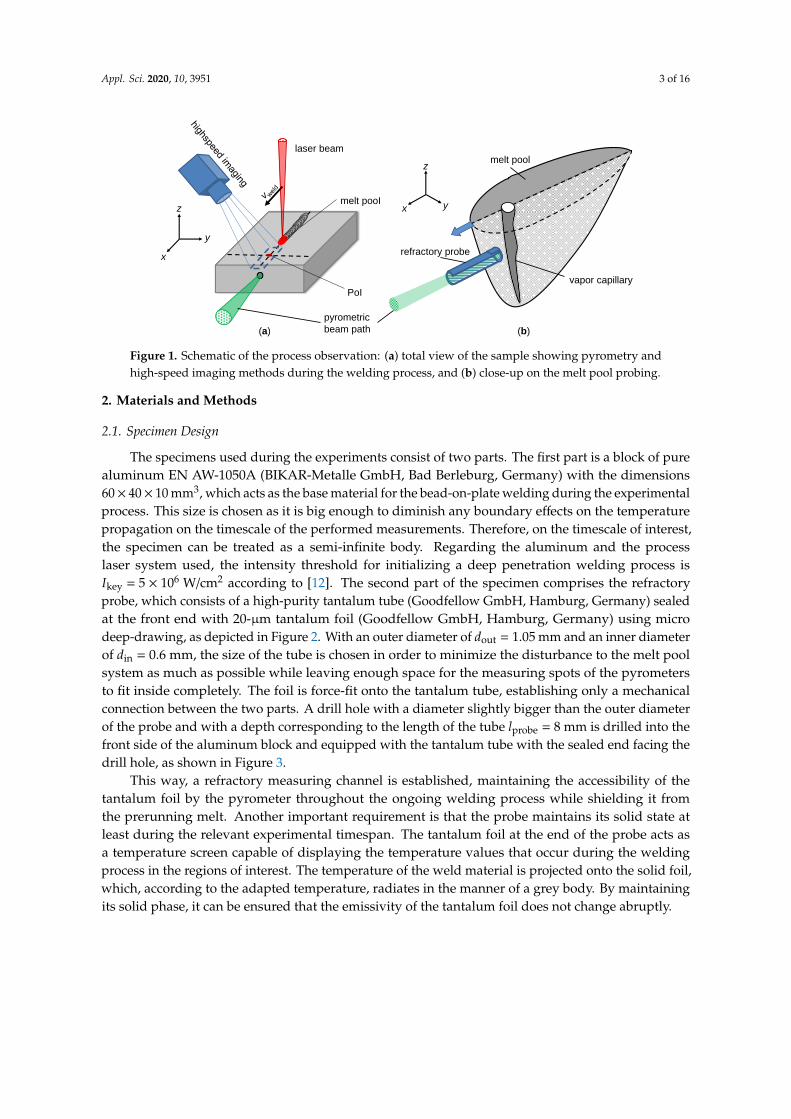
Figure 1. Schematic of the process observation: (a) total view of the sample showing pyrometry andhigh-speed imaging methods during the welding process, and (b) close-up on the melt pool probing.
2. Materials and Methods
2.1. Specimen Design
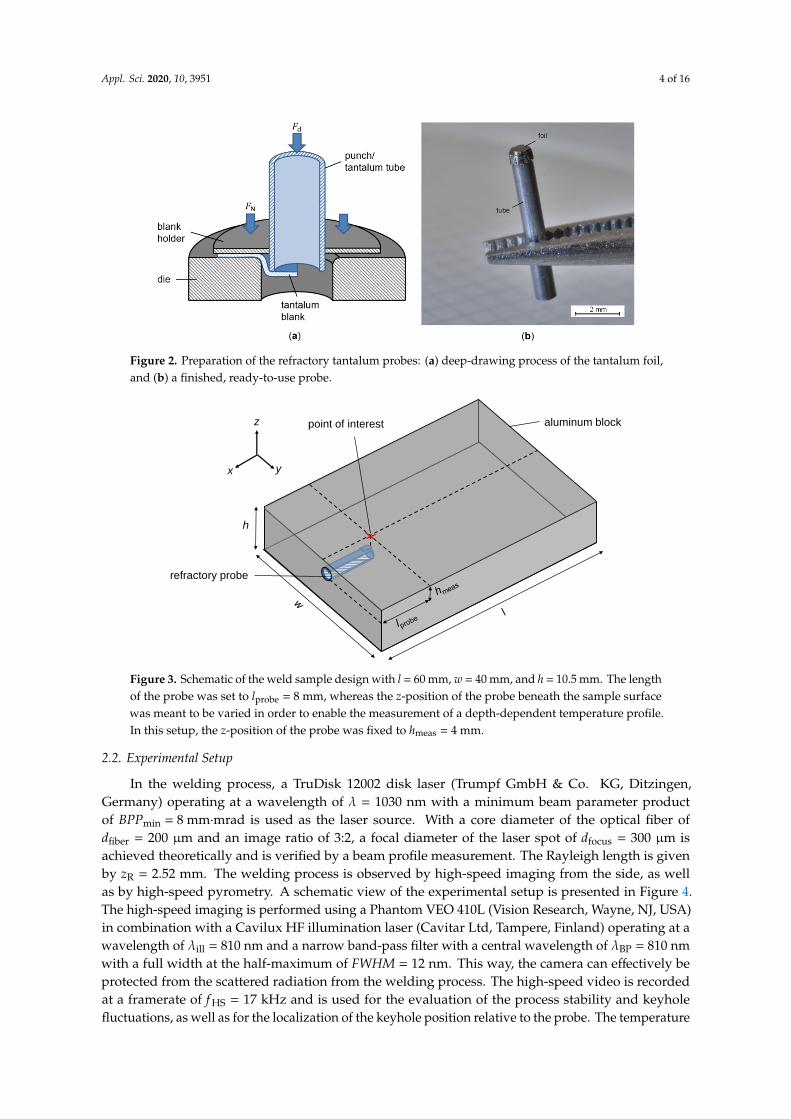
The specimens used during the experiments consist of two parts. The first part is a block of purealuminum EN AW-1050A (BIKAR-Metalle GmbH, Bad Berleburg, Germany) with the dimensions60× 40× 10 mm3, which acts as the base material for the bead-on-plate welding during the experimentalprocess. This size is chosen as it is big enough to diminish any boundary effects on the temperaturepropagation on the timescale of the performed measurements. Therefore, on the timescale of interest,the specimen can be treated as a semi-infinite body. Regarding the aluminum and the processlaser system used, the intensity threshold for initializing a deep penetration welding process isIkey = 5 × 10⁶ W/cm2 according to [12]. The second part of the specimen comprises the refractoryprobe, which consists of a high-purity tantalum tube (Goodfellow GmbH, Hamburg, Germany) sealedat the front end with 20-µm tantalum foil (Goodfellow GmbH, Hamburg, Germany) using microdeep-drawing, as depicted in Figure 2. With an outer diameter of dout = 1.05 mm and an inner diameterof din = 0.6 mm, the size of the tube is chosen in order to minimize the disturbance to the melt poolsystem as much as possible while leaving enough space for the measuring spots of the pyrometersto fit inside completely. The foil is force-fit onto the tantalum tube, establishing only a mechanicalconnection between the two parts. A drill hole with a diameter slightly bigger than the outer diameterof the probe and with a depth corresponding to the length of the tube lprobe = 8 mm is drilled into thefront side of the aluminum block and equipped with the tantalum tube with the sealed end facing thedrill hole, as shown in Figure 3.
This way, a refractory measuring channel is established, maintaining the accessibility of thetantalum foil by the pyrometer throughout the ongoing welding process while shielding it fromthe prerunning melt. Another important requirement is that the probe maintains its solid state atleast during the relevant experimental timespan. The tantalum foil at the end of the probe acts asa temperature screen capable of displaying the temperature values that occur during the weldingprocess in the regions of interest. The temperature of the weld material is projected onto the solid foil,which, according to the adapted temperature, radiates in the manner of a grey body. By maintainingits solid phase, it can be ensured that the emissivity of the tantalum foil does not change abruptly.
Appl. Sci. 2020, 10, 3951 4 of 16Appl. Sci. 2020, 10, x FOR PEER REVIEW 4 of 17
Figure 2. Preparation of the refractory tantalum probes: (a) deep-drawing process of the tantalum foil,
and (b) a finished, ready-to-use probe.
This way, a refractory measuring channel is established, maintaining the accessibility of the
tantalum foil by the pyrometer throughout the ongoing welding process while shielding it from the
prerunning melt. Another important requirement is that the probe maintains its solid state at least
during the relevant experimental timespan. The tantalum foil at the end of the probe acts as a
temperature screen capable of displaying the temperature values that occur during the welding
process in the regions of interest. The temperature of the weld material is projected onto the solid
foil, which, according to the adapted temperature, radiates in the manner of a grey body. By
maintaining its solid phase, it can be ensured that the emissivity of the tantalum foil does not change
abruptly.
Figure 3. Schematic of the weld sample design with l = 60 mm, w = 40 mm, and h = 10.5 mm. The
length of the probe was set to lprobe = 8 mm, whereas the z-position of the probe beneath the sample
surface was meant to be varied in order to enable the measurement of a depth-dependent temperature
profile. In this setup, the z-position of the probe was fixed to hmeas = 4 mm.
2.2. Experimental Setup
BIAS ID 200205Pordzik 2020
refractory probe
point of interest
x y
z
h
aluminum block
Figure 2. Preparation of the refractory tantalum probes: (a) deep-drawing process of the tantalum foil,and (b) a finished, ready-to-use probe.
Appl. Sci. 2020, 10, x FOR PEER REVIEW 4 of 17
Figure 2. Preparation of the refractory tantalum probes: (a) deep-drawing process of the tantalum foil,
and (b) a finished, ready-to-use probe.
This way, a refractory measuring channel is established, maintaining the accessibility of the
tantalum foil by the pyrometer throughout the ongoing welding process while shielding it from the
prerunning melt. Another important requirement is that the probe maintains its solid state at least
during the relevant experimental timespan. The tantalum foil at the end of the probe acts as a
temperature screen capable of displaying the temperature values that occur during the welding
process in the regions of interest. The temperature of the weld material is projected onto the solid
foil, which, according to the adapted temperature, radiates in the manner of a grey body. By
maintaining its solid phase, it can be ensured that the emissivity of the tantalum foil does not change
abruptly.
Figure 3. Schematic of the weld sample design with l = 60 mm, w = 40 mm, and h = 10.5 mm. The
length of the probe was set to lprobe = 8 mm, whereas the z-position of the probe beneath the sample
surface was meant to be varied in order to enable the measurement of a depth-dependent temperature
profile. In this setup, the z-position of the probe was fixed to hmeas = 4 mm.
2.2. Experimental Setup
BIAS ID 200205Pordzik 2020
refractory probe
point of interest
x y
z
h
aluminum block
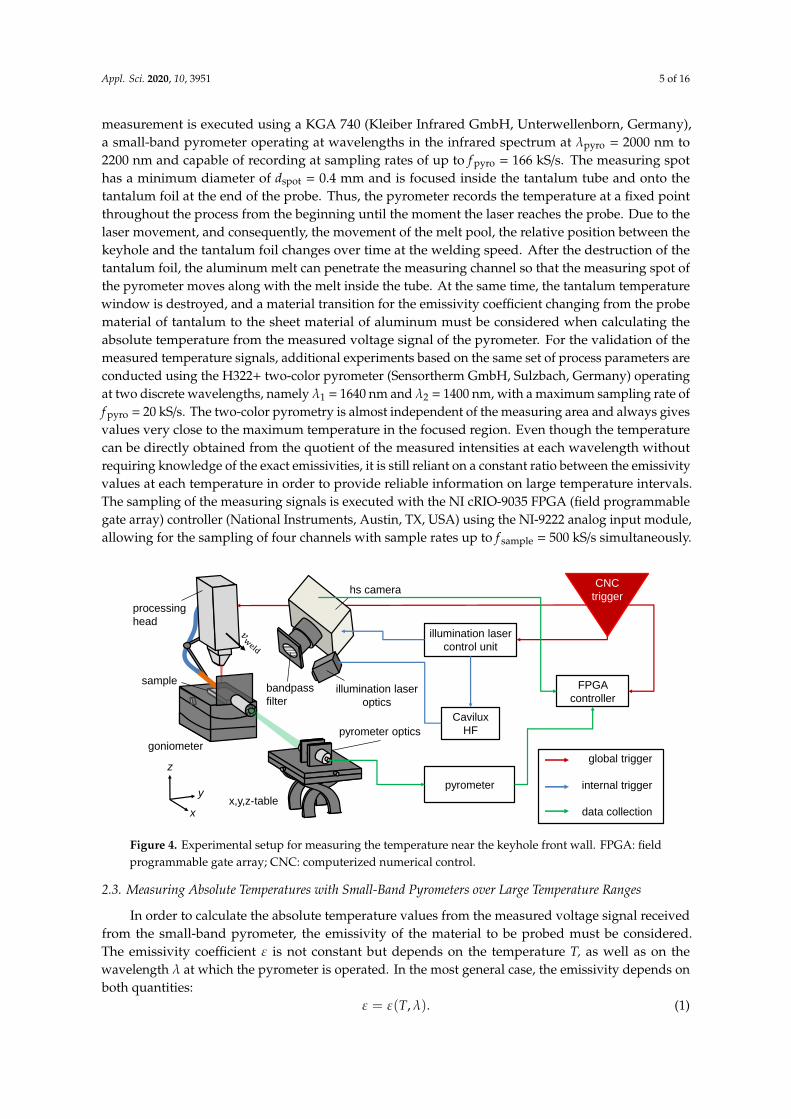
Figure 3. Schematic of the weld sample design with l = 60 mm, w = 40 mm, and h = 10.5 mm. The lengthof the probe was set to lprobe = 8 mm, whereas the z-position of the probe beneath the sample surfacewas meant to be varied in order to enable the measurement of a depth-dependent temperature profile.In this setup, the z-position of the probe was fixed to hmeas = 4 mm.
2.2. Experimental Setup
In the welding process, a TruDisk 12002 disk laser (Trumpf GmbH & Co. KG, Ditzingen,Germany) operating at a wavelength of λ = 1030 nm with a minimum beam parameter productof BPPmin = 8 mm·mrad is used as the laser source. With a core diameter of the optical fiber ofdfiber = 200 µm and an image ratio of 3:2, a focal diameter of the laser spot of dfocus = 300 µm isachieved theoretically and is verified by a beam profile measurement. The Rayleigh length is givenby zR = 2.52 mm. The welding process is observed by high-speed imaging from the side, as wellas by high-speed pyrometry. A schematic view of the experimental setup is presented in Figure 4.The high-speed imaging is performed using a Phantom VEO 410L (Vision Research, Wayne, NJ, USA)in combination with a Cavilux HF illumination laser (Cavitar Ltd, Tampere, Finland) operating at awavelength of λill = 810 nm and a narrow band-pass filter with a central wavelength of λBP = 810 nmwith a full width at the half-maximum of FWHM = 12 nm. This way, the camera can effectively beprotected from the scattered radiation from the welding process. The high-speed video is recordedat a framerate of f HS = 17 kHz and is used for the evaluation of the process stability and keyholefluctuations, as well as for the localization of the keyhole position relative to the probe. The temperature
Appl. Sci. 2020, 10, 3951 5 of 16
measurement is executed using a KGA 740 (Kleiber Infrared GmbH, Unterwellenborn, Germany),a small-band pyrometer operating at wavelengths in the infrared spectrum at λpyro = 2000 nm to2200 nm and capable of recording at sampling rates of up to f pyro = 166 kS/s. The measuring spothas a minimum diameter of dspot = 0.4 mm and is focused inside the tantalum tube and onto thetantalum foil at the end of the probe. Thus, the pyrometer records the temperature at a fixed pointthroughout the process from the beginning until the moment the laser reaches the probe. Due to thelaser movement, and consequently, the movement of the melt pool, the relative position between thekeyhole and the tantalum foil changes over time at the welding speed. After the destruction of thetantalum foil, the aluminum melt can penetrate the measuring channel so that the measuring spot ofthe pyrometer moves along with the melt inside the tube. At the same time, the tantalum temperaturewindow is destroyed, and a material transition for the emissivity coefficient changing from the probematerial of tantalum to the sheet material of aluminum must be considered when calculating theabsolute temperature from the measured voltage signal of the pyrometer. For the validation of themeasured temperature signals, additional experiments based on the same set of process parameters areconducted using the H322+ two-color pyrometer (Sensortherm GmbH, Sulzbach, Germany) operatingat two discrete wavelengths, namely λ1 = 1640 nm and λ2 = 1400 nm, with a maximum sampling rate off pyro = 20 kS/s. The two-color pyrometry is almost independent of the measuring area and always givesvalues very close to the maximum temperature in the focused region. Even though the temperaturecan be directly obtained from the quotient of the measured intensities at each wavelength withoutrequiring knowledge of the exact emissivities, it is still reliant on a constant ratio between the emissivityvalues at each temperature in order to provide reliable information on large temperature intervals.The sampling of the measuring signals is executed with the NI cRIO-9035 FPGA (field programmablegate array) controller (National Instruments, Austin, TX, USA) using the NI-9222 analog input module,allowing for the sampling of four channels with sample rates up to f sample = 500 kS/s simultaneously.Appl. Sci. 2020, 10, x FOR PEER REVIEW 6 of 17
Figure 4. Experimental setup for measuring the temperature near the keyhole front wall. FPGA:
field programmable gate array; CNC: computerized numerical control.
2.3. Measuring Absolute Temperatures With Small-Band Pyrometers Over Large Temperature Ranges
In order to calculate the absolute temperature values from the measured voltage signal received from
the small-band pyrometer, the emissivity of the material to be probed must be considered. The emissivity
coefficient ε is not constant but depends on the temperature T, as well as on the wavelength λ at which
the pyrometer is operated. In the most general case, the emissivity depends on both quantities:
𝜀 = 𝜀(𝑇, 𝜆). (1)
The emissivity is a factor that determines the share of emitted radiation compared to a black
body with an ideal emissivity of ε = 1. Considering a measuring spot with an area Apyro and an
effective spectrum [λ1, λ2] for the pyrometer, the radiant power to be measured at a given
temperature is described by the wavelength integral of Planck’s law:
𝐼(𝑇) = ∫ 𝜀(𝑇, 𝜆) 𝑆(𝑇, 𝜆) 𝑑𝜆𝜆2𝜆1
with 𝑆(𝑇, 𝜆) =2𝜋ℎ𝑐²
𝜆5
1
𝑒
ℎ𝑐𝜆𝑘B𝑇−1
, (2)
where h describes the Planck constant, c represents the vacuum speed of light, and kB is the Boltzmann
constant.
From Figure 5b, it becomes clear that the analytical approximation of the numerically calculated
integral is more accurate for high temperatures. Therefore, the following temperature calculations
must be considered more reliable for temperatures exceeding 2000 K, which corresponds to the range
of expected keyhole temperatures. As there is no analytical solution for a finite integral of S(T, λ), the
solution can only be acquired numerically. Considering the emissivity to only have a weak
dependency on the wavelength within the given operational spectrum, the radiant power can be
calculated numerically for each temperature within the expected temperature range and fitted with
a potency function with the fitting parameters a and b. It should be noted that this crucial assumption
of the spectral independence of the emissivity cannot be assumed in general but only for specific
intervals for which such a behavior is documented.
𝑃(𝑇) = 𝐴pyro ⋅ 𝐼(𝑇) ≈ 𝐴pyro ⋅ 𝑎 ⋅ 𝑇𝑏 (3)
BIAS ID 200200Pordzik 2020
x,y,z-table
Cavilux
HF
illumination laser
control unit
FPGA
controller
pyrometer
CNC
trigger
pyrometer optics
bandpass
filterillumination laser
optics
processing
head
goniometer
sample
global trigger
internal trigger
data collection
y
x
z
hs camera
Figure 4. Experimental setup for measuring the temperature near the keyhole front wall. FPGA: fieldprogrammable gate array; CNC: computerized numerical control.
2.3. Measuring Absolute Temperatures with Small-Band Pyrometers over Large Temperature Ranges
In order to calculate the absolute temperature values from the measured voltage signal receivedfrom the small-band pyrometer, the emissivity of the material to be probed must be considered.The emissivity coefficient ε is not constant but depends on the temperature T, as well as on thewavelength λ at which the pyrometer is operated. In the most general case, the emissivity depends onboth quantities:
ε = ε(T,λ). (1)
Appl. Sci. 2020, 10, 3951 6 of 16
The emissivity is a factor that determines the share of emitted radiation compared to a black bodywith an ideal emissivity of ε = 1. Considering a measuring spot with an area Apyro and an effectivespectrum [λ1, λ2] for the pyrometer, the radiant power to be measured at a given temperature isdescribed by the wavelength integral of Planck’s law:
I(T) =∫ λ2
λ1
ε(T,λ) S(T,λ) dλ with S(T,λ) =2πhcλ5
1
ehc
λkBT − 1, (2)
where h describes the Planck constant, c represents the vacuum speed of light, and kB is theBoltzmann constant.
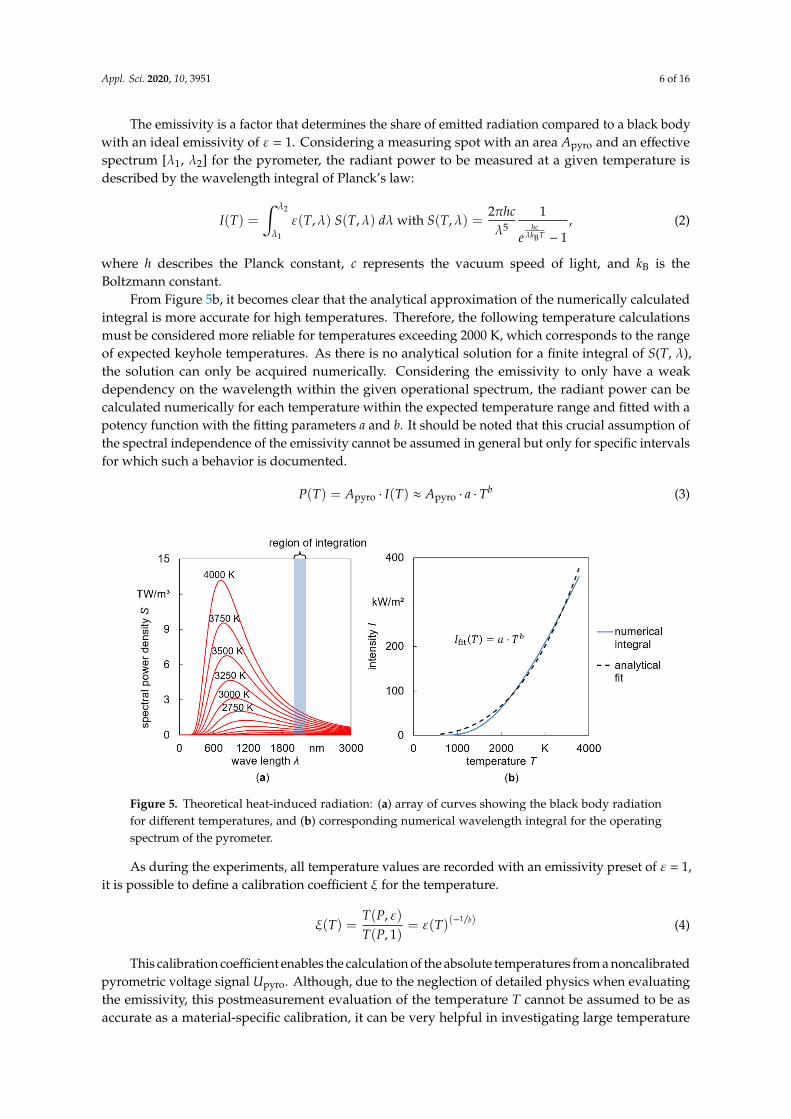
From Figure 5b, it becomes clear that the analytical approximation of the numerically calculatedintegral is more accurate for high temperatures. Therefore, the following temperature calculationsmust be considered more reliable for temperatures exceeding 2000 K, which corresponds to the rangeof expected keyhole temperatures. As there is no analytical solution for a finite integral of S(T, λ),the solution can only be acquired numerically. Considering the emissivity to only have a weakdependency on the wavelength within the given operational spectrum, the radiant power can becalculated numerically for each temperature within the expected temperature range and fitted with apotency function with the fitting parameters a and b. It should be noted that this crucial assumption ofthe spectral independence of the emissivity cannot be assumed in general but only for specific intervalsfor which such a behavior is documented.
P(T) = Apyro · I(T) ≈ Apyro · a · Tb (3)Appl. Sci. 2020, 10, x FOR PEER REVIEW 7 of 17
Figure 5. Theoretical heat-induced radiation: (a) array of curves showing the black body radiation for
different temperatures, and (b) corresponding numerical wavelength integral for the operating
spectrum of the pyrometer.
As during the experiments, all temperature values are recorded with an emissivity preset of ε = 1,
it is possible to define a calibration coefficient ξ for the temperature.
𝜉(𝑇) =𝑇(𝑃, 𝜀)
𝑇(𝑃, 1)= 𝜀(𝑇)(−
1𝑏⁄ ) (4)
This calibration coefficient enables the calculation of the absolute temperatures from a
noncalibrated pyrometric voltage signal Upyro. Although, due to the neglection of detailed physics when
evaluating the emissivity, this postmeasurement evaluation of the temperature T cannot be assumed to
be as accurate as a material-specific calibration, it can be very helpful in investigating large temperature
ranges, as well as temperatures that may be too high for sophisticated calibration under conventional
laboratory conditions. The Equations (3) and (4) would hold for an ideal pyrometer covering the whole
temperature scale starting at Tmin = 0 K. Due to technical constraints, the detectable temperatures have
a lower and an upper boundary, Tmin and Tmax, each corresponding to temperature values greater than
0 K. In this case, the calibration coefficient only acts upon the temperature difference within the
measuring interval ΔT = T − Tmin. It proves that, especially in the region of high temperature values
as they lie in the scope of this investigation, the form of the analytical approximation given by
Equation (3) is also suitable for ΔT.
𝑃(𝑇) = 𝐴pyro ⋅ 𝐼(𝑇) ≈ 𝐴pyro ⋅ �� ⋅ ∆𝑇�� (5)
𝜉(𝑇) =𝑇(𝑃, 𝜀) − 𝑇min𝑇(𝑃, 1) − 𝑇min
= 𝜀(𝑇)(−1
��⁄ ) (6)
From Equation (6), it can be seen that the calibration coefficient can be obtained from the temperature
difference in an analogous manner. The pyrometric temperature measurement starts at the temperature
offset Tmin, and the calibration coefficient 𝜉(𝑇) only acts upon the temperature difference ΔT.
∆𝑇(𝑃, 1) = 𝑠 ⋅ 𝑈pyro with 𝑠 =𝑇max−𝑇min
∆𝑈 (7)
𝑇 = 𝜉(𝑇) ⋅ ∆𝑇(𝑃, 1) + 𝑇min = 𝜉(𝑇) ⋅ 𝑠 ⋅ 𝑈pyro + 𝑇min (8)
When calculating the actual temperature from the pyrometric voltage signal, it becomes evident
from Equation (8) that T depends on itself as the emissivity depends on the temperature in an empirical
manner. Therefore, the equation cannot be solved for T analytically. Using a self-consistency approach,
a solution for T can be found by iterating the self-consistency cycle until the input and the output
temperatures match within a defined tolerance δ, as depicted schematically in Figure 6.
Figure 5. Theoretical heat-induced radiation: (a) array of curves showing the black body radiationfor different temperatures, and (b) corresponding numerical wavelength integral for the operatingspectrum of the pyrometer.
As during the experiments, all temperature values are recorded with an emissivity preset of ε = 1,it is possible to define a calibration coefficient ξ for the temperature.
ξ(T) =T(P, ε)T(P, 1)
= ε(T)(−1/b) (4)
This calibration coefficient enables the calculation of the absolute temperatures from a noncalibratedpyrometric voltage signal Upyro. Although, due to the neglection of detailed physics when evaluatingthe emissivity, this postmeasurement evaluation of the temperature T cannot be assumed to be asaccurate as a material-specific calibration, it can be very helpful in investigating large temperature
Appl. Sci. 2020, 10, 3951 7 of 16
ranges, as well as temperatures that may be too high for sophisticated calibration under conventionallaboratory conditions. The Equations (3) and (4) would hold for an ideal pyrometer covering the wholetemperature scale starting at Tmin = 0 K. Due to technical constraints, the detectable temperatures havea lower and an upper boundary, Tmin and Tmax, each corresponding to temperature values greaterthan 0 K. In this case, the calibration coefficient only acts upon the temperature difference withinthe measuring interval ∆T = T − Tmin. It proves that, especially in the region of high temperaturevalues as they lie in the scope of this investigation, the form of the analytical approximation given byEquation (3) is also suitable for ∆T.
P(T) = Apyro · I(T) ≈ Apyro · a · ∆Tb (5)
ξ(T) =T(P, ε) − Tmin
T(P, 1) − Tmin= ε(T)(−1/b) (6)
From Equation (6), it can be seen that the calibration coefficient can be obtained from thetemperature difference in an analogous manner. The pyrometric temperature measurement startsat the temperature offset Tmin, and the calibration coefficient ξ(T) only acts upon the temperaturedifference ∆T.
∆T(P, 1) = s ·Upyro with s =Tmax − Tmin
∆U(7)
T = ξ(T) · ∆T(P, 1) + Tmin = ξ(T) · s ·Upyro + Tmin (8)
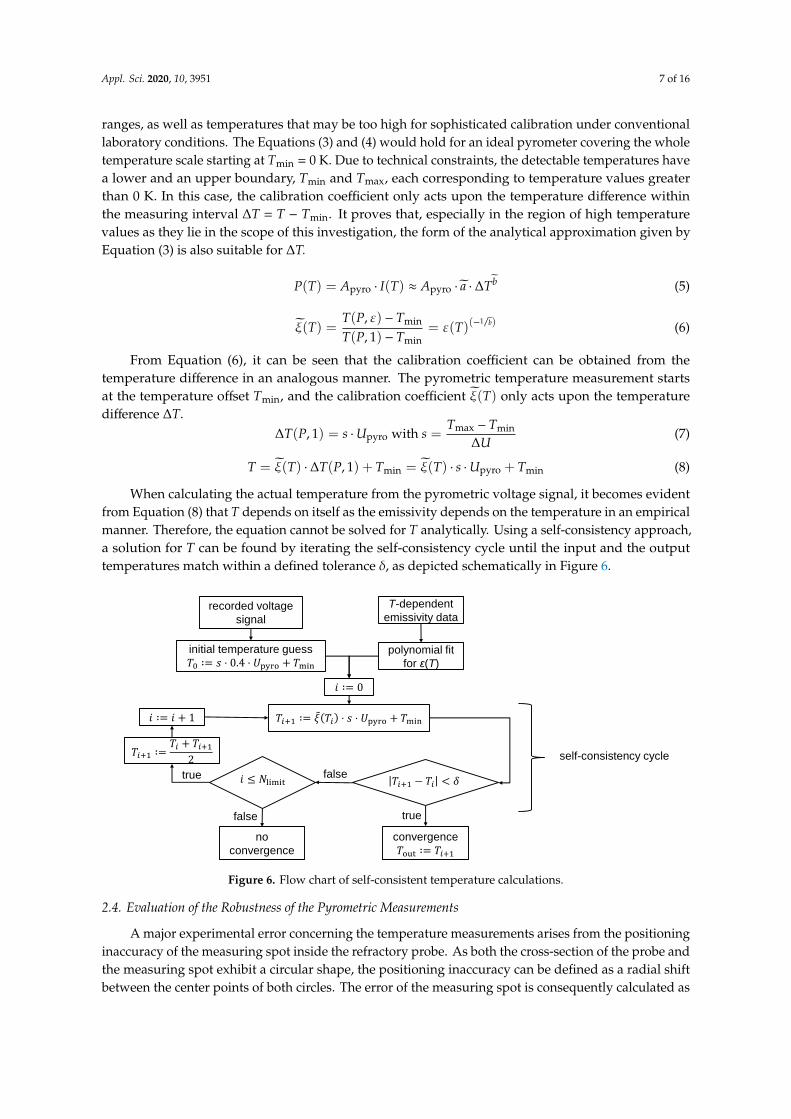
When calculating the actual temperature from the pyrometric voltage signal, it becomes evidentfrom Equation (8) that T depends on itself as the emissivity depends on the temperature in an empiricalmanner. Therefore, the equation cannot be solved for T analytically. Using a self-consistency approach,a solution for T can be found by iterating the self-consistency cycle until the input and the outputtemperatures match within a defined tolerance δ, as depicted schematically in Figure 6.Appl. Sci. 2020, 10, x FOR PEER REVIEW 8 of 17
Figure 6. Flow chart of self-consistent temperature calculations.
2.4. Evaluation of the Robustness of the Pyrometric Measurements
A major experimental error concerning the temperature measurements arises from the positioning
inaccuracy of the measuring spot inside the refractory probe. As both the cross-section of the probe and
the measuring spot exhibit a circular shape, the positioning inaccuracy can be defined as a radial shift
between the center points of both circles. The error of the measuring spot is consequently calculated as
the difference between the circular segments of both circles corresponding to their intersection points
at s1 and s2, as shown in Figure 7a.
Figure 7. Influence of positioning errors on the pyrometric measurements: (a) geometric deviation of the
measuring spot, and (b) resulting relative temperature deviation exemplarily for the emissivity of
tantalum.
For small-band pyrometers, the measured temperature depends strongly on the overlap between
the measuring spot and the area of interest. An insufficient overlap has a drastic impact on the
outcome of the measurement, as can be seen in Figure 7b for the example of the emissivity of tantalum
(Ta). It is important to mention that the relative error increases for high temperatures as the deviation
BIAS ID 200199Pordzik 2020
initial temperature guess
𝑇 = 𝑠 ⋅ ⋅ 𝑈pyro + 𝑇min
polynomial fit
for ε(T)
𝑇 1 − 𝑇
𝑇 1 = 𝜉 𝑇 ⋅ 𝑠 ⋅ 𝑈pyro + 𝑇min
𝑇 1 =𝑇 + 𝑇 1
convergence
𝑇o = 𝑇 1
false
self-consistency cycle
T-dependent
emissivity datarecorded voltage
signal
=
= + 1
imi
true
no
convergence
true
false
Figure 6. Flow chart of self-consistent temperature calculations.
2.4. Evaluation of the Robustness of the Pyrometric Measurements
A major experimental error concerning the temperature measurements arises from the positioninginaccuracy of the measuring spot inside the refractory probe. As both the cross-section of the probe andthe measuring spot exhibit a circular shape, the positioning inaccuracy can be defined as a radial shiftbetween the center points of both circles. The error of the measuring spot is consequently calculated as
Appl. Sci. 2020, 10, 3951 8 of 16
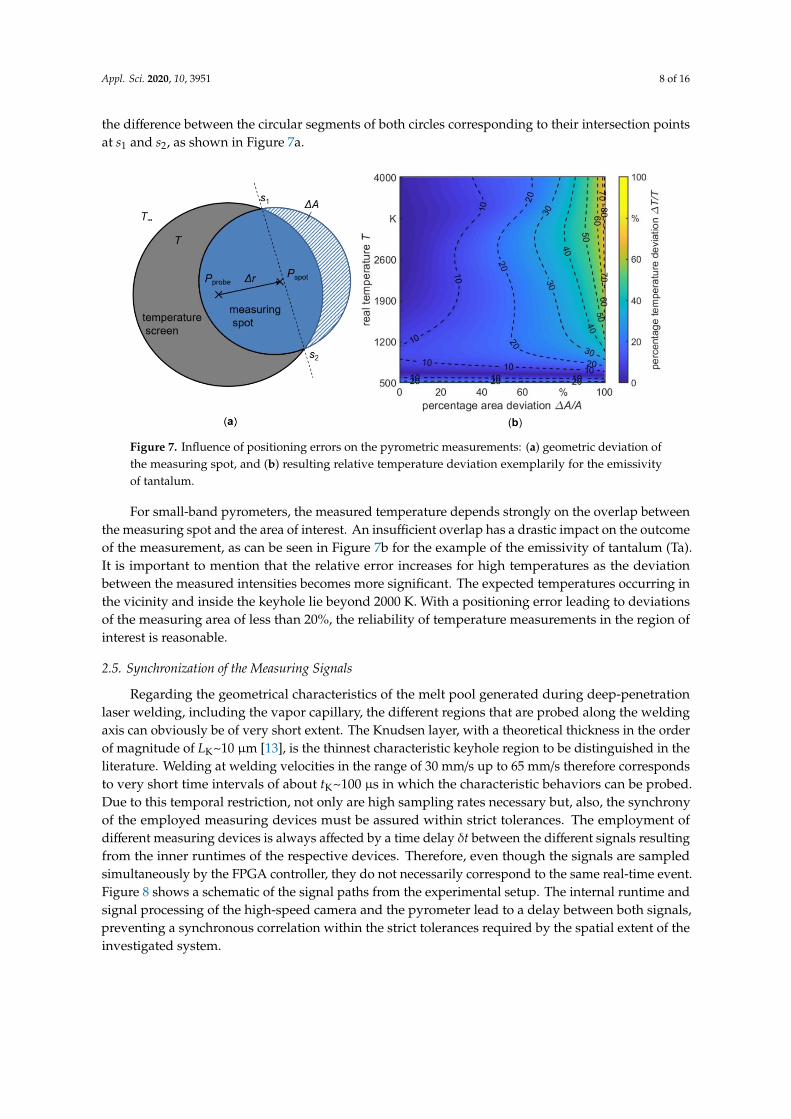
the difference between the circular segments of both circles corresponding to their intersection pointsat s1 and s2, as shown in Figure 7a.
Appl. Sci. 2020, 10, x FOR PEER REVIEW 8 of 17
Figure 6. Flow chart of self-consistent temperature calculations.
2.4. Evaluation of the Robustness of the Pyrometric Measurements
A major experimental error concerning the temperature measurements arises from the positioning
inaccuracy of the measuring spot inside the refractory probe. As both the cross-section of the probe and
the measuring spot exhibit a circular shape, the positioning inaccuracy can be defined as a radial shift
between the center points of both circles. The error of the measuring spot is consequently calculated as
the difference between the circular segments of both circles corresponding to their intersection points
at s1 and s2, as shown in Figure 7a.
Figure 7. Influence of positioning errors on the pyrometric measurements: (a) geometric deviation of the
measuring spot, and (b) resulting relative temperature deviation exemplarily for the emissivity of
tantalum.
For small-band pyrometers, the measured temperature depends strongly on the overlap between
the measuring spot and the area of interest. An insufficient overlap has a drastic impact on the
outcome of the measurement, as can be seen in Figure 7b for the example of the emissivity of tantalum
(Ta). It is important to mention that the relative error increases for high temperatures as the deviation
BIAS ID 200199Pordzik 2020
initial temperature guess
𝑇 = 𝑠 ⋅ ⋅ 𝑈pyro + 𝑇min
polynomial fit
for ε(T)
𝑇 1 − 𝑇
𝑇 1 = 𝜉 𝑇 ⋅ 𝑠 ⋅ 𝑈pyro + 𝑇min
𝑇 1 =𝑇 + 𝑇 1
convergence
𝑇o = 𝑇 1
false
self-consistency cycle
T-dependent
emissivity datarecorded voltage
signal
=
= + 1
imi
true
no
convergence
true
false
Figure 7. Influence of positioning errors on the pyrometric measurements: (a) geometric deviation ofthe measuring spot, and (b) resulting relative temperature deviation exemplarily for the emissivityof tantalum.
For small-band pyrometers, the measured temperature depends strongly on the overlap betweenthe measuring spot and the area of interest. An insufficient overlap has a drastic impact on the outcomeof the measurement, as can be seen in Figure 7b for the example of the emissivity of tantalum (Ta).It is important to mention that the relative error increases for high temperatures as the deviationbetween the measured intensities becomes more significant. The expected temperatures occurring inthe vicinity and inside the keyhole lie beyond 2000 K. With a positioning error leading to deviationsof the measuring area of less than 20%, the reliability of temperature measurements in the region ofinterest is reasonable.
2.5. Synchronization of the Measuring Signals
Regarding the geometrical characteristics of the melt pool generated during deep-penetrationlaser welding, including the vapor capillary, the different regions that are probed along the weldingaxis can obviously be of very short extent. The Knudsen layer, with a theoretical thickness in the orderof magnitude of LK~10 µm [13], is the thinnest characteristic keyhole region to be distinguished in theliterature. Welding at welding velocities in the range of 30 mm/s up to 65 mm/s therefore correspondsto very short time intervals of about tK~100 µs in which the characteristic behaviors can be probed.Due to this temporal restriction, not only are high sampling rates necessary but, also, the synchronyof the employed measuring devices must be assured within strict tolerances. The employment ofdifferent measuring devices is always affected by a time delay δt between the different signals resultingfrom the inner runtimes of the respective devices. Therefore, even though the signals are sampledsimultaneously by the FPGA controller, they do not necessarily correspond to the same real-time event.Figure 8 shows a schematic of the signal paths from the experimental setup. The internal runtime andsignal processing of the high-speed camera and the pyrometer lead to a delay between both signals,preventing a synchronous correlation within the strict tolerances required by the spatial extent of theinvestigated system.
Appl. Sci. 2020, 10, 3951 9 of 16
Appl. Sci. 2020, 10, x FOR PEER REVIEW 9 of 17
between the measured intensities becomes more significant. The expected temperatures occurring in
the vicinity and inside the keyhole lie beyond 2000 K. With a positioning error leading to deviations
of the measuring area of less than 20%, the reliability of temperature measurements in the region of
interest is reasonable.
2.5. Synchronization of the Measuring Signals
Regarding the geometrical characteristics of the melt pool generated during deep-penetration laser
welding, including the vapor capillary, the different regions that are probed along the welding axis can
obviously be of very short extent. The Knudsen layer, with a theoretical thickness in the order of
magnitude of LK~10 µm [13], is the thinnest characteristic keyhole region to be distinguished in the
literature. Welding at welding velocities in the range of 30 mm/s up to 65 mm/s therefore corresponds
to very short time intervals of about tK~100 µs in which the characteristic behaviors can be probed.
Due to this temporal restriction, not only are high sampling rates necessary but, also, the synchrony
of the employed measuring devices must be assured within strict tolerances. The employment of
different measuring devices is always affected by a time delay δt between the different signals resulting
from the inner runtimes of the respective devices. Therefore, even though the signals are sampled
simultaneously by the FPGA controller, they do not necessarily correspond to the same real-time event.
Figure 8 shows a schematic of the signal paths from the experimental setup. The internal runtime and
signal processing of the high-speed camera and the pyrometer lead to a delay between both signals,
preventing a synchronous correlation within the strict tolerances required by the spatial extent of the
investigated system.
Figure 8. Schematic of the signal paths in the experimental setup.
In order to analyze these internal delays, an experimental setup has been designed in which an
event is created that triggers the applied measurements simultaneously during well-defined and short
time intervals, as depicted in Figure 9. The continuous heat source that is to be detected by the
pyrometer is implemented by a tungsten lamp with an operating temperature of approximately
TW ≈ 2000 °C. The detectable event for the high-speed camera is given by the visibility of the
illumination laser spot. A shutter disk with a radius of R = 47.5 mm is used to interrupt the
corresponding beam paths with a frequency defined by the rotation speed and the diameter of the
semicircular notches. The beam path of the illumination laser and the focus of the pyrometer are
arranged in such a way that the camera and the pyrometer can detect the event at the same angular
position of the shutter disk. Based on the factual synchronicity of the physical events, it is now
possible to match the measured signals and thereby find the systematic delay between the measured
signals.
BIAS ID 200212Pordzik 2020
δt ch 0
ch 2
FPGAch 1
event
at
CNC
trigger
at hs camera
pyrometer
illumination laser
control unit
processing
laser
FPGA-clock
external trigger
data sampling
measuring signal
physical interaction
delay
Figure 8. Schematic of the signal paths in the experimental setup.
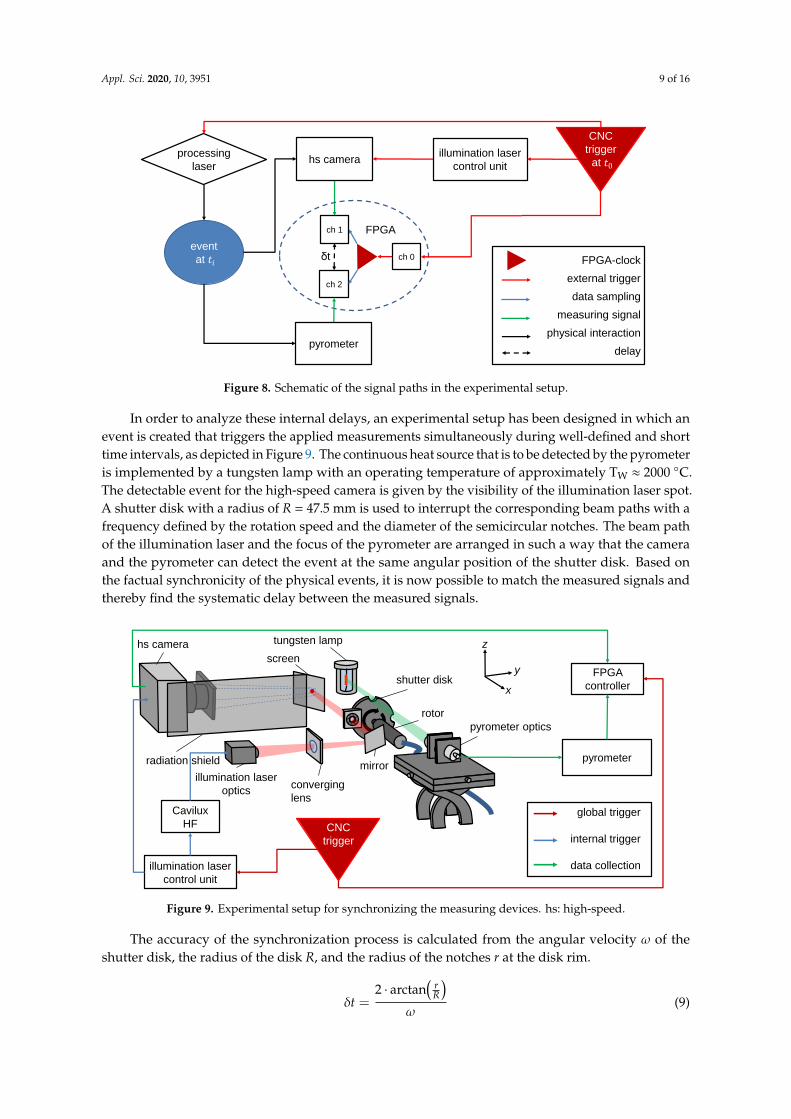
In order to analyze these internal delays, an experimental setup has been designed in which anevent is created that triggers the applied measurements simultaneously during well-defined and shorttime intervals, as depicted in Figure 9. The continuous heat source that is to be detected by the pyrometeris implemented by a tungsten lamp with an operating temperature of approximately TW ≈ 2000 ◦C.The detectable event for the high-speed camera is given by the visibility of the illumination laser spot.A shutter disk with a radius of R = 47.5 mm is used to interrupt the corresponding beam paths with afrequency defined by the rotation speed and the diameter of the semicircular notches. The beam pathof the illumination laser and the focus of the pyrometer are arranged in such a way that the cameraand the pyrometer can detect the event at the same angular position of the shutter disk. Based onthe factual synchronicity of the physical events, it is now possible to match the measured signals andthereby find the systematic delay between the measured signals.Appl. Sci. 2020, 10, x FOR PEER REVIEW 10 of 17
Figure 9. Experimental setup for synchronizing the measuring devices. hs: high-speed.
The accuracy of the synchronization process is calculated from the angular velocity ω of the
shutter disk, the radius of the disk R, and the radius of the notches r at the disk rim.
= ⋅ arctan (
𝑟𝑅)
𝜔 (9)
The high-speed recording during the synchronization setup is performed at a frame rate of
fHS = 100 kHz, matching the adjusted sampling rate of the FPGA controller. The signals from both the
pyrometric and high-speed images are postprocessed with threshold values and thereby transformed
into binary data indicating the detection of the event or the idle time, respectively. The shift between
the recorded signals is analyzed by cross-correlation, showing a significant peak at the configuration
of a maximal overlap between the input curves. Given a maximum rotation frequency of frot = 330 Hz
according to Equation (9), the maximum precision is given at a temporal uncertainty of δtmin = 40 µs.
As this uncertainty is smaller than the exposure time used for high-speed recordings during the
experiments of ΔtHS = 59 µs, the setup allows for synchronization between temperature data and
high-speed recordings within the accuracy of a single high-speed frame.
3. Results and Discussion
The temperature measurement inside the refractory probe was initially conducted with a single
parameter set that resulted in a comparatively good quality of the weld seam when welding pure
aluminum. The welding velocity was chosen to lie within the range of the Rosenthal regime so that the
vapor capillary was expected to have circular cross-sections perpendicular to the laser beam axis with
a homogeneous temperature distribution along its contour. The laser was operated at a power of
P = 5000 W with a focus shifted below the workpiece surface, thereby enlarging the keyhole diameter.
The defocus was chosen to result in a keyhole diameter on the workpiece surface dkey between 600 µm
and 900 µm, based on Skupin [5] and the previously measured beam profile. The welding velocity
was set to vweld = 50 mm/s, resulting in an energy per unit length of Edist = 100 J/mm.
An example temperature curve is depicted in Figure 10. The timespan during which temperature
values exceeding the minimum temperature of the pyrometer were obtained is referred to as region
of measurement (RoM). For better orientation, the origins of the time and length scales were chosen
to coincide with the moment or position, respectively, where the center axis of the laser beam reached
the tip of the probe. This convention is used for the presentation of all the following results. Although
the curve depicted in Figure 10 shows temperature values from past the keyhole position containing
different temperature maxima, as well as a pronounced cooling-down phase, according to the
experimental design, only measurements taken from the keyhole prerunning zone can contain reliable
BIAS ID 200214 Pordzik 2020
x,y,z-table
pyrometer optics
illumination laser
optics
y
x
zhs camera tungsten lamp
rotor
shutter disk
mirror
converging
lens
radiation shield
screen
Cavilux
HF
illumination laser
control unit
FPGA
controller
pyrometer
CNC
trigger
global trigger
internal trigger
data collection
Figure 9. Experimental setup for synchronizing the measuring devices. hs: high-speed.
The accuracy of the synchronization process is calculated from the angular velocity ω of theshutter disk, the radius of the disk R, and the radius of the notches r at the disk rim.
δt =2 · arctan
(rR
)ω
(9)
Appl. Sci. 2020, 10, 3951 10 of 16
The high-speed recording during the synchronization setup is performed at a frame rate off HS = 100 kHz, matching the adjusted sampling rate of the FPGA controller. The signals from both thepyrometric and high-speed images are postprocessed with threshold values and thereby transformedinto binary data indicating the detection of the event or the idle time, respectively. The shift betweenthe recorded signals is analyzed by cross-correlation, showing a significant peak at the configuration ofa maximal overlap between the input curves. Given a maximum rotation frequency of f rot = 330 Hzaccording to Equation (9), the maximum precision is given at a temporal uncertainty of δtmin = 40 µs.As this uncertainty is smaller than the exposure time used for high-speed recordings during theexperiments of ∆tHS = 59 µs, the setup allows for synchronization between temperature data andhigh-speed recordings within the accuracy of a single high-speed frame.
3. Results and Discussion
The temperature measurement inside the refractory probe was initially conducted with a singleparameter set that resulted in a comparatively good quality of the weld seam when welding purealuminum. The welding velocity was chosen to lie within the range of the Rosenthal regime so thatthe vapor capillary was expected to have circular cross-sections perpendicular to the laser beam axiswith a homogeneous temperature distribution along its contour. The laser was operated at a power ofP = 5000 W with a focus shifted below the workpiece surface, thereby enlarging the keyhole diameter.The defocus was chosen to result in a keyhole diameter on the workpiece surface dkey between 600 µmand 900 µm, based on Skupin [5] and the previously measured beam profile. The welding velocity wasset to vweld = 50 mm/s, resulting in an energy per unit length of Edist = 100 J/mm.
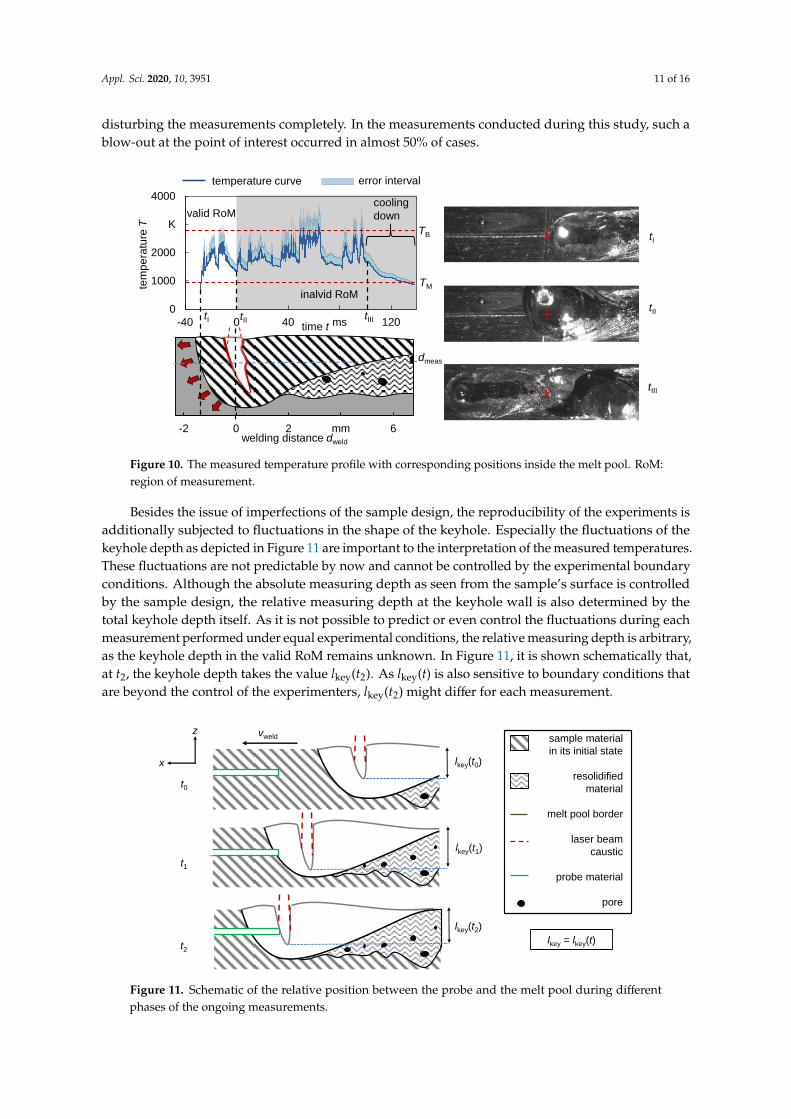
An example temperature curve is depicted in Figure 10. The timespan during which temperaturevalues exceeding the minimum temperature of the pyrometer were obtained is referred to as regionof measurement (RoM). For better orientation, the origins of the time and length scales were chosento coincide with the moment or position, respectively, where the center axis of the laser beamreached the tip of the probe. This convention is used for the presentation of all the following results.Although the curve depicted in Figure 10 shows temperature values from past the keyhole positioncontaining different temperature maxima, as well as a pronounced cooling-down phase, according tothe experimental design, only measurements taken from the keyhole prerunning zone can containreliable information on the temperature. The region past the keyhole cannot be interpreted dueto destruction of the probe. Nonetheless, information like the course of the cooling-down of themolten material obtained from the trailing region behind the keyhole can be used for validation of thetemperature calculations by indicating whether the temperature curve matches significant points ofthe phase transitions. Synchronizing the high-speed recordings with the pyrometric measurements,a small region is identified between t = −25 ms and t = −10 ms where the position of the keyhole frontcoincides with the position of the tantalum foil, and, therefore, the temperature of the front keyholeshould be approximated by the measurement. Inside this short region, the maximum temperaturesrecorded from different experiments range from Thigh = 1415 K to 2398 K. The fact that the initial slopesof all recorded temperature curves are steep and start at high values close to the melting temperature ofthe base material is probably due to imperfections in the drill hole geometries. A cross-section polishof the hole shows that, at the bottom, the shape shifts from cylindrical to conical. In the bottom region,the diameter decreases with the increasing depth; thus, the refractory probe cannot establish a laminarcontact with the bottom of the drill hole. The small space between the tantalum foil sealing the probeand the bottom of the drill hole traps air, which acts as a thermal isolator. Not enough heat for thefoil to emit radiation in the range detectable by the pyrometer is transferred from the weld materialuntil the melt reaches the cavity and starts transferring heat to the foil directly by heat conduction.Therefore, the temperature curves exhibit almost no trace of the prerunning heat. A more problematiceffect on the experimental procedure resulting from the entrapped air is that, depending on the volumeof air and the stability of the melt pool, the air can expand rapidly, causing a massive blow-out and
Appl. Sci. 2020, 10, 3951 11 of 16
disturbing the measurements completely. In the measurements conducted during this study, such ablow-out at the point of interest occurred in almost 50% of cases.
Appl. Sci. 2020, 10, x FOR PEER REVIEW 11 of 17
information on the temperature. The region past the keyhole cannot be interpreted due to destruction
of the probe. Nonetheless, information like the course of the cooling-down of the molten material
obtained from the trailing region behind the keyhole can be used for validation of the temperature
calculations by indicating whether the temperature curve matches significant points of the phase
transitions. Synchronizing the high-speed recordings with the pyrometric measurements, a small
region is identified between t = −25 ms and t = −10 ms where the position of the keyhole front
coincides with the position of the tantalum foil, and, therefore, the temperature of the front keyhole
should be approximated by the measurement. Inside this short region, the maximum temperatures
recorded from different experiments range from Thigh = 1415 K to 2398 K. The fact that the initial slopes
of all recorded temperature curves are steep and start at high values close to the melting temperature
of the base material is probably due to imperfections in the drill hole geometries. A cross-section polish
of the hole shows that, at the bottom, the shape shifts from cylindrical to conical. In the bottom region,
the diameter decreases with the increasing depth; thus, the refractory probe cannot establish a laminar
contact with the bottom of the drill hole. The small space between the tantalum foil sealing the probe
and the bottom of the drill hole traps air, which acts as a thermal isolator. Not enough heat for the
foil to emit radiation in the range detectable by the pyrometer is transferred from the weld material
until the melt reaches the cavity and starts transferring heat to the foil directly by heat conduction.
Therefore, the temperature curves exhibit almost no trace of the prerunning heat. A more problematic
effect on the experimental procedure resulting from the entrapped air is that, depending on the
volume of air and the stability of the melt pool, the air can expand rapidly, causing a massive blow-
out and disturbing the measurements completely. In the measurements conducted during this study,
such a blow-out at the point of interest occurred in almost 50% of cases.
Figure 10. The measured temperature profile with corresponding positions inside the melt pool.
RoM: region of measurement.
Besides the issue of imperfections of the sample design, the reproducibility of the experiments
is additionally subjected to fluctuations in the shape of the keyhole. Especially the fluctuations of the
keyhole depth as depicted in Figure 11 are important to the interpretation of the measured temperatures.
These fluctuations are not predictable by now and cannot be controlled by the experimental boundary
conditions. Although the absolute measuring depth as seen from the sample’s surface is controlled by the
sample design, the relative measuring depth at the keyhole wall is also determined by the total keyhole
depth itself. As it is not possible to predict or even control the fluctuations during each measurement
performed under equal experimental conditions, the relative measuring depth is arbitrary, as the keyhole
depth in the valid RoM remains unknown. In Figure 11, it is shown schematically that, at t2, the
BIAS ID 200211Pordzik 2020
0
1000
2000
K
4000
-40 0 40 ms 120
tem
pe
ratu
reT
time t
valid RoM
inalvid RoM
cooling
down
tI tII tIII
𝑑m
-2 0 2 mm 6welding distance dweld
TB
TM
dmeas
tI
tII
tIII
temperature curve error interval
Figure 10. The measured temperature profile with corresponding positions inside the melt pool. RoM:region of measurement.
Besides the issue of imperfections of the sample design, the reproducibility of the experiments isadditionally subjected to fluctuations in the shape of the keyhole. Especially the fluctuations of thekeyhole depth as depicted in Figure 11 are important to the interpretation of the measured temperatures.These fluctuations are not predictable by now and cannot be controlled by the experimental boundaryconditions. Although the absolute measuring depth as seen from the sample’s surface is controlledby the sample design, the relative measuring depth at the keyhole wall is also determined by thetotal keyhole depth itself. As it is not possible to predict or even control the fluctuations during eachmeasurement performed under equal experimental conditions, the relative measuring depth is arbitrary,as the keyhole depth in the valid RoM remains unknown. In Figure 11, it is shown schematically that,at t2, the keyhole depth takes the value lkey(t2). As lkey(t) is also sensitive to boundary conditions thatare beyond the control of the experimenters, lkey(t2) might differ for each measurement.
Appl. Sci. 2020, 10, x FOR PEER REVIEW 12 of 17
keyhole depth takes the value lkey(t2). As lkey(t) is also sensitive to boundary conditions that are beyond
the control of the experimenters, lkey(t2) might differ for each measurement.
Figure 11. Schematic of the relative position between the probe and the melt pool during different
phases of the ongoing measurements.
Throughout the experiments, eight measurements were conducted successfully. The temperature
profile obtained from the valid RoM, as distinguished in the previous section, is chosen as the
example for discussion (Figure 12). The temperature starts at values slightly below the melting point
of aluminum. In the beginning, the temperature curve is rather smooth and, then, becomes increasingly
noisy. In this early stage of the interaction between the melt pool and the refractory probe, damage
to the probe is unlikely, so the noise is not ascribed to scattered radiation or reflections of any kind
but, rather, to potential vibrations of the melt pool that are transferred to the probe. Thereby, the
angle between the temperature screen and the beam path of the pyrometer might change in short
time scales, influencing the detected intensity of the thermal radiation.
Figure 12. Temperature course from the prerunning melt to the probe destruction, i.e., within the
keyhole prerunning region.
The pronounced temperature drop at the end of the depicted region is related to the blow-out
that occurs when the keyhole reaches the tantalum foil. It is possible that the fact that the temperature
BIAS ID 200202Pordzik 2020
sample material
in its initial state
resolidified
material
melt pool border
laser beam
caustic
probe material
pore
lkey = lkey(t)
x
z
t0
t1
t2
lkey(t0)
lkey(t1)
lkey(t2)
vweld
BIAS ID 200374Pordzik 2020
0
1000
2000
K
4000
-30 -20 ms 0
tem
pe
ratu
reT
time t
TM
TB
vibrations
steady temperature dropabrupt temperature drop
temperature curve error interval
Figure 11. Schematic of the relative position between the probe and the melt pool during differentphases of the ongoing measurements.
Appl. Sci. 2020, 10, 3951 12 of 16
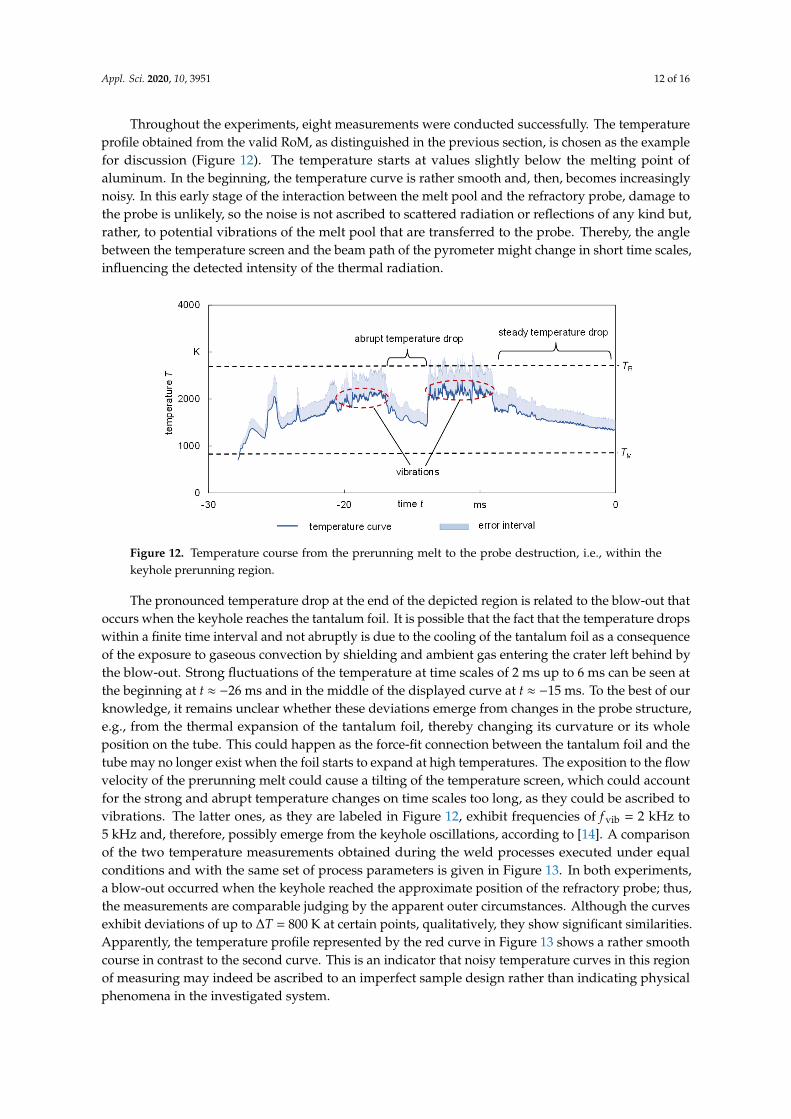
Throughout the experiments, eight measurements were conducted successfully. The temperatureprofile obtained from the valid RoM, as distinguished in the previous section, is chosen as the examplefor discussion (Figure 12). The temperature starts at values slightly below the melting point ofaluminum. In the beginning, the temperature curve is rather smooth and, then, becomes increasinglynoisy. In this early stage of the interaction between the melt pool and the refractory probe, damage tothe probe is unlikely, so the noise is not ascribed to scattered radiation or reflections of any kind but,rather, to potential vibrations of the melt pool that are transferred to the probe. Thereby, the anglebetween the temperature screen and the beam path of the pyrometer might change in short time scales,influencing the detected intensity of the thermal radiation.
1
Figure 12. Temperature course from the prerunning melt to the probe destruction, i.e., within thekeyhole prerunning region.
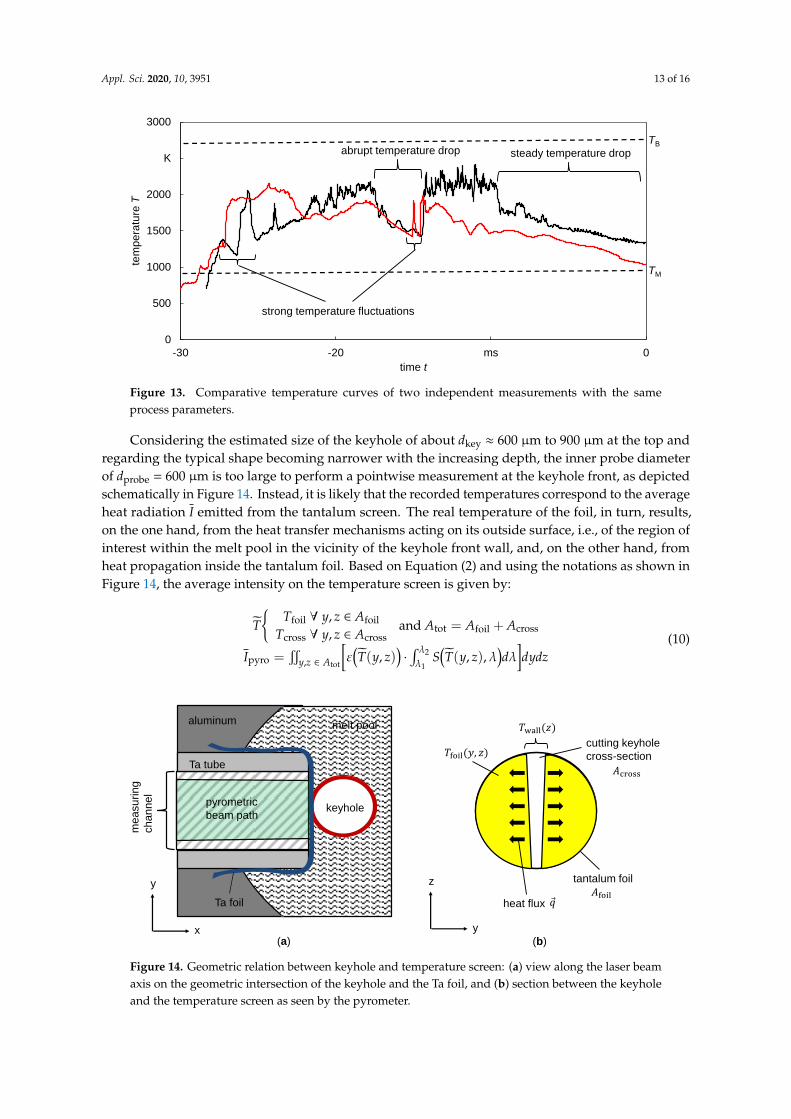
The pronounced temperature drop at the end of the depicted region is related to the blow-out thatoccurs when the keyhole reaches the tantalum foil. It is possible that the fact that the temperature dropswithin a finite time interval and not abruptly is due to the cooling of the tantalum foil as a consequenceof the exposure to gaseous convection by shielding and ambient gas entering the crater left behind bythe blow-out. Strong fluctuations of the temperature at time scales of 2 ms up to 6 ms can be seen atthe beginning at t ≈ −26 ms and in the middle of the displayed curve at t ≈ −15 ms. To the best of ourknowledge, it remains unclear whether these deviations emerge from changes in the probe structure,e.g., from the thermal expansion of the tantalum foil, thereby changing its curvature or its wholeposition on the tube. This could happen as the force-fit connection between the tantalum foil and thetube may no longer exist when the foil starts to expand at high temperatures. The exposition to the flowvelocity of the prerunning melt could cause a tilting of the temperature screen, which could accountfor the strong and abrupt temperature changes on time scales too long, as they could be ascribed tovibrations. The latter ones, as they are labeled in Figure 12, exhibit frequencies of f vib = 2 kHz to5 kHz and, therefore, possibly emerge from the keyhole oscillations, according to [14]. A comparisonof the two temperature measurements obtained during the weld processes executed under equalconditions and with the same set of process parameters is given in Figure 13. In both experiments,a blow-out occurred when the keyhole reached the approximate position of the refractory probe; thus,the measurements are comparable judging by the apparent outer circumstances. Although the curvesexhibit deviations of up to ∆T = 800 K at certain points, qualitatively, they show significant similarities.Apparently, the temperature profile represented by the red curve in Figure 13 shows a rather smoothcourse in contrast to the second curve. This is an indicator that noisy temperature curves in this regionof measuring may indeed be ascribed to an imperfect sample design rather than indicating physicalphenomena in the investigated system.
Appl. Sci. 2020, 10, 3951 13 of 16
Appl. Sci. 2020, 10, x FOR PEER REVIEW 13 of 17
drops within a finite time interval and not abruptly is due to the cooling of the tantalum foil as a
consequence of the exposure to gaseous convection by shielding and ambient gas entering the crater
left behind by the blow-out. Strong fluctuations of the temperature at time scales of 2 ms up to 6 ms
can be seen at the beginning at t ≈ −26 ms and in the middle of the displayed curve at t ≈ −15 ms. To the
best of our knowledge, it remains unclear whether these deviations emerge from changes in the probe
structure, e.g., from the thermal expansion of the tantalum foil, thereby changing its curvature or its
whole position on the tube. This could happen as the force-fit connection between the tantalum foil and
the tube may no longer exist when the foil starts to expand at high temperatures. The exposition to
the flow velocity of the prerunning melt could cause a tilting of the temperature screen, which could
account for the strong and abrupt temperature changes on time scales too long, as they could be
ascribed to vibrations. The latter ones, as they are labeled in Figure 12, exhibit frequencies of
fvib = 2 kHz to 5 kHz and, therefore, possibly emerge from the keyhole oscillations, according to [14].
A comparison of the two temperature measurements obtained during the weld processes executed
under equal conditions and with the same set of process parameters is given in Figure 13. In both
experiments, a blow-out occurred when the keyhole reached the approximate position of the refractory
probe; thus, the measurements are comparable judging by the apparent outer circumstances. Although
the curves exhibit deviations of up to ΔT = 800 K at certain points, qualitatively, they show significant
similarities. Apparently, the temperature profile represented by the red curve in Figure 13 shows a
rather smooth course in contrast to the second curve. This is an indicator that noisy temperature
curves in this region of measuring may indeed be ascribed to an imperfect sample design rather than
indicating physical phenomena in the investigated system.
Figure 13. Comparative temperature curves of two independent measurements with the same process
parameters.
Considering the estimated size of the keyhole of about dkey ≈ 600 µm to 900 µm at the top and
regarding the typical shape becoming narrower with the increasing depth, the inner probe diameter
of dprobe = 600 µm is too large to perform a pointwise measurement at the keyhole front, as depicted
schematically in Figure 14. Instead, it is likely that the recorded temperatures correspond to the
average heat radiation 𝐼 emitted from the tantalum screen. The real temperature of the foil, in turn,
results, on the one hand, from the heat transfer mechanisms acting on its outside surface, i.e., of the
region of interest within the melt pool in the vicinity of the keyhole front wall, and, on the other hand,
from heat propagation inside the tantalum foil. Based on Equation (2) and using the notations as
shown in Figure 14, the average intensity on the temperature screen is given by:
BIAS ID 200375Pordzik 2020
0
500
1000
1500
2000
K
3000
-30 -20 ms 0
tem
pe
ratu
re T
time t
steady temperature drop
TM
TBabrupt temperature drop
strong temperature fluctuations
Figure 13. Comparative temperature curves of two independent measurements with the sameprocess parameters.
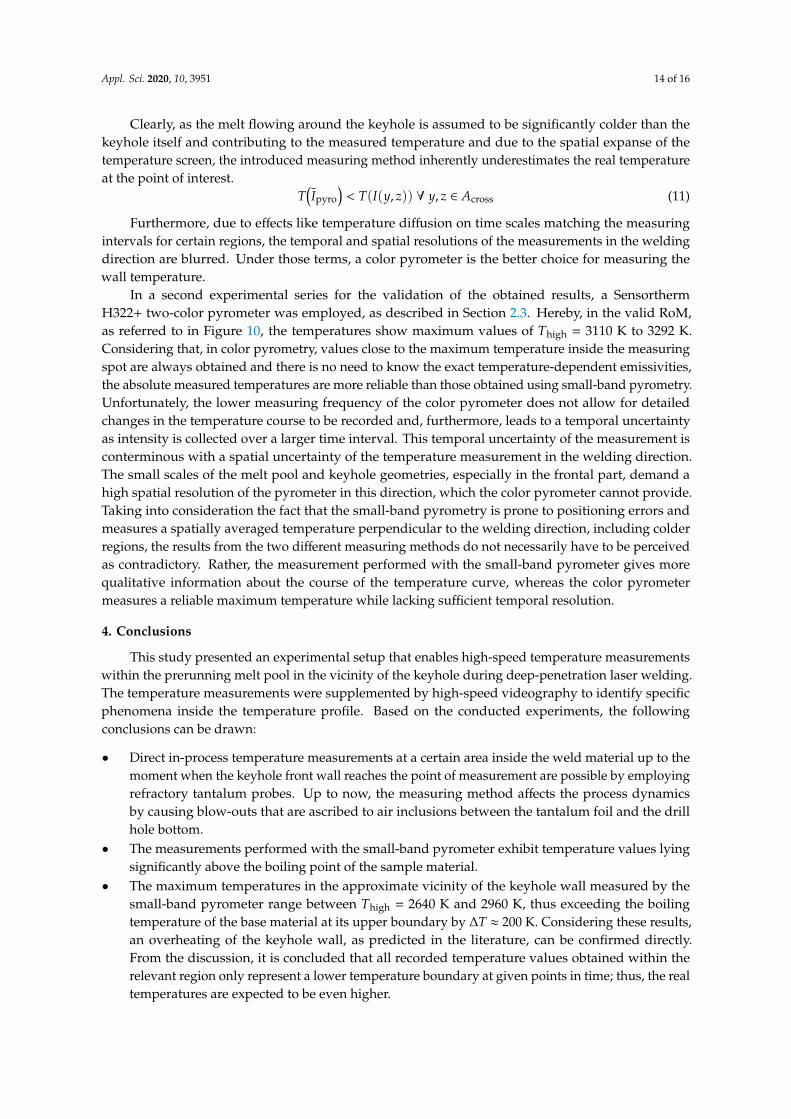
Considering the estimated size of the keyhole of about dkey ≈ 600 µm to 900 µm at the top andregarding the typical shape becoming narrower with the increasing depth, the inner probe diameterof dprobe = 600 µm is too large to perform a pointwise measurement at the keyhole front, as depictedschematically in Figure 14. Instead, it is likely that the recorded temperatures correspond to the averageheat radiation I emitted from the tantalum screen. The real temperature of the foil, in turn, results,on the one hand, from the heat transfer mechanisms acting on its outside surface, i.e., of the region ofinterest within the melt pool in the vicinity of the keyhole front wall, and, on the other hand, fromheat propagation inside the tantalum foil. Based on Equation (2) and using the notations as shown inFigure 14, the average intensity on the temperature screen is given by:
T{
Tfoil ∀ y, z ∈ Afoil
Tcross ∀ y, z ∈ Acrossand Atot = Afoil + Across
Ipyro =s
y,z ∈ Atot
[ε(T(y, z)
)·
∫ λ2
λ1S(T(y, z),λ
)dλ
]dydz
(10)
Appl. Sci. 2020, 10, x FOR PEER REVIEW 14 of 17
�� ≔ {𝑇foi ∀ 𝑦, 𝑧 ∈ 𝐴foi 𝑇cro ∀ 𝑦, 𝑧 ∈ 𝐴cro
and 𝐴 o = 𝐴foi + 𝐴cro
𝐼pyro =∬ [𝜀 (��(𝑦, 𝑧)) ⋅ ∫ 𝑆(��(𝑦, 𝑧), 𝜆)𝑑𝜆𝜆2
𝜆1
] 𝑑𝑦𝑑𝑧
𝑦,𝑧 ∈ 𝐴tot
(10)
Clearly, as the melt flowing around the keyhole is assumed to be significantly colder than the keyhole
itself and contributing to the measured temperature and due to the spatial expanse of the temperature
screen, the introduced measuring method inherently underestimates the real temperature at the point
of interest.
𝑇(𝐼pyro) 𝑇(𝐼(𝑦, 𝑧)) ∀ 𝑦, 𝑧 ∈ 𝐴cro (11)
Furthermore, due to effects like temperature diffusion on time scales matching the measuring
intervals for certain regions, the temporal and spatial resolutions of the measurements in the welding
direction are blurred. Under those terms, a color pyrometer is the better choice for measuring the
wall temperature.
Figure 14. Geometric relation between keyhole and temperature screen: (a) view along the laser beam
axis on the geometric intersection of the keyhole and the Ta foil, and (b) section between the keyhole
and the temperature screen as seen by the pyrometer.
In a second experimental series for the validation of the obtained results, a Sensortherm H322+
two-color pyrometer was employed, as described in Section 2.3. Hereby, in the valid RoM, as referred to
in Figure 10, the temperatures show maximum values of Thigh = 3110 K to 3292 K. Considering that,
in color pyrometry, values close to the maximum temperature inside the measuring spot are always
obtained and there is no need to know the exact temperature-dependent emissivities, the absolute
measured temperatures are more reliable than those obtained using small-band pyrometry.
Unfortunately, the lower measuring frequency of the color pyrometer does not allow for detailed
changes in the temperature course to be recorded and, furthermore, leads to a temporal uncertainty as
intensity is collected over a larger time interval. This temporal uncertainty of the measurement is
conterminous with a spatial uncertainty of the temperature measurement in the welding direction. The
small scales of the melt pool and keyhole geometries, especially in the frontal part, demand a high
spatial resolution of the pyrometer in this direction, which the color pyrometer cannot provide.
Taking into consideration the fact that the small-band pyrometry is prone to positioning errors and
measures a spatially averaged temperature perpendicular to the welding direction, including colder
regions, the results from the two different measuring methods do not necessarily have to be perceived
as contradictory. Rather, the measurement performed with the small-band pyrometer gives more
BIAS ID 200373Pordzik 2020
cutting keyhole
cross-section
tantalum foil
heat flux
melt pool
keyhole
Ta tube
aluminum
Ta foil
y
x
z
y
𝑇 (𝑧)
pyrometric
beam path
me
asu
rin
g
ch
an
ne
l
(a) (b)
𝐴cro
𝐴foi
𝑇foi (𝑦, 𝑧)
Figure 14. Geometric relation between keyhole and temperature screen: (a) view along the laser beamaxis on the geometric intersection of the keyhole and the Ta foil, and (b) section between the keyholeand the temperature screen as seen by the pyrometer.
Appl. Sci. 2020, 10, 3951 14 of 16
Clearly, as the melt flowing around the keyhole is assumed to be significantly colder than thekeyhole itself and contributing to the measured temperature and due to the spatial expanse of thetemperature screen, the introduced measuring method inherently underestimates the real temperatureat the point of interest.
T(Ipyro
)< T(I(y, z)) ∀ y, z ∈ Across (11)
Furthermore, due to effects like temperature diffusion on time scales matching the measuringintervals for certain regions, the temporal and spatial resolutions of the measurements in the weldingdirection are blurred. Under those terms, a color pyrometer is the better choice for measuring thewall temperature.
In a second experimental series for the validation of the obtained results, a SensorthermH322+ two-color pyrometer was employed, as described in Section 2.3. Hereby, in the valid RoM,as referred to in Figure 10, the temperatures show maximum values of Thigh = 3110 K to 3292 K.Considering that, in color pyrometry, values close to the maximum temperature inside the measuringspot are always obtained and there is no need to know the exact temperature-dependent emissivities,the absolute measured temperatures are more reliable than those obtained using small-band pyrometry.Unfortunately, the lower measuring frequency of the color pyrometer does not allow for detailedchanges in the temperature course to be recorded and, furthermore, leads to a temporal uncertaintyas intensity is collected over a larger time interval. This temporal uncertainty of the measurement isconterminous with a spatial uncertainty of the temperature measurement in the welding direction.The small scales of the melt pool and keyhole geometries, especially in the frontal part, demand ahigh spatial resolution of the pyrometer in this direction, which the color pyrometer cannot provide.Taking into consideration the fact that the small-band pyrometry is prone to positioning errors andmeasures a spatially averaged temperature perpendicular to the welding direction, including colderregions, the results from the two different measuring methods do not necessarily have to be perceivedas contradictory. Rather, the measurement performed with the small-band pyrometer gives morequalitative information about the course of the temperature curve, whereas the color pyrometermeasures a reliable maximum temperature while lacking sufficient temporal resolution.
4. Conclusions
This study presented an experimental setup that enables high-speed temperature measurementswithin the prerunning melt pool in the vicinity of the keyhole during deep-penetration laser welding.The temperature measurements were supplemented by high-speed videography to identify specificphenomena inside the temperature profile. Based on the conducted experiments, the followingconclusions can be drawn:
• Direct in-process temperature measurements at a certain area inside the weld material up to themoment when the keyhole front wall reaches the point of measurement are possible by employingrefractory tantalum probes. Up to now, the measuring method affects the process dynamicsby causing blow-outs that are ascribed to air inclusions between the tantalum foil and the drillhole bottom.
• The measurements performed with the small-band pyrometer exhibit temperature values lyingsignificantly above the boiling point of the sample material.
• The maximum temperatures in the approximate vicinity of the keyhole wall measured by thesmall-band pyrometer range between Thigh = 2640 K and 2960 K, thus exceeding the boilingtemperature of the base material at its upper boundary by ∆T ≈ 200 K. Considering these results,an overheating of the keyhole wall, as predicted in the literature, can be confirmed directly.From the discussion, it is concluded that all recorded temperature values obtained within therelevant region only represent a lower temperature boundary at given points in time; thus, the realtemperatures are expected to be even higher.

Appl. Sci. 2020, 10, 3951 15 of 16
• Comparative measurements conducted with color pyrometry showed maximum temperatures ofup to Thigh ≈ 3300 K, supporting the assumption of an overheated keyhole wall, as well as anunderestimation of the temperatures recorded by small-band pyrometry.
Author Contributions: Conceptualization, P.W. and R.P.; methodology, R.P. and P.W.; data analysis, R.P.;investigation, R.P.; discussion of contents, R.P. and P.W.; writing—original draft preparation, R.P.; writing—reviewand editing, P.W.; visualization, R.P.; supervision, P.W.; project administration, P.W.; and funding acquisition, P.W.All authors have read and agreed to the published version of the manuscript.
Funding: This research was funded by the DFG (Deutsche Forschungsgemeinschaft, project number 331150978).
Conflicts of Interest: The authors declare no conflicts of interest.
Abbreviations
Symbol Unit DescriptionAcross mm2 cross-sectional area between the tantalum foil and the vapor capillaryAfoil mm2 area of the tantalum foil, excluding the cross-sectional area with the vapor capillaryApyro mm2 area of the pyrometric measuring spotAtot mm2 total area of the tantalum foilBPPmin mm·mrad beam parameter productdfiber µm diameter of the optical fiberdfocus µm diameter of the transversal laser beam profile in the focal positiondkey µm diameter of the keyhole openingdin mm inner tube diameter of the refractory probedout mm outer tube diameter of the refractory probedspot mm minimum spot size of the pyrometric measuring beamdweld mm welding distance traveled by the laser beamδ K convergence threshold for self-consistent temperature calculationEdist J/mm energy per unit lengthξ - temperature calibration coefficientε - emissivity coefficientf HS kHz frame rate used for the high-speed recordingsf pyro kS/s sampling rate of the pyrometerf rot Hz rotation frequency of the shutter disk used for synchronizationf sample kS/s sampling rate used by the FPGA controller for data acquisitionf vib Hz vibration frequency of the melt pool or the vapor capillary, respectively
FWHM nmfull width at half-maximum of the transmitted wavelength interval of the bandpassfilter
h mm height of the weld sampleI W/mm2 intensityIkey W/mm2 threshold intensity of the laser beam required to enable a deep welding process
Ipyro W/mm2 intensity of the heat radiation in the wavelength interval detectable by thepyrometer
l mm length of the weld samplelkey mm length of the keyhole in the direction of the laser beam axis; keyhole depthLK µm thickness of the Knudsen layerω rad/s angular velocity of the shutter disk during the synchronization experimentsP W laser powerq W/mm2 heat fluxR mm radius of the shutter disk used during the synchronization experimentsr mm radius of the notches at the outer rim of the shutter diskS W/mm3 spectral energy density
s K/Vstraight slope of the translation between pyrometric voltage signal andtemperature difference
T K absolute temperature

Appl. Sci. 2020, 10, 3951 16 of 16
Tmin, Tmax K minimum/maximum temperature detectable by the pyrometerTlow, Thigh K minimum/maximum temperature detected during a specific measurementTW
◦C operating temperature of the tungsten lampt s time
tK µstimespan during which temperature values are obtained from inside the Knudsenlayer at a given welding velocity
δt µs systematic time delay between the different measuring signalsvweld m/s relative velocity between the laser beam and the sample surfaceλ nm wavelength of lightλBP nm transmissive wavelength of the bandpass filterλill nm operational wavelength of the illumination laserλpyro nm operational wavelengths of the pyrometerUpyro V pyrometric voltage signalw mm width of the weld samplezR mm Rayleigh length
References
1. Katayama, S.; Kawahito, Y.; Mizutani, M. Latest Progress in Performance and Understanding of LaserWelding. Phys. Procedia 2012, 39, 8–16. [CrossRef]
2. Bliedtner, J.; Müller, H.; Barz, A. Lasermaterialbearbeitung; Carl Hanser Verlag: München, Germany, 2013.3. Svenungsson, J.; Choquet, I.; Kaplan, A. Laser welding process—A review of keyhole welding modelling.
Phys. Procedia 2015, 78, 182–191. [CrossRef]4. Hügel, H.; Graf, T. Laser in der Fertigung: Strahlquellen, Systeme, Fertigungsverfahren, 2nd ed.; Vieweg +
Teubner: Wiesbaden, Germany, 2009.5. Skupin, J. Nichtlinear Dynamisches Modell Zum Laserstrahlschweissen von Aluminiumlegierungen.
Doctoral Thesis, Staats- und Universitätsbibliothek, Bremen, Germany, 2004.6. Finke, B.R.; Simon, G. On the gas kinetics of laser-induced evaporation of metals. J. Phys. D Appl. Phys. 1990,
23, 67–74. [CrossRef]7. Ki, H.; Mazumder, J.; Mohanty, P.S. Modeling of laser keyhole welding: Part II. simulation of keyhole
evolution, velocity, temperature profile, and experimental verification. Metall. Mat. Trans. A 2002, 33,1831–1842. [CrossRef]
8. Volpp, J.; Vollertsen, F. Keyhole stability during laser welding—Part I: Modeling and evaluation. Prod. Eng.Res. Dev. 2016, 10, 443–457. [CrossRef]
9. Fabbro, R. Melt pool and keyhole behaviour analysis for deep penetration laser welding. J. Phys. D Appl. Phys.2010, 43, 445501. [CrossRef]
10. Berger, P.; Hügel, H. Fluid dynamic effects in keyhole welding—An attempt to characterize different regimes.Phys. Procedia 2014, 41, 216–224. [CrossRef]
11. Kroos, J.; Gratzke, U.; Simon, G. Towards a self-consistent model of the keyhole inpenetration laser beamwelding. J. Phys. D Appl. Phys. 1993, 26, 474–480. [CrossRef]
12. Matthes, K.-J.; Richter, E. (Eds.) Schweißtechnik: Schweißen von Metallischen Konstruktionswerkstoffen;Mit 130 Tafeln, 3rd ed.; Fachbuchverl. Leipzig im Carl-Hanser-Verl.: München, Germany, 2006.
13. Krivtsun, I.V.; Sukhorukov, S.B.; Sidorets, V.N.; Kovalev, O.B. Modelling of the Processes of Evaporation ofMetal and Gas Dynamics of Metal Vapour inside a Keyhole in Laser Welding. Paton Weld. J. 2008, 10, 16–21.
14. Geiger, M.; Kägeler, C.; Schmidt, M. High-power laser welding of contaminated steel sheets. Prod. Eng.Res. Devel. 2008, 2, 235–240. [CrossRef]
© 2020 by the authors. Licensee MDPI, Basel, Switzerland. This article is an open accessarticle distributed under the terms and conditions of the Creative Commons Attribution(CC BY) license (http://creativecommons.org/licenses/by/4.0/).
Related Documents