This is an Accepted Manuscript, which has been through the Royal Society of Chemistry peer review process and has been accepted for publication. Accepted Manuscripts are published online shortly after acceptance, before technical editing, formatting and proof reading. Using this free service, authors can make their results available to the community, in citable form, before we publish the edited article. We will replace this Accepted Manuscript with the edited and formatted Advance Article as soon as it is available. You can find more information about Accepted Manuscripts in the Information for Authors. Please note that technical editing may introduce minor changes to the text and/or graphics, which may alter content. The journal’s standard Terms & Conditions and the Ethical guidelines still apply. In no event shall the Royal Society of Chemistry be held responsible for any errors or omissions in this Accepted Manuscript or any consequences arising from the use of any information it contains. Accepted Manuscript Nanoscale www.rsc.org/nanoscale View Article Online View Journal This article can be cited before page numbers have been issued, to do this please use: U. K. Sen, P. Johari, S. Basu, C. Nayak and S. Mitra, Nanoscale, 2014, DOI: 10.1039/C4NR02480J.

Welcome message from author
This document is posted to help you gain knowledge. Please leave a comment to let me know what you think about it! Share it to your friends and learn new things together.
Transcript

This is an Accepted Manuscript, which has been through the Royal Society of Chemistry peer review process and has been accepted for publication.
Accepted Manuscripts are published online shortly after acceptance, before technical editing, formatting and proof reading. Using this free service, authors can make their results available to the community, in citable form, before we publish the edited article. We will replace this Accepted Manuscript with the edited and formatted Advance Article as soon as it is available.
You can find more information about Accepted Manuscripts in the Information for Authors.
Please note that technical editing may introduce minor changes to the text and/or graphics, which may alter content. The journal’s standard Terms & Conditions and the Ethical guidelines still apply. In no event shall the Royal Society of Chemistry be held responsible for any errors or omissions in this Accepted Manuscript or any consequences arising from the use of any information it contains.
Accepted Manuscript
Nanoscale
www.rsc.org/nanoscale
View Article OnlineView Journal
This article can be cited before page numbers have been issued, to do this please use: U. K. Sen, P.
Johari, S. Basu, C. Nayak and S. Mitra, Nanoscale, 2014, DOI: 10.1039/C4NR02480J.
Journal Name RSCPublishing
ARTICLE
This journal is © The Royal Society of Chemistry 2013 J. Name ., 2013, 00 , 1-3 | 1
Cite this: DOI: 10.1039/x0xx00000x
Received 00th January 2012, Accepted 00th January 2012
DOI: 10.1039/x0xx00000x
www.rsc.org/
Understanding Lithium Storage Mechanism in Molybdenum Disulfide Uttam Kumar Sen1, Priya Johari2*, Sohini Basu3, Chandrani Nayak3, and Sagar Mitra1*
The lithium storage mechanism in molybdenum disulfide (MoS2) has been comprehensively investigated as the existing conversion based storage mechanism is unable to explain the reason behind the high practical capacity, high polarization losses, and the change in the discharge profile after 1st cycle. To resolve these issues by having a deeper understanding of the MoS2-based Li-ion batteries, for the first time, the reaction mechanism of MoS2 anode is studied in light of various experimental techniques such as XRD, Raman spectroscopy, electrochemical impedance spectroscopy, XANES, and EXAFS, as well as ab-initio density functional theory based calculations. On the basis of the results presented here, in line with some experimental findings, we find that the reaction of MoS2 with Li is not as simple as usual metal oxide based conversion reaction, but the pathway of conversion reaction changes after first discharge process. In first discharge process, lithiation is initiated by limited intercalation process, followed by the conversion reaction that produces molybdenum nanoparticles (Mo) and lithium sulfide (Li 2S). While, on the contrary to oxide based conversion materials, MoS2 does not transverse back during the delithiation process. Instead of MoS2 formation, we have identified the presence of polysulfur after the complete cycle. In consecutive cycles, polysulfur reacts with lithium and form Li2S/Li2S2 and this Li-S reaction is found to be highly reversible in nature and the only source of high practical capacity observed in this electrode. To validate our experimental findings, an atomic scale ab-initio computational study is also carried out which likewise suggests that Li first intercalates between the MoS2 layers but after a certain concentration, it reacts with MoS2 to form Li2S. The calculations also support the non-reversibility of the conversion reaction by showing that Mo + Li2S formation is energetically more favourable than re-formation of MoS2 + Li.
Introduction
Conversion reaction based materials are considered to be a potential alternative to the intercalation based carbon anode in lithium-ion batteries1, 2. Most of the transition metal oxides/sulfides undergo conversion reaction with Li and produce metal nano-particles and lithium oxide/sulfide3. In recent years, transition metal sulfides (e.g. CoS, MoS2, WS2)4-8 are gaining more interest than their analogous oxides as lithium-ion battery anode, since sulfide anodes exhibit less polarisation losses compared to oxides. It was observed that the M-X (metal-anion) bond polarity is one of the main reason behind the polarisation loss and as the metal-sulfide bonds are less polar than the metal-oxide bonds, the polarisation loss decreases from oxide to sulfide materials9, 10. Among these sulfides, MoS2 is the most studied system as it can exhibit high reversible capacity with excellent cyclic stability. Extensive work has been done to achieve an enhanced reversible capacity, better cyclic life, and high columbic efficiency of MoS2 electrode by putting through nano-
structure formation11-14, composite formation15-18, and electrode fabrication11, 18. MoS2–based electrode demonstrates a stable capacity in the range of 850-900 mAh g-1 11, 13, 14, while composite electrodes using graphene or CNTs exhibits even higher reversible capacity of around 1300 mAh g-1 with an improved cyclic stability15, 16, 19. However there are some fundamental questions which are yet to be answered such as: (a) origin of high practical capacity than the theoretical capacity, (b) why there is a change in the nature of discharge profile after 1st cycle? and (c) actual mechanism of Li storage. In case of MoS2, the calculated capacity of the balanced reaction between MoS2 and Li (MoS2 + 4Li = Mo + 2Li2S) is 670 mAh g-1 as per conversion reaction. Whereas, the observed capacity reported in the literature is in the range of 850-1300 mAh g-1 11-19, which is much higher than that of the theoretical capacity. In general conversion based reactions itself are complicated and needs special investigation to understand the reaction mechanism20-24. Similarly, the reaction chemistry between MoS2 and Li is also not well explained in the literature11-
Page 1 of 12 Nanoscale
Nan
osca
leA
ccep
ted
Man
uscr
ipt
Publ
ishe
d on
04
July
201
4. D
ownl
oade
d by
Bro
wn
Uni
vers
ity o
n 17
/07/
2014
06:
10:2
7.
View Article OnlineDOI: 10.1039/C4NR02480J
ARTICLE Journal Name
2 | J. Name. , 2012, 00, 1-3 This journal is © The Royal Society of Chemistry 2012
19. Earlier reports illustrated that the MoS2 reacts with 4 mole of Li and produce Mo nanoparticles and Li2S (MoS2 + 4Li ↔ Mo + 2Li2S) and claimed the reaction is reversible in nature15-17, 25,
26. Recently few serious efforts were made to understand the charge discharge mechanism of MoS2 anode that questioned the earlier mechanism and discussed a possible shift in the reaction pathway from first cycle to the remaining cycles4, 27-30. The use of XRD27, 28, FTIR28 and TEM27 analysis identify the presence of elemental sulfur after first cycle and furthermore, the similarity in the charge discharge profile of MoS2 electrode (after 1st cycle) with Li/S battery4, 27, 31, 32 leads to conclude that after first cycle, the reaction is mainly between sulfur and Li rather than MoS2 and Li. However a detailed study to understand the mechanism of Li storage in MoS2 electrode is not hitherto reported and the reason behind the possible change in the reaction pathways has to be studied further. In this report, we intended to discuss the reaction mechanism of MoS2 and Li during the charge-discharge reaction with the help of different experimental techniques as well as theoretical studies. The MoS2 prepared by solid-state synthesis method was used to prepare the electrode and tested against Li. Different in-situ and ex-situ techniques were employed to investigate the lithiation/delithiation process. The end products of the charge-discharge cycles were analysed by using ex-situ XRD and Raman spectroscopy. The electronic state of Mo was determined by XAFS analysis, while the electrochemical impedance spectroscopy (EIS) was carried out during the progress of the reaction to predict the electrochemical environment within the electrode. The reaction mechanism of MoS2/Li reaction was proposed with the help of different characterisation techniques and predicted mechanism was used to explain the change in the charge-discharge profile. Furthermore, the observed behaviours were validated by simulating lithiation/delithiation processes using ab-initio density function theory (DFT) based approach. The results obtained from the theoretical calculations are found to be in good agreement with the experimental results. Experimental Section Synthesis MoS2 was prepared by modified gas phase synthesis using molybdenum trioxide (MoO3) nanobelts and sulfur. In first step, α-MoO3 nanobelts were prepared by hydrothermal method using acidic aqueous solution of sodium molybdate at 180 oC for 24 h in a 50 ml Teflon lined autoclave33. As prepared MoO3 (0.7 g) and excess of sulfur (3 g) were loaded in two individual quartz boats, and both the boats were placed inside two zone heating tubular furnace. MoO3 was placed in the higher heating zone (700 oC) and sulfur was placed in the upstream side (~ 400 oC) of the horizontal tubular furnace. H2 + N2 mixture (5% H2 + 95 % N2) gas was used as carrier gas, as well as reducing agent. The reaction was completed in 4 h, the sample was then calcined at 850 oC for 2 h and finally allowed to cool down to room temperature under ambient condition. Material Characterizations Powder X-ray diffraction (XRD) measurements were carried out at room temperature (30 C) using a Philips X’-pert diffractometer with Cu Kα radiation (λ = 1.5418 Å) at 40 kV and 40 mA. XRD analysis was used to characterise the as prepared powder sample, as well as the thin film electrode. To identify the different phases of the electrode components, ex-situ XRD technique was used after complete discharge-charge cycle. The information of different metal-sulfur vibrational modes were obtained by using Raman spectrometer (Jobin Yvon HR800)
having 514.5 nm laser at 10 mW power. Similar to XRD analysis, Raman spectroscopy was also done for as prepared powder sample and thin film electrode after different charge-discharge cycles. Field emission gun scanning electron microscope (FEG-SEM, JEOL-7600F) with a resolution of about 1 nm was used to study the surface morphology of the samples. Further investigations were done by the use of high resolution field emission transmission electron microscope (HR-TEM, JEOL-2100F). For SEM analysis, powder sample was sprinkled over carbon film and images were taken at the best operating conditions. For TEM analysis, a well dispersed solution was prepared by adding a pinch of MoS2 powder in acetone and the solution was ultrasonically dispersed for 10-15 min. One drop of the well dispersed solution was taken to the TEM grid to take the images at the best operating conditions. X-ray absorption fine structure (XAFS) measurements were carried out on MoS2 electrode before cycling (i.e. pristine MoS2), after half cycle (i.e. after first discharge process) and after ten cycles (i.e. ten charge- discharge cycles), at Mo K (20000 eV) edge at the energy scanning EXAFS beamline (BL-9), INDUS-2 Synchrotron Source (2.5 GeV, 120 mA), Raja Ramanna Centre for Advanced Technology (RRCAT), Indore, India34. The samples were in the form of thin film of thickness around 50 microns on Cu foil of thickness of 9 micron. The Scanning EXAFS beamline (BL-9) covers a photon energy range of 4-25 KeV and has a resolution (E/ΔE) of 10,000 at 10 KeV. The beamline uses a double crystal monochromator (DCM) with a Rh/Pt coated cylindrical pre-mirror for vertical collimation of the beam. The second crystal of the DCM which is a sagittal cylinder with radius of curvature in the range of 1.28-12.91 meters provides horizontal focusing to the beam. For measurements in the fluorescence mode, the sample is placed at 45o to the incident beam. An ionization chamber placed before the sample measures the incident flux (I0) and a vortex Si drift detector placed at 90o to the incident beam measures the intensity of fluorescence emitted by the sample (If). From these intensities the absorbance of the sample is found as a function of energy. Electrochemical cell fabrication and measurements Galvanostatic charge-discharge testing was carried out in a Swagelok type cell assembly having a half cell configuration like Li/Electrolyte/MoS2. Cells were assembled in an argon-filled glove box (Lab Star, Mbraun, Germany) with moisture and oxygen levels of ~ 1 ppm. Thin Li foil was used as the counter as well as reference electrode. Electrolyte used in this case was 1 M LiPF6 in EC/DMC (1:1 weight ratio) (LP-30, Merck, Germany). Borosilicate glass microfiber filters (GF/D, Whatman) with a thickness of 0.67 mm and pore size of 2.7 µm was used as a separator. The electrodes were prepared by using MoS2 as active material, carbon black (Super C-65, Timcal, Switzerland) as conductive additive and a polymeric binder (sodium salt of Carboxymethyl cellulose, CMC) with an overall ratio of 60:20:20. Cu foil having a thickness of 9 micrometer (µm) was used as current collector. Cyclic voltammetry (CV) profile was obtained by measuring i -V response at scan rate of 0.2 mV s-1 within the potential limit of 0.01 V-3.0 V vs. Li/Li+ using Bio-logic VMP-3 model. The electrochemical charge-discharge test was performed using Arbin Instrument, USA (BT2000 model) at a current density of 200 mA g-1 within a voltage cut off of 3.0 V and 0.01 V vs. Li/Li+. All the electrochemical measurements were done at a constant temperature of 20 °C. Electrochemical impedance spectroscopy (EIS) was carried out at different potentials during the charge-
Page 2 of 12Nanoscale
Nan
osca
leA
ccep
ted
Man
uscr
ipt
Publ
ishe
d on
04
July
201
4. D
ownl
oade
d by
Bro
wn
Uni
vers
ity o
n 17
/07/
2014
06:
10:2
7.
View Article OnlineDOI: 10.1039/C4NR02480J
Journal Name ARTICLE
This journal is © The Royal Society of Chemistry 2012 J. Name ., 2012, 00 , 1-3 | 3
discharge process using Bio-logic VMP-3 instrument. During the entire process, the cell was never been disconnected from the circuit, and we termed this technique as in-situ impedance spectroscopy (continuous impedance spectroscopy). Five different potential points were selected for EIS measurements such as 1.0 V, 0.5 V and 0.2 V vs. Li/Li+ during the discharge process, and 2.0 V and 2.7 V vs. Li/Li+ during the charge process. In the first cycle, EIS were taken at six points which include open circuit voltage (OCV) along with five different potentials as discussed above. At each point, potentiostatic EIS was taken within a frequency range of 1 MHz to 0.1 Hz and with ∆V = 5mV. For EIS measurements, charge-discharge was carried out at a current density of 50 mA g-1. For ex-situ characterisation, charge-discharge cycles were done in Swagelok type cells as it is easy to open. Electrodes were charged and discharged at a slower rate of 50 mA g-1. After complete charge-discharge cycles the cells were opened inside the argon filled glove box and the thin film electrode was washed with diethyl carbonate (DEC) to remove the electrolyte, and finally dried at 60 °C in vacuum for 12 h inside the glove box.
Computational Details To confirm the experimental findings and to understand the evolution of system with lithiation and delithiation of MoS2 anode in detail, we have performed ab-initio density functional theory (DFT) based calculations using Vienna Ab-Initio Simulation Package (VASP)35, 36. In our calculations projector-augmented-wave (PAW)37 potentials were used to account electron-ion interactions, while electron exchange-correlation (xc) interactions were treated using generalized gradient approximation (GGA) in the Perdew-Burke-Ernzerhof (PBE) version38. The lithiation/delithiation process was modeled by manually inserting/removing Li atoms at/from different locations between the layers of bulk MoS2/(Mo+Li2S) and then letting the structure to be optimize. Since we considered a bulk system, no vacuum was inserted along x, y, and z-directions and the system was kept periodic along all three directions. To study lithiation process, 1 to 8 Li atoms per MoS2 layer were inserted at different locations in between the layers of MoS2, arranged in AB staking. The unit cell contains two MoS2 units separated by at least 4.21 Å39 (optimized distance between MoS2 layers in bulk MoS2), with Li intercalated between them. The unit cell as well as the atoms, both were allowed to relax. The unit cell relaxation was performed by varying dimensions and shape of the cell, while atoms were allowed to relax until the atomic forces were less than 0.01 eV/Å. In most of the plane wave codes, volume and cell optimization generally affects the calculations of Pulay stress35, 36 by calculating the diagonal components of the stress tensor incorrect. A high energy cutoff for the plane wave basis sets is therefore needed in such calculations to obtain a reliable stress tensor. Hence, we used an energy cutoff of 520 eV throughout our calculations. During the calculations, we found that with the increase in Li concentration, the unit cell mainly expands in the z-direction, while relatively less or in equal amount along x- and y-directions. The k-point mesh was therefore chosen according to the dimension of the cell. Since the lattice vectors along x- and y- directions remain same, we chose 15 k-points along both of these directions, while in z- direction, k-points mesh was changed as per variation in the dimension of the unit cell along z-axis. In
general, for low concentration of Li atoms (1 or 2 Li/MoS2 layer) a k-points mesh of 15x15x15 was considered, while depending on the size of the system in z-direction (note: z lattice vector is longer than x and y), k-mesh of 15x15x5 or 15x15x3 or 15x15x1 was used for systems having higher Li concentration (3-8 Li atoms/MoS2 layer). Similarly, to examine the delithiation process, Li atoms were gradually removed from few of the optimized MoS2-Li configurations such as MoS2-2Li, MoS2-4Li, and MoS2-14Li which contain 1, 2, and 7 Li atoms per MoS2 layer. The atoms were removed from various locations and then both atoms, as well as the unit cell, were again allowed to relax and attain the optimized geometry. With the removal of Li atoms, the k-points mesh was also changed accordingly.
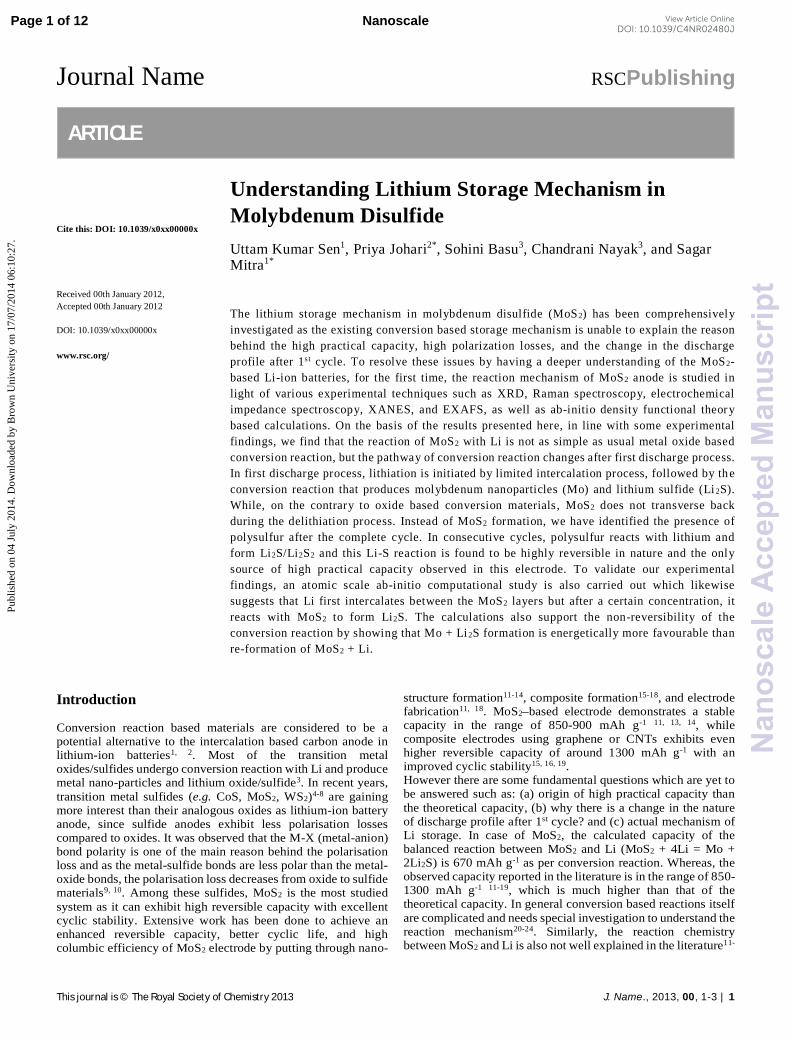
Experimental Results Pure phase of MoS2 powder was prepared by modified gas phase synthesis. XRD pattern shown in Figure 1(a), is indexed as hexagonal phase of MoS2 (JCPDS card No. 77-1716). Raman analysis (shown in Figure 1(b)) also confirms the formation of pure MoS2. MoS2 exhibits two sharp peaks at 384 cm-1 (E12g) and 408 cm-1 (A1g) which are due to the first-order Raman vibrational modes within the S–Mo–S layer. Both XRD and Raman analysis show that there was no oxide impurity in the sample.
Figure 1: (a) X-ray diffraction study, (b) Raman spectroscopy study of as prepared MoS2, (c) FEG-SEM, and (d) & (e) FEG-TEM images of MoS2 nanobelts prepared in 5% H2 atmosphere.
High resolution scanning electron micrograph was used to know the morphology of MoS2. Belt like MoS2 particles were observed having a width of ~ 200 nm whereas the length was in micrometer range (Figure 1(c)). To have a better idea of these nano belts, FEG-TEM imaging was done. Careful observation shows that very small nanorods having a diameter of ~ 10 nm were embedded inside the belts (Figure 1(d) & (e)). Electrochemical results MoS2 electrode was tested against metallic Li in a half cell configuration. Cyclic voltammogram of the half cell is shown in Figure 2(a). During the first cathodic sweep, two prominent peaks were observed at 1.1 V and 0.3 V vs. Li/Li+, while during anodic sweep one prominent peak at 2.3 V, and two small peaks
Page 3 of 12 Nanoscale
Nan
osca
leA
ccep
ted
Man
uscr
ipt
Publ
ishe
d on
04
July
201
4. D
ownl
oade
d by
Bro
wn
Uni
vers
ity o
n 17
/07/
2014
06:
10:2
7.
View Article OnlineDOI: 10.1039/C4NR02480J
ARTICLE Journal Name
4 | J. Name. , 2012, 00, 1-3 This journal is © The Royal Society of Chemistry 2012
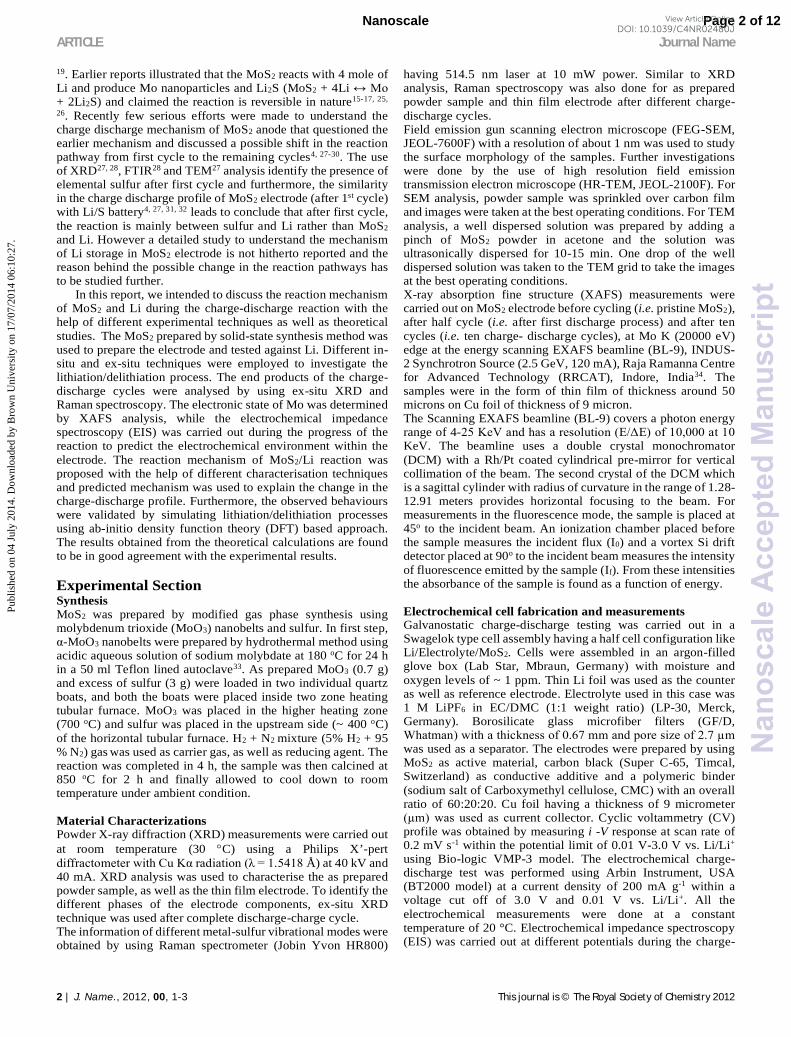
at 1.45 V and 1.7 V were observed. In the consecutive cycles, the anodic peaks remain unchanged whereas prominent changes were observed during the cathodic sweep. An extra cathodic peak at 1.8 V was observed in the 2nd cycle, which was split into two peaks after few cycles. It was also observed that the cathodic peak positions at 1.1 V and 0.3 V were shifted from 1st cycle to 2nd cycle to the remaining cycles. The explanations given in the literature for the origin of these peaks are debatable. According to most of the literature reports15-17, 25, 26, the cathodic peak in the range of 1.1 V to 0.9 V was due to the intercalation of Li ions whereas the peak in the range of 0.3 -0.5 V was due to conversion reaction between MoS2 and Li. Similarly, the anodic peak at ~ 2.3 V was known for MoS2 formation from Li2S and Mo and the small peaks in the range of 1.4 V to 1.8 V were assigned for multistep deintercalation reaction15, 17, 25, 26, 40. The origin of the cathodic peak in the range of 1.8 V to 1.95 V during the second cycle was assigned for the formation of gel like polymeric layer15, 40, 41. Recent reports raised question on these explanations as the authors have found that the obtained results are similar to lithium-sulfur battery14, 30. It is evident from the available literature that the first discharge reaction occurs in two steps, intercalation of Li+ into interlayer spacing of MoS2 followed by conversion reaction that produces Mo particles and Li2S. However the delithiation reaction is not properly understood since there is a possibility of formation of either MoS2 or polysulfur. The possibility of having a different delithiation mechanism altogether cannot be ruled out, as well. The outline of various possibilities of MoS2 /Li reaction is presented in schematic-1.
Schematic 1: Different possibilities of charge-discharge reaction of MoS2 with Li.
Above discussion shows that the actual reaction pathway for MoS2/Li reaction is not yet clear. Therefore, to understand the underlying reaction mechanism, we have performed XRD, Raman spectroscopy, and XAFS analysis on the end product of the reaction after discharge-charge cycling and the results have been discussed in the following sections.
Figure 2: (a) Cyclic voltammogram, (b) charge-discharge profile at 200 mA/g current rate and (c) cyclic performance of MoS2 anode in the range of 3.0 V to 0.01 V vs. Li/Li+ with at 200 mA g-1 current rate at 20 °C.
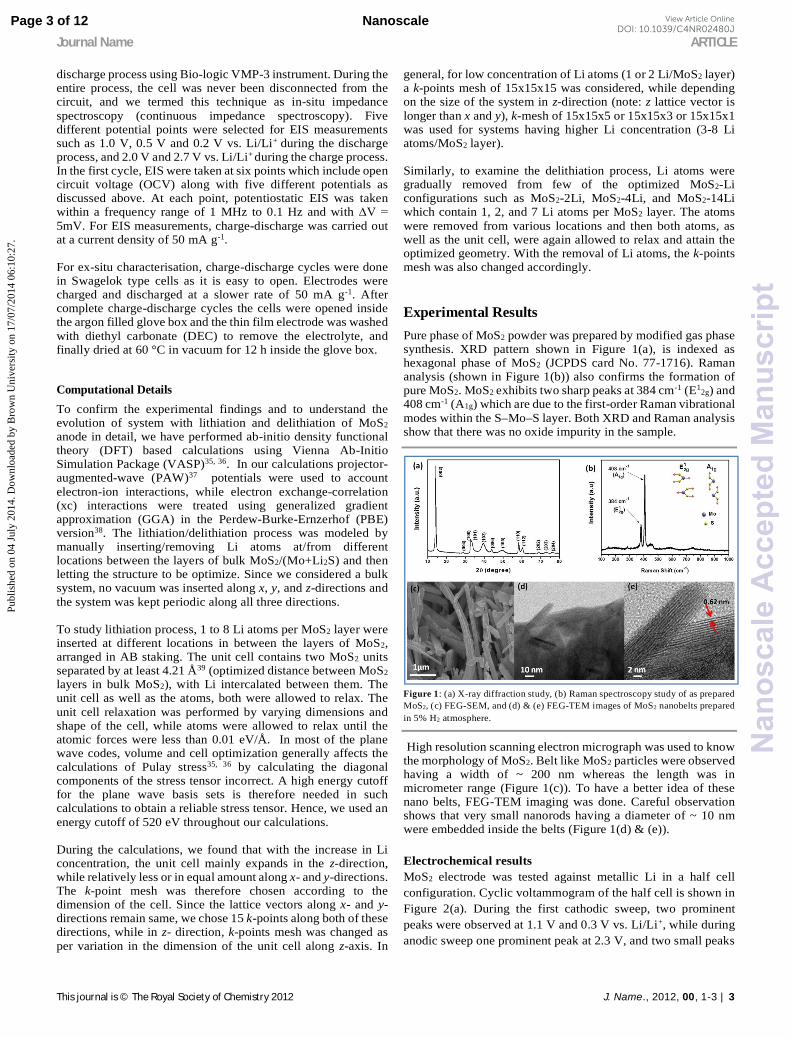
Ex-situ XRD and Raman analysis Ex-situ XRD analysis was performed on the MoS2 electrode before cycling and after 1st, 2nd, and 10th discharge-charge cycles to identify the phase of the electrode material (shown in Figure 3(a)). After first discharge-charge cycle it was found that the peaks corresponding to MoS2 were absent while new peaks at 24.93° and 33.12° along with two small humps at 21.22° and 36.63° emerged. Upon cycling these new XRD peaks become more intense. On careful investigation, it was found that the new peak positions were associated with various polymorph of sulfur. However, the most significant fact is that there is no signature of MoS2 after first cycle. It is evident from the ex-situ XRD analysis that after first discharge-charge cycle, the presence of MoS2 was not observed, but the presence of sulfur was noticed. Hence the ex-situ analysis suggests that the delithiation reaction does not lead to the formation of MoS2 as a reconversion product and the possibility of Mo + Li2S → MoS2 + Li reaction route is questionable.
Figure 3: (a) Ex-situ XRD and (b) Raman spectra for MoS2 electrode after different cycles.
To validate the XRD results, Raman analysis was performed on the same samples in ex-situ mode. As the electrode materials become amorphous (or nano-crystalline) after the conversion reaction and as a result, XRD analysis might fail to characterize all the phases present in the electrode sample. On the other hand,
Page 4 of 12Nanoscale
Nan
osca
leA
ccep
ted
Man
uscr
ipt
Publ
ishe
d on
04
July
201
4. D
ownl
oade
d by
Bro
wn
Uni
vers
ity o
n 17
/07/
2014
06:
10:2
7.
View Article OnlineDOI: 10.1039/C4NR02480J
Journal Name ARTICLE
This journal is © The Royal Society of Chemistry 2012 J. Name ., 2012, 00 , 1-3 | 5
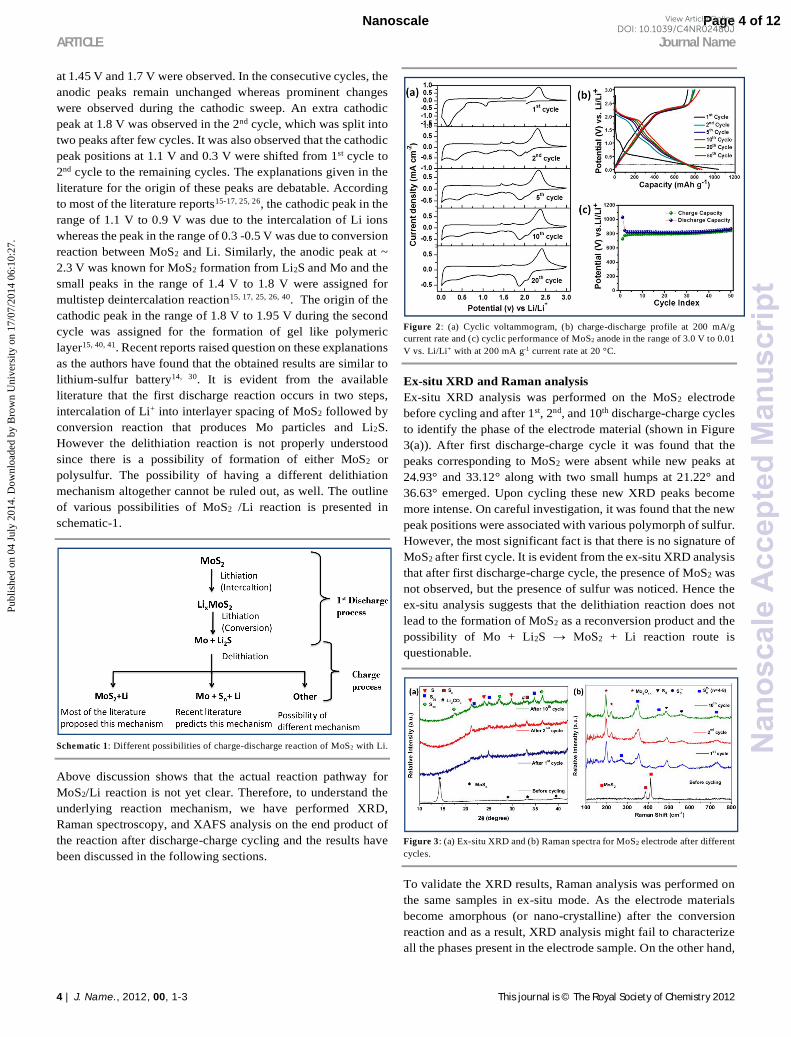
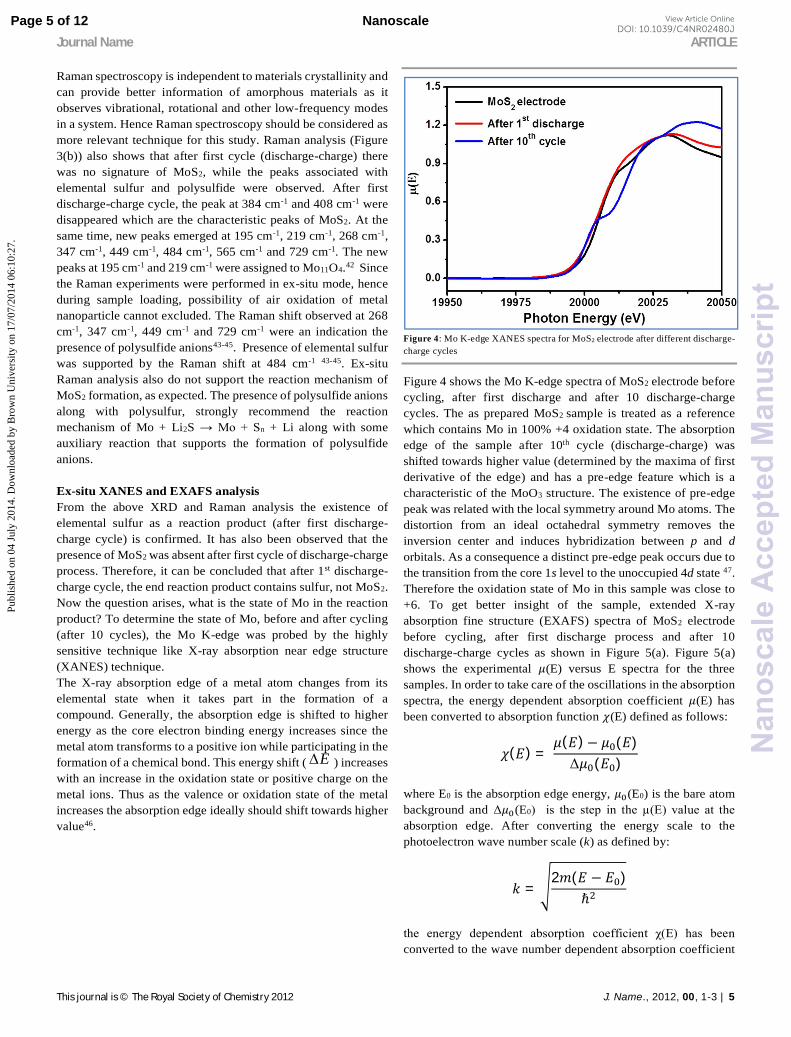
Raman spectroscopy is independent to materials crystallinity and can provide better information of amorphous materials as it observes vibrational, rotational and other low-frequency modes in a system. Hence Raman spectroscopy should be considered as more relevant technique for this study. Raman analysis (Figure 3(b)) also shows that after first cycle (discharge-charge) there was no signature of MoS2, while the peaks associated with elemental sulfur and polysulfide were observed. After first discharge-charge cycle, the peak at 384 cm-1 and 408 cm-1 were disappeared which are the characteristic peaks of MoS2. At the same time, new peaks emerged at 195 cm-1, 219 cm-1, 268 cm-1, 347 cm-1, 449 cm-1, 484 cm-1, 565 cm-1 and 729 cm-1. The new peaks at 195 cm-1 and 219 cm-1 were assigned to Mo11O4.42 Since the Raman experiments were performed in ex-situ mode, hence during sample loading, possibility of air oxidation of metal nanoparticle cannot excluded. The Raman shift observed at 268 cm-1, 347 cm-1, 449 cm-1 and 729 cm-1 were an indication the presence of polysulfide anions43-45. Presence of elemental sulfur was supported by the Raman shift at 484 cm-1 43-45. Ex-situ Raman analysis also do not support the reaction mechanism of MoS2 formation, as expected. The presence of polysulfide anions along with polysulfur, strongly recommend the reaction mechanism of Mo + Li2S → Mo + Sn + Li along with some auxiliary reaction that supports the formation of polysulfide anions. Ex-situ XANES and EXAFS analysis From the above XRD and Raman analysis the existence of elemental sulfur as a reaction product (after first discharge-charge cycle) is confirmed. It has also been observed that the presence of MoS2 was absent after first cycle of discharge-charge process. Therefore, it can be concluded that after 1st discharge-charge cycle, the end reaction product contains sulfur, not MoS2. Now the question arises, what is the state of Mo in the reaction product? To determine the state of Mo, before and after cycling (after 10 cycles), the Mo K-edge was probed by the highly sensitive technique like X-ray absorption near edge structure (XANES) technique. The X-ray absorption edge of a metal atom changes from its elemental state when it takes part in the formation of a compound. Generally, the absorption edge is shifted to higher energy as the core electron binding energy increases since the metal atom transforms to a positive ion while participating in the formation of a chemical bond. This energy shift ( E ) increases with an increase in the oxidation state or positive charge on the metal ions. Thus as the valence or oxidation state of the metal increases the absorption edge ideally should shift towards higher value46.
Figure 4: Mo K-edge XANES spectra for MoS2 electrode after different discharge-charge cycles
Figure 4 shows the Mo K-edge spectra of MoS2 electrode before cycling, after first discharge and after 10 discharge-charge cycles. The as prepared MoS2 sample is treated as a reference which contains Mo in 100% +4 oxidation state. The absorption edge of the sample after 10th cycle (discharge-charge) was shifted towards higher value (determined by the maxima of first derivative of the edge) and has a pre-edge feature which is a characteristic of the MoO3 structure. The existence of pre-edge peak was related with the local symmetry around Mo atoms. The distortion from an ideal octahedral symmetry removes the inversion center and induces hybridization between p and d orbitals. As a consequence a distinct pre-edge peak occurs due to the transition from the core 1s level to the unoccupied 4d state 47. Therefore the oxidation state of Mo in this sample was close to +6. To get better insight of the sample, extended X-ray absorption fine structure (EXAFS) spectra of MoS2 electrode before cycling, after first discharge process and after 10 discharge-charge cycles as shown in Figure 5(a). Figure 5(a) shows the experimental 휇(E) versus E spectra for the three samples. In order to take care of the oscillations in the absorption spectra, the energy dependent absorption coefficient 휇(E) has been converted to absorption function 휒(E) defined as follows:
휒(퐸) = 휇(퐸)− 휇 (퐸)
Δ휇 (퐸 )
where E0 is the absorption edge energy, 휇 (E0) is the bare atom background and Δ휇 (E0) is the step in the µ(E) value at the absorption edge. After converting the energy scale to the photoelectron wave number scale (k) as defined by:
푘 =2푚(퐸 − 퐸 )
ℏ
the energy dependent absorption coefficient χ(E) has been converted to the wave number dependent absorption coefficient
Page 5 of 12 Nanoscale
Nan
osca
leA
ccep
ted
Man
uscr
ipt
Publ
ishe
d on
04
July
201
4. D
ownl
oade
d by
Bro
wn
Uni
vers
ity o
n 17
/07/
2014
06:
10:2
7.
View Article OnlineDOI: 10.1039/C4NR02480J

ARTICLE Journal Name
6 | J. Name. , 2012, 00, 1-3 This journal is © The Royal Society of Chemistry 2012
χ(k), where m is the electron mass. Finally, χ(k) is weighted by k to amplify the oscillation at high k and the kχ(k) functions are Fourier transformed in R space to generate the χ(R) versus R (or FT-EXAFS) spectra in terms of the real distances from the center of the absorbing atom. It should be mentioned here that a set of EXAFS data analysis programs available within the IFEFFIT software package have been used for reduction and fitting of the experimental EXAFS data 48. This includes data reduction and Fourier transform to derive the χ(R) versus R spectra from the absorption spectra (using ATHENA software), generation of the theoretical EXAFS spectra starting from an assumed crystallographic structure and finally fitting of the experimental data with the theoretical spectra using the FEFF 6.0 code (using ARTEMIS software). The structural parameters for MoS2 and MoO3 used for simulation of theoretical EXAFS spectra have been taken from reported values in the literature49, 50. The fittings have been carried out using the IFEFFIT code (which uses a non-linear least-squares method to fit the experimental data) with R (bond distance), CN (neighbouring shell cocordination number) and σ2 (Debye-Waller factor) as fitting parameters and the typical uncertainties involved are of the order of 0.05 Å for R, 0.1 for CN and 0.001 for σ2. In order to determine the appropriate standard structure from the two possibilities (MoO3 and MoS2) we start the initial fitting of the experimental data for each sample, the first few scattering paths were generated theoretically and plotted along with the FT-EXAFS data in R space as shown in Figure 5(b). It should be mentioned here that the peak positions in R space differ from the actual bond length values by a phase factor which generally amounts to an increase of ~ 0.3 - 0.5 Å from the peak position values, depending on the type of the nearest neighbor scatterer. It is evident that the peaks corresponding to as prepared MoS2 sample, especially the first major peak at ~ 1.9 Å, indeed coincides with the theoretical nearest Mo-S single scattering (SS) path and the second major peak at ~ 2.9 Å converges with the next nearest Mo-Mo SS path (denoted by peaks A and B in Figure 5(b)). However, when the sample has undergone a discharge–charge cycle, the amplitude of the peak corresponding to the Mo-S SS path was reduced considerably and a new peak emerges at a lower radial distance of ~ 1.2 Å, which matches with the nearest Mo-O SS path arising from the MoO3 structure (denoted by peaks C and D in Figure 5(b)). Thus, there was a clear indication that both MoO3 and MoS2 states were present in this case. On the other hand, after the sample has been cycled 10 times, the Mo-O peak at 1.2 Å becomes dominant and the Mo-S peak reduces significantly (denoted by peaks E and F in Figure 5(c)). A smaller peak at ~2.0 Å was probably due to the farther Mo-O SS paths (Mo-O4 and Mo-O5 paths). Thus we can conclude that the contribution of MoS2 decreases as the sample undergoes increasing number of discharge-charge cycles and Mo goes from +4 oxidation state in MoS2 to +6 oxidation state in MoO3 after 10 discharge-charge cycles. This has also been observed previously from high resolution XANES measurements at Mo K-edge on similar samples as discussed earlier.
Finally, the EXAFS fitting has been carried out with MoS2 structure for as prepared MoS2 sample, with a combination of MoS2 and MoO3 structures for the sample cycled once and with MoO3 structure for the sample after 10 discharge-charge cycles and satisfactory fits were obtained with reasonably good fitting quality factors. Figure 5(c) shows the experimental χ(R) versus R spectra and the theoretical fits of the samples. The gradual changes in amplitude of different peaks were also evident from Figure 5(c). The best fit parameters are presented in Table T1 as supporting information. It should be noted that, for the sample after 10 discharge cycles the fit has been carried out upto the first two peaks in R space. The fit quality for this sample was poorer and the fitting range was smaller than the other two which indicates a more disordered environment in the sample.
Figure 5: (a) Normalized EXAFS spectra of MoS2 electrode samples after different discharge cycles, (b) the experimental χ(R) versus R spectra and the theoretical paths generated from both MoO3 and MoS2 standard structures, and (c) experimental χ(R) versus R spectra and the theoretical fits of MoS2 electrode before cycling, after 1st discharge process, and after 10 discharge-charge cycles.
From EXAFS analysis it was found that after few cycles of discharge-charge process there was no signature of Mo-S bond. The Mo-O bonds were observed due to the oxidation of metal nanoparticles in the presence of atmospheric oxygen. Since metal nanoparticles are known to be highly reactive, Mo nanoparticles get oxidized in the atmospheric condition to produce molybdenum oxide. Due to the same reason, the presence of Mo-O bond was observed in the first discharge product where only metal nanoparticles were supposed to be present. Some extent of Mo-S bond was also found after first discharge process due to the presence of unreacted MoS2 in the discharge product. From the above analysis it was evident that Mo-S bonds were broken during the lithiation process; however Mo-S bonds were not developed during the reverse reaction. Therefore it can be concluded that the re-formation of MoS2 in this electrochemical system is impossible. Electrochemical Impedance Spectroscopy (EIS) EIS is a well known technique to understand the overall electrode property and the electrochemical changes that have happened
Page 6 of 12Nanoscale
Nan
osca
leA
ccep
ted
Man
uscr
ipt
Publ
ishe
d on
04
July
201
4. D
ownl
oade
d by
Bro
wn
Uni
vers
ity o
n 17
/07/
2014
06:
10:2
7.
View Article OnlineDOI: 10.1039/C4NR02480J

Journal Name ARTICLE
This journal is © The Royal Society of Chemistry 2012 J. Name ., 2012, 00 , 1-3 | 7
within the electrode. To know the electrochemical environment within the electrode during charge-discharge process an in-situ impedance spectroscopy (or continuous impedance spectroscopy) was performed at five different points. Three points were taken during discharge process at 1.0 V, 0.5 V and 0.2 V vs. Li+/Li, whereas two points were taken during charge process at 2.0 V and 2.7 V vs. Li+/Li respectively.
Figure 6: EIS spectra of MoS2 electrode at different state of charge during discharge process for (a) 1st cycle, (b) 2nd cycle, (c) 10th cycle, (d) 11th cycle and during charge process for (e) 1st cycle, (f) 2nd cycle, (g) 10th cycle and (h) 11th cycle. (Details are given in the materials characterization section). Note that (c) and (d) are plotted on different scale for better clarity.
To realize the changes that occurred in the cell during discharge-charge cycling, the EIS were taken at five different points (mentioned above) for 1st cycle, 2nd cycle, 10th and 11th cycle as shown in Figure 6. It has been observed that in the first discharge cycle after 0.5 V, two semi circles were formed which signify the possible presence of two phases in the system, that could be Li2S and unreacted MoS2 (or lithiated MoS2). But the nature of EIS spectra of the discharge process has changed from 1st cycle to 2nd cycle which implies that after first cycle there was a change in the lithiation process. The EIS spectra of the lithiation process remained unchanged thereafter, indicating that after few initial cycles the lithiation reactions were stabilized. On the other hand, EIS of the charge profile (delithiation process) does not show any significant changes. This was also reflected in the charge-discharge profile, as well as cyclic voltammogram that during the charging process, reactions were unchanged from the 1st
cycle to the remaining cycles. So, it can be concluded from the EIS study that there was a significant change in the lithiation process (discharge process) from the 1st cycle to the remaining cycles, whereas the delithation process (charge process) remains the same. The EIS results are in good agreement with the above XRD and Raman analysis which confirm the possible shift in the lithiation process from 1st cycle to the remaining cycles. Discussion Above experimental results could argue that the reaction mechanism proposed in earlier reports, MoS2+xLi ↔ LixMoS2 + Li ↔ Mo + Li2S as a reversible reaction, is not true in actual scenario. The given reaction is only applicable for the first discharge cycle, where MoS2 reacts with Li to form Mo and Li2S, but the reverse reaction was not profound. During the reverse reaction (charge process) Li2S breaks to Li and polysulfur, that has been confirmed by XRD and Raman spectra. Mo remains in atomic or ionic form Mo+6 (as Mo+6 is most stable state) as shown form XAFS analysis. In the consecutive cycle, polysulfur reacts with Li to form Li2S and this Li/S reaction was found to be reversible. EIS also suggested that the electrochemistry of the discharge reaction (lithiation process) changes from 1st cycle to the remaining cycles whereas the delithiation process remains same for all the cycles. Based on this mechanism, the obtained CV result (Figure 2(a)) can be explained. In the first cathodic sweep (discharge process) Li intercalation was performed at ~1.1 V vs. Li+/Li followed by conversion reaction of MoS2 and Li at ~ 0.3 V leading to formation of Mo and Li2S. During the anodic sweep (charge process) the main reaction was the formation of sulfur from Li2S which give rise to the prominent peak at 2.3 V. Two small peaks at 1.45 V and 1.70 V were observed in the anodic process, whereas their corresponding cathodic peaks were observed at 1.32 V and 1.55 V respectively. The 1.32/1.45 V and 1.55/1.70 V vs. Li+/Li redox couples were due to formation and breakage of Mo+6 and polysulfide ionic bonds. In the consecutive discharge cycles, the anionic peaks at 1.9 V and 1.1 V were due to the reaction of Li and polysulfur. The anionic peak at 1.9 V was found split into two peaks at 1.9 V and 2.1 V. The peak at 2.1 V is due to formation of Li2Sn (n>4) whereas the peak at 1.9 V is due to the formation of Li2S2. The peak at 1.1 V is assigned for the formation of Li2S. The peak at ~ 0.3 V was associated to the reaction of Li and unreacted MoS2 and it has been observed that the intensity of the 0.3 V peak diminishes gradually due to the unavailability of MoS2 upon cycling. Similar observations were also observed from the charge-discharge profile shown in Figure 2(b). So, it can be concluded that the profile of the charge-discharge reaction was changed to Li/S reaction after 1st cycle. Though the above experimental results were helpful to reveal the charge-discharge mechanism of the MoS2 electrode but the reason behind such different behavior of sulfide materials are yet to be understood. In current state, the experimental analysis is not sufficient to realize why sulfide materials behave differently than oxides or why formation of MoS2 from Mo and Li2S are not favorable in this electrochemical environment. To find the answer of these questions and to get the information at atomic
Page 7 of 12 Nanoscale
Nan
osca
leA
ccep
ted
Man
uscr
ipt
Publ
ishe
d on
04
July
201
4. D
ownl
oade
d by
Bro
wn
Uni
vers
ity o
n 17
/07/
2014
06:
10:2
7.
View Article OnlineDOI: 10.1039/C4NR02480J
ARTICLE Journal Name
8 | J. Name. , 2012, 00, 1-3 This journal is © The Royal Society of Chemistry 2012
level, density functional theory (DFT) based calculations were performed to this system. Computational Study We modeled and simulated both lithiation, as well as delithiation process to understand and verify the experimental results. To mimic the lithiation process, we performed calculations using 1 to 8 Li atoms per MoS2 layer and examined the variation in the structural and electronic properties of the system with respect to Li concentration. As mentioned earlier in the “Computational Details” subsection, for a particular Li concentration various configurations with different position of Li atoms were examined in the search of most stable geometry. We found that in systems, especially having low Li concentration, Li usually prefers the location underneath molybdenum which is in agreement with earlier report51.
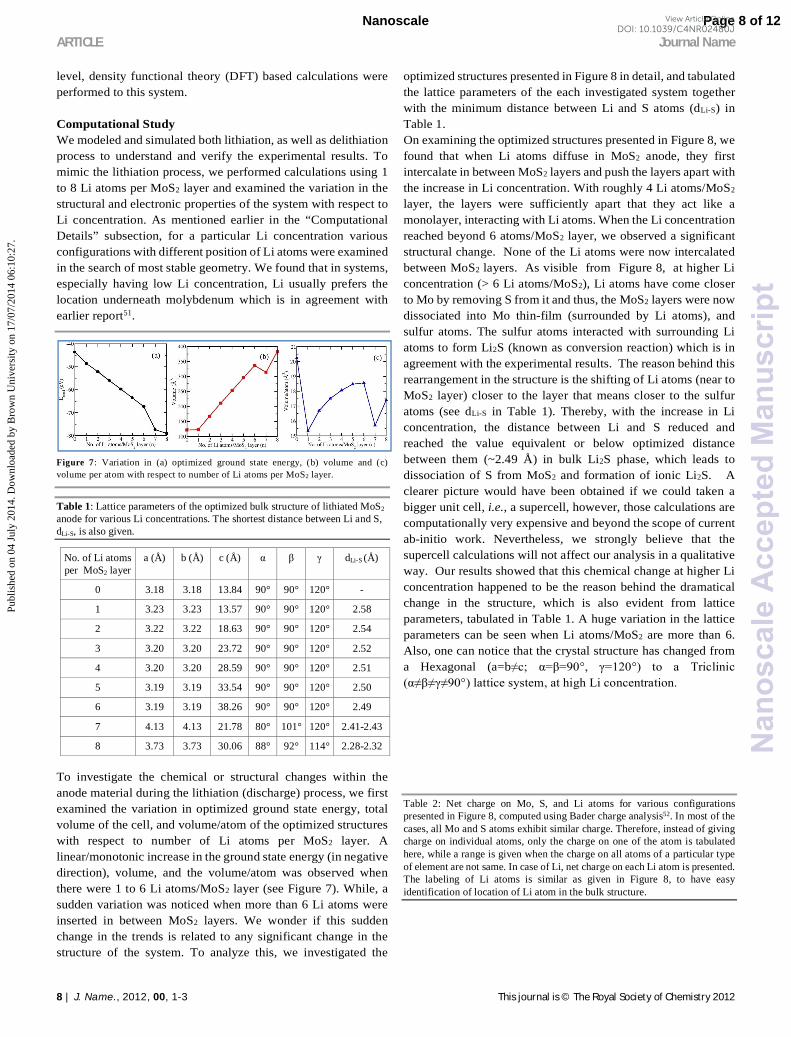
Figure 7: Variation in (a) optimized ground state energy, (b) volume and (c) volume per atom with respect to number of Li atoms per MoS2 layer.
Table 1: Lattice parameters of the optimized bulk structure of lithiated MoS2 anode for various Li concentrations. The shortest distance between Li and S, dLi-S, is also given.
No. of Li atoms per MoS2 layer
a (Å) b (Å) c (Å) α β γ dLi-S (Å)
0 3.18 3.18 13.84 90° 90° 120° -
1 3.23 3.23 13.57 90° 90° 120° 2.58
2 3.22 3.22 18.63 90° 90° 120° 2.54
3 3.20 3.20 23.72 90° 90° 120° 2.52
4 3.20 3.20 28.59 90° 90° 120° 2.51
5 3.19 3.19 33.54 90° 90° 120° 2.50
6 3.19 3.19 38.26 90° 90° 120° 2.49
7 4.13 4.13 21.78 80° 101° 120° 2.41-2.43
8 3.73 3.73 30.06 88° 92° 114° 2.28-2.32
To investigate the chemical or structural changes within the anode material during the lithiation (discharge) process, we first examined the variation in optimized ground state energy, total volume of the cell, and volume/atom of the optimized structures with respect to number of Li atoms per MoS2 layer. A linear/monotonic increase in the ground state energy (in negative direction), volume, and the volume/atom was observed when there were 1 to 6 Li atoms/MoS2 layer (see Figure 7). While, a sudden variation was noticed when more than 6 Li atoms were inserted in between MoS2 layers. We wonder if this sudden change in the trends is related to any significant change in the structure of the system. To analyze this, we investigated the
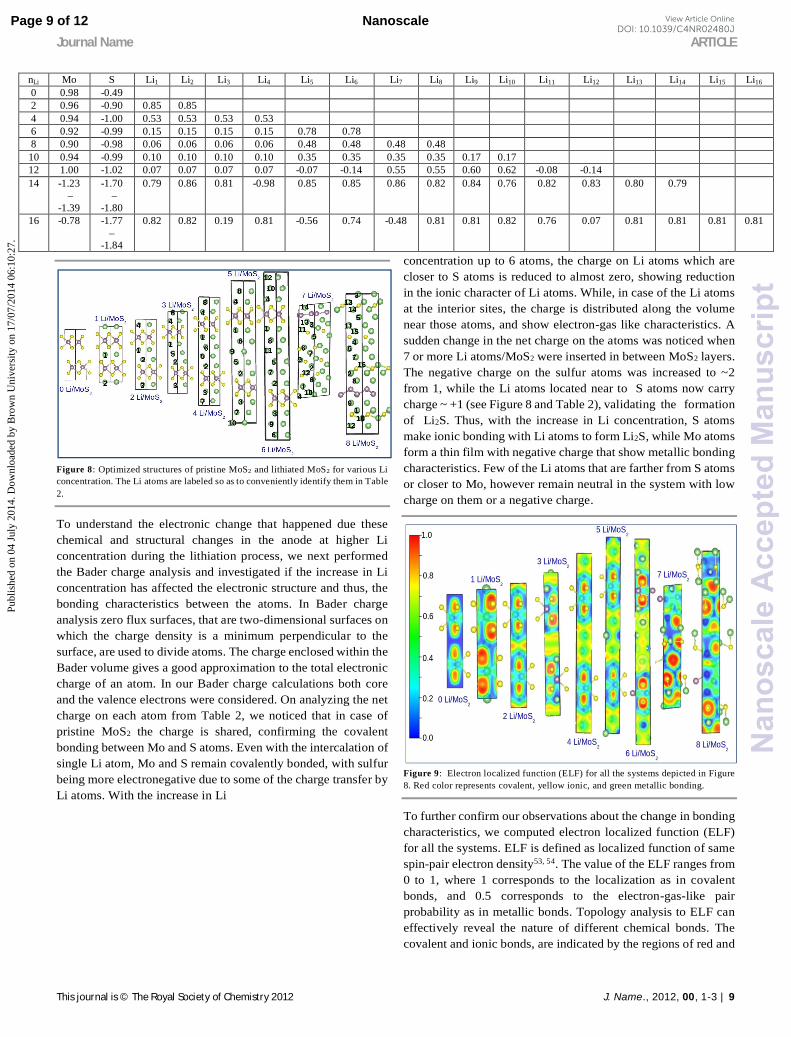
optimized structures presented in Figure 8 in detail, and tabulated the lattice parameters of the each investigated system together with the minimum distance between Li and S atoms (dLi-S) in Table 1. On examining the optimized structures presented in Figure 8, we found that when Li atoms diffuse in MoS2 anode, they first intercalate in between MoS2 layers and push the layers apart with the increase in Li concentration. With roughly 4 Li atoms/MoS2 layer, the layers were sufficiently apart that they act like a monolayer, interacting with Li atoms. When the Li concentration reached beyond 6 atoms/MoS2 layer, we observed a significant structural change. None of the Li atoms were now intercalated between MoS2 layers. As visible from Figure 8, at higher Li concentration (> 6 Li atoms/MoS2), Li atoms have come closer to Mo by removing S from it and thus, the MoS2 layers were now dissociated into Mo thin-film (surrounded by Li atoms), and sulfur atoms. The sulfur atoms interacted with surrounding Li atoms to form Li2S (known as conversion reaction) which is in agreement with the experimental results. The reason behind this rearrangement in the structure is the shifting of Li atoms (near to MoS2 layer) closer to the layer that means closer to the sulfur atoms (see dLi-S in Table 1). Thereby, with the increase in Li concentration, the distance between Li and S reduced and reached the value equivalent or below optimized distance between them (~2.49 Å) in bulk Li2S phase, which leads to dissociation of S from MoS2 and formation of ionic Li2S. A clearer picture would have been obtained if we could taken a bigger unit cell, i.e., a supercell, however, those calculations are computationally very expensive and beyond the scope of current ab-initio work. Nevertheless, we strongly believe that the supercell calculations will not affect our analysis in a qualitative way. Our results showed that this chemical change at higher Li concentration happened to be the reason behind the dramatical change in the structure, which is also evident from lattice parameters, tabulated in Table 1. A huge variation in the lattice parameters can be seen when Li atoms/MoS2 are more than 6. Also, one can notice that the crystal structure has changed from a Hexagonal (a=b≠c; α=β=90°, γ=120°) to a Triclinic (α≠β≠γ≠90°) lattice system, at high Li concentration.
Table 2: Net charge on Mo, S, and Li atoms for various configurations presented in Figure 8, computed using Bader charge analysis52. In most of the cases, all Mo and S atoms exhibit similar charge. Therefore, instead of giving charge on individual atoms, only the charge on one of the atom is tabulated here, while a range is given when the charge on all atoms of a particular type of element are not same. In case of Li, net charge on each Li atom is presented. The labeling of Li atoms is similar as given in Figure 8, to have easy identification of location of Li atom in the bulk structure.
Page 8 of 12Nanoscale
Nan
osca
leA
ccep
ted
Man
uscr
ipt
Publ
ishe
d on
04
July
201
4. D
ownl
oade
d by
Bro
wn
Uni
vers
ity o
n 17
/07/
2014
06:
10:2
7.
View Article OnlineDOI: 10.1039/C4NR02480J
Journal Name ARTICLE
This journal is © The Royal Society of Chemistry 2012 J. Name ., 2012, 00 , 1-3 | 9
Figure 8: Optimized structures of pristine MoS2 and lithiated MoS2 for various Li concentration. The Li atoms are labeled so as to conveniently identify them in Table 2.
To understand the electronic change that happened due these chemical and structural changes in the anode at higher Li concentration during the lithiation process, we next performed the Bader charge analysis and investigated if the increase in Li concentration has affected the electronic structure and thus, the bonding characteristics between the atoms. In Bader charge analysis zero flux surfaces, that are two-dimensional surfaces on which the charge density is a minimum perpendicular to the surface, are used to divide atoms. The charge enclosed within the Bader volume gives a good approximation to the total electronic charge of an atom. In our Bader charge calculations both core and the valence electrons were considered. On analyzing the net charge on each atom from Table 2, we noticed that in case of pristine MoS2 the charge is shared, confirming the covalent bonding between Mo and S atoms. Even with the intercalation of single Li atom, Mo and S remain covalently bonded, with sulfur being more electronegative due to some of the charge transfer by Li atoms. With the increase in Li
concentration up to 6 atoms, the charge on Li atoms which are closer to S atoms is reduced to almost zero, showing reduction in the ionic character of Li atoms. While, in case of the Li atoms at the interior sites, the charge is distributed along the volume near those atoms, and show electron-gas like characteristics. A sudden change in the net charge on the atoms was noticed when 7 or more Li atoms/MoS2 were inserted in between MoS2 layers. The negative charge on the sulfur atoms was increased to ~2 from 1, while the Li atoms located near to S atoms now carry charge ~ +1 (see Figure 8 and Table 2), validating the formation of Li2S. Thus, with the increase in Li concentration, S atoms make ionic bonding with Li atoms to form Li2S, while Mo atoms form a thin film with negative charge that show metallic bonding characteristics. Few of the Li atoms that are farther from S atoms or closer to Mo, however remain neutral in the system with low charge on them or a negative charge.
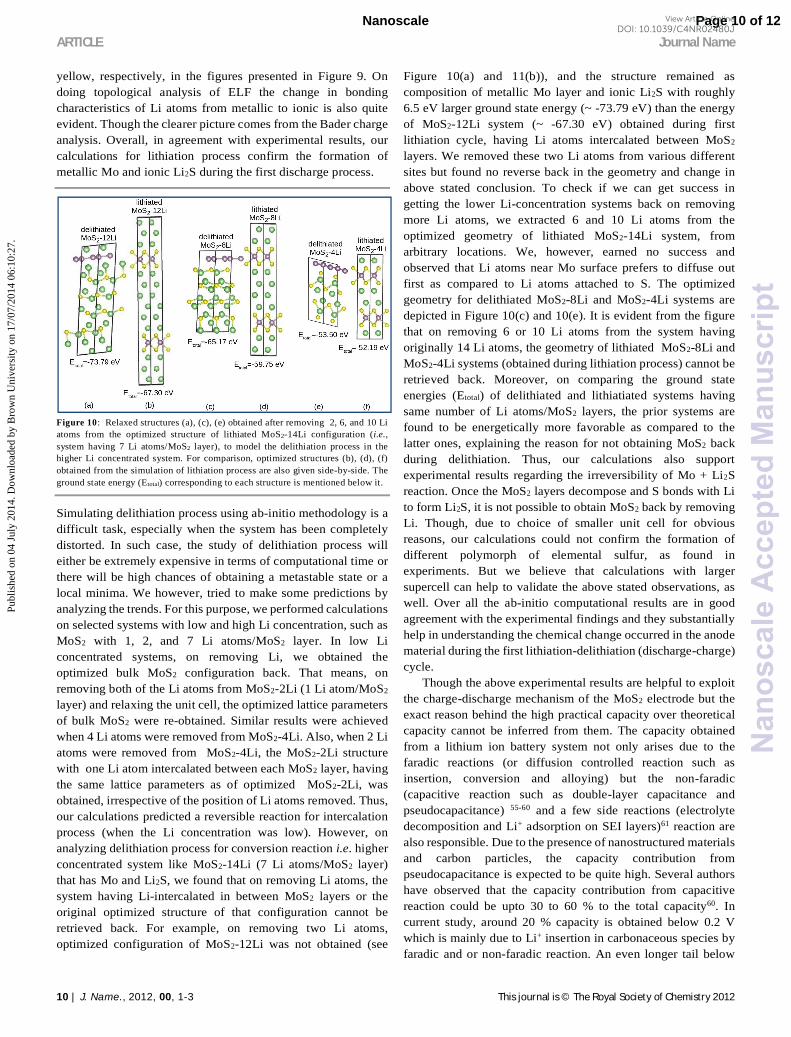
Figure 9: Electron localized function (ELF) for all the systems depicted in Figure 8. Red color represents covalent, yellow ionic, and green metallic bonding.
To further confirm our observations about the change in bonding characteristics, we computed electron localized function (ELF) for all the systems. ELF is defined as localized function of same spin-pair electron density53, 54. The value of the ELF ranges from 0 to 1, where 1 corresponds to the localization as in covalent bonds, and 0.5 corresponds to the electron-gas-like pair probability as in metallic bonds. Topology analysis to ELF can effectively reveal the nature of different chemical bonds. The covalent and ionic bonds, are indicated by the regions of red and
nLi Mo S Li1 Li2 Li3 Li4 Li5 Li6 Li7 Li8 Li9 Li10 Li11 Li12 Li13 Li14 Li15 Li16
0 0.98 -0.49 2 0.96 -0.90 0.85 0.85 4 0.94 -1.00 0.53 0.53 0.53 0.53 6 0.92 -0.99 0.15 0.15 0.15 0.15 0.78 0.78 8 0.90 -0.98 0.06 0.06 0.06 0.06 0.48 0.48 0.48 0.48 10 0.94 -0.99 0.10 0.10 0.10 0.10 0.35 0.35 0.35 0.35 0.17 0.17 12 1.00 -1.02 0.07 0.07 0.07 0.07 -0.07 -0.14 0.55 0.55 0.60 0.62 -0.08 -0.14 14 -1.23
– -1.39
-1.70 –
-1.80
0.79 0.86 0.81 -0.98 0.85 0.85 0.86 0.82 0.84 0.76 0.82 0.83 0.80 0.79
16 -0.78 -1.77 –
-1.84
0.82 0.82 0.19 0.81 -0.56 0.74 -0.48 0.81 0.81 0.82 0.76 0.07 0.81 0.81 0.81 0.81
Page 9 of 12 Nanoscale
Nan
osca
leA
ccep
ted
Man
uscr
ipt
Publ
ishe
d on
04
July
201
4. D
ownl
oade
d by
Bro
wn
Uni
vers
ity o
n 17
/07/
2014
06:
10:2
7.
View Article OnlineDOI: 10.1039/C4NR02480J
ARTICLE Journal Name
10 | J. Name. , 2012, 00, 1-3 This journal is © The Royal Society of Chemistry 2012
yellow, respectively, in the figures presented in Figure 9. On doing topological analysis of ELF the change in bonding characteristics of Li atoms from metallic to ionic is also quite evident. Though the clearer picture comes from the Bader charge analysis. Overall, in agreement with experimental results, our calculations for lithiation process confirm the formation of metallic Mo and ionic Li2S during the first discharge process.
Figure 10: Relaxed structures (a), (c), (e) obtained after removing 2, 6, and 10 Li atoms from the optimized structure of lithiated MoS2-14Li configuration (i.e., system having 7 Li atoms/MoS2 layer), to model the delithiation process in the higher Li concentrated system. For comparison, optimized structures (b), (d), (f) obtained from the simulation of lithiation process are also given side-by-side. The ground state energy (Etotal) corresponding to each structure is mentioned below it.
Simulating delithiation process using ab-initio methodology is a difficult task, especially when the system has been completely distorted. In such case, the study of delithiation process will either be extremely expensive in terms of computational time or there will be high chances of obtaining a metastable state or a local minima. We however, tried to make some predictions by analyzing the trends. For this purpose, we performed calculations on selected systems with low and high Li concentration, such as MoS2 with 1, 2, and 7 Li atoms/MoS2 layer. In low Li concentrated systems, on removing Li, we obtained the optimized bulk MoS2 configuration back. That means, on removing both of the Li atoms from MoS2-2Li (1 Li atom/MoS2 layer) and relaxing the unit cell, the optimized lattice parameters of bulk MoS2 were re-obtained. Similar results were achieved when 4 Li atoms were removed from MoS2-4Li. Also, when 2 Li atoms were removed from MoS2-4Li, the MoS2-2Li structure with one Li atom intercalated between each MoS2 layer, having the same lattice parameters as of optimized MoS2-2Li, was obtained, irrespective of the position of Li atoms removed. Thus, our calculations predicted a reversible reaction for intercalation process (when the Li concentration was low). However, on analyzing delithiation process for conversion reaction i.e. higher concentrated system like MoS2-14Li (7 Li atoms/MoS2 layer) that has Mo and Li2S, we found that on removing Li atoms, the system having Li-intercalated in between MoS2 layers or the original optimized structure of that configuration cannot be retrieved back. For example, on removing two Li atoms, optimized configuration of MoS2-12Li was not obtained (see
Figure 10(a) and 11(b)), and the structure remained as composition of metallic Mo layer and ionic Li2S with roughly 6.5 eV larger ground state energy (~ -73.79 eV) than the energy of MoS2-12Li system (~ -67.30 eV) obtained during first lithiation cycle, having Li atoms intercalated between MoS2 layers. We removed these two Li atoms from various different sites but found no reverse back in the geometry and change in above stated conclusion. To check if we can get success in getting the lower Li-concentration systems back on removing more Li atoms, we extracted 6 and 10 Li atoms from the optimized geometry of lithiated MoS2-14Li system, from arbitrary locations. We, however, earned no success and observed that Li atoms near Mo surface prefers to diffuse out first as compared to Li atoms attached to S. The optimized geometry for delithiated MoS2-8Li and MoS2-4Li systems are depicted in Figure 10(c) and 10(e). It is evident from the figure that on removing 6 or 10 Li atoms from the system having originally 14 Li atoms, the geometry of lithiated MoS2-8Li and MoS2-4Li systems (obtained during lithiation process) cannot be retrieved back. Moreover, on comparing the ground state energies (Etotal) of delithiated and lithiatiated systems having same number of Li atoms/MoS2 layers, the prior systems are found to be energetically more favorable as compared to the latter ones, explaining the reason for not obtaining MoS2 back during delithiation. Thus, our calculations also support experimental results regarding the irreversibility of Mo + Li2S reaction. Once the MoS2 layers decompose and S bonds with Li to form Li2S, it is not possible to obtain MoS2 back by removing Li. Though, due to choice of smaller unit cell for obvious reasons, our calculations could not confirm the formation of different polymorph of elemental sulfur, as found in experiments. But we believe that calculations with larger supercell can help to validate the above stated observations, as well. Over all the ab-initio computational results are in good agreement with the experimental findings and they substantially help in understanding the chemical change occurred in the anode material during the first lithiation-delithiation (discharge-charge) cycle. Though the above experimental results are helpful to exploit the charge-discharge mechanism of the MoS2 electrode but the exact reason behind the high practical capacity over theoretical capacity cannot be inferred from them. The capacity obtained from a lithium ion battery system not only arises due to the faradic reactions (or diffusion controlled reaction such as insertion, conversion and alloying) but the non-faradic (capacitive reaction such as double-layer capacitance and pseudocapacitance) 55-60 and a few side reactions (electrolyte decomposition and Li+ adsorption on SEI layers)61 reaction are also responsible. Due to the presence of nanostructured materials and carbon particles, the capacity contribution from pseudocapacitance is expected to be quite high. Several authors have observed that the capacity contribution from capacitive reaction could be upto 30 to 60 % to the total capacity60. In current study, around 20 % capacity is obtained below 0.2 V which is mainly due to Li+ insertion in carbonaceous species by faradic and or non-faradic reaction. An even longer tail below
Page 10 of 12Nanoscale
Nan
osca
leA
ccep
ted
Man
uscr
ipt
Publ
ishe
d on
04
July
201
4. D
ownl
oade
d by
Bro
wn
Uni
vers
ity o
n 17
/07/
2014
06:
10:2
7.
View Article OnlineDOI: 10.1039/C4NR02480J
Journal Name ARTICLE
This journal is © The Royal Society of Chemistry 2012 J. Name ., 2012, 00 , 1-3 | 11
0.2 V can be obtained for carbon composite (CNTs, graphene and amorphous carbon)15, 16, 18 of MoS2 that exhibits higher capacity (more than 1000 mAh g-1). It clearly signifies that larger the carbon, higher will be the capacitive contribution to the practical capacity. Therefore, we can conclude here that the actual capacity obtained from the MoS2/Li (or Li-S) redox reaction is lower than of theoretical capacity of 670 mAh g-1, if we exclude the extra capacity obtained from any other reactions. Conclusions: In summary, present work intended to study the mechanism of lithiation/delithiation mechanism of conversion based MoS2 electrode and highlight few significant insights to the storage mechanism. A model reaction mechanism has been proposed. On the basis of the results presented here, it may be inferred that the MoS2/Li reaction is not reversible as like the other transition metal based oxides. The current mechanism suggests that in the first discharge process, MoS2 react with Li via conversion reaction and form Mo nanoparticles and Li2S, but the reverse reaction is not favourable as isolated sulfur atoms/anions has a strong tendency to form polysulfur/polysulfide. Highly sensitive techniques like XANES and EXAFS studies clearly showed the formation of Mo nanoparticles in the first discharge stage and no Mo-S bond formation in the complete discharge-charge stage. Furthermore, all the experiments were performed in ex-situ mode, so during the sample handling and loading, Mo nanoparticles probably get oxidized in atmospheric condition to its highly stable form of MoO3 phase as observed in the experiments. Ab-initio density functional (DFT) calculations have been carried out for MoS2/Li system to investigate the storage mechanism. The DFT studies reveal that Li first intercalates between MoS2 layers but after a certain concentration it reacts with sulfur to form ionic Li2S and separates the Mo nanoparticles. This results into a significant structural change from hexagonal to triclinic lattice system. These outcomes were further confirmed by using Bader charge analysis and electron localized functions. While modeling the delithiation process, we observed that the formation of MoS2 from Mo+Li2S is energetically less favourable. This explains the reason behind the creation of polysulfur after delithiation process. Thus, after the first discharge cycle the electrode no more remains as a MoS2 anode but it behaves like sulfur electrode and the half-cell acts like Li/S battery, which governs a reversible reaction. The proposed reaction mechanism is capable enough to explain several unanswered questions related to MoS2/Li system such as the reason behind the change in the discharge profile and the high practical capacity in MoS2 based Li-ion battery. The current study provides an insight to another aspect of conversion based reactions and thus, yields a new opportunity to materials scientists and physicists to explore more transition metal sulfides/nitrides/phosphide electrode materials that may also exhibit a similar behaviour, and possess storage mechanism that could be explained in similar fashion. Acknowledgement:
The authors (UKS and SM) are thankful to the “National Centre for Photovolatics Research and Education (NCPRE)” -Ministry of New and Renewable Energy, Govt. of India and IRCC-IIT Bombay for providing financial and instrumental supports. P.J. would like to acknowledge the support provided by Grant No. SR/FTP/PS-052/2012 from Department of Science and Technology (DST), Government of India. All authors are also thankful to the members of SAIF, IIT Bombay for their assistance with electron diffraction and FEG-SEM analysis, Indus Synchrotron Utilization Division, Raja Ramanna Centre for Advanced Technology, Indore, India for INDUS-2 synchrotron facility for XAFS study and Shiv Nadar University for their computational facility. Notes 1Electrochemical Energy Laboratory, Department of Energy Science and Engineering, IIT Bombay, Powai, Mumbai - 400076, India. 2 Department of Physics, School of Natural Sciences, Shiv Nadar University, Greater Noida, Gautam Budh Nagar, Uttar Pradesh - 201314, India.
3Atomic and Molecular Physics Division, Bhabha Atomic Research Centre, Mumbai - 400085, India. *Corresponding Authors Fax: +91 22 2576 4890; Tel: +91 22 2576 7849 E-mail: [email protected] E-mail: [email protected] References: 1. J.-M. Tarascon, Grugeon, S., Laruelle, S., Larcher, D. &
Poizot, P., ed. G. A. P. Nazri, G., Kluwer Academic, Boston, 2003, ch. 7.
2. L. Taberna, S. Mitra, P. Poizot, P. Simon and J. M. Tarascon, Nat. Mater., 2006, 5, 567-573.
3. P. Poizot, S. Laruelle, S. Grugeon, L. Dupont and J. M. Tarascon, Nature, 2000, 407, 496-499.
4. T. Stephenson, Z. Li, B. Olsen and D. Mitlin, Energy Environ. Sci., 2014, 7, 209-231.
5. Y. Gu, Y. Xu and Y. Wang, ACS Appl. Mater. Interfaces, 2013, 5, 801-806.
6. H. Liu, D. W. Su, G. X. Wang and S. Z. Qiao, J. Mater. Chem., 2012, 22, 17437-17440.
7. R. Bhandavat, L. David and G. Singh, J. Phys. Chem. Lett., 2012, 3, 1523-1530.
8. Y. Wang, J. J. Wu, Y. F. Tang, X. J. Lii, C. Y. Yang, M. S. Qin, F. Q. Huang, X. Li and X. Zhang, ACS Appl. Mater. Interfaces, 2012, 4, 4246-4250.
9. P. G. Bruce, B. Scrosati and J.-M. Tarascon, Angew. Chem. Int. Edit., 2008, 47, 2930-2946.
10. F. Gillot, S. Boyanov, L. Dupont, M. L. Doublet, M. Morcrette, L. Monconduit and J. M. Tarascon, Chem. Mater., 2005, 17, 6327-6337.
11. U. K. Sen and S. Mitra, ACS Appl. Mater. Interfaces, 2013, 5, 1240-1247.
Page 11 of 12 Nanoscale
Nan
osca
leA
ccep
ted
Man
uscr
ipt
Publ
ishe
d on
04
July
201
4. D
ownl
oade
d by
Bro
wn
Uni
vers
ity o
n 17
/07/
2014
06:
10:2
7.
View Article OnlineDOI: 10.1039/C4NR02480J

ARTICLE Journal Name
12 | J. Name. , 2012, 00, 1-3 This journal is © The Royal Society of Chemistry 2012
12. S. K. Park, S. H. Yu, S. Woo, J. Ha, J. Shin, Y. E. Sung and Y. Piao, CrystEngComm, 2012, 14, 8323-8325.
13. H. Hwang, H. Kim and J. Cho, Nano Lett., 2011, 11, 4826-4830.
14. M. Wang, G. D. Li, H. Y. Xu, Y. T. Qian and J. Yang, ACS Appl. Mater. Interfaces, 2013, 5, 1003-1008.
15. K. Chang and W. Chen, Chem. Commun., 2011, 47, 4252-4254.
16. K. Chang and W. Chen, ACS Nano, 2011, 5, 4720-4728. 17. S. Ding, D. Zhang, J. S. Chen and X. W. Lou, Nanoscale, 2012,
4, 95-98. 18. X. Cao, Y. Shi, W. Shi, X. Rui, Q. Yan, J. Kong and H. Zhang,
Small, 2013, 9, 3433-3438. 19. K. Chang, D. Geng, X. Li, J. Yang, Y. Tang, M. Cai, R. Li and
X. Sun, Adv. Energy Mater., 2013, 3, 839-844. 20. N. Pereira, L. Dupont, J. M. Tarascon, L. C. Klein and G. G.
Amatucci, J. Electrochem. Soc., 2003, 150, A1273-A1280. 21. L. Wang, B. Liu, S. Ran, H. Huang, X. Wang, B. Liang, D.
Chen and G. Shen, J. Mater. Chem. , 2012, 22, 23541-23546. 22. L. Ji, O. Toprakci, M. Alcoutlabi, Y. Yao, Y. Li, S. Zhang, B.
Guo, Z. Lin and X. Zhang, ACS Appl. Mater. Interfaces, 2012, 4, 2672-2679.
23. L. Ji, Z. Lin, M. Alcoutlabi and X. Zhang, Energy Environ. Sci., 2011, 4, 2682-2699.
24. L. Ji, H. L. Xin, T. R. Kuykendall, S.-L. Wu, H. Zheng, M. Rao, E. J. Cairns, V. Battaglia and Y. Zhang, Phys. Chem. Chem. Phys., 2012, 14, 6981-6986.
25. X. Zhou, L.-J. Wan and Y.-G. Guo, Chem. Commun., 2013, 49, 1838-1840.
26. S.-K. Park, S.-H. Yu, S. Woo, B. Quan, D.-C. Lee, M. K. Kim, Y.-E. Sung and Y. Piao, Dalton Trans., 2013, 42, 2399-2405.
27. X. Fang, X. Guo, Y. Mao, C. Hua, L. Shen, Y. Hu, Z. Wang, F. Wu and L. Chen, Chem.-Asian J., 2012, 7, 1013-1017.
28. X. Fang, C. Hua, X. Guo, Y. Hu, Z. Wang, X. Gao, F. Wu, J. Wang and L. Chen, Electrochim. Acta, 2012, 81, 155-160.
29. X. Fang, X. Yu, S. Liao, Y. Shi, Y.-S. Hu, Z. Wang, G. D. Stucky and L. Chen, Microporous Mesoporous Mater., 2012, 151, 418-423.
30. J. Xiao, X. Wang, X.-Q. Yang, S. Xun, G. Liu, P. K. Koech, J. Liu and J. P. Lemmon, Adv. Funct. Mater., 2011, 21, 2840-2846.
31. C. Barchasz, F. Molton, C. Duboc, J.-C. Leprêtre, S. Patoux and F. Alloin, Anal. Chem., 2012, 84, 3973-3980.
32. X. Ji and L. F. Nazar, J. Mater. Chem., 2010, 20, 9821-9826. 33. U. K. Sen and S. Mitra, RSC Adv., 2012, 2, 11123-11131. 34. D. Bhattacharyya, A. K. Poswal, S. N. Jha, Sangeeta and S. C.
Sabharwal, Nucl. Instrum. Methods Phys. Res. A, 2009, 609, 286-293.
35. G. Kresse and J. Furthmuller, Comp. Mater. Sci., 1996, 6, 15-50.
36. G. Kresse and J. Furthmuller, Phys. Rev. B, 1996, 54, 11169-11186.
37. G. Kresse and D. Joubert, Phys. Rev. B, 1999, 59, 1758-1775. 38. J. P. Perdew, K. Burke and M. Ernzerhof, Phys. Rev. Lett.,
1996, 77, 3865-3868. 39. P. Johari and V. B. Shenoy, ACS Nano, 2011, 5, 5903-5908.
40. S. K. Das, R. Mallavajula, N. Jayaprakash and L. A. Archer, J. Mater. Chem., 2012, 22, 12988-12992.
41. Q. Wang and J. Li, J. Phys. Chem. C, 2007, 111, 1675-1682. 42. M. Dieterle and G. Mestl, Phys. Chem. Chem. Phys., 2002, 4,
822-826. 43. J. T. Yeon, J. Y. Jang, J. G. Han, J. Cho, K. T. Lee and N. S.
Choi, J. Electrochem. Soc., 2012, 159, A1308-A1314. 44. M. Hagen, P. Schiffels, M. Hammer, S. Dorfler, J. Tubke, M.
J. Hoffmann, H. Althues and S. Kaskel, J. Electrochem. Soc., 2013, 160, A1205-A1214.
45. B. Meyer, Chem. Rev., 1976, 76, 367-388. 46. D. Joseph, A. K. Yadav, S. N. Jha and D. Bhattacharyya, Bull.
Mater. Sci., 2013, 36, 1067-1072. 47. J.-H. Kang, S.-M. Paek and J.-H. Choy, Bull. Korean Chem.
Soc., 2010, 31, 3675-3678. 48. M. Newville, B. Ravel, D. Haskel, J. J. Rehr, E. A. Stern and
Y. Yacoby, Physica B, 1995, 208, 154-156. 49. R. G. Dickinson and L. Pauling, J. Am. Chem. Soc., 1923, 45,
1466-1471. 50. T. Leisegang, A. A. Levin, J. Walter and D. C. Meyer, Cryst.
Res. Technol., 2005, 40, 95-105. 51. H. J. Chen, J. Huang, X. L. Lei, M. S. Wu, G. Liu, C. Y.
Ouyang and B. Xu, Int. J. Electrochem. Sci., 2013, 8, 2196-2203.
52. G. Henkelman, A. Arnaldsson and H. Jonsson, Comp. Mater. Sci., 2006, 36, 354-360.
53. A. D. Becke and K. E. Edgecombe, J. Chem. Phys., 1990, 92, 5397-5403.
54. B. Silvi and A. Savin, Nature, 1994, 371, 683-686. 55. M. Osiak, H. Geaney, E. Armstrong and C. O'Dwyer, J. Mater.
Chem. A, 2014, DOI: 10.1039/c4ta00534a. 56. K. Zhu, Q. Wang, J.-H. Kim, A. A. Pesaran and A. J. Frank, J.
Phys. Chem. C, 2012, 116, 11895-11899. 57. T. Brezesinski, J. Wang, S. H. Tolbert and B. Dunn, Nat.
Mater., 2010, 9, 146-151. 58. A. G. Dylla, G. Henkelman and K. J. Stevenson, Acc. Chem.
Res., 2013, 46, 1104-1112. 59. V. Augustyn, J. Come, M. A. Lowe, J. W. Kim, P.-L. Taberna,
S. H. Tolbert, H. D. Abruna, P. Simon and B. Dunn, Nat. Mater., 2013, 12, 518-522.
60. C. Hou, X.-Y. Lang, G.-F. Han, Y.-Q. Li, L. Zhao, Z. Wen, Y.-F. Zhu, M. Zhao, J.-C. Li, J.-S. Lian and Q. Jiang, Sci. Rep., 2013, 3.
61. P. Arora, R. E. White and M. Doyle, J. Electrochem. Soc., 1998, 145, 3647-3667.
Page 12 of 12Nanoscale
Nan
osca
leA
ccep
ted
Man
uscr
ipt
Publ
ishe
d on
04
July
201
4. D
ownl
oade
d by
Bro
wn
Uni
vers
ity o
n 17
/07/
2014
06:
10:2
7.
View Article OnlineDOI: 10.1039/C4NR02480J
Related Documents