In press: European Journal of Public Health An examination of the association between premature mortality and life expectancy among men in Europe Alan White (PhD) [corresponding author]: Institute for Health & Wellbeing, Faculty of Health & Social Sciences, Leeds Metropolitan University, Room 231c, Queen Square House, 80 Woodhouse Lane, Leeds, LS2 8NU. Martin McKee (DSc): London School of Hygiene and Tropical Medicine, London, UK Bruno de Sousa (PhD): Centro de Malaria & Doenças Tropicais. Faculdade de Psicologia e Ciências da Educação, Universidade de Coimbra, Portugal Richard de Visser (PhD): School of Psychology, University of Sussex, Falmer, UK Richard Hogston (MSc): Institute for Health & Wellbeing, Faculty of Health & Social Sciences, Leeds Metropolitan University, Leeds, UK Svend Aage Madsen (PhD): Copenhagen University Hospital, Rigshospitalet, Copenhagen, Denmark Péter Makara (PhD): Semmelweis University Budapest, Institute of Public Health, Budapest, Hungary Noel Richardson (PhD): Centre for Men’s Health, Institute of Technology Carlow, Kilkenny Rd, Carlow, Ireland Witold Zatoński (PhD): 1. Department of Cancer Epidemiology & Prevention, Cancer Center & Institute of Oncology, Warsaw, Poland 2. European Health Inequalities Observatory, Institute of Rural Health, Lublin, Poland 1

Welcome message from author
This document is posted to help you gain knowledge. Please leave a comment to let me know what you think about it! Share it to your friends and learn new things together.
Transcript
In press: European Journal of Public Health
An examination of the association between premature mortality and
life expectancy among men in Europe
Alan White (PhD) [corresponding author]: Institute for Health & Wellbeing,
Faculty of Health & Social Sciences, Leeds Metropolitan University, Room
231c, Queen Square House, 80 Woodhouse Lane, Leeds, LS2 8NU.
Martin McKee (DSc): London School of Hygiene and Tropical Medicine, London,
UK
Bruno de Sousa (PhD): Centro de Malaria & Doenças Tropicais. Faculdade de
Psicologia e Ciências da Educação, Universidade de Coimbra, Portugal
Richard de Visser (PhD): School of Psychology, University of Sussex,
Falmer, UK
Richard Hogston (MSc): Institute for Health & Wellbeing, Faculty of Health
& Social Sciences, Leeds Metropolitan University, Leeds, UK
Svend Aage Madsen (PhD): Copenhagen University Hospital, Rigshospitalet,
Copenhagen, Denmark
Péter Makara (PhD): Semmelweis University Budapest, Institute of Public
Health, Budapest, Hungary
Noel Richardson (PhD): Centre for Men’s Health, Institute of Technology
Carlow, Kilkenny Rd, Carlow, Ireland
Witold Zatoński (PhD): 1. Department of Cancer Epidemiology & Prevention,
Cancer Center & Institute of Oncology, Warsaw, Poland 2. European Health
Inequalities Observatory, Institute of Rural Health, Lublin, Poland
1

Gary Raine (PhD) Institute for Health & Wellbeing, Faculty of Health &
Social Sciences, Leeds Metropolitan University, Leeds, UK
2
ABSTRACT
Background A feature of the health of men across Europe is their
higher rates of premature mortality and shorter life expectancy at
birth than women. Following the publication of the first State of
Men’s Health in Europe Report we sought to explore possible reasons.
Method We analysed trends in life expectancy at birth in 19 European
Union member States (EU19) between 1999 and 2008 using mortality
data obtained from Eurostat. We then used Pollard’s decomposition
method to identify the contribution of deaths from different causes
and at different age groups to differences in life expectancy.
Results Between 1999 and 2008 life expectancy at birth in the EU19
increased by 2.74 years for men and by 2.09 years for women. Most of
these improvements were due to reductions in mortality at ages over
60, with cardiovascular disease accounting for approximately half
these improvements for men. In 2008 life expectancy of men in the
EU19 was 5.92 years lower than that of women. Deaths from all major
groups of causes, and at all ages, contributed to this gap, with
external causes contributing 0.96 years, cardiovascular disease 1.80
years and neoplasms 1.61 years.
Conclusion Improvements in the life expectancy at birth of men and
women have mostly occurred at older ages. There has been little
improvement in the high rate of premature death in younger men,
suggesting a need for interventions to tackle their high death rate.
3
Keywords: Pollard’s decomposition, premature death, Men’s health,
European Union.
INTRODUCTION
Although there have been few studies to date that have explored
men’s health at the international level (1-4) there is a growing
awareness of men’s health issues.(5) A recent report on the state
of men’s health in Europe, undertaken for the European Commission,
(6) described large differences between the health of men and women.
Life expectancy data for the EU27 overall showed that men’s life
expectancy at birth was lower than that of women in all countries
but the magnitude of the difference varied. Analysis of why that gap
exists revealed that annual mortality rates among men of working age
(15-64 years) are more than double those of women. Of the
approximately 630,000 deaths among men of working age in 2007,
198,238 deaths occurred before the age of 50 years, compared to
86,585 female deaths.
Though life expectancy has risen markedly in Europe(7, 8) and it has
long been known that women tend to have a longer life expectancy
than men(9) there is still an relative dearth of debate and
discussion specifically regarding the reasons for men’s shorter
lifespan. Whilst not nearly on the same scale as the plight of the
4
‘missing women’ reported by Sen in 1990,(10) this excess male
mortality is largely invisible in the epidemiology literature. It
represents a massive and largely avoidable human, social and
economic toll.
There is much that is already surmised elsewhere as to the possible
causes of men’s high rates of premature death. Masculine
socialization has been linked to increased risk taking and there are
many social pressures on men to perform in certain ways that may
harm their health in the short- and/or long-term.(11) The majority
of the causes of the variance between men and women’s life
expectancy start to emerge in the early 40s and are a consequence of
the widely reported propensity of men to engage in more unhealthy
lifestyles and risky behavior and the accumulation over time of
risk/damage. The main causes of these preventable diseases include
comparatively high smoking and alcohol levels, high fat intake,
diets high in red meat and low in fruit and fibre, being overweight,
and a lack of physical activity.(12-14)
Across Europe there is also a concern that men, although at greater
risk of premature death, are less likely to engage with preventative
health care screening(6), by being less likely than women to have
their blood pressure or cholesterol levels checked(15). They are
also less likely to have dental or eye check-ups.(6) Among the 50%
5
of people with diabetes undiagnosed,(16) male sex is a significant
risk factor.(17)
Men’s increased vulnerability to many social determinants of health
tends to be under-reported.(3, 4, 18-20) Findings from reports of
this topic, and in particular demonstration of variations in
premature death and life expectancy among men that are demonstrated
in the new European Commission report(6) highlight the impact of
poor socio-economic conditions. These findings suggest that men
suffer from ‘heavy impact diseases’ that are more rapidly fatal,
with women more likely to survive, but in poorer health.(3, 21, 22)
These social factors clearly influence individual lifestyle choices
and practices. When compared to women and men from more affluent
backgrounds, men who live in poorer material and social conditions
(including: unemployed men,(23) ethnic minorities,(24) prisoners,(25)
homeless men,(26) and those with lower educational attainment (27-
29)) are more likely to: eat less healthily; take less exercise; be
overweight /obese; consume more alcohol; smoke; engage in substance
misuse; and more risky sexual behavior (6). In Eastern European
countries in particular, high levels of alcohol intake are taking
their toll through sudden cardiac death. (30-32) It is anticipated
that this will be an increasingly important factor in Western death
rates.(33)
6
The results in the first State of Men’s Health in Europe Report (6)
established the imperative to explore in more depth the implications
of these risks for men’s health. Though there have been some
attempts to explore the contribution of different causes of death to
changes in life expectancy within individual countries or within a
small group of countries(34, 35), we now look at the larger picture,
examining the contribution of deaths from different causes and at
different ages to changes in life expectancy for men and for women
in a 10 year time period (1999-2008) across 19 EU countries to
determine their overall effect to men’s lower life expectancy.
METHODS
Population and mortality data by age and cause of death were
obtained from Eurostat for the 19 countries that had complete data
for 1999 and 2008 (Austria, Bulgaria, Czech Republic, Denmark,
Finland, Germany, Greece, Hungary, Italy, Latvia, Lithuania,
Netherlands, Poland, Portugal, Romania, Slovakia, Spain, Sweden,
United Kingdom). Cause of death was classified according to the 9th
and 10th revisions of the International Classification of Diseases
(ICD-10) and was aggregated into broad categories corresponding
largely to body systems (so overcoming the potential problems
arising from different versions of ICD). Where appropriate, data
were age standardized using the European Standard Population as
defined by the World Health Organization.(36) Differences in the
life expectancy of populations over time and between sexes were
7
decomposed into deaths from different causes and at different ages
using the method developed by Pollard(37), based on Chiang’s life
tables.(38) Pollard’s decomposition method allows measurement of the
contribution of different causes of death in each age group to
differences in life expectancy at birth between sexes and over time
(Box).(5)
In this study, we analysed the changes in life expectancy between
1999 and 2008 for both men and women, giving the total years added
(positive values) or removed (negative values) from life expectancy
at birth for every age group and cause-specific death in these two
periods. In addition, a comparison was made of men’s and women’s
changes in life expectancy at birth for the years 1999 and 2008. In
this case, Pollard’s decomposition gives the total years added
(positive values) or removed (negative values) from life expectancy
at birth for every age group and cause-specific death when comparing
men to women.
Within the analysis specific focus has been given to the age ranges
0-14, 15-64 and 65+. These age ranges have been chosen to reflect,
respectively, the potential impact of premature male death rates on
child and adolescent mortality, the working age population, and
older people.
RESULTS
8
In the EU19 men’s life expectancy at birth was 73.27 years and for
women 79.79 years in 1999. Pollard’s decomposition shows an increase
of 2.74 years (3.7%) for men and 2.09 years (2.6%) for women between
1999 and 2008 (Figure 1), with gains concentrated mostly in infancy
and older age. Over this time period the gap between men’s and
women’s life expectancy dropped from 6.57 years in 1999 to 5.92
years in 2008. Although the gap between men’s and women’s life
expectancy narrowed slightly (by less than 8 months) - the gap
remains wide. Of the 2.74 year increase in male life expectancy
between 1999 and 2008, 0.24 years occurred between the ages of 0 and
14 years, 1·05 years between the ages of 15-64 years and 1.46 years
over the age of 65 (Figure 1). When the causes of change in life
expectancy in different age groups within the male population were
analysed, the major contributor was a reduction in deaths from
diseases of the circulatory system, accounting for 1.45 years of the
overall 2.74 years improvement, with the majority of these added
years occurring over the age of 60 years (1.19 years). Reductions
in deaths as a result of external causes in childhood, adolescence,
and early adulthood (less than 40 years of age) contributed 74% of
the overall 0.32 year gain in life expectancy as a result of this
classification group. Across all age groups, fewer cancer deaths
contributed 0.41 years.
9
Among women, gains in life expectancy between 1999 and 2008 were
concentrated at older ages (Figure 1). Improvements among those of
working age (15-64) contributed only 0.49 years of the overall gain,
with most of this gain (1.40 years) found among those aged over 65
years. There was an improvement in deaths in the first year of life.
Reductions in deaths due to diseases of the circulatory system
contributed 1.39 years to the total 2.09 year increase. Improvements
in other causes were relatively small: reductions in respiratory
system deaths added 0.20 years to the overall increase, and
reductions in cancer deaths added 0.24 years.
Although men’s life expectancy improved to a greater extent than
women’s in this 10 year period, women still have a markedly longer
life expectancy than do men. Pollard’s decomposition was used to
examine the 6.57 year sex difference in 1999 and the 5.92 year sex
difference in life expectancy in 2008 (a 9·93% reduction) (see Table
1). The largest overall contribution to the difference was in
cardiovascular deaths, with -2.23 years in 1999 and -1.80 years in
2008 (a 19.41% reduction). There has been little change with regard
to neoplasms, where -1.58 years of difference were seen in 1999 as
compared to -1.61 years in 2008. Infectious diseases contribute
little to the difference in life expectancy overall, but there was a
reduction of 17.77% (from -0.11 year to -0.09 year) in their
contribution over the time period.
10
The age / cause specific graphs for 1999 and 2008 (Figure 2) are
similar in that external causes had the largest influence on the
difference in life expectancy in the young adult years, contributing
1.11 years of reduced life expectancy in men in 1999 and 0.96 year
in 2008 (a 13.13% reduction, Table 1). It is possible to discern
points on the graphs where changes in health reduced life expectancy
rather than increased it: in the age range 30-44 years, higher
female cancer death rates narrowed the gap, as did deaths from other
causes in those aged over 85 years in 2008. There is a steady, but
marked profile of an increasing gap between the age group 30-34 to
65-69 years, with the majority of the overall differences between
men and women being seen in the over 60 years at both time points.
Analysis indicated that the 0.65 year reduction in the gap of male
to female life expectancy between 1999 and 2008 was largely the
result of a reduction in deaths from external causes and
cardiovascular disease, but that these gains were in part countered
by the increased gap between men and women in cancer deaths among
those aged 75 years and older.
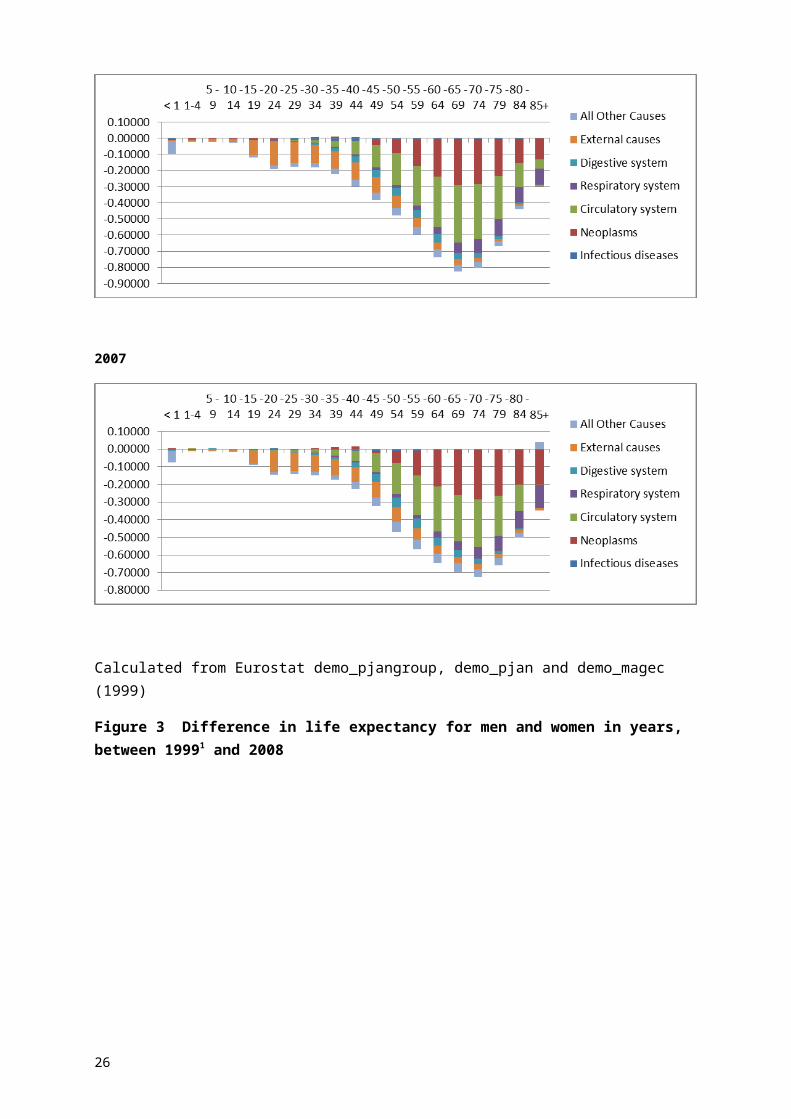
Between-country differences
In-depth country-by-country analyses of life expectancy changes goes
beyond the scope of the present study, but an overall picture can be
seen in Figure 3. Increases in life expectancy were seen across the
EU19, except for men in Lithuania, where no change was evident. In
11
some countries the increase for men was much larger than for women,
whereas in others a greater increase in life expectancy was seen for
women. The picture is complicated with some countries that had poor
life expectancy in 1999 showing big changes, while others did not.
For example, whereas Estonia and Slovakia experienced large
increases in life expectancy, their respective neighbours Lithuania
and Bulgaria did not. This suggests variation in different
countries’ responses to opportunities to improve the health of their
populations through legislation and/or investment in effective
health programmes.
DISCUSSION
The results of this study show that there have been improvements in
the life expectancy of men and women across these EU19 countries,
mostly as a result of better health outcomes in later life. Those
who have survived through their working lives are now living longer:
this was especially the case for women. Though there were some
increases in life expectancy in the 15-64-age range for men, it was
not of an order that would have a big impact on their high rate of
premature death.
Women tend to have a lower risk of premature death generally, with
the majority of women's deaths the result of cancer, especially
breast cancer. For men there are a far greater number of factors
12
that influence their higher rate of premature death. With few sex-
specific causes of death in the working age of 15-64 years, the
majority of the causes of death should affect men and women equally.
They should also, in the main, be preventable.(12, 39)
The analyses presented here give some indication as to the causes of
the variance between male and female life expectancy in the early
years. Further examination of temporal change identified those
factors that tended to reduce sex differences in longevity and those
disease states and causes of death that maintain them.
Reductions in deaths from external causes helped to narrow the gap
between men’s and women’s life expectancy in the early years, mostly
as a result of health and safety policies within the workforce and
road safety legislation.(40) With more stringent enforcement,
particularly in eastern European countries, deaths could be reduced
even more considerably. Suicide rates have historically been higher
for men than for women, and over this time period there were
reductions in the majority of the countries under study, though
trends suggest that these may be on the increase again as a result
of the economic downturn.(23)
Our analyses demonstrate the marked improvements in life expectancy
as a consequence of better cardiovascular health. Public health
approaches to smoking reduction,(14) along with earlier diagnosis
13
and more effective treatment of cardio-vascular disease are
certainly contributing to these successes.(41) With women’s risks of
CVD most evident post-menopause, these benefits have only a small
effect on their rates of premature death. For men, there was some
reduction of CVD death at younger ages, but the greatest impact was
seen in the older male population.
With increasing longevity, and decreases in cardio-vascular death,
cancer has a growing impact on overall life expectancy. In the
older age groups cancer has an increasingly negative effect on the
life expectancy gap between men and women when comparing 1999 to
2008. This suggests that the difference in overall life expectancy
between men and women would have further reduced if this increase in
cancer in men in the older age group had not occurred. The gap has
also widened as a result of the marked improvements in women’s
chances of surviving breast cancer(34). It has been noted previously
that men are at increased risk of those cancers that should affect
men and women equally both due to higher incidence and higher
mortality rates across all ages.(42-45) Survival rates are also
lower for men.(46) The observed reduction in cancer deaths (0.41
years to the overall increase in male life expectancy of 2.74 years)
could be seen to be the result of improvements in early detection
and better treatment regimens(47) and, in significant part, the
effects of reduced smoking, although the time lag involved suggests
14
that the last of these will continue to have an impact in the next
few decades (48)
Deaths related to problems with the digestive system clearly add to
the life expectancy gap in the working age population, and in this
domain there was very little improvement in men’s life expectancy
(0.08 years of the 2.74 years). The observed patterns are
principally a result of increases in liver disease linked to alcohol
and, to a lesser extent, hepatitis(32). Hazardous drinking also
contributes to men’s high rates of cardiovascular disease and some
cancers (12, 14, 30, 33), although this is an area where women are
rapidly closing the gap. While there may be improvements in the
health of men as a result of reduction in smoking, there is evidence
that the benefits are being countered by increases in other risk
factors including overweight, decreased physical activity, increased
sedentary behavior, and poor diet(6).
The variation in these effects among and within countries suggests
that what is important is being male within particular socio-
cultural and economic contexts rather than being male per se.
Having said all this, there has been a faster rate of improvement in
men’s life expectancy as compared to women over this time period,
much of which seems due to men giving up smoking at a faster rate 20
to 30 years (or more) earlier. They were also the first to be told
15
(unambiguously) when they were young enough that smoking was a
health hazard. The current generation of men have been living during
a time of much lower financial stress and, until recently, near full
employment. Men now aged in their 60s and 70s have had a relatively
stable working environment. The period we have studied ends just
before a major economic recession, and since 1945 during all
economic recessions men's health has improved at a slower than
normal rate while women's life expectancy has tended to move ahead.
(4)
The between-country differences suggest that some countries have
responded positively to the challenge of poor health and are seeing
improvements, whereas others have not been so effective.(35, 49)
Population projections suggest that there will be a contraction in
the male working population (15-64 years) of some 24 million across
the EU27 and an expansion of 32 million men over the age of 65 years
by 2060.(6) Thus a diminishing younger population will have to
support an increasing older population. The rapid increase in the
rate of preventable death after the age of 40 years highlights a
clear need to address the health-limiting circumstances that affect
the health of the working age man.(49)
This will have the benefit of lowering premature mortality,
increasing healthy life expectancy, slowing the development of
chronic disease and thereby decreasing the burden of care in the
16

older population. Such approaches at the whole-population level
would also have benefits for women. This focus on premature
mortality is arguably as important for global and European health
policy as is the improvement of child survival.(20)
Conflicts of interest: None declared
17
Keypoints
This study adds clarity as to what are the reasons behind men
and women’s differences in life expectancy and what has
constituted the reasons for the changes over the ten years from
1999 to 2008.
There is a worrying picture of a relative static improvement in
the working age bracket (15-64 years) in men, with most
increases in life expectancy occurring in the over 65 year
olds.
The study also helps to explain what is bringing about the
narrowing of the gaps and shows the importance of improvements
in cardio-vascular health over the last ten years.
The study suggests that more needs to be done to address the
causes of the high levels of premature death in men, especially
in countries where high levels of premature death are still
evident.
18
References
1. White A, Holmes M. Patterns of mortality across 44 Countries among men and women aged 15-44 years. Journal of Men’s Health & Gender. 2006;3(2):139-51.2. White A, Cash K. The state of men’s health in Western Europe. Journalof Men’s Health & Gender. 2004;1:60-6.3. Nusselder W, Looman C, Van Oyen H, Robine J, Jagger C. Gender differences in health of EU10 and EU15 populations: the double burden of EU10 men. Eur J Ageing. 2010;7(4):219-27.4. Rigby JE, Dorling D. Mortality in relation to sex in the affluent world. Journal of Epidemiology and Community Health. 2007;61(2):159-64.5. Conti S, Farchi G, Masocco M, Minelli G, Toccaceli V, Vichi M. Genderdifferentials in life expectancy in Italy. European Journal of Epidemiology. 2003;18(2):107-12.6. EC. The State of Men's Health in Europe: Extended Report. Luxembourg:European Commission, http://ec.europa.eu/health/population_groups/docs/men_health_extended_en.pdf 2011.7. Mackenbach J. Convergence and divergence of life expectancy in Europe: a centennial view. European Journal of Epidemiology. 2013;28(3):229-40.8. Wang H, Dwyer-Lindgren L, Lofgren KT, Rajaratnam JK, Marcus JR, Levin-Rector A, et al. Age-specific and sex-specific mortality in 187 countries, 1970–2010: a systematic analysis for the Global Burden of Disease Study 2010. The Lancet. 2012;380(9859):2071-94.9. Thorslund M, Wastesson J, Agahi N, Lagergren M, Parker M. The rise and fall of women’s advantage: a comparison of national trends in life expectancy at age 65 years. European Journal of Ageing. 2013:1-7.10. Sen A. More than 100 million women are missing. The New York Review of Books. 1990;37(20):61-6.11. de Visser RO, Smith JA, McDonnell EJ. "That's not masculine": Masculine Capital and Health-related Behaviour Journal of Health Psychology. 2009;14(7):1047-58.12. Danaei G, Vander Hoorn S, Lopez AD, Murray CJL, M E, and the Comparative Risk Assessment collaborating group (Cancers). Causes of cancerin the world: comparative risk assessment of nine behavioural and environmental risk factors. The Lancet. 2005;366(9499):1784-93.
19
13. Parkin DM, Boyd L, Walker LC. The fraction of cancer attributable to lifestyle and environmental factors in the UK in 2010. Br J Cancer. 2011;105(S2):S77-S81.14. McCartney G, Mahmood L, Leyland AH, Batty GD, Hunt K. Contribution ofsmoking-related and alcohol-related deaths to the gender gap in mortality: evidence from 30 European countries. Tobacco Control. 2011;20(2):166-8.15. Eurobarometer. Health in the European Union. 2007.16. Mladovsky P, Allin S, Masseria C, Hernández_Quevedo C, McDaid D, Mossialos E. Health in the European Union: trends and analysis. Copenhagen:World Health Organisation, 2009.17. Pierce M, Zaninotto P, Steel N, Mindell J. Undiagnosed diabetes-data from the English longitudinal study of ageing. Diabet Med. 2009;26(7):679-85.18. Van Oyen H, Cox B, Jagger C, Cambois E, Nusselder W, Gilles C, et al.Gender gaps in life expectancy and expected years with activity limitationsat age 50 in the European Union: associations with macro-level structural indicators. Eur J Ageing. 2010;7(4):229-37.19. Thomas B, Dorling D, Smith GD. Inequalities in premature mortality inBritain: observational study from 1921 to 2007. BMJ. 2010;341.20. Hacking JM, Muller S, Buchan IE. Trends in mortality from 1965 to 2008 across the English north-south divide: comparative observational study. BMJ. 2011;342.21. Saurel-Cubizolles M-J, Chastang J-F, Menvielle G, Leclerc A, Luce D, group ftE. Social inequalities in mortality by cause among men and women inFrance. Journal of Epidemiology and Community Health. 2009;63(3):197-202.22. Mackenbach J, Kunst A, Cavelaars A, Groenhof F, Geurts J. Socioeconomic inequalities in morbidity and mortality in western Europe. The EU Working Group on Socioeconomic Inequalities in Health. The Lancet. 1997;349:1655-59.23. Institute of Public Health in Ireland. Facing the Challenge: The Impact of Recession and Unemployment on Men’s Health in Ireland. Dublin: Institute of Public Health in Ireland,, 2011.24. Fésüs G, Östlin P, McKee M, Ádány R. Policies to improve the health and well-being of Roma people: The European experience. Health Policy. 2012;105(1):25-32.25. Binswanger I, Stern M, Deyo R, Heagerty P, Cheadle A, Elmore J, et al. Release from Prison: A High Risk of Death for Former Inmates. New England Journal of Medicine. 2007;356(2):157-65.26. Morrison DS. Homelessness as an independent risk factor for mortality: results from a retrospective cohort study. International Journalof Epidemiology. 2009.27. Huisman M, Kunst AE, Bopp M, Borgan J-K, Borrell C, Costa G, et al. Educational inequalities in cause-specific mortality in middle-aged and older men and women in eight western European populations. The Lancet. 2005;365(9458):493-500.28. Mackenbach JP, Bos V, Andersen O, Cardano M, Costa G, Harding S, et al. Widening socioeconomic inequalities in mortality in six Western European countries. International Journal of Epidemiology. 2003;32(5):830-7.29. Zatoński W, Manczuk M, Sulkowska U, and the HEM project team. Closingthe Health Gap in European Union. Warsaw: (available from www.hem.waw.pl), 2008.
20
30. Britton A, McKee M. The relation between alcohol and cardiovascular disease in Eastern Europe: explaining the paradox. Journal of Epidemiology and Community Health. 2000;54(5):328-32.31. Chenet L, Britton A, Kalediene R, Petrauskiene J. Daily variations indeaths in Lithuania: the possible contribution of binge drinking. International Journal of Epidemiology. 2001;30(4):743-8.32. Rehm J, Sulkowska U, Mańczuk M, Boffetta P, Powles J, Popova S, et al. Alcohol accounts for a high proportion of premature mortality in central and eastern Europe. International Journal of Epidemiology. 2007;36(2):458-67.33. Roerecke M, Rehm J. Irregular Heavy Drinking Occasions and Risk of Ischemic Heart Disease: A Systematic Review and Meta-Analysis. American Journal of Epidemiology. 2010;171:633-44.34. Gispert R, Serra I, Barés MA, Puig X, Puigdefàbregas A, Freitas A. The impact of avoidable mortality on life expectancy at birth in Spain: changes between three periods, from 1987 to 2001. Journal of Epidemiology and Community Health. 2008;62(9):783-9.35. Karanikolos M, Leon DA, Smith PC, McKee M. Minding the gap: changes in life expectancy in the Baltic States compared with Finland. Journal of Epidemiology and Community Health. 2012;66(11):1043-9.36. Eurostat. Health statistics – Atlas on mortality in the European Union. Luxembourg: European Commission, 2009.37. Pollard JH. On the Decomposition of Changes in Expectation of Life and Differentials in Life Expectancy. Demography. 1988;25(2):265-76.38. Chiang C. The life table and applications. Malabar (FL): Robert E Krieger Publ. Co; 1984.39. WHO. Global health risks: mortality and burden of disease attributable to selected major risks. Geneva: World Health Organisation, 2009.40. European Commission. Causes and Circumstances of Accidents at Work inthe EU. Luxembourg: Office for Official Publications 2008.41. Nolte E, McKee M. Measuring The Health Of Nations: Updating An Earlier Analysis Health Affairs. 2008;27(1):58-71.42. White A, Thomson C, Forman D, Meryn S. Men’s Health and the Excess Burden of Cancer in Men. Eur Urol Suppl 2010;9(3):467-70 43. Edgren G, Liang L, Adami H-O, Chang E. Enigmatic sex disparities in cancer incidence. European Journal of Epidemiology. 2012;27(3):187-96.44. Cook M, McGlynn K, Devesa S, Freedman N, Anderson W. Sex disparities in cancer mortality and survival. Cancer Epidemiology, Biomarkers & Prevention. 2011;20(8):1629-37.45. Dorak M, Karpuzoglu E. Gender differences in cancer susceptibility: an inadequately addressed issue. Front Genetics. 2012;3(268). Epub 2012 Nov28.46. Micheli A, Ciampichini R, Oberaigner W, Ciccolallo L, de Vries E, Izarzugaza I, et al. The advantage of women in cancer survival: An analysisof EUROCARE-4 data. European journal of cancer. 2009;45(6):1017-27.47. Nolte E, McKee M. Does Health Care Save Lives?: Avoidable mortality revisted. London: The Nuffield Trust, 2004.48. Funatogawa I, Funatogawa T, Yano E. Impacts of early smoking initiation: long-term trends of lung cancer mortality and smoking initiation from repeated cross-sectional surveys in Great Britain. BMJ Open. 2012;2(5).
21

49. White A, McKee M, Richardson N, de Visser R, Madsen SA, de Sousa BC, et al. Europe’s men need their own health strategy. BMJ. 2011;343:1144-7.
22
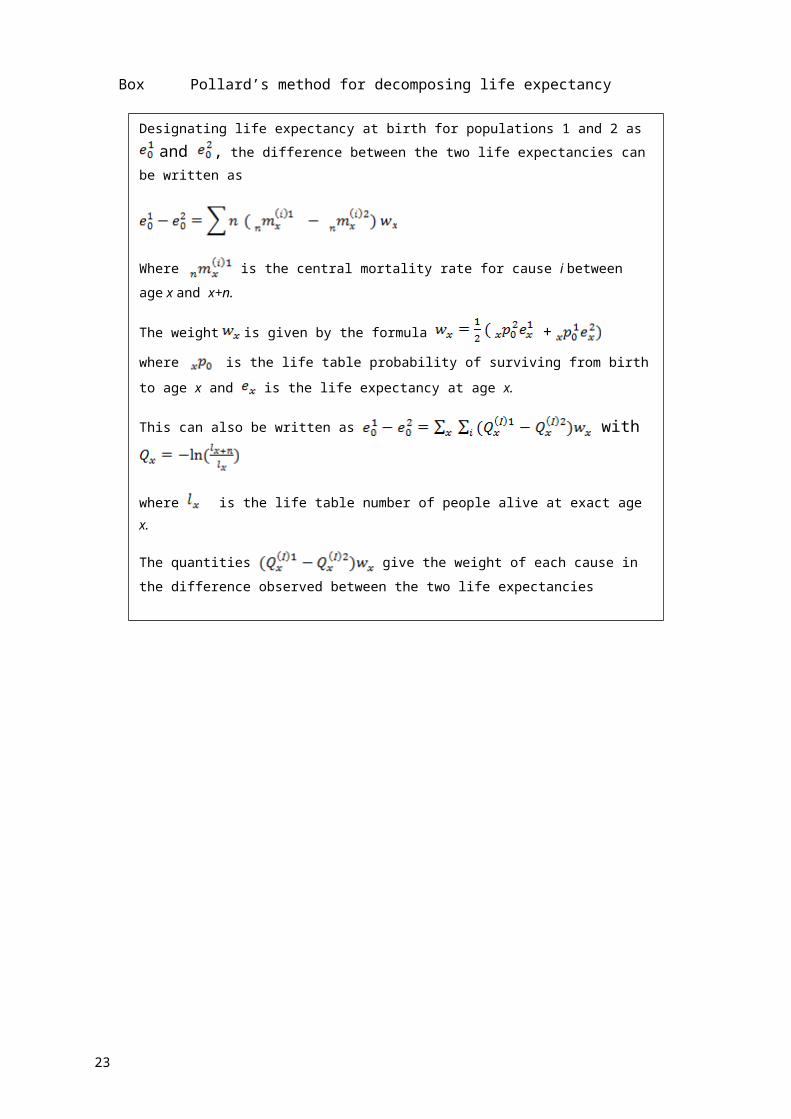
Box Pollard’s method for decomposing life expectancy
23
Designating life expectancy at birth for populations 1 and 2 as and , the difference between the two life expectancies can
be written as
Where is the central mortality rate for cause i between age x and x+n.
The weight is given by the formula + where is the life table probability of surviving from birthto age x and is the life expectancy at age x.
This can also be written as with
where is the life table number of people alive at exact age x.
The quantities give the weight of each cause in the difference observed between the two life expectancies
The sum over all ages gives the total contribution for each
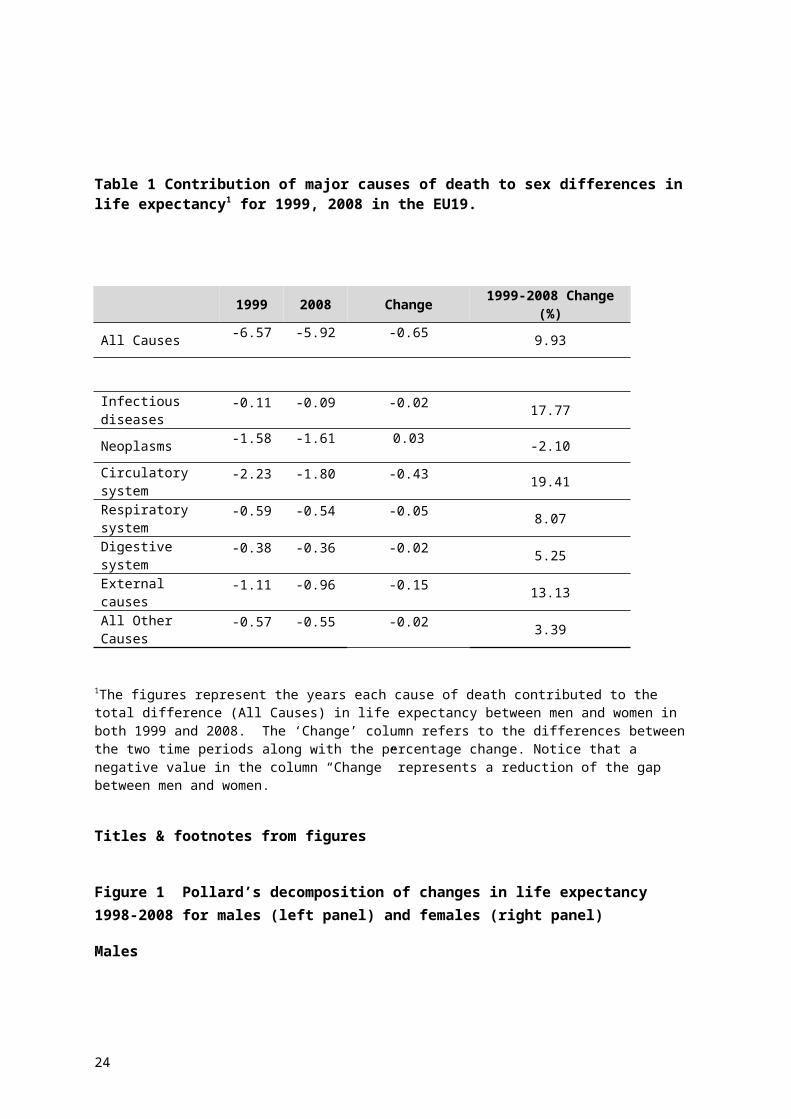
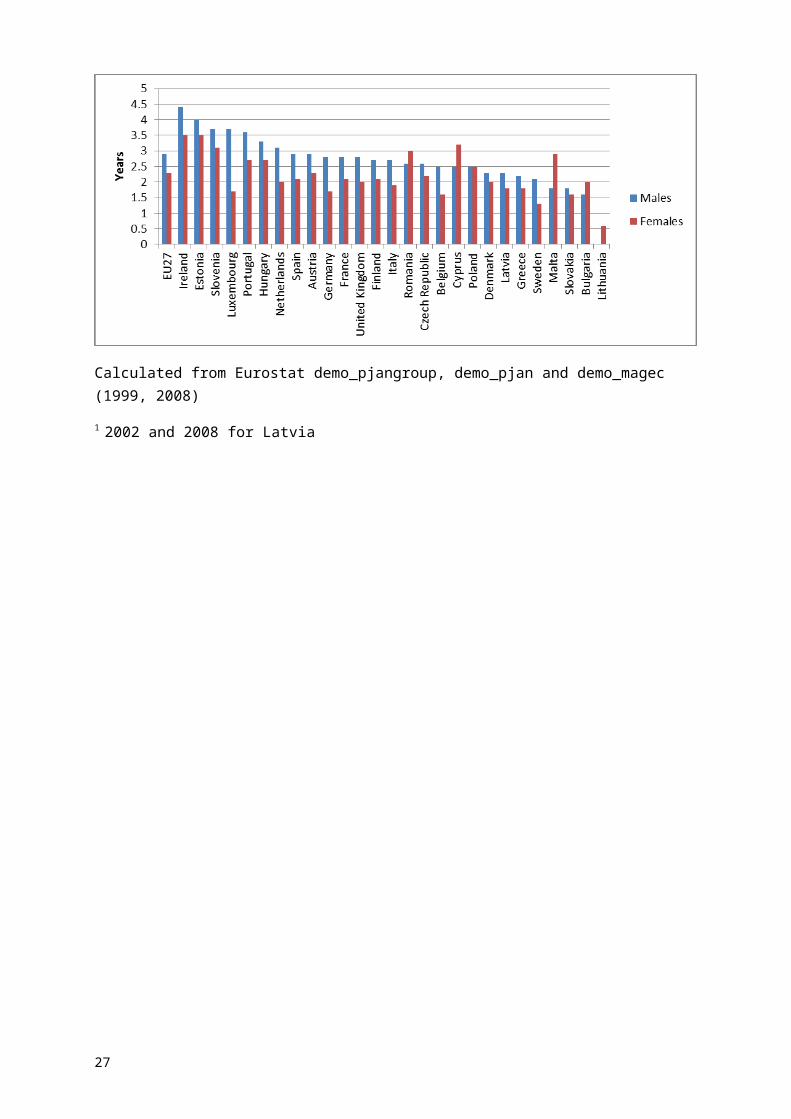
Table 1 Contribution of major causes of death to sex differences in life expectancy1 for 1999, 2008 in the EU19.
1999 2008 Change 1999-2008 Change(%)
All Causes -6.57 -5.92 -0.65 9.93
Infectious diseases
-0.11 -0.09 -0.02 17.77
Neoplasms -1.58 -1.61 0.03 -2.10Circulatory system
-2.23 -1.80 -0.43 19.41
Respiratory system
-0.59 -0.54 -0.05 8.07
Digestive system
-0.38 -0.36 -0.02 5.25
External causes
-1.11 -0.96 -0.15 13.13
All Other Causes
-0.57 -0.55 -0.02 3.39
1The figures represent the years each cause of death contributed to the total difference (All Causes) in life expectancy between men and women in both 1999 and 2008. The ‘Change’ column refers to the differences between the two time periods along with the percentage change. Notice that a negative value in the column “Change” represents a reduction of the gap between men and women.
Titles & footnotes from figures
Figure 1 Pollard’s decomposition of changes in life expectancy 1998-2008 for males (left panel) and females (right panel)
Males
24
Females
Calculated from Eurostat demo_pjangroup, demo_pjan and demo_magec (1999, 2008)
Figure 2 Pollard’s decomposition of male-female differences in lifeexpectancy, EU19, 1999 (left panel) and 2008 (right panel)
1999
25
2007
Calculated from Eurostat demo_pjangroup, demo_pjan and demo_magec (1999)
Figure 3 Difference in life expectancy for men and women in years, between 19991 and 2008
26
Calculated from Eurostat demo_pjangroup, demo_pjan and demo_magec (1999, 2008)
1 2002 and 2008 for Latvia
27
Related Documents