An Examination of Sectoral Growth’s Impact on Income Inequality in the United States BY Josh Paton ADVISOR • Laurie Bates _________________________________________________________________________________________ Submitted in partial fulfillment of the requirements for graduation with honors in the Bryant University Honors Program April 2018

Welcome message from author
This document is posted to help you gain knowledge. Please leave a comment to let me know what you think about it! Share it to your friends and learn new things together.
Transcript

An Examination of Sectoral Growth’s Impact on Income Inequality in the United StatesBY Josh Paton
ADVISOR • Laurie Bates
_________________________________________________________________________________________
Submitted in partial fulfillment of the requirements for graduation with honors in the Bryant University Honors Program
April 2018

An Examination of Sectoral Growth’s Impact on Income Inequality in the United States
Senior Capstone Project for Josh Paton
- 2 -
Table of Contents
Abstract ..................................................................................................................................... 3
Introduction ............................................................................................................................... 4
Literature Review ...................................................................................................................... 7
Background/History .............................................................................................................. 8
Literature Review .................................................................................................................. 8
Empirical Model and Data Sources: ....................................................................................... 11
Statistical Corrections ......................................................................................................... 12
Results and Discussion ............................................................................................................ 14
Existence of Kuznets Curve ................................................................................................ 14
Conclusion .............................................................................................................................. 16
Future Research ................................................................................................................... 17
Appendices .............................................................................................................................. 19
Appendix A- Manufacturing and Service Industries according to NAICS......................... 19
Appendix B- Descriptive Statistics and Correlation Table ................................................. 21
Appendix C- Variance Inflation Factor (VIF) .................................................................... 22
Appendix D- Whites Test for Heteroskedasticity ............................................................... 23
Appendix E- Breusch Pagan Test for Heteroskedasticity ................................................... 23
Appendix F- Breusch Godfrey Test for Autocorrelation .................................................... 23
Appendix G- Durbin’s Alternative Test for Serial Correlation .......................................... 24
References ............................................................................................................................... 25
An Examination of Sectoral Growth’s Impact on Income Inequality in the United States
Senior Capstone Project for Josh Paton
- 3 -
ABSTRACT
This paper is threefold in purpose; it aims to explore the relationship between the growth of manufacturing and service sectors and income inequality, determine if GDP growth helps reduce income inequality, and establish the existence of the Kuznets Curve from 1967-2017. The data supports an inverse relationship between growth in the manufacturing sector and income inequality however is not sufficient enough to conclude growth in the manufacturing sector impacts income inequality. Growth of GDP is shown to decrease income inequality which supports the notion that “a rising tide lifts all boats” and makes everyone better off than before. The positive impacts of GDP growth are equal in magnitude to the negative impacts of the service sector so if the economy grows but the service sector grows faster inequality will increase. Finally, the data confirms the existence of a Kuznets Curve in the United States over this time period.

An Examination of Sectoral Growth’s Impact on Income Inequality in the United States
Senior Capstone Project for Josh Paton
- 4 -
Introduction
This Senior Capstone Research Project explores the relationship between income inequality
and the allocation of labor to the agriculture, manufacturing and service sectors in the United
States from 1967 to 2017.
Today the most common measurement of inequality stems from a study published by
sociologist Corrado Gini in 1912. A Gini coefficient
measures inequality of some distribution, using a
Lorenz curve (Pictured right). The 45 degree line
represents perfect distribution where by 20% of the
population has 20% of the income and the line
below shows the actual distribution. The shaded
area between the two lines is the Gini coefficient. A
score of 1 represents complete inequality where 1 person holds all the wealth and a score
close to zero represents perfect distribution.
In 2010 the United Nations
published the Human Development
Report, which classified the global
Gini coefficient between .61 and
.68. As comparison, the U.S.
coefficient was .396 suggesting
that the U.S. has a more favorable
0.370
0.390
0.410
0.430
0.450
0.470
0.490
1967
1971
1975
1979
1983
1987
1991
1995
1999
2003
2007
2011
2015
U.S. Gini index of income inequality
An Examination of Sectoral Growth’s Impact on Income Inequality in the United States
Senior Capstone Project for Josh Paton
- 5 -
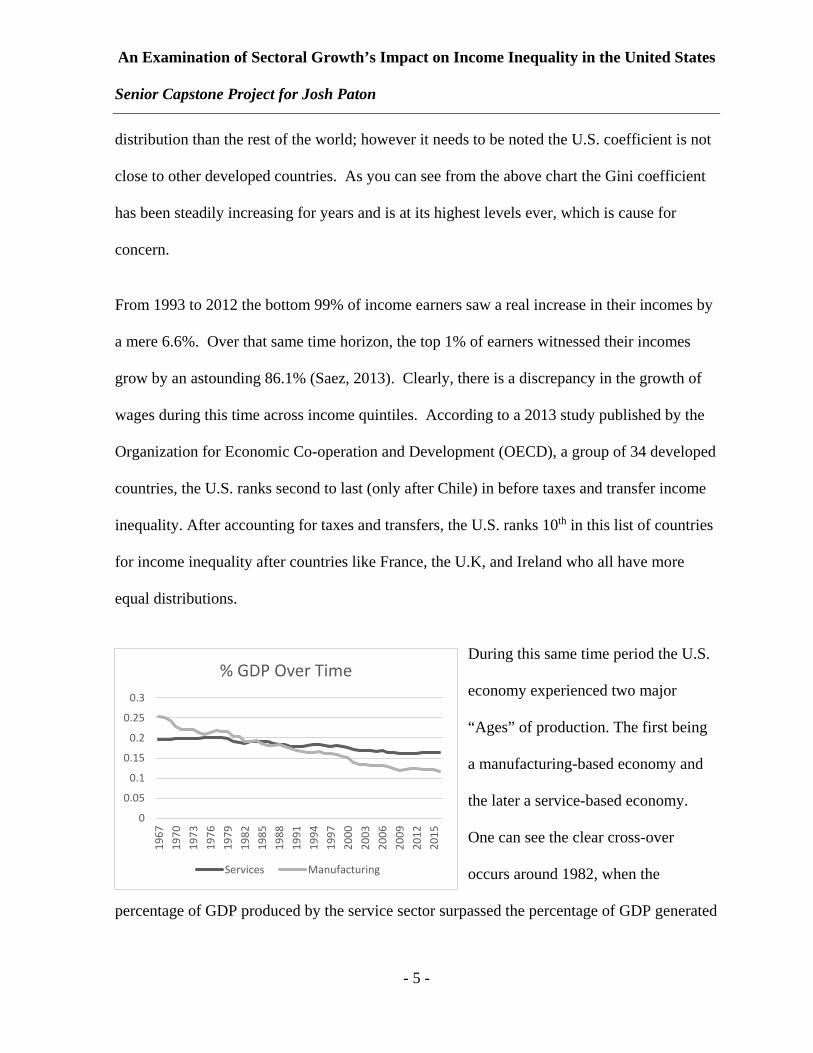
distribution than the rest of the world; however it needs to be noted the U.S. coefficient is not
close to other developed countries. As you can see from the above chart the Gini coefficient
has been steadily increasing for years and is at its highest levels ever, which is cause for
concern.
From 1993 to 2012 the bottom 99% of income earners saw a real increase in their incomes by
a mere 6.6%. Over that same time horizon, the top 1% of earners witnessed their incomes
grow by an astounding 86.1% (Saez, 2013). Clearly, there is a discrepancy in the growth of
wages during this time across income quintiles. According to a 2013 study published by the
Organization for Economic Co-operation and Development (OECD), a group of 34 developed
countries, the U.S. ranks second to last (only after Chile) in before taxes and transfer income
inequality. After accounting for taxes and transfers, the U.S. ranks 10th in this list of countries
for income inequality after countries like France, the U.K, and Ireland who all have more
equal distributions.
During this same time period the U.S.
economy experienced two major
“Ages” of production. The first being
a manufacturing-based economy and
the later a service-based economy.
One can see the clear cross-over
occurs around 1982, when the
percentage of GDP produced by the service sector surpassed the percentage of GDP generated
0
0.05
0.1
0.15
0.2
0.25
0.3
1967
1970
1973
1976
1979
1982
1985
1988
1991
1994
1997
2000
2003
2006
2009
2012
2015
% GDP Over Time
Services Manufacturing

An Examination of Sectoral Growth’s Impact on Income Inequality in the United States
Senior Capstone Project for Josh Paton
- 6 -
by the manufacturing sector. I am interested in examining how the sectoral shift from
manufacturing to services impacted income inequality in the U.S. from 1967 to 2015.
There are two approaches to defining the income inequality variable. Pikkety and Saez
(2003) use income groupings of the top 10%, 5%, 1%, .5%, .1% and .01% of income earners’
shares of all U.S. income, and how they have changed over time. The advantage to this
approach is it can provide insight into how income changed for the “wealthy” and “ultra-
wealthy” over a given time period.
The alternative measure of income inequality is the afore mentioned Gini coefficient,
published by the World Bank. I chose to use the Gini coefficient because it is a more current
measure of inequality (available up to 2017) and it considers the population as a whole and
not just the rich.
The second set of data comes from the Bureau of Economic Analysis (BEA) and shows the
sectoral shifts in the economy that have occurred over time. The BEA publishes a sectors
percentage contribution to GDP over time. Included in this is total U.S. GDP which is used to
calculate growth in GDP.
This research is relevant now more than ever because income inequality increasing and our
economy is shifting to the service sector. To date, very little information regarding this topic
exists so these findings will help focus the research efforts of other economists.
Understanding the historical effects of a sectoral shift on income inequality will leave policy
and decision makers better prepared to minimize the negative effects of income inequality.
An Examination of Sectoral Growth’s Impact on Income Inequality in the United States
Senior Capstone Project for Josh Paton
- 7 -
Literature Review
Our world is currently experiencing a perplexing paradox. Inequality between countries has
decreased significantly, due major economic progress in poorer countries. At the same time,
inequality within countries has significantly increased (Verbeek, 2015). The International
Monetary Fund (IMF) conducted a study that found from 1990-2010 inequality increased
11% within emerging economies. This indicates that while poorer countries are catching up
in income inequality, within developed nations it is getting worse. In that same study they
also discussed the consensus in the literature is that income inequality hinders economic
growth . (Ostry et al. 2014). At the same time, in the last 20 years, the share of service based
jobs in the U.S. has skyrocketed from 60% to 80% of the economy while manufacturing jobs
have plummeted from 35% to 20% (Bureau of Labor Statistics, 2012). Since income
inequality can retard economic growth, it is imperative to determine the causes of such
inequality. This research seeks to determine the relationship between these shifts in the
economy and income inequality.
To execute this research, conduct an empirical quantitative analysis will be conducted. My
perspective on this topic has been shaped through my past courses in finance and economics
as well as a personal interest in income inequality. Taking Public Finance with Professor
Bates offered insight into the huge discrepancies of income in the U.S. At the same time, in
the Archway Investment Fund I more clearly understood the historical weightings of
company’s market caps in benchmarks and how technology and service companies surged
recently. Thus, I questioned if the changes in the economy impacted income inequality at all.
An Examination of Sectoral Growth’s Impact on Income Inequality in the United States
Senior Capstone Project for Josh Paton
- 8 -
Background/History
Research into income inequality begins with the pioneer study published by Simon Kuznets in
1955. Kuznets proposed the idea of an inverted U relationship between economic growth and
income inequality, called a Kuznets Curve. He argued that in the early stages of an
economy’s development, increasing levels of income inequality occur, while as development
continues the level of income inequality decreases. Historically, as economies develop they
transition from agricultural production to manufacturing; this implies that as an economy
develops and transitions from an agrarian to a manufacturing, income inequality initially rises
and then falls afterwards. The Kuznets Curve exists because the new sector will initially be
more profitable than the previous and the labor moving into the more profitable sector will
cause inequality to rise until the majority of the population shifts over and inequality starts to
fall again. In effect, the newer sector is more profitable because workers in it have a higher
productivity of labor. This means that their wages should also be higher, since wages are a
function of some productivity.
One major limitation Kuznets had with his proposal was the lack of data that existed. His
publication was more of a call to arms for economists to address issues like these and start
collecting data and performing analysis to empirically prove the inverted relationship between
GDP growth and inequality.
Literature Review
Since Kuznets published his original study there have been countless attempts to prove or
disprove the existence of a Kuznets curve as an economy develops. Ravallion and Chen
(1997) and Deininger and Squire (1996) published dissenting views with Kuznets. They

An Examination of Sectoral Growth’s Impact on Income Inequality in the United States
Senior Capstone Project for Josh Paton
- 9 -
suggested more robust estimators than growth to income inequality and in the process added a
larger sample size to the research.. Huang (2012) recently disagreed with any affirmation of
the existence of a Kuznets curve due to a statistical bias. He pointed out that the test
researchers were performing to test for the Kuznets Curve inherently pointed towards the
existence of the relationship since the Kuznets curve is supposed to be “U” shaped. Therefore
when you run a quadratic test on it you are more likely to get “erroneously yield a U (or
inverted)” shaped result. For this reason he suggested testing it differently to ensure that at
low values the relationship is decreasing and at higher values the relationship is increasing.
Finally, most recently Beddoes (2012) proposed an augmented Kuznets Curve that increases
at the end due to high income sectors benefitting from an economic boom.
One thing researchers do agree on is that some type of income inequality exists in all modern
nations. However, there is little consensus on it’s effects on growth or the best way to address
it. Barro (2000, 2008) found no statistically significant relation in income inequality and
growth of a nation. Barro’s study included 84 “sovereign nations.” Some setbacks Barro
faced was that some of his data was tampered with by the governments and therefore not
clean which could skew the results. Ultimately, Barro concluded that income inequality
slightly benefitted growth in richer countries and retarded growth in poorer countries. This
point is important because it sets a base line for how income inequality should affect a
developed country like the U.S by retarding growth. On the other hand, Perotti (1996) found
that income inequality and investment have an inverse relationship that can prove fatal to
development of a country, developed or developing. Similar to Barro he used a panel of 70
countries in his study. He calls investment “the primary engine for growth”. Income

An Examination of Sectoral Growth’s Impact on Income Inequality in the United States
Senior Capstone Project for Josh Paton
- 10 -
inequality impedes investment because only a few rich people determine where capital is
allocated. Therefore money is not efficiently allocated to where it should be and growth is
hindered as a result.
In Capital in the 21st Century Thomas Piketty, one of the most profound income inequality
experts of this generation, argues that income inequality is inherent in a capitalistic society
since the return of capital is greater than the growth rate of the economy (rcapital > geconomy).
Lopez-Bernardo (2016) criticizes some of Piketty’s points by coming up with four arguments
against what he says. The most important of these is that post-Keynesian economists can
learn from Piketty’s insights about personal income distribution and incorporate them into
their models. This nullifys Piketty’s point of it being inherent because they argue that if you
know what causes it you can get rid of it.
In these different perspectives to decreasing income inequality, one side of researchers offer a
classical approach by leaving the market alone since it will eventually reach an equilibrium.
The opposite perspective on how to deal with inequality is strict government regulation in
order to redistribute incomes with less inequality (Spithoven, 2013). Spithoven concludes
that income distribution cannot be left to the market alone but society rather needs the
government to ensure market reform conducive to a “more favorable” distribution of income.
Peterson (2001) would argue that government intervention has further increased income
inequality. He agrees that some policies are needed to improve income inequality however he
notes that it is not only the policies that the government is creating that are contributing to the
problem, but also “what they have not done is also contributing to the increase in income
inequality in the past two decades”. Special interest groups can cause policy makers to shift

An Examination of Sectoral Growth’s Impact on Income Inequality in the United States
Senior Capstone Project for Josh Paton
- 11 -
focus and thus pass watered downed versions of what really needs to be passed to lessen
inequality.
I agree more with Peterson’s perspective. He understands that today there is too much focus
on the policies that are being proposed and how they “could” help income inequality. Instead
society should focus on where we still need reform and regulation because the regulation that
does come through is often too diluted from the political environment, resulting in little to no
effect. My research topic is intended to provide insight into whether or not certain industries
help or hinder the income inequality in the U.S. and thus the government could create policies
to help.
EMPIRICAL MODEL AND DATA SOURCES:
The model I chose to empirically study this relationship is based off of Gonzalez and
Resosudarmo (2016), where they explored sectoral shifts impact on income inequality in
Indonesia. The model is best described by Eq. 1.
𝐺𝐺𝐺𝐺𝐺𝐺𝐺𝐺 = 𝛿𝛿 + 𝜷𝜷1𝑔𝑔𝐺𝐺𝑔𝑔𝑔𝑔 + 𝜷𝜷2𝑔𝑔𝑔𝑔𝐺𝐺𝑔𝑔𝑔𝑔 + 𝜷𝜷3𝑔𝑔𝑔𝑔𝐺𝐺𝑔𝑔𝑔𝑔 + 𝜷𝜷4𝐺𝐺𝑔𝑔𝑔𝑔 + 𝜷𝜷5𝐺𝐺𝑔𝑔𝑔𝑔2 + 𝝋𝝋𝝋𝝋 + 𝜀𝜀 (Eq. 1)
Where:
GINI is the U.S. yearly Gini coefficient
𝜷𝜷𝒏𝒏𝑔𝑔𝑔𝑔 is the per capita growth of GDP value added by the manufacturing (M) and
service (S) sector
𝜷𝜷𝑛𝑛𝐺𝐺𝑔𝑔𝑔𝑔 is GDP and GDP squared to test for the existence of the Kuznets Curve
𝝋𝝋𝝋𝝋 are the additional covariates of unemployment and education
𝜀𝜀 is some error term

An Examination of Sectoral Growth’s Impact on Income Inequality in the United States
Senior Capstone Project for Josh Paton
- 12 -
These data come from the Bureau of Economic Analysis. They published yearly industry
value added to total GDP. I divided this by the population of the United States to get per
capita industry value added. I then used the NAICS classification codes for each sector to
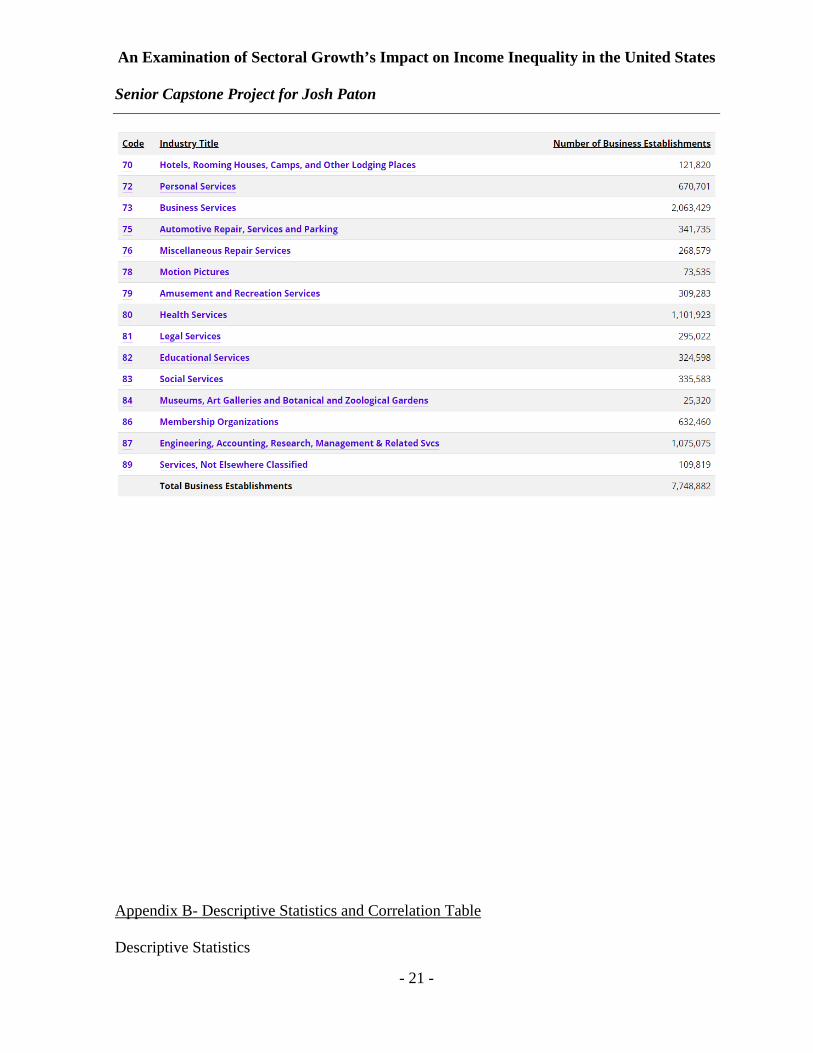
aggregate and get total GDP for each sector. See Appendix A for a list of industries in each
sector. From here I calculated the 5 year average growth rate of each. Using growth rates for
sectors eliminates any statistical unit roots issues and is better because absolute levels are
linearly biased whereas growth rates vary. 𝝋𝝋𝝋𝝋 includes data on education and employment to
population as well as growth of GDP. The data for education are obtained from the United
States Census Bureau. It is a measure of the percent of the population that is older than 25
years and have completed at least 4 years of college. The employment data are gathered from
the United States Bureau of Labor Statistics. The employment to population ratio is used to
control for population. Both of these controls are on a per capita level. This ensures that
demographics of the population are not driving the output but rather the meaning behind the
economic variable. The growth of GDP variable is used to control for the growth of all other
sectors not accounted for in this model.
For a complete descriptive summary and correlation table reference Appendix B.
Statistical Corrections
In order to ensure robust results various statistical tests were conducted for multicolinearity,
homoscedasticity, and serial correlation. I calculated the variance inflation factors (VIF) for
this model and got a mean VIF of 99.35. This is substantially higher than 10 which would
suggest multicolinearity exists. One reason for this multicolinearity could be my small
sample size of 45 observations. While small, these observations should still have good

An Examination of Sectoral Growth’s Impact on Income Inequality in the United States
Senior Capstone Project for Josh Paton
- 13 -
predicting power because they exceed the recommended 35 observations. To look more into
this high VIF I looked at the correlation matrix. The highest correlation is between GDP and
GDP2. This makes sense because GDP2 is a derivation of GDP. Also when I look at the
breakdown of VIF the two highest factors involved those two variables. Because they are not
correlated by chance and have a dependent effect I will not worry about correcting for this
multicolinearity.
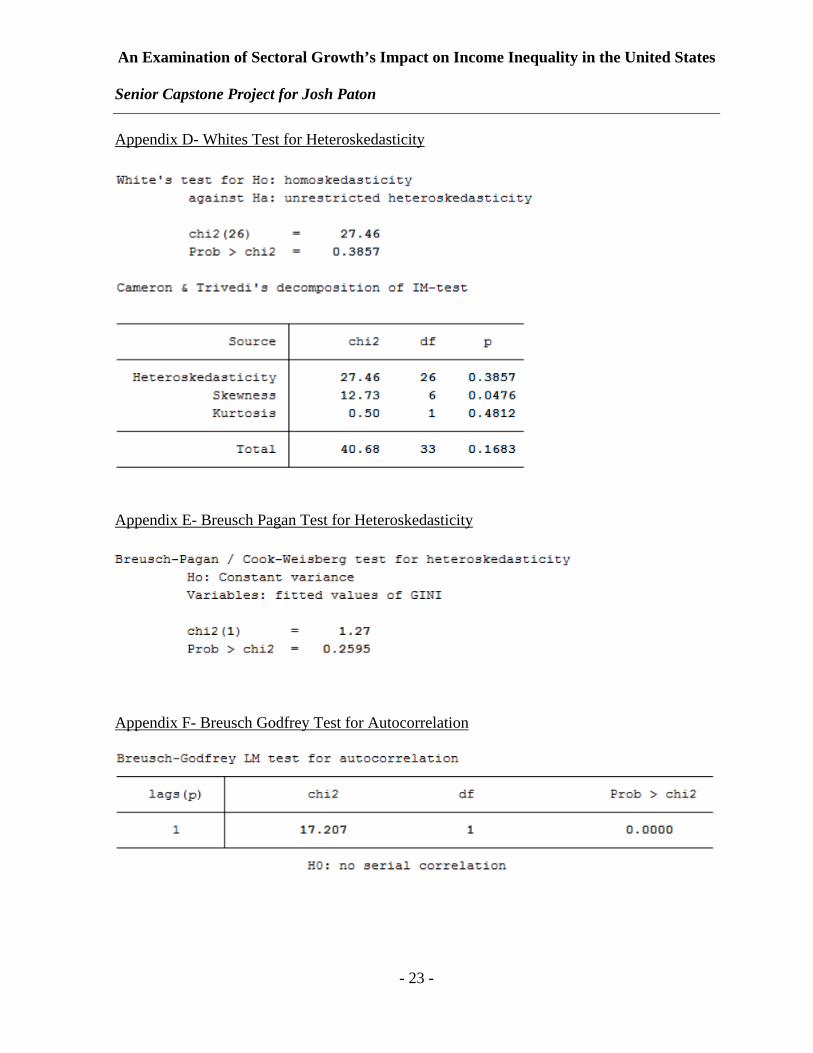
Second, with multicolinearity taken care of I decided to test for any heteroskedasticity in my
data to ensure that the OLS estimator assumptions were met. At first I created residual plots
for all of my variables but did not see any heteroskedasticity in the data. To be sure I
calculated a White’s test (Appendix D). The White’s test failed to reject the null hypothesis
of homoskedasticity. To ensure the reliability of this test, I also performed a Breusch-Pagan
test for heteroskedasticity (Appendix E). This test also confirmed that the dataset was
homoskedastic in nature. Because it is homoskedastic in nature it satisfies the assumption for
an OLS regression and no transformations needs to be carried out.
Last, I checked for serial correlation amongst the dataset. I performed a Breusch-Godfrey test
(Appendix F). The test confirmed the presence of serial correlation by rejecting the null
hypothesis. To verify the accuracy of this test I also performed the Durbin’s alternative test
for serial correlation (Appendix G). This yielded the same result so I can confidently
conclude that some form of serial correlation exists. . Now that I diagnosed serial correlation
I determined the extent by calculating a Durbin-Watson d-statistic. The d-statistic was
1.0504. This statistic ranges from 0 to 4 with 0 representing perfect positive serial

An Examination of Sectoral Growth’s Impact on Income Inequality in the United States
Senior Capstone Project for Josh Paton
- 14 -
correlation, 2 meaning no serial correlation and 4 representing negative serial correlation. A
value of 1.0504 is less than 2 which confirms the presence of positive serial correlation.
RESULTS AND DISCUSSION
Existence of Kuznets Curve
To correct for the serial correlation I used the Cochrane-Orcutt(CO) method. After completing
this method the transformed Durbin-Watson statistic was 1.8002 which is much closer to two
and therefore corrected for the serial correlation.

An Examination of Sectoral Growth’s Impact on Income Inequality in the United States
Senior Capstone Project for Josh Paton
- 15 -
As you can see from Table 1 there is a significant coefficient on the growth of service sector
but insignificant coefficient on the growth of manufacturing sector vector. The growth of
service coefficient of .3004 means that a 1 point increase in the growth of GDP will increase
the Gini coefficient and thus inequality by .3. Because the growth is measured as a
percentage in decimal format this suggests a 1% increase in the service sector raises the Gini
coefficient by .0034 points. This is to say that as people enter the service sector income
inequality increases. However, people leaving the manufacturing sector doesn’t affect income
inequality. Thus the growth of the manufacturing sector has no predictive power.
One of the interesting results is the significance and sign on GDP and GDP2. GDP is positive
and significant at the .01 level and GDP2 is negative and significant at the .05 level. This
means that GDP is a significant predictor of income in equality in the U.S. Because GDP2 is
negative that means that GDP is related to Gini coefficient in a negative quadratic. This
agrees with the Kuznets curve that Kuznets proposed in 1955.
The growth of GDP is also significant at the .05 level and negative. This means that as the
economy grows, that is that the GDP gets bigger, inequality decreases. Theoretically as the
economy grows there will be more jobs and people will fill those jobs. People who were not
previously working will now be making money and this will decrease inequality in the U.S.
A coefficient of -.2722 means that for every 1% increase in GDP the Gini coefficient
decreases by .0027 points.
It is important to note that the service sector might be underrepresented due to inefficiencies
in measuring productivity. This is because two people in the service sector can work the same

An Examination of Sectoral Growth’s Impact on Income Inequality in the United States
Senior Capstone Project for Josh Paton
- 16 -
amount of time however their productivity will be drastically different. A doctor or a
consultant that works an hour will have a different amount of output than a worker at a cashier
at some fast food restaurant. However, all of these occupations get put into the service sector.
In addition to this it is difficult to measure what the true ouput of these workers are so
sometimes the data is unrepresentative of their true contribution to GDP.
CONCLUSION
This paper investigated the effects of growth in the manufacturing and service sector on
income inequality in the United States from 1967 to 2017. In essence, the past literature
explores in detail the factors and consequences of income inequality in the United States. The
literature fails to connect how economic growth, measured by the allocation of labor to
different sectors over time, impacts income inequality. The results indicate that that general
growth of the economy, in terms of GDP, benefits all members of the economy. Also growth
in the service sector increases income inequality while growth of the manufacturing has no
predicting power in determining income inequality. Finally, it also confirms the existence of
a Kuznets Curve.
Growth of GDP decreasing income inequality is a significant finding since it indicates that not
only the rich benefit from the economy growing. This means that “a rising tide lifts all boats
and not just the yachts.” Therefore, as the economy grows everybody is better off because
economic growth creates more jobs that people fill and get paid for. In turn, income
inequality decreases because less people are unemployed and working less skilled jobs.

An Examination of Sectoral Growth’s Impact on Income Inequality in the United States
Senior Capstone Project for Josh Paton
- 17 -
It is important to note that this economic growth is almost equal in magnitude to the service
sector results. Market forces continue to move us to the service sector. If this growth is
greater than the growth of the economy, inequality will worsen since the negative effects of
the service sector will outweigh the positive effects of overall growth. However, if the growth
of the economy can sustain at a rate larger than the growth of the service sector, then income
inequality as a whole will decrease. Therefore policy makers should be focusing on growing
the economy as a whole and not just on sector to impact inequality.
Finally, the data also confirm the existence of the Kuznets curve for the U.S. over this same
time period. Therefore as the U.S. economy develops income inequality should initially rise
and then fall.
The Gini coefficient will never be 0 and some levels of inequality are good. With this said
policy makers can target to decrease inequality and make more people better off. These
results suggest that policy makers should not be focusing their efforts on the manufacturing
and service sectors, but rather the economy as a whole. If they can help grow it at a rate faster
than the growth of the service sector then everyone will be better off because the rising tide
lifting all boats will serve the U.S. better than focusing on lifting just one industry.
Future Research
One thing that researchers could look into in the future is the same study with a panel data set
of states in the United States. This would multiply the number of observations by 50 and
make the results more robust because of the larger sample size. This would also control for
any regional effects such as the Midwest being more agricultural based or the Northeast being
An Examination of Sectoral Growth’s Impact on Income Inequality in the United States
Senior Capstone Project for Josh Paton
- 18 -
more service oriented. Any econometric model is only as good as the data that is behind it
and unfortunately it would be very difficult to locate state level data for all of these variables .
Another thing researchers can look into in the future is the idea of the augmented age. As
technology advances more and more we are entering an age in which human production is
augmented by a machine of some point. In theory the augmented age would make
manufacturing a more attractive sector than services because humans would be able to lift
more, perform tasks faster, etc. with the help of robots. Therefore someone could look into
the effects of the augmented age on income inequality. Since the manufacturing sector was
not seen as a significant predictor of income inequality there is another sector that is
contributing to the huge increase in U.S. income inequality.
Finally, researchers could segment the sectors into industries. Right now things like “Legal
Services” fall into the same service sector as “Museums”. These are clearly totally different
services being offered. I did not take a look at the significance of each of these industries that
make up the sector. Lawyers are going to make more than museum workers so growing one
of these industries more would definitely contribute to inequality more and therefore
investigating which had a larger impact would prove useful.

An Examination of Sectoral Growth’s Impact on Income Inequality in the United States
Senior Capstone Project for Josh Paton
- 19 -
APPENDICES
Appendix A- Manufacturing and Service Industries according to NAICS
Manufacturing:

An Examination of Sectoral Growth’s Impact on Income Inequality in the United States
Senior Capstone Project for Josh Paton
- 20 -
Services
An Examination of Sectoral Growth’s Impact on Income Inequality in the United States
Senior Capstone Project for Josh Paton
- 21 -
Appendix B- Descriptive Statistics and Correlation Table
Descriptive Statistics

An Examination of Sectoral Growth’s Impact on Income Inequality in the United States
Senior Capstone Project for Josh Paton
- 22 -
Correlation Matrix
Appendix C- Variance Inflation Factor (VIF)
An Examination of Sectoral Growth’s Impact on Income Inequality in the United States
Senior Capstone Project for Josh Paton
- 23 -
Appendix D- Whites Test for Heteroskedasticity
Appendix E- Breusch Pagan Test for Heteroskedasticity
Appendix F- Breusch Godfrey Test for Autocorrelation

An Examination of Sectoral Growth’s Impact on Income Inequality in the United States
Senior Capstone Project for Josh Paton
- 24 -
Appendix G- Durbin’s Alternative Test for Serial Correlation

An Examination of Sectoral Growth’s Impact on Income Inequality in the United States
Senior Capstone Project for Josh Paton
- 25 -
References
Atkinson, A.B, and J.E Stiglitz. (1976) “The Design of Tax Structure: Direct Versus Indirect
Taxation.” Journal of Public Economics, Vol. 6, No. 1-2, pp. 55–75.
Beddoes, ZM. (2012), ‘For richer, for poorer’, The Economist, Vol. 13
Charles-Coll, Jorge A.. (2011) “Understanding Income Inequality: Concept, Causes and
Measurement.”
Cohen, Stephen S. and John Zysman. (1987) "Why Manufacturing Matters: the Myth of the
Post-Industrial Economy." California Management Review, Vol. 29, No. 3, pp. 9-26.
Conti, Maurice. (2017) "The Incredible Inventions of Intuitive AI." Ted Talk. Portland. 10
May 2017.
DeSilver, Drew. (2013)“U.S. Income Inequality, on Rise for Decades, Is Now Highest since
1928.”Pew Research Center
Deininger, Klaus and Lyn Squire, "A New Data Set Measuring Income Inequality", The World Bank Economic Review, Vol. 10, No. 3): pp565-91.
Gonzalez, Ivan and Resosudarmo, Budy, (2016), “A sectoral growth-income inequality nexus
in Indonesia”, Departmental Working Papers, The Australian National University,
Arndt-Corden Department of Economics
De Maio, Fernando. (2007), “Income Inequality Measures.” Journal of Epidemiology and
Community Health, BMJ
Josifidis, Kosta and Alpar Losonc. (2014), "Some Thoughts on Power: International
Context." Panoeconomicus, Vol. 61, No. 5, pp. 597-615.

An Examination of Sectoral Growth’s Impact on Income Inequality in the United States
Senior Capstone Project for Josh Paton
- 26 -
Kuznets, Simon. (1955), Economic growth and income inequality. American Economic
Review, 45: pp.1–28.
Lee, Hae-Young et al., (2013) “Empirical Analysis on the Determinants of Income Inequality
in Korea.”
Lewis, Frank D. (1979) “Explaining the Shift of Labor from Agriculture to Industry in the
United States: 1869 to 1899.” The Journal of Economic History, Vol. 39, No. 3, pp.
681–698.
Long, Heather. "U.S. Inequality Keeps Getting Uglier." CNNMoney. Cable News Network,
n.d. Web. 14 May 2017.
Lopez-Bernardo, Javier, et al. (2016) "Fundamental Contradiction of Capitalism: A Post-
Keynesian Response." Review of Political Economy, Vol. 28, No. 2, pp. 190-204.
Narob, N'Yilimon. (2015) "Income Inequality and Inflation in Developing Countries: An
Empirical Investigation." Economics Bulletin, Vol. 35, No. 4, pp. 2888-2902.
Ostry, MJD, Berg, MA & Tsangarides, MCG (2014), Redistribution, inequality, and growth,
International Monetary Fund, viewed 22 August 2015, .
Perotti, R. (1996) Growth, income distribution, and democracy: what the data say, Journal of
Economic Growth, 1, pp. 149–87.
Peterson, Janice. (2001) “The Policy Relevance of Institutional Economics.” Journal of
Economic Issues 35, 1 : pp. 173-183.
Piketty, T., & Goldhammer, A. (2014). Capital in the twenty-first century. Cambridge
Massachusetts: The Belknap Press of Harvard University Press.
Piketty, Thomas and Emmanuel Saez. (2003) "Income Inequality In The United States, 1913-
1998," Quarterly Journal of Economics, Vol 118, pp. 1-39.

An Examination of Sectoral Growth’s Impact on Income Inequality in the United States
Senior Capstone Project for Josh Paton
- 27 -
Ravallion, Martin Chen, Shaohua. (1997) The World Bank Economic Review, Volume 11, Issue 2, 1 pp. 357–382, Spithoven, Antoon. (2013) "The Great Financial Crisis and Functional Distribution of
Income." Journal of Economic Issues, vol. 47, no. 2, pp. 505-513.
Saez, Emmanuel. (2013). Striking it Richer: The Evolution of Top Incomes in the United
States (Update with 2012 estimates). Institute for Research on Labor and
Employment. UC Berkeley: Institute for Research on Labor and Employment.
Saez, Emmanuel. (2006) “Redistribution toward Low Incomes in Richer
Countries.” Understanding Poverty, pp. 187–202.
Verbeek, Jos. (2015) “Increasingly, Inequality within, Not across, Countries Is Rising.” Let's
Talk Development
Related Documents