University of Nebraska - Lincoln DigitalCommons@University of Nebraska - Lincoln Sociology Department, Faculty Publications Sociology, Department of 1-1-2010 An Examination of Questionnaire Evaluation by Expert Reviewers Kristen Olson University of Nebraska - Lincoln, [email protected] Follow this and additional works at: hp://digitalcommons.unl.edu/sociologyfacpub Part of the Sociology Commons is Article is brought to you for free and open access by the Sociology, Department of at DigitalCommons@University of Nebraska - Lincoln. It has been accepted for inclusion in Sociology Department, Faculty Publications by an authorized administrator of DigitalCommons@University of Nebraska - Lincoln. Olson, Kristen, "An Examination of Questionnaire Evaluation by Expert Reviewers" (2010). Sociology Department, Faculty Publications. Paper 136. hp://digitalcommons.unl.edu/sociologyfacpub/136

Welcome message from author
This document is posted to help you gain knowledge. Please leave a comment to let me know what you think about it! Share it to your friends and learn new things together.
Transcript
University of Nebraska - LincolnDigitalCommons@University of Nebraska - Lincoln
Sociology Department, Faculty Publications Sociology, Department of
1-1-2010
An Examination of Questionnaire Evaluation byExpert ReviewersKristen OlsonUniversity of Nebraska - Lincoln, [email protected]
Follow this and additional works at: http://digitalcommons.unl.edu/sociologyfacpubPart of the Sociology Commons
This Article is brought to you for free and open access by the Sociology, Department of at DigitalCommons@University of Nebraska - Lincoln. It hasbeen accepted for inclusion in Sociology Department, Faculty Publications by an authorized administrator of DigitalCommons@University ofNebraska - Lincoln.
Olson, Kristen, "An Examination of Questionnaire Evaluation by Expert Reviewers" (2010). Sociology Department, Faculty Publications.Paper 136.http://digitalcommons.unl.edu/sociologyfacpub/136
295
Published in Field Methods 22:4 (2010), pp. 295–318; doi: 10.1177/1525822X10379795 Copyright © 2010 Kristen Olson; published by Sage Publications. Used by permission. http://fmx.sagepub.com/content/22/4/295
An Examination of Questionnaire Evaluation by Expert Reviewers
Kristen Olson
Department of Sociology and Survey Research and Methodology Program, University of Nebraska–Lincoln, PO Box 880324, Lincoln, NE 68588, USA;
email [email protected]
AbstractExpert reviews are frequently used as a questionnaire evalua-tion method but have received little empirical attention. Ques-tions from two surveys are evaluated by six expert reviewers using a standardized evaluation form. Each of the questions has validation data available from records. Large inconsisten-cies in ratings across the six experts are found. Despite the lack of reliability, the average expert ratings successfully identify questions that had higher item nonresponse rates and higher levels of inaccurate reporting. This article provides empirical evidence that experts are able to discern questions that mani-fest data quality problems, even if individual experts vary in what they rate as being problematic. Compared to a publicly available computerized question evaluation tool, ratings by the human experts positively predict questions with data quality problems, whereas the computerized tool varies in success in identifying these questions. These results indicate that expert reviews have value in identifying question problems that result in lower survey data quality. 295
Keywords: questionnaire design, pretesting, measurement er-ror, expert reviewers
Kristen OlsOn in F ield Methods 22 (2010)296
Introduction
Survey researchers frequently ask a team of experts to review ques-tionnaires as a method of identifying question problems, breakdowns in the question-answering process, and other potential measurement errors in survey reports. In an expert review, survey methodologists, psychol-ogists, sociologists, or other people familiar with questionnaire design identify potential problems with a survey questionnaire. Although many varieties of expert reviews exist (Willis et al. 1999), two primary goals of an expert review are to reveal problems with a survey instrument so that they can be remedied prior to going into the field or to sort items into groups that are more or less likely to exhibit measurement errors. For ex-ample, expert reviewers have been used as a pretesting method (Presser and Blair 1994; Esposito and Rothgeb 1997; Willis et al. 1999), to iden-tify problematic linguistic structures in survey questions (Holbrook et al. 2007), and for classification of items related to interviewer effects (Man-gione et al. 1992; Schnell and Kreuter 2005). The number of expert review-ers tends to be small, ranging from two or three expert methodologists (Presser and Blair 1994; Theis et al. 2002; Jansen and Hak 2005; Holbrook et al. 2007) to over 20 reviewers (Willis et al. 1999). In general, expert re-view is a relatively quick and inexpensive method for evaluating ques-tionnaires (Presser and Blair 1994). Although this method is easy to im-plement, whether different experts reliably identify the same problems in a questionnaire has received relatively little attention. In addition, the ability of experts to discern questions that are prone to item nonresponse or inaccurate reports has not been examined. This article addresses both of these issues.
Most examinations of expert review compare this method to other pre-testing methods such as behavior coding and cognitive interviews (Presser and Blair 1994; Rothgeb et al. 2001; Jansen and Hak 2005; Graesser et al. 2006). Despite the widespread use of this technique, few empirical evalua-tions exist of the expert review method itself. In particular, there is little ev-idence as to whether different expert reviewers identify similar question problems (Tourangeau 2004). After a search of the peer-reviewed literature and conference proceedings, only three studies were identified that explic-itly look at variation across experts, two examining one expert from each of the three organizations (Rothgeb et al. 2001; DeMaio and Landreth 2003) or differences across two panels of experts (Presser and Blair 1994). These studies found disagreement about problems with individual questions across the experts, but differences across experts and differences across or-ganizations cannot be easily disentangled.
An exAminAtiOn Of Quest iOnnAire evAluAtiOn by expert reviewers 297
DeMaio and Landreth (2003) suggest four reasons why experts might differ in the number and types of problems that they identify on survey questions. These include the time each expert spent on the task, their ex-pectations about the task, their perceptions about what makes “good” or “bad” questions, their experience or training in conducting evaluations of questionnaires, and whether the review is conducted collaboratively or individually. Other reasons for disagreement across experts are re-lated to the degree of standardization in the task, such as whether explicit forms or codes are used for the evaluation (Willis et al. 1999), the degree to which the expert is familiar with the subject matter content of the ques-tionnaire (Ramirez 2002), and the amount of context given to the experts about the questionnaire administration (Ramirez 2002). This would sug-gest that some variation in expert ratings can be controlled by standard-izing the task given to the expert, much like standardizing the interview-er’s task (Cannell et al. 1981), but that other variation cannot be easily controlled without specific selection of experts (e.g., that related to expe-rience or background knowledge).
Implicitly assumed by the use of expert review is that the questions that are identified as being “problematic” by the experts actually yield higher levels of measurement error than other questions (Tourangeau 2004). Evaluations of the quality of expert reviews compare it to other methods containing proxy indicators of data quality, such as interviewer and respondent behaviors during an interview (Presser and Blair 1994; Forsyth et al. 2004; Schaeffer and Dykema 2004). These comparisons show that experts identify more problems than other methods and that there is often little overlap between the methods. To identify whether the problems identified by experts actually are associated with inaccu-rate survey reports, a record base containing a “gold standard” for the responses must be available for this comparison, unavailable for many questions or populations.
This article addresses these two gaps in the research literature. Varia-tion across experts in their reviews of question problems is examined, as is whether questions identified as problematic by the experts are system-atically related to data quality problems—item nonresponse and report inaccuracy— on those questions. Two surveys are used, selected because of their record bases for items that were also asked in the questionnaire. Human experts are compared to an “expert” computer system designed to identify potential question comprehension problems (Graesser et al. 2006), the response process most frequently identified as potentially fail-ing in expert reviews (DeMaio and Landreth 2003). Thus, this article aims to answer two questions: Are expert reviewers consistent in identifying
Kristen OlsOn in F ield Methods 22 (2010)298
problematic questions? Do expert reviews adequately identify questions that result in data quality problems?
Data and Method
Questions from two surveys were reviewed. All questions reported here were selected because of the availability of validation data from re-cords. As such, all selected questions are behavioral or other questions about autobiographical events; attitudinal questions are excluded be-cause of the lack of validation data. The types of questions range from dates to dollar amounts (questions that respondents frequently have dif-ficulty answering precisely; see, e.g., Tourangeau et al. 2000) to the pres-ence or absence of important life events (questions that are often an-swered more accurately). Most of the questions are open ended.
Description of the Surveys
The Wisconsin Divorce Study
The 1995 Wisconsin Divorce Study (WDS) selected a random sample from divorce certificates from four counties in Wisconsin from 1989 to 1993. Sampled persons in the WDS were asked to participate in the Life Events and Satisfaction Survey, a mixed mode study starting with a tele-phone request with nonrespondents followed up by mail. Overall, ap-proximately 730 persons were attempted, and the response rate (AAPOR RR2, American Association for Public Opinion Research [AAPOR] 2006) was 71%, with a contact rate of 80% and a cooperation rate of 88%.
The survey contained questions on satisfaction with life and rela-tionships, marital and cohabitation history, childbearing history, edu-cation and work history, satisfaction with current relationships, and de-mographics. The divorce certificates contain demographics for both members of the divorcing couples (gender, race, and education level) and information about child custody arrangements that result from the di-vorce as well as divorce, marriage, and birth dates and the number of marriages. In total, the experts examined and rated 31 questions in this survey, including the questions immediately preceding and following the questions reported here. I focus on six questions from this survey, in-cluding the month and date of birth, marriage, and divorce, whether the individual had ever been married, divorced, and the number of previous marriages.
An exAminAtiOn Of Quest iOnnAire evAluAtiOn by expert reviewers 299
National Postsecondary Student Aid Study (NPSAS)
The U.S. National Center for Education Statistics sponsored the 2004 NPSAS. The NPSAS was also a mixed mode survey, in which sampled students in the NPSAS were recruited by e-mail and a personalized ad-vance letter to participate in a Web survey, followed up with telephone requests. Details about the sample design and methodology for the NPSAS are described in detail elsewhere (Cominole et al. 2006). This article focuses on the experts’ ability to discern the accuracy of reports among questions answered by undergraduates, an analytic data set of over 68,000 students. Data quality estimates account for the complex sur-vey design and unequal weights. The contact rate for this set of under-graduates was high—96% (AAPOR weighted CON2)—and the coopera-tion rate is 73%, with an overall response rate of 70% (AAPOR weighted RR2; see AAPOR 2006).
The survey contained questions about sources and amount of finan-cial aid, school attendance, academic major, academic performance, and demographics. The record data contained financial aid information ob-tained from the school or university and from two federal databases on student loans and grants—the Free Application for Federal Student Aid (FAFSA) and the National Student Loan Data System. The records also include measures of academic performance. The experts rated 78 ques-tions in this survey, presented in the order in which they appeared in the questionnaire. The 11 questions of interest for this analysis include whether the student applied for and received financial aid, particular types and amounts of aid, and grade point average.
Data Quality Indicators
I look at two data quality measures—item nonresponse and inaccu-racy rates. Item nonresponse is selected because it is the data quality mea-sure most likely to be available to other survey analysts. Response inac-curacy uses the records available for each survey and examines whether the survey reports exactly match those in the records. For date questions, accuracy is measured to the month and year reported. For grade point average, accuracy is measured to the second decimal, the level of detail asked for in the questionnaire.
Item nonresponse rates in both surveys are quite low. In the WDS, they range from no item nonresponse on a question of ever being mar-ried to under 9% for the divorce date. In the NPSAS, item nonresponse rates on these questions are no more than 4%. In contrast, both surveys

Kristen OlsOn in F ield Methods 22 (2010)300
have questions with large amounts of inaccurate reporting. For example, up to half of the divorce dates are misreported (to the month and year) in the WDS and almost 83% of the grade point average (GPAs) is misre-ported in the NPSAS (to the second decimal). For other WDS items, inac-curate reports range from 1.5% (ever being married) to about 33% (mar-riage date). Inaccuracy rates on other items in the NPSAS range from about 7% (receiving Pell Grants or Work Study aid) to just under 25% (amounts of state and institutional aid). Despite the large proportions of inaccurate reports, the magnitude of the misreports is small. For exam-ple, reports of divorce dates are, on average, only about 6 months off of the actual date and the average magnitude of the difference in reported grade point average is less than 0.2 points. So that a common metric can be examined on all items, I use a binary measure of accurate versus inac-curate reports.
Description of the Expert Reviews
Six expert reviewers—the author plus five additional reviewers—participated in this study. Five of the expert reviewers were employed at the same academic survey research organization; one was employed at a different large-scale survey research organization. The reviewers were selected because they had similar background training of at least a mas-ter’s degree in survey methodology, psychology, or related fields. All of the reviewers had taken graduate-level coursework related to question-naire design and/ or the social and cognitive processes of survey mea-surement and/or had at least 2 years of prior work experience in sur-vey organizations. Thus, the experts were selected to minimize variation in background characteristics across the experts, rather than attempting to draw a probability sample of all experts. The experts conducted their review independently. To maintain independence of the reviews, all re-viewers were asked to conduct the reviews individually; the identity of the other reviewers was not revealed to any reviewer aside from the au-thor. Additionally, all ratings (other than the author’s) were conducted without knowledge of the empirical measurement error properties of the reports.
A new question evaluation tool was developed for this research, based off existing appraisal tools (Presser and Blair 1994; Willis et al. 1999; Rothgeb et al. 2001; Theis et al. 2002; Graesser et al. 2006) and the cog-nitive response process (Tourangeau 1984; Tourangeau et al. 2000). For each question, the reviewers were asked to rate both cognitive and mo-tivational characteristics of questions (Jansen and Hak 2005). Reviewers
An exAminAtiOn Of Quest iOnnAire evAluAtiOn by expert reviewers 301
first rated motivational characteristics of the question, including whether the question or characteristic measured by the question was burdensome (requires a great deal of cognitive work by the respondent), sensitive (re-quires revealing embarrassing or private information or the topic is not discussed in everyday conversation), or socially undesirable (requires re-vealing information that may be compared against a social norm for pos-sessing or not possessing a characteristic). Reviewers then rated whether they thought any failure of any part of the cognitive response process was likely to occur on that question.
For those questions rated as possibly experiencing failures, each ex-pert rated the likelihood of the breakdown occurring at each stage of the cognitive response process on a 4-point scale ranging from not at all likely to very likely that a failure of this stage will occur. The four stages are comprehension (understanding the question), retrieval (obtaining the information for the question from memory), judgment (evaluating the retrieved information and whether it meets the question objectives), and editing (modifying the response; Tourangeau et al. 2000). The ex-perts also were asked to provide written comments with more detailed information about the individual types of problems they thought were likely to occur.
All experts examined the same questions using forms developed by the author (see Appendix). In the WDS, the 6 questions examined here result in a total of 36 expert ratings. In the NPSAS, the 10 questions exam-ined here yield a total of 60 expert ratings.
As a comparison, each question was also evaluated by the Question Understanding Aid (QUAID), a publicly available Web application de-signed to identify wording problems in survey questions (Graesser et al. 2006). This comparison allows me to discern whether any given ex-pert system, human or computer, performs better in identifying prob-lematic questions. The use of the QUAID tool also provides a compari-son between the somewhat broader categories evaluated by the experts and the more detailed wording problems identified by the QUAID tool. Each question and response options (where applicable) was entered into QUAID. The number of problems QUAID identified was counted, ranging from zero to five for the questions here. Each identified vague or unfamiliar word was counted individually; this was the most com-mon critique of the problematic questions. If both expert systems are identifying similar problems, I would expect positive associations be-tween the human experts and QUAID. QUAID identifies problems with syntactical structure of questions, so I expect the strongest association between the expert ratings and the QUAID ratings to be for comprehen-sion difficulties.
Kristen OlsOn in F ield Methods 22 (2010)302
Analysis
The analysis proceeds in three steps. First, I look at agreement across the experts. There are many measures for examining agreement across raters, differing in whether the measure accounts for agreements occur-ring by chance, whether the ratings are assumed to be nominal or ordi-nal, and whether items and raters are assumed to be fixed or randomly selected (Schrout and Fleiss 1979; Banerjee et al. 1999). As such, three measures were used to indicate the degree of agreement across the re-viewers in their ratings—the proportion of all two-way combinations of reviewers who provide exactly the same rating across all of the ques-tions (the match rate), a multiple coder kappa (Kalton and Stowell 1979), and an intraclass correlation coefficient (ICC). The match rate is intuitive but does not account for chance agreement. Kappa and the match rate across reviewers treat both items and reviewers as fixed but do not ac-count for the ordinal nature of the ratings. The ICC measures the reliabil-ity of the expert ratings, treats both items and reviewers as random, and accounts for the ordinal ratings of the cognitive response process ratings. The match rate ranges from 0 (no agreement) to 1 (perfect agreement). Kappa and the ICC account for chance. Kappa ranges from –1 (perfect dis-agreement) to +1 (perfect agreement), where values around 0 indicate agree-ment no different from chance alone. The ICC theoretically ranges from 0 (no agreement) to +1 (perfect agreement), although technical issues related to estimating the ICC can result in negative estimated ICC values (Lahey et al. 1983). I look at overall agreement and agreement between individ-ual experts.
I then briefly examine the average question-level ratings across the six experts. I compare this with the ratings from the computerized “expert” questionnaire review system. I also discuss the variation in ratings across the items and across the surveys. Finally, I use Spearman rank-order cor-relations to look at the relationship between the expert ratings and the item nonresponse rates and percentage of inaccurate reports across the questions. I examine this relationship overall using the average expert ratings and separately for each of the six experts. This allows me to deter-mine whether the questions that were identified as being the most likely to experience problems were also more likely to actually experience data quality failures and the extent to which the experts vary in their ability to discern problematic questions.
An exAminAtiOn Of Quest iOnnAire evAluAtiOn by expert reviewers 303
Findings
Agreement across the Raters
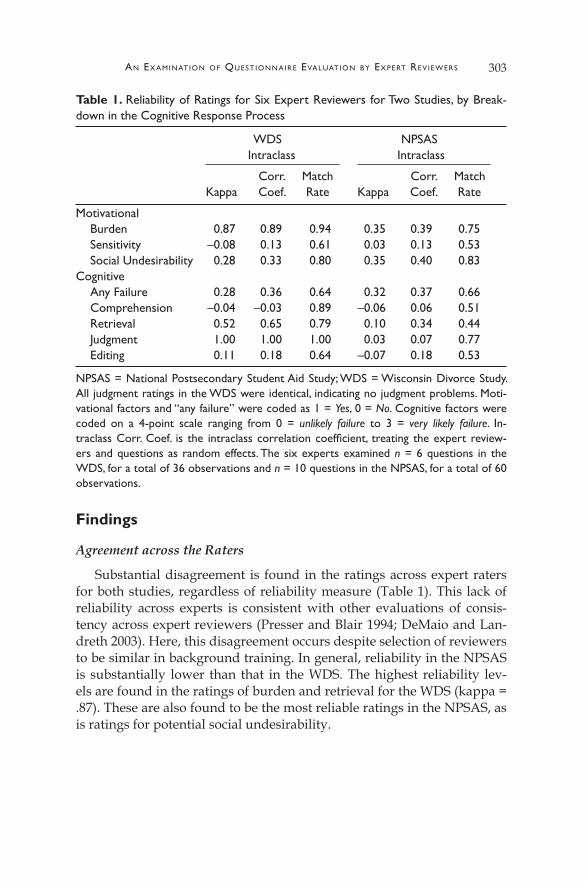
Substantial disagreement is found in the ratings across expert raters for both studies, regardless of reliability measure (Table 1). This lack of reliability across experts is consistent with other evaluations of consis-tency across expert reviewers (Presser and Blair 1994; DeMaio and Lan-dreth 2003). Here, this disagreement occurs despite selection of reviewers to be similar in background training. In general, reliability in the NPSAS is substantially lower than that in the WDS. The highest reliability lev-els are found in the ratings of burden and retrieval for the WDS (kappa = .87). These are also found to be the most reliable ratings in the NPSAS, as is ratings for potential social undesirability.
Table 1. Reliability of Ratings for Six Expert Reviewers for Two Studies, by Break-down in the Cognitive Response Process
WDS NPSAS Intraclass Intraclass
Corr. Match Corr. Match Kappa Coef. Rate Kappa Coef. Rate
Motivational Burden 0.87 0.89 0.94 0.35 0.39 0.75 Sensitivity –0.08 0.13 0.61 0.03 0.13 0.53 Social Undesirability 0.28 0.33 0.80 0.35 0.40 0.83
Cognitive Any Failure 0.28 0.36 0.64 0.32 0.37 0.66 Comprehension –0.04 –0.03 0.89 –0.06 0.06 0.51 Retrieval 0.52 0.65 0.79 0.10 0.34 0.44 Judgment 1.00 1.00 1.00 0.03 0.07 0.77 Editing 0.11 0.18 0.64 –0.07 0.18 0.53
NPSAS = National Postsecondary Student Aid Study; WDS = Wisconsin Divorce Study. All judgment ratings in the WDS were identical, indicating no judgment problems. Moti-vational factors and “any failure” were coded as 1 = Yes, 0 = No. Cognitive factors were coded on a 4-point scale ranging from 0 = unlikely failure to 3 = very likely failure. In-traclass Corr. Coef. is the intraclass correlation coefficient, treating the expert review-ers and questions as random effects. The six experts examined n = 6 questions in the WDS, for a total of 36 observations and n = 10 questions in the NPSAS, for a total of 60 observations.
Kristen OlsOn in F ield Methods 22 (2010)304
To see whether any single reviewer was diminishing the reliability of the estimates, I look at the average match rate for each expert with the other five experts. To do this, I calculate the exact match rate for each ex-pert with each of the other five experts for each survey and then average the five values.
There is no obvious standout in the WDS, with the average match rate across experts ranging from 75% to 84%. Expert 2 has the lowest rate of agreement with the other reviewers in the NPSAS (an average 44% match compared to a range of 58–72% for the other experts). I exclude expert 2 and reestimate all of the NPSAS reliability measures. The largest dif-ferences in reliability are found in the “any failure” and “social undesir-ability” categories. Reliability measures for all of the other categories ex-cluding expert 2 are similar to those including this reviewer. Dropping expert 2 lowers the mean ratings on all categories. Thus, expert 2 iden-tified more problems with the questions than other reviewers. Notably, expert 2 was from the same organization as most of the other reviewers. There is no clear expert that had the highest match rate with the other ex-perts across the two studies.
In other words, the use of experts to identify question problems is it-self subject to measurement error. As the raters had no knowledge of the empirical distribution of the measurement errors before conducting the reviews, the ratings are likely to be unbiased, although noisy.
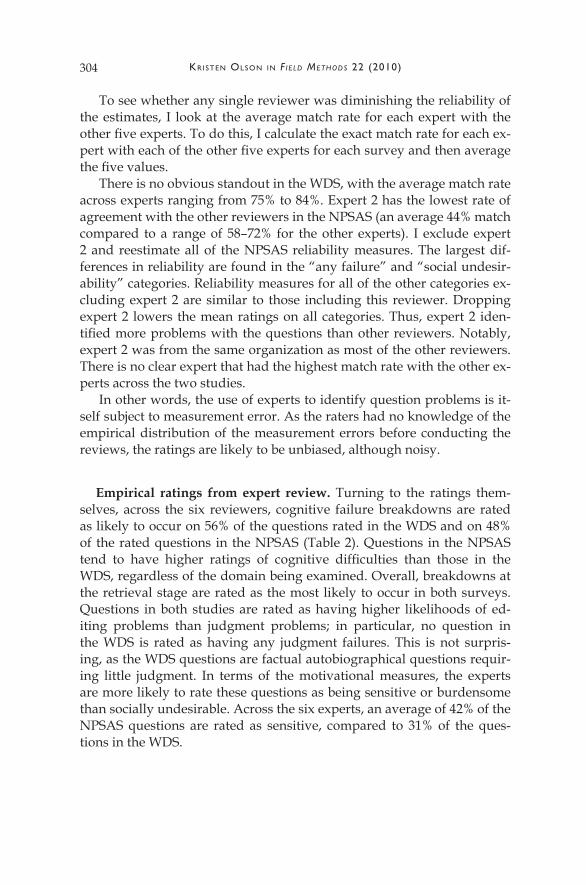
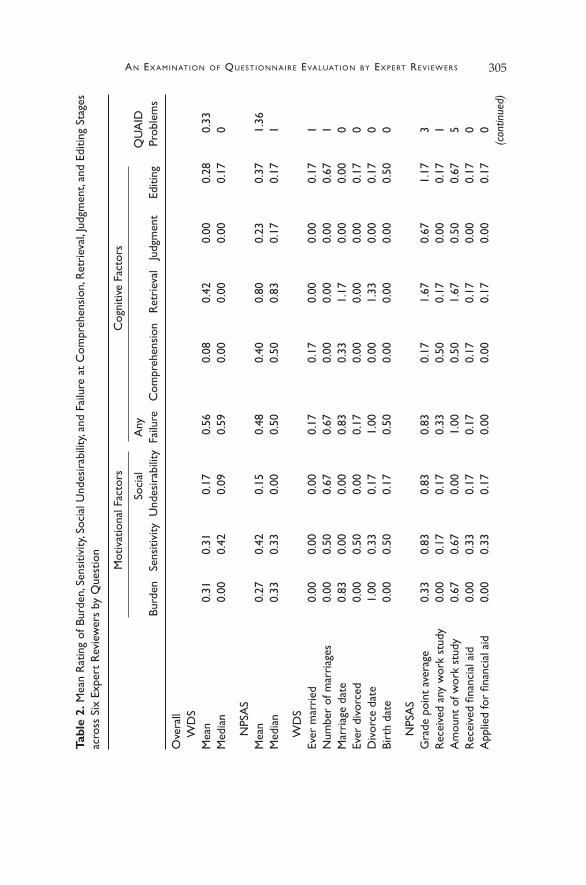
Empirical ratings from expert review. Turning to the ratings them-selves, across the six reviewers, cognitive failure breakdowns are rated as likely to occur on 56% of the questions rated in the WDS and on 48% of the rated questions in the NPSAS (Table 2). Questions in the NPSAS tend to have higher ratings of cognitive difficulties than those in the WDS, regardless of the domain being examined. Overall, breakdowns at the retrieval stage are rated as the most likely to occur in both surveys. Questions in both studies are rated as having higher likelihoods of ed-iting problems than judgment problems; in particular, no question in the WDS is rated as having any judgment failures. This is not surpris-ing, as the WDS questions are factual autobiographical questions requir-ing little judgment. In terms of the motivational measures, the experts are more likely to rate these questions as being sensitive or burdensome than socially undesirable. Across the six experts, an average of 42% of the NPSAS questions are rated as sensitive, compared to 31% of the ques-tions in the WDS.
An exAminAtiOn Of Quest iOnnAire evAluAtiOn by expert reviewers 305Ta
ble
2. M
ean
Rat
ing
of B
urde
n, S
ensi
tivity
, Soc
ial U
ndes
irab
ility
, and
Fai
lure
at
Com
preh
ensi
on, R
etri
eval
, Jud
gmen
t, an
d Ed
iting
Sta
ges
acro
ss S
ix E
xper
t R
evie
wer
s by
Que
stio
n
Mot
ivat
iona
l Fac
tors
Cog
nitiv
e Fa
ctor
s
So
cial
A
ny
QU
AID
Bur
den
Sen
sitiv
ity U
ndes
irab
ility
Fai
lure
C
ompr
ehen
sion
R
etri
eval
Ju
dgm
ent
E
ditin
g
Pro
blem
s
Ove
rall
W
DS
Mea
n
0.31
0
.31
0.1
7
0.56
0
.08
0.
42
0.00
0.
28
0.33
M
edia
n
0.00
0.
42
0.09
0.
59
0.00
0
.00
0.
00
0.17
0
N
PSA
S M
ean
0.
27
0.42
0.
15
0.48
0
.40
0.
80
0.2
3
0.37
1.
36
Med
ian
0.
33
0.33
0
.00
0.5
0
0.50
0
.83
0.
17
0.1
7
1
W
DS
Ever
mar
ried
0.
00
0.00
0.
00
0.17
0.
17
0.00
0
.00
0.1
7
1 N
umbe
r of
mar
riag
es
0.00
0.
50
0.6
7
0.67
0.
00
0.00
0
.00
0.
67
1 M
arri
age
date
0.
83
0.00
0
.00
0.8
3
0.33
1
.17
0.0
0
0.00
0
Ev
er d
ivor
ced
0.
00
0.5
0
0.00
0.
17
0.0
0 0
.00
0.
00
0.17
0
D
ivor
ce d
ate
1.0
0 0
.33
0.
17
1.00
0.
00
1.33
0.
00
0.17
0
Birt
h da
te
0.00
0.
50
0.17
0.
50
0.00
0.
00
0.0
0
0.50
0
N
PSA
S G
rade
poi
nt a
vera
ge
0.33
0.
83
0.83
0
.83
0.
17
1.67
0.
67
1.17
3
Rec
eive
d an
y w
ork
stud
y
0.00
0.
17
0.1
7
0.33
0.
50
0.17
0
.00
0.
17
1
Am
ount
of w
ork
stud
y
0.67
0.
67
0.00
1.
00
0.50
1.
67
0.50
0.
67
5 R
ecei
ved
finan
cial
aid
0.
00
0.3
3
0.17
0.
17
0.17
0
.17
0.
00
0.17
0
App
lied
for
finan
cial
aid
0.
00
0.33
0.
17
0.0
0 0
.00
0.
17
0.00
0.
17
0 (c
ontin
ued)
Kristen OlsOn in F ield Methods 22 (2010)306Ta
ble
2. c
ontin
ued
Mot
ivat
iona
l Fac
tors
Cog
nitiv
e Fa
ctor
s
So
cial
A
ny
QU
AID
Bur
den
Sen
sitiv
ity U
ndes
irab
ility
Fai
lure
C
ompr
ehen
sion
R
etri
eval
Ju
dgm
ent
E
ditin
g
Pro
blem
s
Rec
eive
d St
affo
rd lo
an
0.0
0
0.33
0.
00
0.33
0
.50
0.6
7
0.00
0
.17
0
Rec
eive
d Pe
ll gr
ant
0.
00
0.33
0.
00
0.3
3
0.50
0.
67
0.0
0
0.17
0
R
ecei
ved
any
inst
itutio
nal a
id 0
.50
0.3
3
0.00
0.
50
0.83
0
.83
0.
17
0.1
7
1 R
ecei
ved
any
stat
e ai
d
0.50
0.
33
0.0
0 0
.50
0.8
3 0
.83
0.
17
0.1
7 1
A
mou
nt o
f ins
titut
iona
l aid
0
.83
0.
67
0.00
1
.00
0.
67
1.83
0.
83
0.6
7 2
A
mou
nt o
f sta
te a
id
0.83
0
.67
0.0
0
1.00
0
.67
1.
83
0.83
0.
67
2
NPS
AS
= N
atio
nal P
osts
econ
dary
Stu
dent
Aid
Stu
dy; Q
UA
ID =
Que
stio
n U
nder
stan
ding
Aid
; WD
S =
Wis
cons
in D
ivor
ce S
tudy
. Rat
ings
are
av-
erag
ed o
ver
n =
6 re
view
ers.
Mot
ivat
iona
l fac
tors
and
“an
y fa
ilure
” w
ere
code
d as
1 =
Yes
, 0 =
No.
Cog
nitiv
e fa
ctor
s w
ere
code
d on
a 4
-poi
nt
scal
e ra
ngin
g fr
om 0
= u
nlike
ly fa
ilure
to
3 =
very
like
ly fa
ilure
. The
QU
AID
pro
blem
s ar
e a
coun
t of
the
num
ber
of p
robl
ems
iden
tified
by
the
com
pute
rize
d qu
estio
nnai
re e
valu
atio
n to
ol, Q
UA
ID.
An exAminAtiOn Of Quest iOnnAire evAluAtiOn by expert reviewers 307
Variation exists in the ratings across questions. Questions related to dates—especially marriage and divorce dates—in the WDS are rated by the experts as being more likely to experience retrieval breakdowns and be burdensome than the other WDS questions. Questions related to the amount of financial aid received in the NPSAS are similarly rated as be-ing more burdensome and having retrieval difficulties. Grade point av-erage is rated as being the most likely to suffer from social desirability concerns and editing problems, the stage of the cognitive response pro-cess most closely related to socially desirable responses (Tourangeau et al. 2000).
The computerized expert, QUAID, identified only two questions with minor question wording problems in the WDS. In the NPSAS, seven questions are identified as having some wording problems, with the amount of work study aid earned the most problematic question, fol-lowed by grade point average. When looking at the relationship between the QUAID ratings and the expert ratings, I expect the strongest correla-tions to be with ratings of comprehension problems, given that syntac-tical problems are related to understanding the question. No significant correlation is found between the QUAID ratings and the expert ratings in the WDS, not surprising given the lack of variation in the QUAID ratings. Surprisingly, however, the QUAID ratings are most strongly related to ratings of editing failures in the NPSAS (Spearman’s rho = .86, p < .001) but not related to comprehension difficulties (Spearman’s rho = .28, p = .40). That is, questions identified by the experts as being most likely to pose comprehension difficulties are not similarly identified by the com-puter tool. This discrepancy between experts and QUAID matches origi-nal research on the tool (Graesser et al. 2006). The expert ratings for bur-den, sensitivity, any failure, retrieval, and judgment are also positively and significantly related (p < .05) to the QUAID ratings.
Relationship between Average Ratings and Data Quality
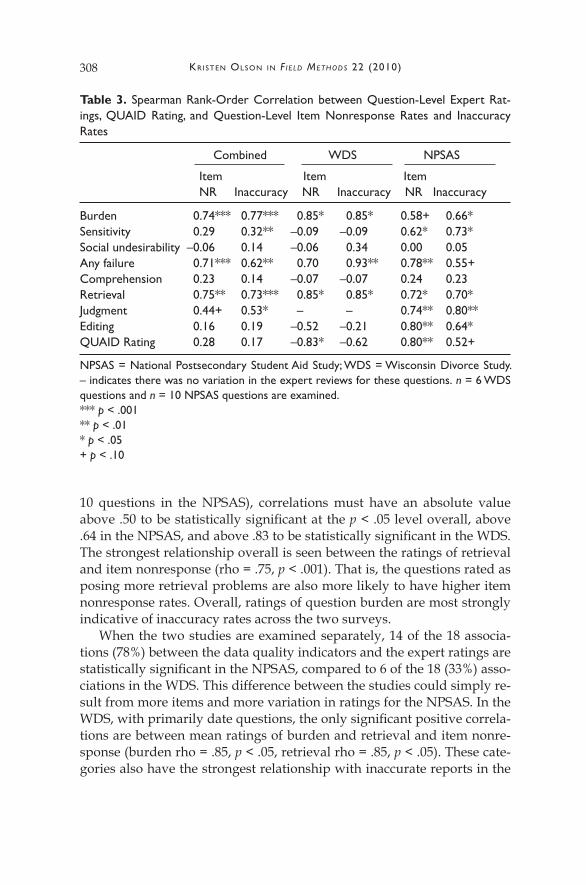
The next question is whether the items identified by the experts as be-ing more likely to suffer cognitive or motivational failures are also more likely to have data quality problems (Table 3). When the two studies are combined, positive correlations are found between most of the mean ex-pert ratings and the data quality indicators, indicating that questions rated as being more likely to experience cognitive response or motiva-tional problems are more likely to be questions with higher item nonre-sponse rates or higher rates of inaccuracy. The size of the Spearman rank-order correlations are low to moderate, ranging from about .05 to .75 in absolute value. Given the small sample sizes (6 questions in the WDS and
Kristen OlsOn in F ield Methods 22 (2010)308
10 questions in the NPSAS), correlations must have an absolute value above .50 to be statistically significant at the p < .05 level overall, above .64 in the NPSAS, and above .83 to be statistically significant in the WDS. The strongest relationship overall is seen between the ratings of retrieval and item nonresponse (rho = .75, p < .001). That is, the questions rated as posing more retrieval problems are also more likely to have higher item nonresponse rates. Overall, ratings of question burden are most strongly indicative of inaccuracy rates across the two surveys.
When the two studies are examined separately, 14 of the 18 associa-tions (78%) between the data quality indicators and the expert ratings are statistically significant in the NPSAS, compared to 6 of the 18 (33%) asso-ciations in the WDS. This difference between the studies could simply re-sult from more items and more variation in ratings for the NPSAS. In the WDS, with primarily date questions, the only significant positive correla-tions are between mean ratings of burden and retrieval and item nonre-sponse (burden rho = .85, p < .05, retrieval rho = .85, p < .05). These cate-gories also have the strongest relationship with inaccurate reports in the
Table 3. Spearman Rank-Order Correlation between Question-Level Expert Rat-ings, QUAID Rating, and Question-Level Item Nonresponse Rates and Inaccuracy Rates
Combined WDS NPSAS
Item Item Item NR Inaccuracy NR Inaccuracy NR Inaccuracy
Burden 0.74*** 0.77*** 0.85* 0.85* 0.58+ 0.66* Sensitivity 0.29 0.32** –0.09 –0.09 0.62* 0.73* Social undesirability –0.06 0.14 –0.06 0.34 0.00 0.05 Any failure 0.71*** 0.62** 0.70 0.93** 0.78** 0.55+ Comprehension 0.23 0.14 –0.07 –0.07 0.24 0.23 Retrieval 0.75** 0.73*** 0.85* 0.85* 0.72* 0.70* Judgment 0.44+ 0.53* – – 0.74** 0.80** Editing 0.16 0.19 –0.52 –0.21 0.80** 0.64* QUAID Rating 0.28 0.17 –0.83* –0.62 0.80** 0.52+
NPSAS = National Postsecondary Student Aid Study; WDS = Wisconsin Divorce Study. – indicates there was no variation in the expert reviews for these questions. n = 6 WDS questions and n = 10 NPSAS questions are examined. *** p < .001** p < .01* p < .05+ p < .10
An exAminAtiOn Of Quest iOnnAire evAluAtiOn by expert reviewers 309
WDS. In the NPSAS, with primarily financial and academic performance questions, the largest positive Spearman rank-order correlations are with mean ratings of editing (Spearman’s rho = .80, p < .01, item nonresponse) and judgment (Spearman’s rho = .80, p < .01, inaccuracy rates). In addi-tion, questions rated by the experts as being more burdensome or sen-sitive, or posing retrieval problems have higher item nonresponse rates and inaccuracy rates (rho > .5, p at least <.10). This finding is consistent with the prediction that questions identified as problematic by experts have higher levels of measurement error.
In the WDS, questions identified as problematic by QUAID are those with lower item nonresponse rates (rho = –.83, p < .05), and a negative, but not significant correlation is observed with inaccuracy rates (rho = –.62, n.s.). This is counter to the hypothesis that the QUAID tool identifies problems with questions that lead to higher levels of measurement error. In contrast to the WDS questions, the ratings from the QUAID tool were significantly associated with item nonresponse and inaccuracy levels on questions in the NPSAS (item nonresponse rho = .80, p < .01; inaccuracy rho = .52, p < .10).
In both surveys, questions rated by the experts as being more likely to have comprehension difficulties have lower item nonresponse rates and lower inaccuracy rates, although the association is not significant in ei-ther survey. Given that all of the judgment ratings in the WDS were zero, no correlation can be calculated between judgment and either data qual-ity indicator. In the WDS, the relationship between ratings of editing and the data quality indicators are negative, whereas the relationship is posi-tive in the NPSAS.
Relationship between Individual Expert Ratings and Data Quality
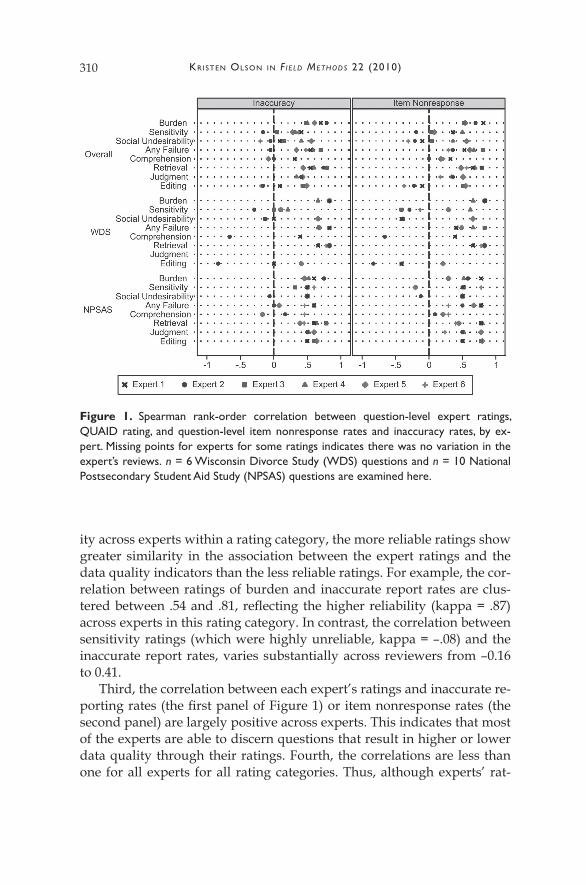
For the rating categories with low reliability, I expect substantial vari-ation across experts in the relationship between the ratings of problems and the data quality indicators. I expect more consistent associations be-tween the ratings and data quality indicators for rating categories with higher reliability. Figure 1 plots the correlations for each expert’s ratings with the question-level inaccuracy rates and item nonresponse rates.
Many observations can be made about Figure 1. First, as expected, within any given rating category, there is variation across experts in the association between the rating and the data quality outcome. The catego-ries that have lower reliability across experts also have greater variation across experts in the association between each expert’s ratings and inac-curacy or item nonresponse rates. Second, although there is heterogene-
Kristen OlsOn in F ield Methods 22 (2010)310
ity across experts within a rating category, the more reliable ratings show greater similarity in the association between the expert ratings and the data quality indicators than the less reliable ratings. For example, the cor-relation between ratings of burden and inaccurate report rates are clus-tered between .54 and .81, reflecting the higher reliability (kappa = .87) across experts in this rating category. In contrast, the correlation between sensitivity ratings (which were highly unreliable, kappa = –.08) and the inaccurate report rates, varies substantially across reviewers from –0.16 to 0.41.
Third, the correlation between each expert’s ratings and inaccurate re-porting rates (the first panel of Figure 1) or item nonresponse rates (the second panel) are largely positive across experts. This indicates that most of the experts are able to discern questions that result in higher or lower data quality through their ratings. Fourth, the correlations are less than one for all experts for all rating categories. Thus, although experts’ rat-
Figure 1. Spearman rank-order correlation between question-level expert ratings, QUAID rating, and question-level item nonresponse rates and inaccuracy rates, by ex-pert. Missing points for experts for some ratings indicates there was no variation in the expert’s reviews. n = 6 Wisconsin Divorce Study (WDS) questions and n = 10 National Postsecondary Student Aid Study (NPSAS) questions are examined here.
An exAminAtiOn Of Quest iOnnAire evAluAtiOn by expert reviewers 311
ings discriminate questions that result in better or worse data quality, they are not able to do so perfectly. Given the small number of ques-tions, most of the associations do not meet traditional levels of statistical significance.
Fifth, there is greater consistency across experts in the association be-tween the ratings and data quality problems in the NPSAS than in the WDS. Expert 2 is noticeably different in his or her associations between social undesirability and comprehension problem ratings and data qual-ity in the NPSAS than the rest of the experts. For example, the Spearman rank-order correlation for social undesirability ratings with inaccuracy of reports is –.06 for expert 2 and .50 for four of the remaining five experts (the final expert did not have variation in ratings of this category). As dis-cussed above, social undesirability ratings were those that were the most affected by dropping expert 2 from the overall mean expert ratings.
Discussion
In this article, I examine whether evaluations of a questionnaire by expert reviewers are consistent across experts and find large inconsis-tencies. Although the experts here were selected as similar in method-ological background and training, both the ratings themselves and the association between the ratings and data quality varied across experts. Unlike some previous research on this topic, this examination does not confound differences in experts with differences in organizations; even with this additional control, variation is found in the problems identified by each expert. This variation across reviewers may be exacerbated if re-viewers with more disparate backgrounds are used. This suggests that organizations should ask multiple experts to review a questionnaire in pretests or post-survey evaluations. What characteristics of experts con-tribute to consistency or discrepancy in ratings needs further research. One potential uncontrolled source of variation is the effort put into the rating task. Although the task itself was standardized across the experts, designed to minimize variation in problem identification, the effort put into the task may not have been identical. Additionally, each expert may have had a different measurement error outcome (e.g., item nonresponse and report inaccuracy) in mind when doing this task. This study did not collect information about the time each expert spent conducting the re-view, attention to the task, whether the reviewer thought about the risk of a particular type of measurement error, or knowledge of the subject matter of the questionnaires, all factors that may contribute to variation in the quality and reliability of expert reviews.
Kristen OlsOn in F ield Methods 22 (2010)312
Despite the lack of reliability across ratings, the average expert ratings successfully identify questions that are more likely to have higher levels of item nonresponse or inaccurate reporting, although success in this task varies across the surveys and across the six experts. In general, the aggre-gate ratings best predict item nonresponse and inaccuracy in the NPSAS. This difference across surveys is likely due to small numbers of items to evaluate in the WDS. The computerized QUAID tool does not fare any better than the human experts, and in the WDS, identifies greater num-bers of problems with questions that actually yielded better data qual-ity. The QUAID computerized tool identified problems at a fairly discrete level, consistent with many categories used in the Questionnaire Ap-praisal System, a standardized questionnaire evaluation tool sometimes used by human evaluators (Willis and Lessler 1999). Despite the degree of specificity in the QUAID ratings, the broad ratings by the experts did just as well or better than the specific ratings by QUAID.
Contrary to hypotheses, no relationship was seen between compre-hension ratings and the data quality indicators. Many question evalua-tion methods focus on potential problems with comprehension (Presser and Blair 1994; DeMaio and Landreth 2003). One possible explanation is that the unreliability in the experts’ judgment of potential comprehension problems attenuated any potential association with the data quality indi-cators (Fuller 1987). Alternatively, comprehension problems could mani-fest in data quality issues only when the mapping between the construct in the questionnaire and the respondent’s experience is complicated (Conrad and Schober 2000). It is possible that there were few questions that presented such complicated mappings or that few respondents who experienced problems mapping their retrieved answers to the question. Finally, these questionnaires underwent evaluation and review prior to the start of data collection. It is possible that many comprehension prob-lems were identified during this stage.
The analysis here focused on expert identification of potential prob-lems with factual questions. Because a goal of this article is to examine whether questions identified as potentially posing problems for respon-dents actually manifest in higher levels of measurement error in respon-dent reports, this limitation is necessary. Although other items were asked and rated in each survey, these additional questions also were pri-marily factual given the nature of the surveys. Additional research is needed to examine cross-expert variability in identifying potential prob-lems with attitudinal questions and whether those problems manifest in measurement errors.
Furthermore, when used for pretesting, experts sometimes are asked to suggest changes to question wording in addition to identifying prob-
An exAminAtiOn Of Quest iOnnAire evAluAtiOn by expert reviewers 313
lems. Data collection for each survey had been completed at the time of this research, so the experts were asked only to identify problems, not to suggest question wording changes. Although the experts could make more detailed comments on each question in this review, these comments were not consistently made across questions or across experts. As such, whether different experts from the same organization make the same rec-ommendations for changes to question wording is still an open question.
Few studies are able to afford extensive pretests of a survey instru-ment and rely on experts to identify potential problems. This article in-dicates that not only do expert reviews identify question problems, but that these problems are related to meaningful data quality issues. Sur-vey practitioners are advised, from this research, to use multiple experts to review questionnaires. Experts are not a uniform group, and this vari-ation should be anticipated when pretesting or reviewing questionnaires. Additionally, questions identified as potentially posing difficult retrieval problems or being burdensome (categories in most evaluation schemes) should receive special attention for potential revision. In particular, these questions, such as those about finances, may pose difficult response tasks that require forms of assistance (e.g., encouraging use of records, brack-eted responses, and decomposition) other than question rewording to improve data quality. The experts here were most reliable in identify-ing these problems; these problems, in turn, were most likely to gener-ate data quality issues such as item nonresponse and inaccurate reports.
Appendix
Instructions to Experts
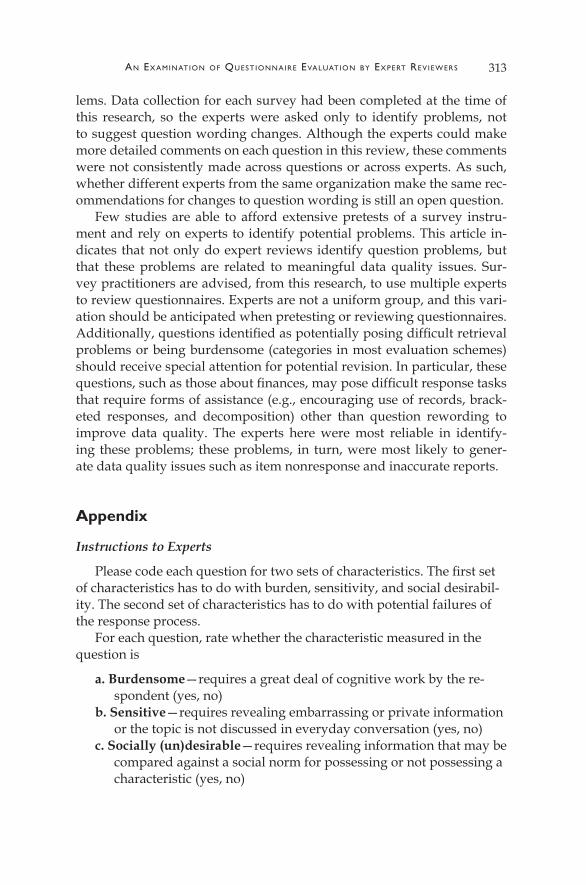
Please code each question for two sets of characteristics. The first set of characteristics has to do with burden, sensitivity, and social desirabil-ity. The second set of characteristics has to do with potential failures of the response process.
For each question, rate whether the characteristic measured in the question is
a. Burdensome—requires a great deal of cognitive work by the re-spondent (yes, no)
b. Sensitive—requires revealing embarrassing or private information or the topic is not discussed in everyday conversation (yes, no)
c. Socially (un)desirable—requires revealing information that may be compared against a social norm for possessing or not possessing a characteristic (yes, no)
Kristen OlsOn in F ield Methods 22 (2010)314
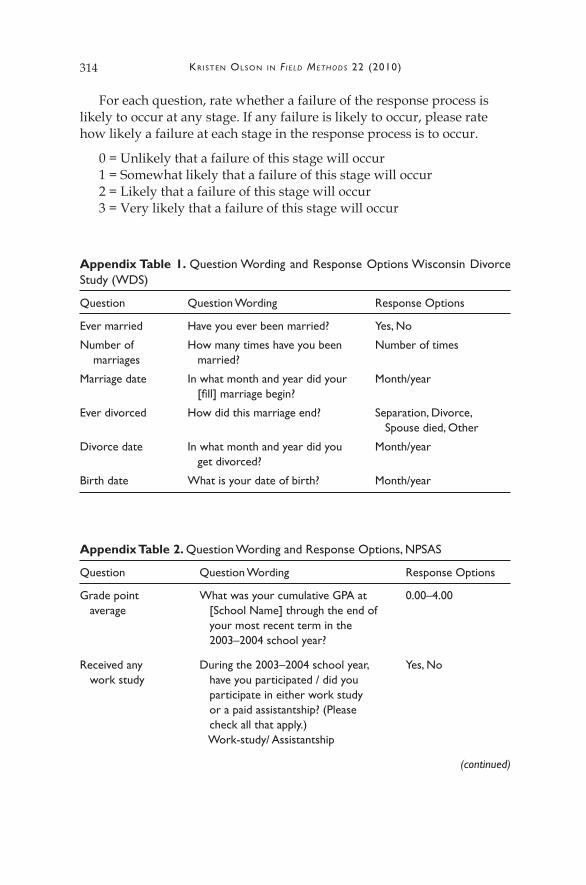
For each question, rate whether a failure of the response process is likely to occur at any stage. If any failure is likely to occur, please rate how likely a failure at each stage in the response process is to occur.
0 = Unlikely that a failure of this stage will occur 1 = Somewhat likely that a failure of this stage will occur 2 = Likely that a failure of this stage will occur 3 = Very likely that a failure of this stage will occur
Appendix Table 1. Question Wording and Response Options Wisconsin Divorce Study (WDS)
Question Question Wording Response Options
Ever married Have you ever been married? Yes, No
Number of How many times have you been Number of times marriages married?
Marriage date In what month and year did your Month/year [fill] marriage begin?
Ever divorced How did this marriage end? Separation, Divorce, Spouse died, Other
Divorce date In what month and year did you Month/year get divorced?
Birth date What is your date of birth? Month/year
Appendix Table 2. Question Wording and Response Options, NPSAS
Question Question Wording Response Options
Grade point What was your cumulative GPA at 0.00–4.00 average [School Name] through the end of your most recent term in the 2003–2004 school year?
Received any During the 2003–2004 school year, Yes, No work study have you participated / did you participate in either work study or a paid assistantship? (Please check all that apply.) Work-study/ Assistantship
(continued)
An exAminAtiOn Of Quest iOnnAire evAluAtiOn by expert reviewers 315
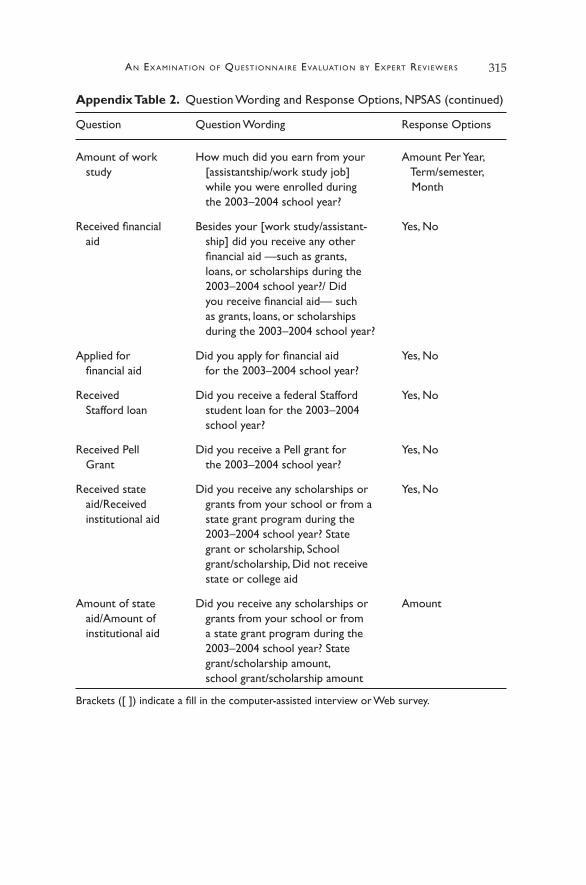
Appendix Table 2. Question Wording and Response Options, NPSAS (continued)
Question Question Wording Response Options
Amount of work How much did you earn from your Amount Per Year, study [assistantship/work study job] Term/semester, while you were enrolled during Month the 2003–2004 school year?
Received financial Besides your [work study/assistant- Yes, No aid ship] did you receive any other financial aid —such as grants, loans, or scholarships during the 2003–2004 school year?/ Did you receive financial aid— such as grants, loans, or scholarships during the 2003–2004 school year?
Applied for Did you apply for financial aid Yes, No financial aid for the 2003–2004 school year?
Received Did you receive a federal Stafford Yes, No Stafford loan student loan for the 2003–2004 school year?
Received Pell Did you receive a Pell grant for Yes, No Grant the 2003–2004 school year?
Received state Did you receive any scholarships or Yes, No aid/Received grants from your school or from a institutional aid state grant program during the 2003–2004 school year? State grant or scholarship, School grant/scholarship, Did not receive state or college aid
Amount of state Did you receive any scholarships or Amount aid/Amount of grants from your school or from institutional aid a state grant program during the 2003–2004 school year? State grant/scholarship amount, school grant/scholarship amount
Brackets ([ ]) indicate a fill in the computer-assisted interview or Web survey.
Kristen OlsOn in F ield Methods 22 (2010)316
Acknowledgments
The material for this article is based on work supported by a National Science Foundation grant (SES-0620228). The Wisconsin Divorce Study was funded by a grant (HD- 31035 & HD32180-03) from the National Institute of Child Health and Human Development, National Institutes of Health (PIs: Vaughn Call and Larry Bumpass). The author would like to thank the experts who contributed their time and effort to this study and NCES and RTI international for providing access to the NPSAS. The author would also like to thank Bob Groves and Norman Brad-burn for feedback on the study design and Rachel Levenstein, Bob Belli, and three anonymous reviewers for comments on earlier drafts.
References
American Association for Public Opinion Research. 2006. Standard definitions: Fi-nal dispositions of case codes and outcome rates for surveys (4th ed.). Lenexa, KS: The American Association for Public Opinion Research.
Banerjee, M., M. Capozzoli, L. McSweeney, and D. Sinha. 1999. Beyond kappa: A review of interrater agreement measures. The Canadian Journal of Statistics 27:3–23.
Cannell, C. F., P. V. Miller, and L. Oksenberg. 1981. Research on interviewing techniques. Sociological Methodology 12:389–437.
Cominole, M., P. Siegel, K. Dudley, D. Roe, T. Gilligan, and J. Griffith. 2006. 2004 National Postsecondary Student Aid Study (NPSAS:04) full scale methodology re-port. Washington, DC: U.S. Department of Education, National Center for Ed-ucation Statistics.
Conrad, F. G., and M. F. Schober. 2000. Clarifying question meaning in a house-hold telephone survey. Public Opinion Quarterly 64:1–28.
DeMaio, T. J., and A. Landreth. 2003. Examining expert reviews as a pretest method. In ZUMA-Nachrichten Spezial Band 9, questionnaire evaluation standards, ed. P. Prüfer, M. Rexroth, J. Fowler, and F. Jackson, 60–73. Mannheim, Ger-many: ZUMA.
Esposito, J. L., and J. Rothgeb. 1997. Evaluating survey data: Making the tran-sition from pretesting to quality assessment. In Survey measurement and pro-cess quality, ed. L. Lyberg, P. Biemer, M. Collins, E. De Leeuw, C. Dippo, N. Schwarz, and D. Trewin, 541–71. New York: John Wiley and Sons.
Forsyth, B., J. M. Rothgeb, and G. B. Willis. 2004. Does pretesting make a differ-ence? An experimental test. In Methods for testing and evaluating survey ques-tionnaires, ed. S. Presser, J. M. Rothgeb, M. P. Couper, J. T. Lessler, E. Martin, J. Martin, and E. Singer, 525–46. New York: John Wiley and Sons.
Fuller, W. 1987. Measurement error models. New York: John Wiley and Sons. Graesser, A. C., Z. Cai, M. M. Louwerse, and F. Daniel. 2006. Question Under-
An exAminAtiOn Of Quest iOnnAire evAluAtiOn by expert reviewers 317
standing Aid (QUAID): A web facility that helps survey methodologists im-prove the comprehensibility of questions. Public Opinion Quarterly 70:1–20.
Holbrook, A. L., J. A. Krosnick, D. Moore, and R. Tourangeau. 2007. Re-sponse order effects in dichotomous categorical questions presented orally: The impact of question and respondent attributes. Public Opinion Quarterly 71:325–48.
Jansen, H., and T. Hak. 2005. The productivity of the Three-Step Test-Interview (TSTI) compared to an expert review of a self-administered questionnaire on alcohol consumption. Journal of Official Statistics 21:103–20.
Kalton, G., and R. Stowell. 1979. A study of coder variability. Applied Statistics 28:276–89.
Lahey, M. A., R. G. Downey, and F. E. Saal. 1983. Intraclass correlations: There’s more there than meets the eye. Psychological Bulletin 93:586–95.
Mangione, T. W., F. J. Fowler Jr., and T. A. Louis. 1992. Question characteristics and interviewer effects. Journal of Official Statistics 8:293–307.
Presser, S., and J. Blair. 1994. Survey pretesting: Do different methods produce different results? Sociological Methodology 24:73-104).
Ramirez, C. 2002. Strategies for subject matter expert review in questionnaire de-sign. Paper presented at the Questionnaire Design, Evaluation, and Testing Conference, Charleston, SC. http://www.jpsm.umd.edu/qdet/final_pdf_pa-pers/ramirez.pdf (accessed February 18, 2006).
Rothgeb, J., G. Willis, and B. Forsyth. 2001. Questionnaire pretesting methods: Do different techniques and different organizations produce similar results? Pa-per presented at the annual meeting of the American Association for Public Opinion Research, Montreal, Canada. Proceedings of survey research meth-ods section of the American Statistical Association. Washington, DC: Ameri-can Statistical Association.
Schaeffer, N. C., and J. Dykema. 2004. A multiple-method approach to improving the clarity of closely related concepts: Distinguishing legal and physical cus-tody of children. In Methods for testing and evaluating survey questionnaires, ed. S. Presser, J. M. Rothgeb, M. P. Couper, J. T. Lessler, E. Martin, J. Martin, and E. Singer, 475–502. New York: John Wiley and Sons.
Schnell, R., and F. Kreuter. 2005. Separating interviewer and sampling-point ef-fects. Journal of Official Statistics 21:389–410.
Schrout, P. E., and J. L. Fleiss. 1979. Intraclass correlations: Uses in assessing rater reliability. Psychological Bulletin 86:420–28.
Theis, B., J. Frood, D. Nishri, and L. D. Marrett. 2002. Evaluation of a risk factor survey with three assessment methods. Chronic Diseases in Canada 23:1–12.
Tourangeau, R. 1984. Cognitive sciences and survey methods. In Cognitive aspects of survey methodology: Building a bridge between disciplines, ed. T. B. Jabine, M. L. Straf, J. M. Tanur, and R. Tourangeau, 73–100. Washington, DC: National Academies Press.

Kristen OlsOn in F ield Methods 22 (2010)318
Tourangeau, R. 2004. Experimental design considerations for testing and evalu-ating questionnaires. In Methods for testing and evaluating survey questionnaires, ed. S. Presser, J. M. Rothgeb, M. P. Couper, J. T. Lessler, E. Martin, J. Martin, and E. Singer, 209–24. New York: John Wiley and Sons.
Tourangeau, R., L. J. Rips, and K. A. Rasinski. 2000. The psychology of survey re-sponse. Cambridge: Cambridge University Press.
Willis, G., and J. T. Lessler. 1999. Question Appraisal System QAS-99. Rockville, MD: Research Triangle Institute.
Willis, G. B., S. Schechter, and K. Whitaker. 1999. A comparison of cognitive inter-viewing, expert review, and behavior coding: What do they tell us? Paper pre-sented at the Joint Statistical Meetings, Baltimore, MD. Proceedings of Survey Research Methods Section of the American Statistical Association (28-37). Washing-ton, DC: American Statistical Association.
Related Documents