An Ex Ante Analysis of the Benefits from the Adoption of Corn Rootworm Resistant, Transgenic Corn Technology Alston, Julian M. Hyde, Jeffrey Marra, Michele C. Mitchell, Paul D. Contributed Paper presented to the 47 th Annual Conference Of the Australian Agricultural and Resource Economics Society At Fremantle, February 12-14, 2003

Welcome message from author
This document is posted to help you gain knowledge. Please leave a comment to let me know what you think about it! Share it to your friends and learn new things together.
Transcript
An Ex Ante Analysis of the Benefits from the Adoption of Corn Rootworm Resistant,
Transgenic Corn Technology
Alston, Julian M. Hyde, Jeffrey
Marra, Michele C. Mitchell, Paul D.
Contributed Paper presented to the 47th Annual Conference
Of the Australian Agricultural and Resource Economics Society
At
Fremantle,
February 12-14, 2003

An Ex Ante Analysis of the Benefits from the Adoption of Corn Rootworm
Resistant, Transgenic Corn Technology
Julian M. Alston, Jeffrey Hyde, Michele C. Marra, and Paul D. Mitchell
Julian Alston is a Professor in the Department of Agricultural and Resource Economics and member of the Giannini Foundation of Agricultural Economics, University of California, Davis, CA; Jeff Hyde is an Assistant Professor of Agricultural Economics, The Pennsylvania State University, University Park, PA; Michele Marra is a Professor of Agricultural and Resource Economics, North Carolina State University, Raleigh, NC; Paul Mitchell is an Assistant Professor of Agricultural Economics, Texas A&M University, College Station, TX. Authors are listed alphabetically; senior authorship is not assigned. The authors thank John Anderson, Jay Pershing, and John Mattingly, all of Monsanto Inc., who gave data and advice. The authors gratefully acknowledge the financial support from the NSF Center for Integrated Pest Management made possible through a contribution by Monsanto Inc.

An Ex Ante Analysis of the Benefits from the Adoption of Corn Rootworm Resistant, Transgenic Corn Technology
ABSTRACT. This study examined the potential economic impacts in the United States of the commercial adoption of a corn rootworm (CRW) resistant transgenic corn. Using a counterfactual approach, we estimated that if the technology had been made available in the year 2000 at a price that would equate per acre costs to those for insecticide-based corn rootworm control, and adopted on all of the acres treated for corn rootworm in that year, the total benefits would have been $460 million. This benefit includes $171 million to the technology developer and seed companies, $231 million to farmers from yield gains, and a further $58 million to farmers from reduced risk, time savings, and other non-pecuniary benefits associated with reduced use of insecticides. This is a one-year benefit with 100 percent adoption. Our nation-wide survey of corn producers suggests that initial adoption might be as low as 30 percent, which means that the first-year benefits might be only one-third of the value implied by 100 percent adoption. Different pricing assumptions would mostly change the distribution of the benefits between farmers and others, so long as the pricing did not influence the adoption rate as well. Benefits over time would reflect changing adoption patterns and evolving insect resistance. Further analysis could include the effects of any refuge requirements implemented to slow the development of resistance, when such requirements are known.

1
1. Introduction
Transgenic technologies are changing the face of agricultural production. The innovation
process that began to take commercial effect less than ten years ago has already had major
impacts, and the significance and value of those past impacts has been evaluated in a rapidly
growing number of economic evaluation studies (e.g., see Marra, Pardey, and Alston for a
review of the work on farm-level impacts). The past evaluation studies have included both ex
ante and ex post evaluations of both farm-level and aggregative impacts. In all such work,
issues arise about the methods and data used, and their implications for the analysis. In this
paper we report the results of an ex ante analysis of an important new transgenic corn
technology. It is described in our survey work as a generic transgenic corn developed to be
resistant to the corn rootworm, planted with a seed treatment to control additional corn insect
pests, or “CRW resistant transgenic corn.” 1
The purpose of this study was to estimate the likely economic impacts in the United
States of the commercial adoption of this technology. The study involved evaluating the
farm-level economic impacts of the adoption of CRW-resistant corn varieties and translating
those farm-level impacts into an estimate of the economy-wide impacts. In conducting this
analysis we used information from an extensive data base on the actual incidence of the
problems across agroecological environments, combined with experimental data on the
consequences of the alternative treatments for corn rootworm (various pesticides and CRW-
resistant transgenic corn technology) under different levels of corn rootworm infestation, in
addition to a computer-assisted telephone survey of 601 corn farmers.
1 The first introduction of CRW resistant transgenic corn, which is designated as Yieldgard Rootworm, was developed by Monsanto and is currently in the approval process.

2
The scope of a study of this type could be very broad. Adoption responses are central
to the analysis of new technologies. These responses are driven primarily by relative
profitability, which, in the case of seed technologies such as CRW-resistant transgenic corn,
depends on the price of the new seed, its performance, and on the availability, nature, and
relative price of close substitutes, including other CRW-resistant corn technologies, or
conventional CRW control technologies. As well as determining adoption, the availability
and relative price of the various alternatives are critical determinants of the benefits from any
particular technological package at the level of both the individual farm and the nation. To
make the problem manageable, we adopted a counterfactual approach, in which we compared
hypothetical (counterfactual) alternatives against the actual past outcomes, under a set of
assumptions that would imply a specific pattern of adoption. Specifically, we set out to
estimate what would have been the impacts in a specific recent past year—i.e., 2000—if
CRW-resistant transgenic corn technology had been available, was priced such that the
variable cost per acre would be the same as for a representative conventional (non-transgenic)
CRW control technology, and was the only transgenic CRW control technology available.
The remainder of this paper is structured as follows. In section 2 we begin with a brief
discussion of the nature of the economic problem caused by corn rootworm, including
relevant information about the biology of the pest, its prevalence, the extent of the economic
damage it causes (including both control costs and crop losses), and its implications for
production practices (including rotations and the use of insecticides, and some of the burdens
these impose on farmers and their neighbors). Key simplifying assumptions used in the
analysis are set forth in section 3. Section 4 lays out an approach to understanding and
quantifying the economic determinants of the likely future patterns of adoption of the new

3
transgenic CRW technology, and for translating those patterns into estimates of farm-level
and national benefits. Section 5 presents the actual methodology used in this study and the
quantitative results on farm-level benefits. Along with best-bet estimates, we provide some
simple sensitivity analysis to show how the benefits from adoption depend on key variables in
the analysis. The measures of benefits in section 5 include only the pecuniary benefits
associated with improvements in farm productivity. They do not include some non-pecuniary
benefits perceived by farmers, associated with the use of non-chemical technologies.
Measures of these non-pecuniary benefits, based on a survey of corn growers, are presented in
section 6. Section 7 summarizes results and concludes the paper.
2. Nature and Economic Importance of Corn Rootworm
Corn rootworm (Diabrotica spp.) causes extensive economic damage to corn in the United
States. Populations of the western corn rootworm (D. virgifera virgifera Le Conte) and the
northern corn rootworm (D. barberi Smith and Lawrence) together are estimated to result in
annual yield losses and control costs that exceed $1 billion (Metcalf). The larvae hatch in the
spring and feed on corn roots for several weeks. The damage to the roots can result in stunted
growth of the corn plant, lodging, and eventual yield losses. Adults emerge from the soil in
the summer and female adult corn rootworms lay their eggs to overwinter in the soil. Dense
populations of feeding adults can cause some yield loss but most of the damage is caused by
the root feeding of the larval stages (Wright, Meinke and Jarvi).
In general, corn rootworms cannot complete their life cycle without the food supplied
by corn plants. Therefore, until recently they caused damage almost exclusively in fields
where corn is grown at least two years in a row. A crop rotation with one year of corn has

4
been an effective control strategy. Lately, however, two variants of corn rootworm have
developed. The soybean variant (SBV) of the western corn rootworm has adapted its egg-
laying behavior to lay eggs in crops other than corn (Levine and Oloumi-Sadeghi). So, in
areas where corn/soybean rotations are common, eggs laid in soybean fields will hatch in corn
fields in the following spring. It evolved in eastern Illinois and has since spread into Indiana,
Michigan and Ohio (Onstad et al.). The extended diapause variant (EDV) of the northern
corn rootworm has adapted to two-year corn rotations as well (Krysan, Jackson, and Lew).
While most corn rootworm eggs hatch in the following spring, for the EDV, some of the eggs
hatch after two winters and, thus, the larval stages are able to feed on corn roots even in
rotated corn. The EDV is most prevalent in eastern South Dakota, northeastern Nebraska,
northwestern Iowa, and southeastern Minnesota.
We identified a total of 11 distinct corn production regions (or sub-regions) in the
United States, which we treat as separate agroecologies for the purposes of this analysis. The
regions are roughly equivalent to the nine Farm Resource Regions as recently defined by the
Economic Research Service of USDA (Heartland, Northern Crescent, Northern Great Plains,
Prairie Gateway, Eastern Uplands, Southern Seaboard, Fruitful Rim, Basin and Range, and
Mississippi Portal) plus two additional sub-regions within the Heartland where the two corn
rootworm variants, the extended diapause variant (the EDV region) and the soybean variant
(the SBV region), are currently found. Table 1 presents an overview of corn production in the
11 regions as defined in this study. Within all of the regions corn is grown either
continuously or as an element of a crop rotation plan. In many regions corn rootworm is a
significant problem only in continuous corn. In the Heartland region, in particular, however,
corn rootworm damage can be a significant problem both in first-year corn (corn grown where

5
a different crop was grown in the previous year) and in continuous corn (corn grown where
corn was grown in the previous year). These observations are reflected in the figures for the
percentages of continuous and first-year corn acreage treated for corn rootworm (table 1), and
the treated acres of continuous and first-year corn (table 2).2
[Table 1: Corn Acreages and Shares Treated for CRW, by Region in 2000]
[Table 2: Treated Acres,…Insecticides, and Average Cost per Acre, by Region] Control methods available currently to deal with the corn rootworm problem include
(a) crop rotation (in all but the EDV and SBV regions), (b) soil-applied insecticides to control
corn rootworm larvae, and (c) insecticide sprays to control corn rootworm adult beetles. The
opportunity cost of rotation is assumed to be positive in many areas, given the large acreage
of continuous corn each year. Table 2 presents an overview of conventional corn rootworm
insecticide use by region in crop year 2000. The cost of soil-applied insecticides averaged
about $12.43 per acre in material and application costs across the United States, but varied
slightly among regions.3 Spraying for adult beetles is not as prevalent as soil-applied larval
control (USDA-NASS). Total expenditure for corn rootworm-targeted insecticides topped
$171 million in the 2000 crop year (Doane’s Market Research).
3. Key Assumptions
As noted above, we assume that the seed price premium is set so that the variable cost per
acre for the new technology equals that of the next-best alternative technology. We also
2 Multiplying the total acreage by the percentage treated for corn rootworm in table 1 yields the number of acres treated. In the figures for “ treated acres” in table 2 some acres are counted more than once, reflecting the fact that some acres were treated more than once. 3 The figures for CRW insecticide cost per acre in table 2 were from Doane’s Market Research (2000). They refer specifically to the cost of materials, but they are regarded as providing a reasonable measure of total insecticide costs including costs of both materials and application, since the insecticides were applied at planting.

6
assume there is no price premium or discount for the transgenic over conventional corn and
that the transgenic corn yields at least as well as the conventional alternative. These two
assumptions combined mean that CRW-resistant transgenic corn would have been at least as
profitable, per acre, as the conventional alternative. Some other factors, both pecuniary and
non-pecuniary in nature, also affect the grower’s decision to adopt the technology.
The CRW-resistant transgenic corn technology is expected to provide a yield gain
relative to conventional control, since its effectiveness does not depend on timing, weather,
calibration of application equipment, or soil condition. This yield gain is estimated to range
between 0 and 7 percent, depending on the insect pressure (Mitchell). In addition, the CRW-
resistant transgenic corn technology will be safer and more convenient for operators and farm
workers to handle relative to conventional chemical treatments, and it also may yield some
savings in planting time.4
Along with the other features of the technology, our pricing assumptions imply that
profit-maximizing producers would have adopted CRW-resistant transgenic corn on all of the
acres that were treated for corn rootworm in that year. They also imply that the benefits from
any resulting yield gains (and other on-farm benefits) would have been captured entirely by
farmers.5 The actual distribution of the benefits from this new technology among farmers,
consumers of corn, and suppliers of CRW control technologies (including seed, agricultural
4 Without the insecticide application equipment attached to the planter, larger seed hoppers can be installed, saving refilling time, and farmers may also save time spent on calibration and safety precautions. Some debate about this point exists, but farmers in our survey indicated they would be willing to pay a small amount for such savings in time and related variable costs. 5 The technology supplier might be able to charge a slightly higher premium, but this would be constrained by competition from suppliers of conventional and transgenic alternatives. Moreover, the firms supplying the next-best alternative technology might be expected to drop their price in response to such competition, such that farmer benefits were even greater. Hence, this particular pricing assumption is less extreme than it might appear at first blush.

7
chemical, and biotechnology companies) will depend on the nature of competition and the
underlying market supply and demand conditions, which will govern the pricing and adoption
of the technological alternatives. The main implication of the pricing of the technology is for
the distribution of the benefits rather than for the total benefits, and the pricing assumption we
have adopted is both plausible and useful for obtaining a measure of farmer benefits that is a
reasonable proxy for “ total” benefits.6 Making assumptions about the pricing structure is
unavoidable. Our particular assumptions allowed us to take greatest advantage of our detailed
data on the spatial incidence of corn rootworm problems, and on the adoption of alternative
pesticide treatments, across different agroecological environments.
Another complicating factor is insect resistance management (IRM). Because any
requirements for an IRM program, such as refuge requirements, had not been defined at the
time when this analysis was done, we did not allow for the implementation of an IRM
program. An IRM program would involve both direct costs and indirect costs and thus would
reduce the net benefits in any year. On the other hand, the purpose of any IRM program is to
preserve the benefits from the new technology over a longer time period. An effective IRM
program imposes costs in the short run in order to generate benefits in the longer run that are
worth more than the short-run costs. If we were to consider the short-run costs, we ought also
to take into account the long-run benefits, and to do this would require a full dynamic analysis
of the impacts of the technology over time, factoring in the role of resistance. In the analysis
below we look at the impacts of adoption of the technology in one year, in a static analysis,
without any consideration of the impacts over time of either increasing pest resistance or of
6 In a companion study we documented the evidence in the literature on the farm-level benefits from the adoption of transgenic crop technologies (e.g., Marra; Marra, Pardey, and Alston). That companion study provides a set of benchmarks for the consideration of the results of the work undertaken here, as well as guidance to related literature and methodological approaches.

8
IRM programs that might be introduced to reduce the losses resulting from resistance build-
up. Until IRM plan elements are delineated, it is difficult to estimate the financial impact of
IRM on growers in the static analysis. Even with knowledge of the plan elements, the full
dynamic analysis would remain difficult.7
Our analysis also does not allow for responses by suppliers of competing technologies.
A profitable innovation provides impetus for both the current supplier and other companies to
continue the development of competing technologies. Several players currently involved in
this industry are devoting resources toward developing improved transgenic technologies in
corn and in many other crops. Progress is sure to continue at a rapid pace. At the same time,
companies selling conventional control products will respond to their loss of market share by
lowering their products’ prices or offering non-price incentives. We observed this response
with the previous transgenic introductions. These competitive responses will benefit all corn
growers and, in some instances where products are labeled for other crops, other farmers, as
well. It is difficult to predict, given these market forces, precisely how the total benefits from
the CRW-resistant transgenic corn technology will change over time.
4. Evaluation Concepts
A key element in the evaluation of the benefits from the adoption of a particular varietal
technology, such as the CRW-resistant varieties of corn, is to estimate the adoption pattern—
the numbers of acres (or percentages of total corn acres) annually planted to CRW-resistant
transgenic corn for each of a range of different agroecologies.
7 Recent articles that have examined elements of the economics of refuge requirements for transgenic crops include Hurley, Babcock, and Hellmich; Hurley, Secchi, Babcock, and Hellmich; Laxminarayan and Simpson; Marra, Hubbell, and Carlson; and Livingston, Carlson, and Fackler.

9
In each relevant agroecology, the projected adoption paths can be defined as a
function of estimates of the expected agroecology-specific yields and costs (and hence
profitability) of growing CRW-resistant transgenic corn relative to the next-best alternative
corn variety. We assume that all of the farmers in agroecology i will adopt CRW-resistant
transgenic corn in year t if it is expected to be more profitable than the next-best alternative
technology (with suitable allowance for a risk premium and for other differences including
non-pecuniary aspects), which includes the option of not applying any treatment for CRW
control. Algebraically, we can represent this behavior as:
(1) SVCPYYP c
ca ittitititititit
itit
ititit ))(1( where
if 0
if 1∆−∆−∆−∆−=
���
���
<≥
= ρπππ
where, in agroecology i in year t,
• ait is a dichotomous indicator variable that is equal to 1 if farmers in agroecology i adopt
CRW-resistant transgenic corn in year t;
• cit is the fixed cost per acre associated with CRW-resistant transgenic corn technology;8
• πit is the total difference in variable profit in dollars per acre between CRW-resistant
transgenic corn technology and the next-best alternative corn technology;
• ρit the fraction of CRW-resistant transgenic corn acreage that must be planted to the next-
best alternative (i.e., non-transgenic corn or other crops) to provide a refuge for non-
resistant corn rootworm;
8 This could entail fixed benefits from enhancements to farmer and farm-worker safety associated with the use of the technology as well as costs of risk or information costs associated with learning about the new technology (which could decline with experience with the CRW-resistant transgenic corn technology, giving rise to progressive adoption at the level of the agroecology). In the case of CRW-resistant transgenic corn the costs of risk are expected to be close to zero, since the estimated distribution of yield benefits has more probability mass associated only with benefits higher than the conventional CRW technology. Therefore, even though the variance of benefits is higher, it is higher only because there is a higher probability of superior outcomes relative to the conventional CRW technology.

10
• Pit is the price per bushel of corn in year t, and ∆Pit is the price discount per bushel for
corn grown using CRW-resistant transgenic corn technology, compared with conventional
(non-transgenic) corn;
• Yit is the average yield, and ∆Yit is the difference in yield in bushels per acre between
CRW-resistant transgenic corn technology and the next-best alternative corn technology;
• ∆VCit is the difference in variable cost of production, in dollars per acre, between CRW-
resistant transgenic corn technology and the next-best alternative corn technology;
• ∆Sit is the difference in seed price per acre between CRW-resistant transgenic corn
technology and the next-best alternative.
Total benefits are given by combining information on the per acre benefits from
adoption and the implied number of acres on which adoption is profitable. The area planted
to CRW-resistant transgenic corn in agroecology i in year t, Ait, is equal to the value of the
indicator variable (i.e., ait = 1 or 0), multiplied by the total relevant corn acreage in
agroecology i in year t, TAit (corn acreage that was or would be treated for CRW). Thus, Ait =
TAit if ait = 1, and Ait = 0 if ait = 0. The aggregate farmer benefit within agroecology i (FBit) is
equal to the benefit from adoption times the total area of adoption:
(2) itititititit TAaAFB )(⋅== ππ
And, summing these benefits across all agroecologies in the nation, we can obtain a measure
of the national aggregate farmer benefit from adoption in year t (FBt):
(3) �� ==⋅== I
i ititit
I
i itt TAaFBFB11
)(π
The only missing element, for measuring the full net economic impact, is a measure of
the profits of seed companies and technology suppliers, given the pricing strategy that drove
the assumed pattern of adoption. The gross, non-farmer benefit (GNFBt) can be estimated as

11
the seed price premium per acre, ∆Sit, multiplied by the number of relevant acres and added
up across agroecologies. This is a gross rather than net benefit to the extent that, as well as
the costs of license fees and royalties paid by seed companies (a transfer), it might have to
cover additional marketing costs that may be incurred in developing and marketing the new
seed relative to the benchmark alternative.
(4) �� ==⋅∆=∆= I
i ititit
I
i ititt TAaSASGNFB11
)(
Summing the farmer and non-farmer benefits provides a measure of the total, national
benefits from the adoption of the technology (TNBt = FBt + GNFBt), the elements of which
have been derived under an assumption that there are no substantial effects on the total
quantity of corn produced and thus on the price of corn. If the adoption of CRW-resistant
transgenic corn technology led to an increase in the total quantity of corn, and this caused a
significant reduction in price of corn, there would be effects on the welfare of corn consumers
(positive) as well as corn growers (negative effects on adopters and non-adopters alike, if we
assume no segregation costs and no price discounts for transgenic varieties). These
distributional effects would probably not mean a significant change in the overall national
impact, but the distributional story might be of interest nevertheless.9
As noted in the introduction, we adopted a strategy here of using data for a particular
past year, 2000, to evaluate what would have been the benefits if CRW-resistant transgenic
corn technology had been commercially available in that year and was priced such that it
9 This measure does not account for any impacts on the suppliers of agricultural chemicals and others whose business may be reduced as a consequence of farmers shifting to the new technology. If the industries in question could be regarded as competitive and only earning “normal” economic profits, then there would not be any net welfare impacts to consider. On the other hand, if the affected firms had been earning more than “normal” economic profit, such as they would if they were exercising some market power in a patented technology, then they would experience net economic losses as a result of farmers adopting the new technology, which ought to be considered in the estimate of net national benefits. Moschini, Lapan, and Sobolevsky present a model of this kind of situation. We do not have access to any information to begin to estimate such impacts.

12
would have been fully adopted by those farmers who treated their corn crop for CRW.
Having made these assumptions, the adoption outcome was clearly defined: i.e., ait = 1 for
every acre in every agroecology that was treated for CRW in year t, and hence Ait = TAit (i.e.,
it is assumed that every acre treated for CRW would have adopted the new technology). This
measure leaves out those acres that were not treated using conventional CRW-control
technology (because it was not profitable to do so) but would be treated using the new
technology (because it is more profitable than the conventional technology). On the other
hand it includes some conventionally treated acres on which the transgenic alternative might
not be adopted under any circumstances.
To implement this approach and estimate the benefits from having the CRW-resistant
transgenic corn technology available for adoption (and adopted) in the year 2000, as described
above we assumed that the new technology would be priced such that the variable costs of
pest control per acre, including the seed premium in the case of CRW-resistant transgenic
corn technology, would be equal between the new technology and a benchmark technology.
That is, for the analysis, the premium for the transgenic seed was set equal to the additional
variable costs per acre associated with insect control for the conventional technology (i.e.,
material and application costs). In addition, we assumed that there would not be any premium
or discount for transgenic corn (∆Pit = 0) and that the fixed cost of adoption was negligible (cit
= 0), and we assume away refuge requirements (i.e., ρit = 0 for all i and t).
5. Measurement of Benefits
As described in section 2, we identified a total of 11 distinct corn production regions, which
we would treat as different agroecologies for the purposes of this analysis. We used a partial

13
budgeting approach to estimate the per acre net benefits of CRW-resistant transgenic corn,
relative to soil insecticide control for CRW, on a representative acre for each agroecological
region, and then we scaled these per acre benefits by the relevant number of acres in each
region to obtain an estimate of total regional benefits. Yields, harvest costs, and (possibly)
control costs were assumed to be affected by the technology choice. Yields may differ
because the CRW-resistant transgenic corn technology is more effective than chemical
applications in controlling CRW. Harvest costs, $0.375 per bushel, are a direct function of
yields (harvest cost based on enterprise budgets from several universities—e.g., Duffy and
Smith). Finally, the seed price premium may differ from the regional average chemical
control cost, so it is included.10
Variation in the benefit per acre across regions is determined primarily by variation in
the yield gain from using the new CRW-control technology relative to the conventional (non-
transgenic) alternative. In turn, this depends on the yield potential of the crop in that region in
conjunction with weather conditions and pest pressure (which in turn depends on weather,
past cropping patterns within the same field, and the extent of infestations in neighboring
fields). An advantage of conducting a counterfactual analysis is that we can use observations
of corn production in the field, under different treatments—conventional pest-management
strategies and CRW-resistant transgenic corn technology—, which reflect the actual situation
in terms of yield potential, pest pressure, weather conditions, and so on. However, data are
not available directly on the untreated (base) yields for the different agroecologies, and data
are available only for root damage assessments, rather than corn yield, associated with the
10 We assume that an explicit, separate “ technology fee” as such would not be applied in this case of. Rather the equivalent of a technology fee would be incorporated in the seed price. Hence, we refer to the “seed premium” rather than the “ technology fee.”

14
different treatments. We estimated the untreated corn yield and corn yield gain associated
with the different degrees of root damage and the different treatments by combining actual
region-specific average yield data for the year 2000 with information from Mitchell, who has
estimated the relationship between corn yields and root damage ratings.
A partial budget was developed for each of the 11 regions to calculate the net benefits
from CRW control: soil insecticide application relative to no control, CRW-resistant
transgenic corn relative to no control, and CRW-resistant transgenic corn relative to soil
insecticide application. For each analysis, values were specified for a base (untreated) yield
and price (USDA/ERS). To calculate the yield, given CRW control, the base yield was
adjusted upward by the average yield increase, based on estimates from Mitchell of the “yield
saved,” associated with each type of control (CRW-resistant transgenic corn or chemical
treatment).11 The (net) farmer benefit (FBA-B) from control using control strategy A relative
to an alternative control strategy, B, could then be calculated as follows:
(5) )())(( BABABA CCCCYYHPFB −−−−=− ,
where A indicates the control treatment of interest (using insecticide or CRW-resistant
transgenic corn) and B indicates the comparison treatment (applying insecticide or not
applying any treatment), P is the corn price, taken from USDA/ERS, and which varies among
regions, Y is yield, H is harvest cost, and CC is control cost (Doane’s Market Research),
which is zero in untreated corn.12 The net benefits of CRW-resistant transgenic corn relative
to soil insecticide applications were found by setting each yield increase (for soil insecticide
11 It should be noted that all of these calculations used the “average” yield saved reported by Mitchell. However, his estimates include a relatively wide 95 percent confidence interval. Further research by corn entomologists and agronomists is needed to refine these estimates. 12 More complete details on the data and computations can be found in the longer report by Alston, Hyde, and Marra, in particular in the appendix. Separate tables are presented for each region.

15
application and for CRW-resistant transgenic corn) to the average level associated with a
given root rating. 13
We calculated three important factors pertaining to the benefits from adopting the
alternative CRW control methods, and therefore the adoption decision: namely, (a) economic
root rating thresholds for CRW control (using both the CRW-resistant transgenic corn control
strategy and the soil insecticide application strategy), (b) net benefits from CRW-resistant
transgenic corn at the soil insecticide application threshold, and (c) net benefits from CRW-
resistant transgenic corn relative to soil insecticide application. The economic threshold root
rating is the observed root rating at which the additional control costs just equal the additional
benefits of control. Analytically, the root rating threshold for treatment i, *iRR is derived as
follows. First, in equation (5), setting the net benefits from control strategy i relative to no
control equal to zero implies:
(6) *( )( ),i i iCC P H Y Y= − −
where CCi is the control cost for control strategy i (either soil applied insecticide or CRW-
resistant transgenic corn), P is the expected corn price, H is the harvest cost per bushel and
*iY is the untreated yield in bushels per acre at the economic threshold for treatment i. Then
we can substitute for yield, using Yi = γRRi, where γ is the factor that converts root rating into
yield, RRi is the root rating associated with control strategy i and *iRR is the root rating at the
economic threshold for control strategy i, to obtain
13 The net benefits from the adoption of the CRW resistant transgenic corn technology if the root damage rating were at the threshold value at which it would be just profitable to apply the insecticide control technology correspond to both the minimum benefits from adopting CRW resistant transgenic corn for those who had opted to apply insecticide (since at best their root rating would have been just above the threshold), and at the same time they represent the maximum potential benefits for those who opted not to apply insecticide (since at worst their root rating could have been just below the threshold).
16
(7) *( )( ),i i iCC P H RR RR= − γ − γ
Rearranging terms in (7) gives:
(8) *
( )i
i i
CCRR RR
P H= −
γ −
Note that the threshold root rating increases with an increase in harvest cost or control
cost and decreases with an increase in the expected corn price. The threshold decreases with
an increase in the root rating associated with the control strategy because an increased root
rating after implementing the control strategy implies the strategy is not as effective (i.e., it
cannot achieve as much yield increase relative to untreated yield). This implies, as well, that
the threshold root rating for the insecticide control strategy will be above the threshold root
rating for the CRW-resistant transgenic corn control strategy. We estimated threshold root
ratings under different values for (a) the untreated yield, and (b) the seed premium for CRW-
resistant transgenic corn technology (one corresponding to the national average cost of
conventional spray treatment).
To complete the analysis, we require an estimate of the number of acres in each
region, corresponding to each combination of untreated yield and root damage rating, for each
class of potential adopters of the CRW-resistant transgenic corn technology in that region
Unfortunately these data are not available. Corn rootworm pressure within a given region can
vary greatly from year to year. The variance is also very high among fields within a region
for any given year. This is attributable to many factors, including cultural practices and
environmental factors. As an approximation we used an average root damage rating for each
region. To examine the sensitivity of the results to the regional average values for root
damage ratings, as well as “moderate” estimates for root damage ratings, which apply in a
“most-likely” scenario, we also evaluated the benefits assuming “high” and “ low” rates of
17
corn rootworm pressure for each region. Table 3 lists the region-specific root damage ratings
under the “high,” “moderate,” and “ low” scenarios, which are assumed to apply with
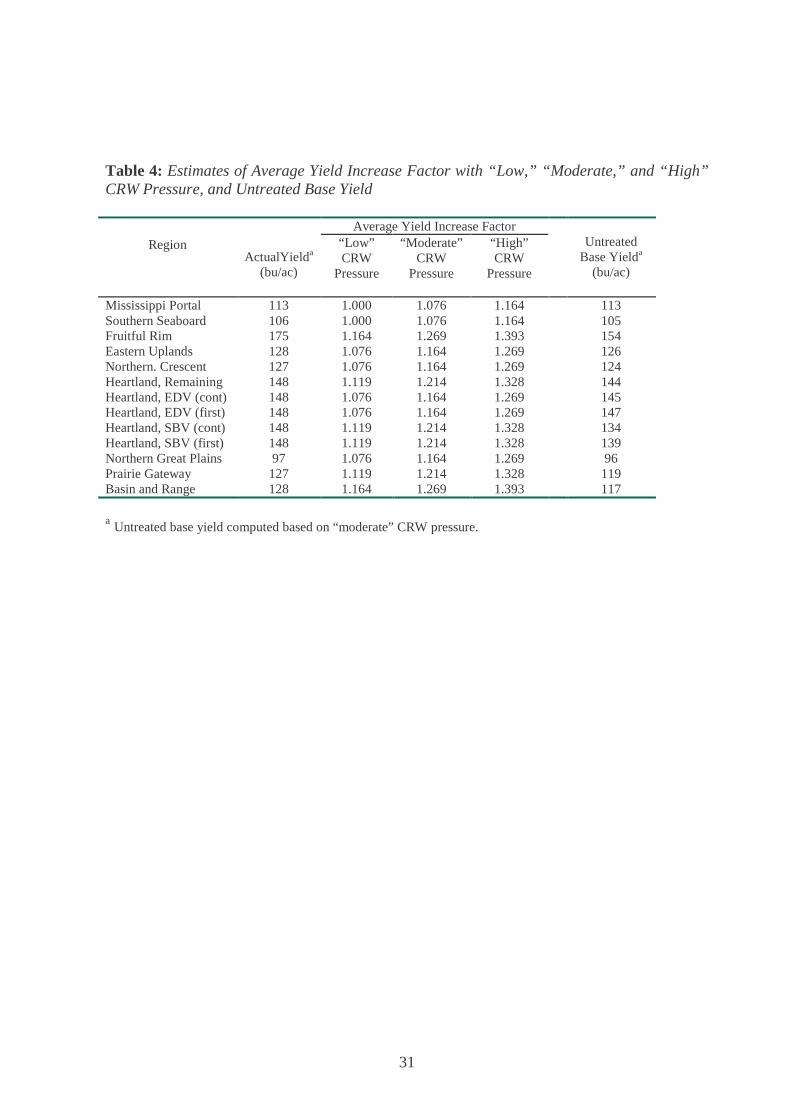
probabilities of 15 percent, 70 percent, and 15 percent, respectively.14 Table 4 lists the
corresponding values of untreated base yields, derived from the combinations of actual yields
and root damage ratings.
[Table 3: Actual Average Regional Yield in 2000, and . . .] [Table 4: Estimates of Average Yield Increase Factor . . .] In table 5, for each region we report estimates of regional average benefits per acre
from adopting CRW-resistant transgenic corn technology for both continuous and first-year
corn, under our three different scenarios of “ low,” “moderate,” and “high” CRW pressure.
Total annual regional benefits, computed by multiplying the region-specific benefits per acre
by the relevant number of acres in the region, are also reported in table 5 for each scenario.
The sum across regions is the total national benefit to producers, and dividing this total by the
number of base acres treated gives an estimate of the overall average benefit per acre. These
aggregate figures are shown in the last row of table 5. In the moderate scenario, the total
annual benefits across the 11 regions amounted to $231 million, spread across 13.8 million
acres, an average of about $16.49 per acre treated. Between the “ low” and “high” scenarios,
the estimates of total benefits ranged from $111 million to $406 million (or from $8 to $29
per acre). Finally, the last column in table 5 shows the “average” estimate of total regional
benefits, obtained by weighting the benefits under the “ low,” “moderate,” and “high”
scenarios by their assumed probabilities. Since the probability distribution is symmetric, with
14 The ranges established and probabilities assumed were primarily based on personal communication with university scientists (Dr. L. Meinke, University of Nebraska; Dr. M. Rice, Iowa State University; and Dr. K. Steffey, University of Illinois).

18
a high weight on the “moderate” scenario, the “average” estimates are generally similar to
their “moderate” counterparts—a total benefit of $239 million, about $17 per acre treated.
[Table 5: Farm Level Benefits from Adoption…]
The estimates in table 5 are based on the regional prices of corn in 2000, which
averaged $1.85/bushel.15 In table 6 we compare estimates based on those prices with
alternative estimates made under the assumption of a corn price equal to the ten-year average
U.S. corn price ($2.32/bushel), for the moderate scenario. Summing across regions, the total
annual benefits increased from $231 million ($16.50 per acre treated), using the year 2000
regional corn price to $319 million (just over $23 per acre treated), using the U.S. ten-year
average corn price. Figure 2 shows the frequency distribution of national average corn prices
for the decade 1991–2000 to give some perspective on our alternative price assumptions.
[Table 6: “ Moderate” Farm Level Benefits under Alternative Corn Prices]
Comparing across the regions, the measures of benefits vary from negligible amounts
in Mississippi Portal or Southern Seaboard up to $54 million in the Heartland, Remaining
region (up to $76 million in the Heartland, Remaining region using the ten-year average U.S.
corn price assumption). Some of this variation is attributable to variation in benefits per acre,
but variation in the number of acres treated for CRW is a much more important factor. The
four regions that account for most of the benefits, the Northern Crescent, Prairie Gateway,
Heartland, Remaining, and Heartland, SBV, also account for most of the acreage treated.
In addition to the farm-level benefits, non-farm benefits are given by multiplying the
seed premium ($12.43 per acre) by the number of acres to which it applies (13,796,901 acres),
a total benefit of $171 million. If the seed premium increases by one dollar per acre, this
15 The year 2000 corn price average was more than 20 percent below the 10-year average (not adjusted for inflation), so we report the regional and aggregated results using both price scenarios in table 6.

19
simply reduces the farmers’ net benefits by one dollar per acre, which is exactly offset by an
increase in the non-farm benefits of one dollar per acre. So long as this hypothetical price
change would not result in any changes in farmers’ decisions about adopting the technology
(i.e., so long as the premium was initially low enough such that the adoption decision would
not be marginal) the seed premium affects only the distribution of benefits. Accordingly,
even if there is an adoption response, the main impact of varying the seed premium would be
for the distribution of benefits, with less-important implications for the total.
Combining the annual farmer benefits of $231 million in the “moderate” scenario
($319 million with the ten-year U.S. average corn price assumption) and the annual nonfarmer
benefits ($171 million), we estimate that the total annual national benefits from the adoption
of CRW-resistant transgenic corn technology in the year 2000 would have been equal to $402
million ($490 million with the alternative corn price assumption).
6. Non-Pecuniary Benefits
In addition to the benefits computed above farmers may receive other benefits that do not
show up in the corn production budget. A computer-assisted telephone survey of corn
farmers was conducted in late March and early April of 2002 by Doane Marketing Research,
Inc., under the direction of the authors, with a view to assessing these non-pecuniary benefits.
The survey sample was randomly selected from Doane’s list of corn farmers.
To qualify for the survey, a respondent must have planted a minimum of 250 acres of
corn in 2001 and must be the primary decision maker for purchases of insecticides and seed in
their farm operation. Qualifying farmers must have also used a soil-applied insecticide for
corn rootworm control on at least some of their corn acreage in 2001. The sample was

20
weighted toward the regions with the most acreage planted to corn. Numbers of respondents
by region were: Heartland-Remaining (100), Northern Crescent (100), Northern Great Plains
(100), Prairie Gateway (101), Heartland-EDV (50), Heartland-SBV (50), and all other regions
combined (100). The survey respondents treated 93 percent of their continuous corn acres
and 62 percent of their first year corn acres at least once in 2001 for corn rootworm. The
average price paid for all soil-applied insecticides targeted at corn rootworm on both
continuous and first-year corn acres ranged from $10.56 to $11.84 per acre.
Respondents were asked a series of questions designed to elicit the value they would
place on a set of “nonpecuniary” benefits from adopting the product, in addition to the
benefits associated with increases in their average yields, including savings in handling and
labor time, human safety benefits (operator and worker safety), environmental quality
benefits, and more consistent control (less yield risk). First they were asked if they agree or
disagree with a statement that a particular benefit would be gained by adopting the product.
An overwhelming percentage of respondents agreed that at least some of each non-pecuniary
benefit could be gained by adoption (92 percent agreed it would be safer for humans and 82
percent agreed it would be safer for the environment than soil-applied treatment). They were
then asked to place a separate value per acre on each of the benefits. In addition, they were
asked to place a separate value on savings in equipment costs that might be gained by
adoption and another on an increase in standability (less lodging, resulting in more harvested
yield) of between two and five percent. They were then asked to give a value per acre for the
total package of non-pecuniary benefits plus equipment cost savings and then an additional
value for the non-pecuniary, equipment cost and standability benefits. Table 7 presents the
average values placed on the benefits listed above by likely adopters, unlikely adopters, and

21
the total sample. Perhaps the most important elements of these are the value of time saved
and the yield-risk reduction associated with CRW-resistant transgenic corn. 16
[Table 7: Values Placed by Respondents on Various Characteristics …]
The survey results indicate the value of time saved would be $1.60 per acre for unlikely
adopters, or $1.94 for likely adopters, with an overall average of $1.87 per acre. The
respondents’ valuation of the potential yield risk reduction from consistent insect control
ranges from $1.25 per acre for unlikely adopters to $4.03 for likely adopters with an overall
average of $3.80 per acre. These are reported values when the respondents were asked to
value each of the benefits separately. When they were asked to value the benefits as a
package, including potential equipment cost savings, the range is from $2.55 per acre for the
unlikely adopters to $4.55 for the likely adopters, with an overall average value of $4.18 per
acre. Notice that the values placed on the total package of benefits together (both with and
without standability benefits) are less than the sum of the separate values. We believe the
values the respondents placed on the total packages of benefits are probably closer to their
true willingness to pay for these benefits, since they were asked to value the benefits packages
after they had had a chance to think further about the individual components. Applying these
average benefits per acre to the 13,796,901 acres treated for corn rootworm in the year 2000
would imply a total additional farmer benefit of $58 million if CRW-resistant transgenic corn
had been made available and was adopted on 100 percent of the treated acres.
7. Summary and Conclusion
We have examined the potential impact of the introduction of a new transgenic technology for
control of corn rootworm. Under a reasonable set of assumptions, and using production and
16 Research in progress includes a more comprehensive exploration of the valuation portion of the survey.

22
price data for 2000, we found that if the technology had been available in the year 2000, and
priced equivalent to the benchmark pesticide technology so that it would be adopted
comprehensively, the benefit for farmers in the United States would have been $231 million
in that year. Adding the annual non-farmer benefits of $171 million (the benefits accruing to
the technology developer and seed companies), the total benefits in the United States in 2000
would have been $402 million ($490 million, if the ten-year average corn price is used,
instead of the actual price in 2000, to place a value on the yield increase). The total (farm and
non-farm) benefit is 2.36 percent of the value of the year 2000 corn crop. These estimates
may be understated for several reasons. First, we estimated all of the benefits using an
average root-rating index. It is clear that acres with above-average root damage ratings would
realize greater benefits from the technology. It is also true, as discussed earlier, that some
acres below the root-rating threshold for insecticide treatment would realize a small net
benefit from the new technology. Perhaps more importantly, however, the technology
provides further, non-pecuniary benefits to farmers, in addition to those associated with yield
gains. We estimated non-pecuniary farmer benefits of $58 million if CRW-resistant
transgenic corn had been made available and was adopted on 100 percent of the treated acres.
Adding this additional $58 million to the farmer benefit from yield improvement ($231
million) increases the total farmer benefit to $289 million, and the total farmer plus non-
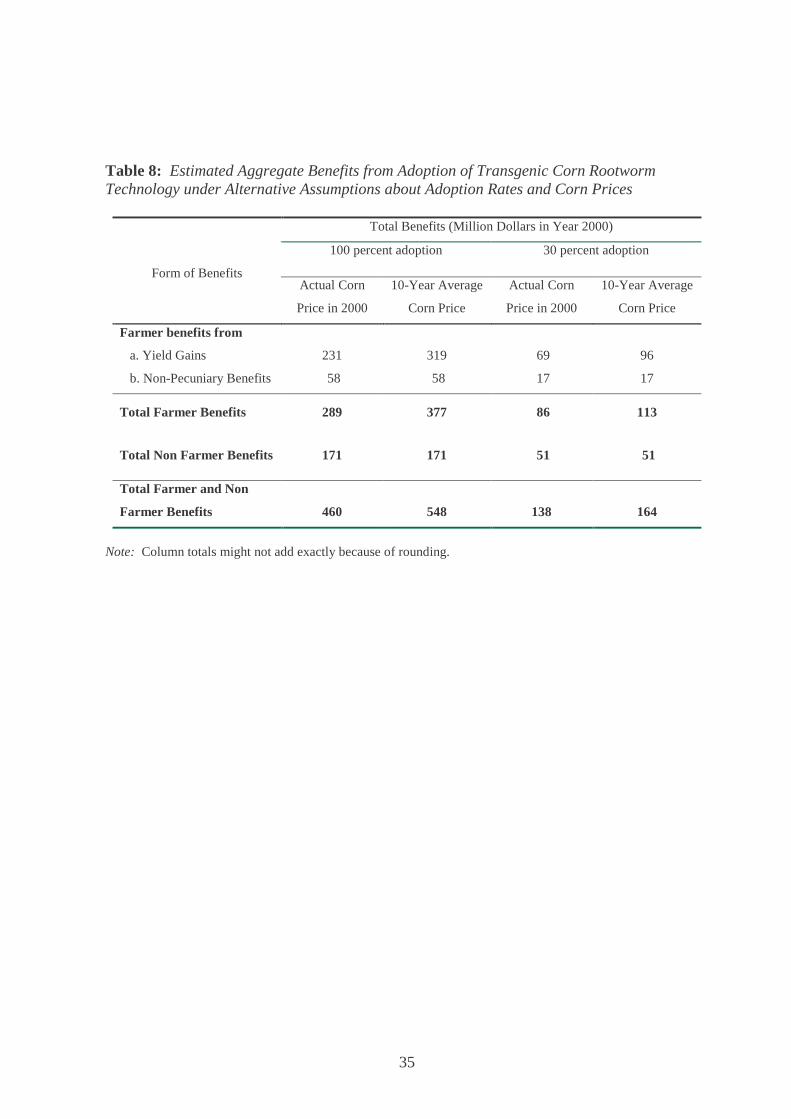
farmer benefit to $460 million. Table 8 summarizes the alternative estimates of the total
benefits, the forms of benefits, and their distribution among farmers and others.
[Table 8: Estimated Aggregate Benefits from Adoption . . .]
These estimates of pecuniary and non-pecuniary benefits to farmers and others are
based on the assumption of 100 percent adoption—that all corn acres currently treated with

23
conventional control methods would be switched to the new technology, instantaneously and
completely. This is an extreme assumption and for that reason probably unreasonable—even
under our assumption about the pricing of the CRW-resistant transgenic corn technology,
which meant that it would entail lower pest-control costs and higher yields and would clearly
dominate conventional pest-control technology—since some farmers have said they would
not plant a crop with a biotech trait under any circumstances. Our survey results indicate that
this proportion of farmers may be significant, although the number of farmers in this category
will probably decrease after product commercialization and adoption begins to take place.
The survey results indicated that adoption might be only 30 percent in the first year, which
would imply that the benefits in the first year would be 30 percent of the figure implied by
100 percent adoption (the relationship is linear under our assumptions unless we use a more-
sophisticated analysis in which the farmers identified as those who choose to adopt are those
who are likely to obtain higher-than average benefits per acre).
Table 8 shows the effects of this lower adoption rate on the pattern of benefits as well
as the total. Using an adoption rate of 30 percent, instead of a total benefit of $460 million in
the year 2000, a conservative estimate of the benefits is $138 million. This might not be the
maximum annual benefit, since adoption would evolve over time with the development of
information and knowledge of the technology and its impacts. Other conditioning factors on
adoption and on the benefits from adoption, which have not been addressed directly, include
the potential effects of refuge requirements, price discounts, or identity preservation costs, if
they become a reality. It is important to remember also that the pace of technological
innovation in agricultural biotechnology and other pest management systems will likely place
an upper limit on the amount of time over which the maximum benefits can be realized.

24
Additional work could be done, both to refine the estimates of this ex ante study and to
estimate the benefits after commercial introduction, as well as to compare the two. One of the
more crucial pieces of information we need, to improve on our ex ante estimates, is
information about the distribution of corn rootworm damage within each production region.
This would allow us to calculate the benefits associated with the acres experiencing higher-
than-average rootworm pressure, and also to identify those acres that are not now treated but
for which the technology would provide a net benefit. The relationship between root damage
as measured by the root rating and ultimate yield should receive more attention, as well.

25
8. References
Alston, J.M., J. Hyde, and M.C. Marra. An Ex Ante Analysis of the Benefits from the
Adoption of Monsanto’s Corn Rootworm Resistant Varietal Technology -- YieldGard
Rootworm. NSF Center for Integrated Pest Management. Technical Bulletin 103,
68pp Raleigh, NC, July 2002.
Alston, J. M., G. Norton, and P. G. Pardey. Science Under Scarcity: Principles and Practice
for Agricultural Research Evaluation and Priority Setting. Wallingford, U.K.: CAB
International, 1998.
Beach, E., and G. Carlson. “A Hedonic Analysis of Herbicides: Do User Safety and Water
Quality Matter?” American Journal of Agricultural Economics 75(1993): 612−23.
Carpenter, J.E. and L.P. Gianessi. “Agricultural Biotechnology: Updated Benefit Estimates.”
National Center for Food and Agricultural Policy, Washington, DC, 2001.
Doane’s Market Research. “Corn Insecticide Product Use.” Agro Trak. Data supplied by
Monsanto Company, 2001.
Duffy, M. and D. Smith. “Estimated Costs of Crop Production in Iowa - 2002.” Publication
FM 1712, Iowa State University, 2002.
Gianessi, L. National Center for Food and Agricultural Policy, Washington, DC. Personal
communication. September 14, 2001.
Hurley, T.M., B.A. Babcock, and R.L. Hellmich. “Bt Corn and Insect Resistance: An
Economic Assessment of Refuges.” Journal of Agricultural and Resource Economics
26(1)(2001): 176-194.
Hurley, T.M., S. Secchi, B.A. Babcock, and R.L. Hellmich. “Managing the Risk of European
Corn Borer Resistance to Bt Corn.” Environmental and Resource Economics
(forthcoming).
Kryan, J. L., J. J. Jackson, and A. C. Lew. “Field Termination of Egg Diapause in Diabrotica
with New Evidence of Extended Diapause in D. barberi (Coleoptera:
Chrysomelidae).” Environmental Entomology 13(1984):1237-1240.
Laxminarayan, R., and R.D. Simpson. “Refuge Strategies for Managing Pest Resistance in
Transgenic Agriculture.” Environmental and Resource Economics 22(2002): 521-536

26
Levine, E., and H. Oloumi-Sadeghi. “Western Corn Rootworm (Coleoptera: Chrysomelidae)
Larval Injury to Corn Grown for Seed Production Following Soybeans Grown for
Seed Production.” Journal of Economic Entomology 89(1996):1010-1016.
Lichtenberg, E., R. Spear, and D. Zilberman. “The Economics of Reentry Regulation of
Pesticides.” American Journal of Agricultural Economics 75(1993): 946-958.
Livingston, M.J., G.A. Carlson, and P. Fackler.. “Bt Cotton Refuge Policy.” Presented at the
AAEA Summer Meetings, Tampa Bay, Florida, 2002.
Marra, M. “Agricultural Biotechnology: A Critical Review of the Impact Evidence to Date.”
Ch. 8 in Philip Pardey, ed. The Future of Food: Biotechnology Markets and Policies
in an International Setting. Washington DC, International Food Policy Research
Institute, pp. 155-184, 2001.
Marra, M.C., B.J. Hubbell, and G.A. Carlson. “ Information Quality and Technology
Depreciation.” Journal of Agricultural and Resource Economics 26(1)(2001): 158-
175.
Marra, M, P. Pardey, and J. Alston. “The Payoffs to Transgenic Field Crops: An Assessment
of the Evidence.” AgBioForum. 5(2)(2002):1-8.
Metcalf, R. L. “Forward.” Methods for the Study of Pest Diabrotica. J. L. Krysan and T. A.
Miller, eds. New York: Springer-Verlag, 1986.
Mitchell, P. D. “Yield Benefit of Corn Event MON 863.” Faculty Paper FP 02-04,
Department of Agricultural Economics, Texas A&M University, College Station, TX,
May 2002. (agecon.tamu.edu/publications/fp02-04.pdf).
Mitchell, P. D., M. E. Gray, and K. L. Steffey. “Composed Error Model for Insect Damage
Functions: Yield Impact of Rotation Resistant Western Corn Rootworm in Illinois.”
Faculty Paper FP 02-02, Department of Agricultural Economics, Texas A&M
University, College Station, TX, March 2002. (agecon.tamu.edu/publications/fp02-
02.pdf).
Moschini, G., H. Lapan, and A. Sobolevsky. “Roundup Ready Soybeans and Welfare Effects
in the Soybean Complex.” Agribusiness 16(2002):33-55.
National Agricultural Statistics Service (NASS). “Crop Production 2001 Summary.” United
States Department of Agriculture, January, 2002.
27
Onstad, D.W., M. Joselyn, S. Isard, E. Levine, J. Spencer, L. Bledsoe, C. Edwards, C. Di
Fonzo, and H. Wilson. “Modeling the Spread of Western Corn Rootworm
(Coeloptera: Chrysomelidae) Populations Adapting to Soybean-Corn Rotation.”
Environmental Entomology 28(1999):188-194.
Rahm, M.R., and W.E. Huffman. “The Adoption of Reduced Tillage: The Role of Human
Capital and Other Variables.” American Journal of Agricultural Economics 66(1984):
406-413.
Trécé Incorporated. “Corn Rootworm (CRW).” http://www.trece.com/crw_monitor.pdf
(accessed 3/12/02).
USDA/ERS. “Corn Production Costs and Returns, Excluding Direct Government Payments,
1999-2000.” http://www.ers.usda.gov/data/costsandreturns/data/current/c-corn.xls
(accessed 3/18/02).
United States Department of Agriculture, National Agricultural Statistics Service (USDA-
NASS). Agricultural Chemical Usage: 2001 Field Crops Summary. Washington, DC.
Available at jan.mannlib.cornell.edu/reports/nassr/other/pcu-bb/#field.
Wright, R., L. Meinke, and K. Jarvi. “Corn Rootworm Management.” Extension Publication
EC99-1563-C, Nebraska Cooperative Extension Service, University of Nebraska-
Lincoln, Lincoln, Nebraska, 1999.
http://www.ianr.unl.edu/pubs/fieldcrops/ec1563.htm (accessed 1/12/02).

28
Table 1: Corn Acreages and Shares Treated for CRW, by Region in 2000
Region Total Area Planted to
Corn
Share Treated for
CRW
Total Area of Continuous
Corn
Share Treated
for CRW
Total Area of First
Year Corn
Share Treated for
CRW
acres percent acres percent acres percent
Mississippi Portal 1,347,885 1.0 502,916 0.0 844,969 1.5
Southern Seaboard 2,136,491 7.7 706,933 8.3 1,429,558 7.3
Fruitful Rim 882,273 50.5 432,626 52.0 449,646 49.1
Eastern Uplands 1,705,355 11.6 733,404 18.4 971,951 6.5
Northern Crescent 11,288,731 14.7 4,536,048 25.6 6,752,683 7.5
Heartland, Remaining 34,516,415 13.8 6,601,637 44.5 27,914,778 6.6
Heartland, EDV 2,788,455 5.2 265,913 12.7 2,522,542 4.4
SBV Sub-Region 8,951,127 33.0 936,815 47.6 8,014,312 31.3
Northern Great Plains 4,867,966 8.7 1,442,112 26.4 3,425,855 1.3
Prairie Gateway 9,931,175 29.7 5,506,741 45.5 4,424,434 10.1
Basin and Range 211,827 33.7 112,420 55.8 99,407 8.6 TOTAL 79,579,030 17.3 22,268,847 35.7 57,310,183 10.2
Source: Doane’s Market Research.

29
Table 2: Treated Acres, Expenditure on CRW Insecticides, and Average Cost per Acre, by Region
Region Total Acres
Treated for CRW
Total Expenditure
on CRW Insecticides
Continuous Corn Acres Treated for
CRW
Expenditure on CRW
Insecticides, Continuous.
Corn
First-Year Corn Acres
Treated for CRW
Expenditure on CRW
InsecticidesFirst-Year
Corn
Average CRW
Insecticide Cost per
Acre acres Dollars Acres dollars Acres dollars dollars/acre Mississippi Portal 13,115 117,283 36 361 13,079 116,922 8.94 Southern Seaboard 163,442 1,879,948 58,497 626,588 104,945 1,253,360 11.50 Fruitful Rim: Target 445,505 5,337,143 224,830 2,758,341 220,675 2,578,802 11.98 Eastern Uplands 198,413 2,247,484 135,204 1,572,652 63,208 674,833 11.33 Northern Crescent 1,680,410 20,992,361 1,159,901 14,265,651 520,509 6,726,710 12.63 Heartland, Remaining 4,820,048 57,537,615 2,984,335 36,527,083 1,835,713 21,010,532 12.07 Heartland, EDV 145,594 1,819,104 33,640 449,777 111,954 1,369,327 12.49 Heartland, SBV 2,992,309 39,935,790 445,725 6,634,121 2,546,584 33,301,669 13.52 Northern Great Plains 532,094 5,355,880 486,724 4,983,995 45,369 371,885 12.59 Prairie Gateway 3,134,778 35,695,939 2,679,506 30,482,413 455,272 5,213,527 12.09 Basin and Range 71,282 590,972 62,719 509,743 8,563 81,229 8.29 TOTAL 14,196,990 171,509,520 8,271,117 98,810,724 5,925,871 72,698,796 12.43
Source: Doane’s Market Research.

30
Table 3: Actual Average Regional Yield in 2000, and Subjective Distributions of Regional Average Root Damage Ratings
Regional Average Root Rating Region
ActualYielda
(bu/ac) Low Moderate High
Mississippi Portal 113 1 2 3 Southern Seaboard 106 1 2 3 Fruitful Rim 175 3 4 5 Eastern Uplands 128 2 3 4 Northern. Crescent 127 2 3 4 Heartland, Remaining 148 2.5 3.5 4.5 Heartland, EDV 148 2 3 4 Heartland, SBV 148 2.5 3.5 4.5 Northern Great Plains 97 2 3 4 Prairie Gateway 127 2.5 3.5 4.5 Basin and Range 128 3 4 5 aYield taken for ERS budgets except for Mississippi Portal (LA, MS, TN, AR), Fruitful Rim (AZ, CA, WA, ID), and Basin and Range (UT, CO, NV, MT, WY, NM). These were calculated using NASS data and represent total production divided by acres harvested in the states indicated. bThe range of root damage ratings, corresponding to “ low” , “moderate,” and “high” CRW pressure was established for each region, based primarily on personal communication with university scientists (Dr. L. Meinke, University of Nebraska; Dr. M. Rice, Iowa State University; and Dr. K. Steffey, University of Illinois).
31
Table 4: Estimates of Average Yield Increase Factor with “ Low,” “ Moderate,” and “ High” CRW Pressure, and Untreated Base Yield
Average Yield Increase Factor Region
ActualYielda
(bu/ac)
“Low” CRW
Pressure
“Moderate” CRW
Pressure
“High” CRW
Pressure
Untreated Base Yielda
(bu/ac)
Mississippi Portal 113 1.000 1.076 1.164 113 Southern Seaboard 106 1.000 1.076 1.164 105 Fruitful Rim 175 1.164 1.269 1.393 154 Eastern Uplands 128 1.076 1.164 1.269 126 Northern. Crescent 127 1.076 1.164 1.269 124 Heartland, Remaining 148 1.119 1.214 1.328 144 Heartland, EDV (cont) 148 1.076 1.164 1.269 145 Heartland, EDV (first) 148 1.076 1.164 1.269 147 Heartland, SBV (cont) 148 1.119 1.214 1.328 134 Heartland, SBV (first) 148 1.119 1.214 1.328 139 Northern Great Plains 97 1.076 1.164 1.269 96 Prairie Gateway 127 1.119 1.214 1.328 119 Basin and Range 128 1.164 1.269 1.393 117
a Untreated base yield computed based on “moderate” CRW pressure.

32
Table 5: Farm Level Benefits in 2000 from Adoption Under Low, Moderate, or High Corn Rootworm Pressure
Benefits per Acreb Total Regional Benefitsb Region
Continuous (C) or
First-Year (F) Corn
Base Acres Treateda “Low” “Moderate” “High” “Low” “Moderate” “High” “Average”
c
acres dollars per acre dollars Mississippi Portal C 36 1.91 8.22 69 296 93 F 13,079 0.82 7.13 10,725 93,253 21,495 Southern Seaboard C 58,498 2.80 9.42 163,794 551,051 197,314 F 104,944 4.03 10.66 422,924 1,118,703 463,852 Fruitful Rim C 224,830 14.31 26.42 44.91 3,217,317 5,940,009 10,097,115 6,155,171 F 220,676 13.73 25.84 44.33 3,029,881 5,702,268 9,782,567 5,913,455 Eastern Uplands C 135,205 4.35 11.89 22.51 588,142 1,607,587 3,043,465 1,670,052 F 63,208 3.39 10.94 21.55 214,275 691,496 1,362,132 720,508 Northern Crescent C 1,158,988 4.74 11.87 21.89 5,493,603 13,757,188 25,370,247 14,259,609 F 503,397 5.80 12.92 22.95 2,919,703 6,503,889 11,552,961 6,723,622 Heartland, Remaining C 2,936,189 9.03 18.40 32.14 26,513,787 54,025,878 94,369,114 55,950,549 F 1,829,706 8.08 17.44 31.19 14,784,024 31,910,073 57,068,530 33,114,934 Heartland, EDV C 33,640 6.39 14.37 25.61 214,960 483,407 861,520 499,857 F 111,954 5.32 13.42 24.81 595,595 1,502,423 2,777,579 1,557,672 Heartland, SBV C 445,725 10.85 19.56 32.36 4,836,116 8,718,381 14,423,661 8,991,833 F 2,507,346 9.56 18.60 31.87 23,970,228 46,636,636 79,909,117 48,227,547 Northern Great Plains C 381,016 4.02 8.96 15.91 1,531,684 3,413,903 6,061,965 3,528,780 F 44,431 (0.69) 4.25 11.20 (30,657) 188,832 497,627 202,228 Prairie Gateway C 2,505,954 7.90 16.36 28.80 19,797,037 40,997,407 72,171,475 42,493,462 F 446,796 7.40 15.87 28.30 3,306,290 7,090,653 12,644,327 7,356,049 Basin and Range C 62,720 6.70 15.89 29.94 420,217 996,605 1,877,807 1,042,327 F 8,563 8.05 17.25 31.30 68.932 147,712 268,022 153,941 Total Across Regions 13,796,901 8.08 16.49 29.42 111,471,141 230,911,872 405,902,565 239,244,367
aBase Acres Treated from Doane’s Market Research. bBased on data in Alston, Hyde, and Marra, table 4 and tables B.1 through B.11. cAverage is the weighted average of “ low,” “moderate,” and “high” using weights of 0.15, 0.70, and 0.15, respectively.

33
Table 6: “ Moderate” Farm Level Benefits in 2000 under Alternative Corn Prices
Year 2000 Corn Priceb 10-Year Average Corn Price
($2.32/bu.) Region
Continuous (C) or
First-Year (F) Corn
Base Acres
Treateda Per Acre Benefits
Regional Benefits
Per Acre Benefits
Regional Benefits
acres $/acre dollars $/acre dollars
Mississippi Portal C 36 1.91 69 3.60 130 F 13,079 0.82 10,725 2.52 32,959 Southern Seaboard C 58,498 2.80 163,794 3.86 225,802 F 104,944 4.03 422,924 5.09 534,165 Fruitful Rim C 224,830 26.42 5,940,009 36.90 8,296,227 F 220,676 25.84 5,702,268 36.31 8,012,746 Eastern Uplands C 135,205 11.89 1,607,587 15.72 2,125,423 F 63,208 10.94 691,496 14.76 932,950 Northern Crescent C 1,158,988 11.87 13,757,188 16.13 18,694,476 F 503,397 12.92 6,503,889 17.18 8,648,360 Heartland, Remaining C 2,936,189 18.40 54,025,878 26.02 76,399,638 F 1,829,706 17.44 31,910,073 25.06 45,852,432 Heartland, EDV C 33,640 4.37 483,407 19.94 670,782 F 111,954 13.42 1,502,423 19.07 2,134,963 Heartland, SBV C 445,725 19.56 8,718,381 26.66 11,883,029 F 2,507,346 18.60 46,636,636 25.96 65,090,702 Northern Great Plains C 381,016 8.96 3,413,903 13.23 5,040,842 F 44,431 4.25 188,832 8.52 378,552 Prairie Gateway C 2,505,954 16.36 40,997,407 21.23 53,201,403 F 446,796 15.87 7,090,653 20.73 9,262,081 Basin and Range C 62,720 15.89 996,621 23.85 1,495,872 F 8,563 17.25 147,712 25.21 215,873 Total 230,911,872 319,129,407
aBased on data in Alston, Hyde, and Marra, table A.1 and tables B.1 through B.11; Base Acres Treated From Doane’s Market Research. bPrices in 2000 by region were Heartland ($1.75), Northern Crescent ($1.81), Northern Great Plains ($1.66), Prairie Gateway ($1.88), Eastern Uplands ($1.87), Southern Seaboard ($1.95), and all others ($1.77).

34
Table 7: Values Placed by Respondents on Various Characteristics of the New Technology Relative to Soil-Applied Insecticide Applications
Respondent Adoption Category
Product Characteristic Likely to Adopt Unlikely to Adopt Total Respondents
($ per acre)
1. Handling and Labor Time Savings 1.94 1.60 1.87
2. Human Safety 1.79 1.24 1.68
3. Environmental Safety 1.46 0.82 1.34
4. Consistent Control (Reduced Yield Risk) 4.03 1.25 3.80
Sum of 1 through 4 9.22 4.91 8.69
5. Equipment Cost Savings 1.57 1.00 1.46
Sum of 1 through 5 10.79 5.91 10.15
6. Better Standability (2-5% increase) 5.29 3.70 4.99
Sum of 1 through 6
16.08 9.61 15.14
Items 1 through 5 Valued as a Package 4.55 2.55 4.18
Items 1 through 6 Valued as a Package
7.24 3.86 6.61
35
Table 8: Estimated Aggregate Benefits from Adoption of Transgenic Corn Rootworm Technology under Alternative Assumptions about Adoption Rates and Corn Prices
Total Benefits (Million Dollars in Year 2000)
100 percent adoption 30 percent adoption
Form of Benefits Actual Corn
Price in 2000
10-Year Average
Corn Price
Actual Corn
Price in 2000
10-Year Average
Corn Price
Farmer benefits from
a. Yield Gains 231 319 69 96
b. Non-Pecuniary Benefits 58 58 17 17
Total Farmer Benefits 289 377 86 113
Total Non Farmer Benefits 171 171 51 51
Total Farmer and Non
Farmer Benefits
460
548
138
164
Note: Column totals might not add exactly because of rounding.
Related Documents


