RESEARCH ARTICLE An evaluation of in vitro protein–protein interaction techniques: Assessing contaminating background proteins Jenika M. Howell 1 , Tara L. Winstone 1 , Jens R. Coorssen 2 and Raymond J. Turner 1 1 Department of Biological Sciences, University of Calgary, Calgary, Canada 2 Department of Physiology & Biophysics, University of Calgary, Calgary, Canada Determination of protein–protein interactions is an important component in assigning function and discerning the biological relevance of proteins within a broader cellular context. In vitro protein–protein interaction methodologies, including affinity chromatography, coimmunopre- cipitation, and newer approaches such as protein chip arrays, hold much promise in the detec- tion of protein interactions, particularly in well-characterized organisms with sequenced ge- nomes. However, each of these approaches attracts certain background proteins that can thwart detection and identification of true interactors. In addition, recombinant proteins expressed in Escherichia coli are also extensively used to assess protein–protein interactions, and background proteins in these isolates can thus contaminate interaction studies. Rigorous validation of a true interaction thus requires not only that an interaction be found by alternate techniques, but more importantly that researchers be aware of and control for matrix/support dependence. Here, we evaluate these methods for proteins interacting with DmsD (an E. coli redox enzyme maturation protein chaperone), in vitro, using E. coli subcellular fractions as prey sources. We compare and contrast the various in vitro interaction methods to identify some of the background proteins and protein profiles that are inherent to each of the methods in an E. coli system. Received: July 8, 2005 Revised: October 18, 2005 Accepted: October 24, 2005 Keywords: Affinity chromatography / Far-Western coprecipitation / Protein chips / Protein–protein interactions / SELDI-TOF 2050 Proteomics 2006, 6, 2050–2069 1 Introduction The detection of novel protein–protein interactions and the identification of the time, space, and functional relevance of these interactions in the broader context of cellular function has become a major driving force in scientific research. The assessment of protein interactions has many implications as to how biological systems are understood, giving rise to a new area of research termed as “interactomics”. Although several genomes have been sequenced, the relevance and function of many encoded proteins have yet to be deter- mined. Elucidation of the interaction network for a given protein is an important step in assigning function within the cell [1–3]. Protein–protein interactions are critical to most biologi- cal processes, and occur with varying degrees of affinity and specificity. The actual detection of protein interactions is complicated by the fact that proteins themselves are chemi- cally distinct entities with differing charges, numerous sec- ondary and tertiary structural folds, and may include a wide variety of PTMs. Parameters that influence interactions thus include protein concentration, counter ion type, ionic Correspondence: Dr. Raymond J. Turner, Departmentof Biologi- cal Sciences, University of Calgary, Calgary, AB T2N 1N4, Canada E-mail: [email protected] Fax: 11-403-289-9311 Abbreviations: co-IP , coimmunoprecipitation; cv, column volumes; IPTG, isopropyl-B-D-thiogalactoside; LB, Luria-Bertani; Ni 21 -NTA, nickel-nitrilotriacetic acid; PS-20, preactivated sur- faces; TAP , tandem affinity purification; TX-100, tritonX-100; WT , wild-type DOI 10.1002/pmic.200500517 © 2006 WILEY-VCH Verlag GmbH & Co. KGaA, Weinheim www.proteomics-journal.com

Welcome message from author
This document is posted to help you gain knowledge. Please leave a comment to let me know what you think about it! Share it to your friends and learn new things together.
Transcript

RESEARCH ARTICLE
An evaluation of in vitro protein–protein interaction
techniques: Assessing contaminating background
proteins
Jenika M. Howell1, Tara L. Winstone1, Jens R. Coorssen2 and Raymond J. Turner1
1 Department of Biological Sciences, University of Calgary, Calgary, Canada2 Department of Physiology & Biophysics, University of Calgary, Calgary, Canada
Determination of protein–protein interactions is an important component in assigning functionand discerning the biological relevance of proteins within a broader cellular context. In vitroprotein–protein interaction methodologies, including affinity chromatography, coimmunopre-cipitation, and newer approaches such as protein chip arrays, hold much promise in the detec-tion of protein interactions, particularly in well-characterized organisms with sequenced ge-nomes. However, each of these approaches attracts certain background proteins that can thwartdetection and identification of true interactors. In addition, recombinant proteins expressed inEscherichia coli are also extensively used to assess protein–protein interactions, and backgroundproteins in these isolates can thus contaminate interaction studies. Rigorous validation of a trueinteraction thus requires not only that an interaction be found by alternate techniques, but moreimportantly that researchers be aware of and control for matrix/support dependence. Here, weevaluate these methods for proteins interacting with DmsD (an E. coli redox enzyme maturationprotein chaperone), in vitro, using E. coli subcellular fractions as prey sources. We compare andcontrast the various in vitro interaction methods to identify some of the background proteins andprotein profiles that are inherent to each of the methods in an E. coli system.
Received: July 8, 2005Revised: October 18, 2005
Accepted: October 24, 2005
Keywords:
Affinity chromatography / Far-Western coprecipitation / Protein chips / Protein–proteininteractions / SELDI-TOF
2050 Proteomics 2006, 6, 2050–2069
1 Introduction
The detection of novel protein–protein interactions and theidentification of the time, space, and functional relevance ofthese interactions in the broader context of cellular functionhas become a major driving force in scientific research. The
assessment of protein interactions has many implications asto how biological systems are understood, giving rise to anew area of research termed as “interactomics”. Althoughseveral genomes have been sequenced, the relevance andfunction of many encoded proteins have yet to be deter-mined. Elucidation of the interaction network for a givenprotein is an important step in assigning function within thecell [1–3].
Protein–protein interactions are critical to most biologi-cal processes, and occur with varying degrees of affinity andspecificity. The actual detection of protein interactions iscomplicated by the fact that proteins themselves are chemi-cally distinct entities with differing charges, numerous sec-ondary and tertiary structural folds, and may include a widevariety of PTMs. Parameters that influence interactions thusinclude protein concentration, counter ion type, ionic
Correspondence: Dr. Raymond J. Turner, Department of Biologi-cal Sciences, University of Calgary, Calgary, AB T2N 1N4, CanadaE-mail: [email protected]: 11-403-289-9311
Abbreviations: co-IP, coimmunoprecipitation; cv, columnvolumes; IPTG, isopropyl-B-D-thiogalactoside; LB, Luria-Bertani;Ni21-NTA, nickel-nitrilotriacetic acid; PS-20, preactivated sur-faces; TAP, tandem affinity purification; TX-100, tritonX-100; WT,wild-type
DOI 10.1002/pmic.200500517
© 2006 WILEY-VCH Verlag GmbH & Co. KGaA, Weinheim www.proteomics-journal.com
Proteomics 2006, 6, 2050–2069 Technology 2051
strength, redox potential, pH, dissociation constants, andoligomeric states, to name a few [4–7]. Further, the experi-mental methods used to discern interactions will also influ-ence whether or not they can be detected. In identifying aprotein–protein interaction, it is important that the nativestate of the proteins of interest be maintained as closely aspossible to ensure detection of genuine interactors, ratherthan nonspecific aggregations of randomly denatured pro-teins [4]. Compounding these differences is the fact thattechniques for assessing protein interactions also vary intheir sensitivities and resolution. Many protein–proteininteractions are transient, and are characterized by smallcontact areas and less defined conformational changes uponbinding of the interacting protein [5]. Detection of weaklyinteracting proteins is thus rendered all the more challeng-ing.
Several available methods have been used successfully tostudy protein–protein interactions, from the more traditionalcoimmunoprecipitation (co-IP) [8] and crosslinking, to yeast–two-hybrid screens [4], and more recent developments suchas tandem affinity purification (TAP) tags [9–11] and proteinchip arrays [12, 13]. These methods are summarized in
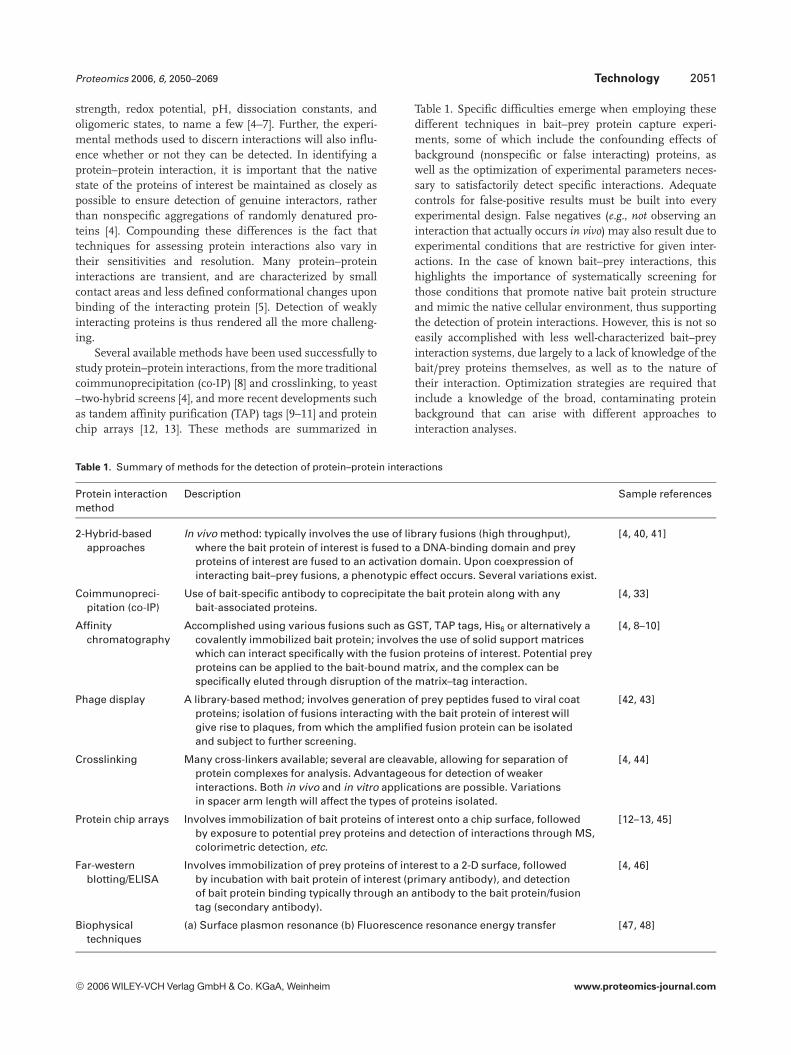
Table 1. Specific difficulties emerge when employing thesedifferent techniques in bait–prey protein capture experi-ments, some of which include the confounding effects ofbackground (nonspecific or false interacting) proteins, aswell as the optimization of experimental parameters neces-sary to satisfactorily detect specific interactions. Adequatecontrols for false-positive results must be built into everyexperimental design. False negatives (e.g., not observing aninteraction that actually occurs in vivo) may also result due toexperimental conditions that are restrictive for given inter-actions. In the case of known bait–prey interactions, thishighlights the importance of systematically screening forthose conditions that promote native bait protein structureand mimic the native cellular environment, thus supportingthe detection of protein interactions. However, this is not soeasily accomplished with less well-characterized bait–preyinteraction systems, due largely to a lack of knowledge of thebait/prey proteins themselves, as well as to the nature oftheir interaction. Optimization strategies are required thatinclude a knowledge of the broad, contaminating proteinbackground that can arise with different approaches tointeraction analyses.
Table 1. Summary of methods for the detection of protein–protein interactions
Protein interactionmethod
Description Sample references
2-Hybrid-basedapproaches
In vivo method: typically involves the use of library fusions (high throughput),where the bait protein of interest is fused to a DNA-binding domain and preyproteins of interest are fused to an activation domain. Upon coexpression ofinteracting bait–prey fusions, a phenotypic effect occurs. Several variations exist.
[4, 40, 41]
Coimmunopreci-pitation (co-IP)
Use of bait-specific antibody to coprecipitate the bait protein along with anybait-associated proteins.
[4, 33]
Affinitychromatography
Accomplished using various fusions such as GST, TAP tags, His6 or alternatively acovalently immobilized bait protein; involves the use of solid support matriceswhich can interact specifically with the fusion proteins of interest. Potential preyproteins can be applied to the bait-bound matrix, and the complex can bespecifically eluted through disruption of the matrix–tag interaction.
[4, 8–10]
Phage display A library-based method; involves generation of prey peptides fused to viral coatproteins; isolation of fusions interacting with the bait protein of interest willgive rise to plaques, from which the amplified fusion protein can be isolatedand subject to further screening.
[42, 43]
Crosslinking Many cross-linkers available; several are cleavable, allowing for separation ofprotein complexes for analysis. Advantageous for detection of weakerinteractions. Both in vivo and in vitro applications are possible. Variationsin spacer arm length will affect the types of proteins isolated.
[4, 44]
Protein chip arrays Involves immobilization of bait proteins of interest onto a chip surface, followedby exposure to potential prey proteins and detection of interactions through MS,colorimetric detection, etc.
[12–13, 45]
Far-westernblotting/ELISA
Involves immobilization of prey proteins of interest to a 2-D surface, followedby incubation with bait protein of interest (primary antibody), and detectionof bait protein binding typically through an antibody to the bait protein/fusiontag (secondary antibody).
[4, 46]
Biophysicaltechniques
(a) Surface plasmon resonance (b) Fluorescence resonance energy transfer [47, 48]
© 2006 WILEY-VCH Verlag GmbH & Co. KGaA, Weinheim www.proteomics-journal.com
2052 J. M. Howell et al. Proteomics 2006, 6, 2050–2069
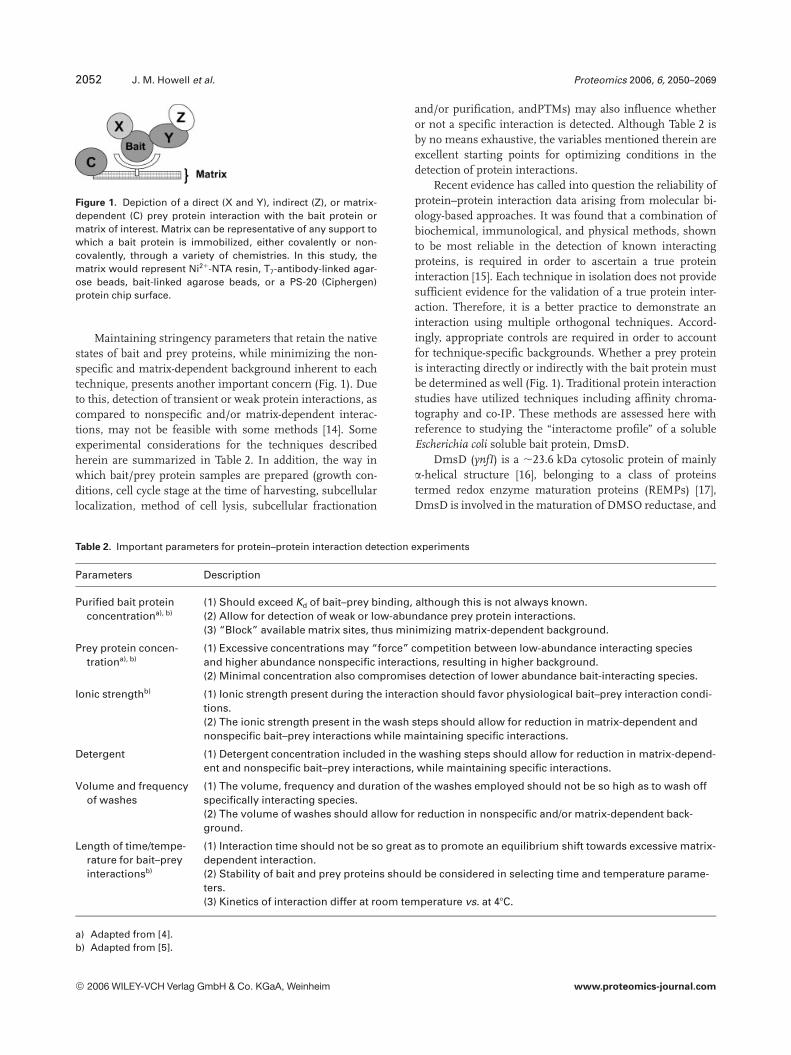
Figure 1. Depiction of a direct (X and Y), indirect (Z), or matrix-dependent (C) prey protein interaction with the bait protein ormatrix of interest. Matrix can be representative of any support towhich a bait protein is immobilized, either covalently or non-covalently, through a variety of chemistries. In this study, thematrix would represent Ni21-NTA resin, T7-antibody-linked agar-ose beads, bait-linked agarose beads, or a PS-20 (Ciphergen)protein chip surface.
Maintaining stringency parameters that retain the nativestates of bait and prey proteins, while minimizing the non-specific and matrix-dependent background inherent to eachtechnique, presents another important concern (Fig. 1). Dueto this, detection of transient or weak protein interactions, ascompared to nonspecific and/or matrix-dependent interac-tions, may not be feasible with some methods [14]. Someexperimental considerations for the techniques describedherein are summarized in Table 2. In addition, the way inwhich bait/prey protein samples are prepared (growth con-ditions, cell cycle stage at the time of harvesting, subcellularlocalization, method of cell lysis, subcellular fractionation
and/or purification, andPTMs) may also influence whetheror not a specific interaction is detected. Although Table 2 isby no means exhaustive, the variables mentioned therein areexcellent starting points for optimizing conditions in thedetection of protein interactions.
Recent evidence has called into question the reliability ofprotein–protein interaction data arising from molecular bi-ology-based approaches. It was found that a combination ofbiochemical, immunological, and physical methods, shownto be most reliable in the detection of known interactingproteins, is required in order to ascertain a true proteininteraction [15]. Each technique in isolation does not providesufficient evidence for the validation of a true protein inter-action. Therefore, it is a better practice to demonstrate aninteraction using multiple orthogonal techniques. Accord-ingly, appropriate controls are required in order to accountfor technique-specific backgrounds. Whether a prey proteinis interacting directly or indirectly with the bait protein mustbe determined as well (Fig. 1). Traditional protein interactionstudies have utilized techniques including affinity chroma-tography and co-IP. These methods are assessed here withreference to studying the “interactome profile” of a solubleEscherichia coli soluble bait protein, DmsD.
DmsD (ynfI) is a ,23.6 kDa cytosolic protein of mainlya-helical structure [16], belonging to a class of proteinstermed redox enzyme maturation proteins (REMPs) [17],DmsD is involved in the maturation of DMSO reductase, and
Table 2. Important parameters for protein–protein interaction detection experiments
Parameters Description
Purified bait proteinconcentrationa), b)
(1) Should exceed Kd of bait–prey binding, although this is not always known.(2) Allow for detection of weak or low-abundance prey protein interactions.(3) “Block” available matrix sites, thus minimizing matrix-dependent background.
Prey protein concen-trationa), b)
(1) Excessive concentrations may “force” competition between low-abundance interacting speciesand higher abundance nonspecific interactions, resulting in higher background.(2) Minimal concentration also compromises detection of lower abundance bait-interacting species.
Ionic strengthb) (1) Ionic strength present during the interaction should favor physiological bait–prey interaction condi-tions.(2) The ionic strength present in the wash steps should allow for reduction in matrix-dependent andnonspecific bait–prey interactions while maintaining specific interactions.
Detergent (1) Detergent concentration included in the washing steps should allow for reduction in matrix-depend-ent and nonspecific bait–prey interactions, while maintaining specific interactions.
Volume and frequencyof washes
(1) The volume, frequency and duration of the washes employed should not be so high as to wash offspecifically interacting species.(2) The volume of washes should allow for reduction in nonspecific and/or matrix-dependent back-ground.
Length of time/tempe-rature for bait–preyinteractionsb)
(1) Interaction time should not be so great as to promote an equilibrium shift towards excessive matrix-dependent interaction.(2) Stability of bait and prey proteins should be considered in selecting time and temperature parame-ters.(3) Kinetics of interaction differ at room temperature vs. at 47C.
a) Adapted from [4].b) Adapted from [5].
© 2006 WILEY-VCH Verlag GmbH & Co. KGaA, Weinheim www.proteomics-journal.com
Proteomics 2006, 6, 2050–2069 Technology 2053
is known to interact specifically with the N-terminal twin-ar-ginine leader region of the catalytic DmsA component of thereductase [16–21]. DmsD may also interact with the TatBCcomponents of the Tat translocase [22], which is utilized byseveral twin-arginine leader-containing redox enzymes forlocalization to the cytoplasmic or periplasmic faces of theE. coli inner membrane [23]. Little is known as to potentialproteins that may be interacting either directly or indirectlywith DmsD. Although the work describe here used DmsD asthe bait protein, the findings on background concerns areuniversal to in vitro protein–protein interaction studies.
Here, E. coli cultures were used as a prey source to assessDmsD–protein interaction profiles in vitro. TehB, a protein ofsimilar size and pI to the DmsD bait protein, but unrelated tothe DmsD system, was often used as a control. For the threein vitro techniques assessed here, purified bait protein con-taining a His6-T7-epitope fusion tag was first immobilized toa matrix and then exposed to subcellular prey fractions. Thistheoretically allows for access of all proteins in the prey mix-ture to the immobilized DmsD bait. Such in vitro approachespermitted relatively low concentrations of bait protein to beexposed to large volumes of extract at high protein con-centrations, theoretically allowing for the capture of evenlow-abundance prey proteins. In the cases of Ni21-affinitychromatography and co-IP, a copurification approach wasalso undertaken. Here, the bait protein of interest wasencoded by a plasmid harbored within the E. coli prey proteinsource, and expressed at low levels. Then, the bait proteinwas captured by virtue of the His6-T7-tag, along with anybound prey proteins.
In this study, we evaluate the in vitro protein interactionmethods of protein chips, affinity chromatography, co-IP,and coprecipitation, with a focus on identification of back-ground protein profiles inherent to each technique. TheDmsD bait protein was exposed to prey samples of cell-freesoluble and, in some cases, 2% CHAPS-solubilized mem-brane fractions from E. coli. This protein was chosen as itwas expected to have multiple protein–protein interactions ofvarious affinities. The focus of this paper is in the identifica-tion of proteins contributing to technique-specific back-ground. Our goal was to minimize trials for other research-ers, and thereby enhance the efficiency of identifying trueprotein interactors using these methods.
2 Materials and methods
2.1 Bait and prey protein sample preparation
E. coli C41(DE3) cells [24] were routinely used to harbor His6-T7-bait and His6-T7-control constructs. MC4100 [25] andMC4100/Dtat mutants were used as prey protein sources.E. coli HB101 chromosomal DNA was used as a template forall PCR cloning applications. N-terminally epitope-taggedDmsD bait was constructed as per Oresnick et al. [16] A con-trol protein of similar molecular weight but unrelated to the
system under study, TehB, was also constructed with a simi-lar N-terminal tag [26]. His6-T7-bait and control constructs inC41(DE3) were aerobically grown in seed cultures overnightin 10 mL Luria-Bertani (LB) media supplemented with0.1% w/v ampicillin at 377C for 16 h. Each overnight culturecontaining the His6-T7 constructs was grown in 1 L Furn-bachs containing LB media supplemented with 0.1% w/vampicillin. Cultures were grown to mid-log phase(OD600 = 0.5), induced with 0.5 mM isopropyl-B-D-thioga-lactoside (IPTG), and grown for an additional 3 h. Anaerobicstarter cultures were grown aerobically in LB media in 3 mLaliquots for 16 h at 377C, reinoculated into fresh LB media,and grown under similar conditions for an additional 8 h.Cells were then inoculated in a 1:100 ratio of cells to glucosepeptone fumarate media [22]. Cells were grown anaerobicallyin sealed carboys at 377C for 48–52 h, with gentle stirring.Cells were harvested by centrifugation at 40006g for 10 min.For His6-T7-bait and control constructs, cell pellets werewashed in buffer A (50 mM Tris-HCl, pH 8.0, 500 mM NaCl,5 mM imidazole, 1 mM DTT). Cells were centrifuged for anadditional 38006g for 10 min, and resuspended in the ap-propriate buffer in a ratio of 2:1 buffer A to cells. Anaerobi-cally grown cells were similarly treated, but were suspendedin buffer B (50 mM NaH2PO4, pH 8.0, 300 mM NaCl) orbuffer C (140 mM NaCl, 8 mM NaH2PO4, 2 mM K2PO4,10 mM KCl, pH 7.4), depending on the experiment per-formed. Cells were stored at 2807C. Following the additionof 100 mM phenylmethylsulfonyl fluoride (PMSF), cells werelysed by three passages through a French pressure cell at16 000 lb/in.2, and cell-free extracts were obtained by cen-trifugation at 12 0006g for 30 min. The resulting low-speedpellets were discarded. Soluble fractions were further sepa-rated from membrane components by ultracentrifugation at118 0006g for 90 min. Soluble fractions were flash frozen inliquid nitrogen and stored at 2807C. Membrane fractionsfrom aerobically grown cells overexpressing His6-T7-taggedprotein were discarded. Following ultracentrifugation, anae-robically grown cell membranes were homogenized in,20 mL of the appropriate buffer (buffer B or C) per pelletaccording to the type of experiment performed. Homoge-nized membranes were repelleted for 118 0006g for 1.5 h.Washed membranes were homogenized and resuspended ina minimal amount of buffer B or C, and incubated on icewith 2% v/v CHAPS for 2 h with intermittent mixing inorder to ensure solubilization of membrane-associated pro-teins. 2% CHAPS-solubilized membrane proteins wereobtained following ultracentrifugation for 1.5 h at106 0006g, or at 250 0006g for 35 min.
All His6-T7 protein purifications were performed on anAKTA purifier 10/100 system using Unicorn Software, ver-sion 3.10 (Pharmacia). Supernatant fractions of clarified cell-free extracts containing overexpressed His6-T7-tagged pro-teins were loaded onto an XK-16 column (Amersham Phar-macia) containing Ni21-NTA Superflow metal chelating resinpre-equilibrated with binding buffer (50 mM Tris-HCl,pH 8.0, 500 mM NaCl, 5 mM imidazole). The column was
© 2006 WILEY-VCH Verlag GmbH & Co. KGaA, Weinheim www.proteomics-journal.com

2054 J. M. Howell et al. Proteomics 2006, 6, 2050–2069
washed with wash buffer (50 mM Tris-HCl, pH 8.0, 500 mMNaCl, 50 mM imidazole), and His6-tagged proteins wereeluted from the column with elution buffer (50 mM Tris-HCl, pH 8.0, 500 mM NaCl, 250 mM imidazole). Pooled ali-quots of eluted His6-T7 protein were passed through a pre-equilibrated Hi-Trap column (10 mL cv, Amersham Phar-macia) into buffer B or C. Following protein concentrationdetermination using a modified Lowry assay [27] and samplepurity determination by SDS-PAGE, samples were stored at47C, or divided into 500 mL aliquots, flash frozen in liquidnitrogen, and placed at 2207C for long-term storage.
2.2 Protein interaction approaches and protein
identification methods
2.2.1 Protein chip protocol
All Ciphergen chips were read in a PBS-II ProteinChipreader (Ciphergen Biosystems), using Ciphergen softwareversion 3.0. PS-20 chips (8-spot, A-H configuration) wereused for all protein interaction studies. Steps for protein–protein interaction profiling applications were carried out ina humidity chamber with PS-20 chips pre-equilibrated with3 mL of buffer B. Purified proteins in buffer B were adjustedto a final concentration of 0.5 mg/mL, and 1 mL of each wasapplied to the chips, such that all purified protein sampleswere applied to at least two spots. Samples were incubatedfor 4 h at room temperature in a humidity chamber to allowcovalent attachment of the proteins to the surface. Unbound,activated sites were blocked with 3 mL of Tris-HCl (1 M,pH 8.0), and incubated at room temperature for 30 min.Unbound proteins were removed by bulk washing each chiparray twice in a 15 mL tube containing 7 mL PBS 1 0.1%TritonX-100 (TX-100) for 15 min on a rotating platform. TheTX-100 detergent was removed from the arrays by bulkwashing twice with PBS, 5 min per wash. Chips were routi-nely bulk-incubated with 7 mL of either soluble or mem-brane fractions at a concentration of ,10 mg/mL along with0.1% TX-100 for soluble samples to minimize nonspecificbinding. Incubations were carried out for 12–15 h at 47C on arotating platform. Arrays were bulk rinsed in PBS (7 mL perarray), and then individual spots were washed with 5 mL ofbuffer B pipetted on and off three times per wash. The spotswere allowed to air dry, followed by 260.5 mL applications ofa saturated solution of sinnapinic acid in 50% ACN/0.5% TFA. Arrays were analyzed in the PBS ProteinChip IIreader using a chip protocol specifying an optimizationrange of between 5 and 50 kDa, a laser intensity of 10 and asensitivity of 230. Spectra resulting from replicate proteinspots were averaged, and tag- or array-dependent interac-tions were subtracted from each spectrum using the aver-aged spectra obtained from the His6-T7-control protein. Allspectral manipulations were performed using Ciphergensoftware version 3.0.
2.2.2 Ni21-affinity chromatography
Ni21-NTA agarose resin (Qiagen) in 0.25–1.0 mL bedvolumes was poured into 2 mL BioRad mini-columns. Allexperiments were performed using gravity flow. Interactionequilibrations were customarily carried out at 47C. Routinely,Ni21-affinity and Hi-Trap purified fusion constructs in buf-fer B (100–200 mg total protein) were applied to columns pre-equilibrated with buffer B 1 5 mM imidazole, and incubatedend-over-end for 1 h. Columns were rinsed with 12 cv ofbuffer B buffer 1 5 mM imidazole. Ni21-NTA resin withimmobilized purified bait proteins was bulk incubated withsoluble fractions or with membrane fractions derived fromthe anaerobically grown cultures. Columns were routinelyincubated with 3–4 cv of cell fraction end-over-end for 1.5–3 h. Columns were then washed with buffer B supplementedwith 25 mM imidazole, and varying salt and detergent con-centrations according to the experiment, until wash fractionsgave minimal A280 readings. Bound proteins were eluted inbuffer B 1 250 mM imidazole, and fractions were analyzedvia SDS-PAGE.
2.2.3 Co-IP protocol
The Pierce ProFound co-IP Kit was used to perform co-IPexperiments. T7-mAb (Novagen) was covalently immobilizedovernight at 47C to the AminoLink agarose resin, accordingto the manufacturer’s instructions (50 mg antibody per100 mL AminoLink settled beads). Monoclonal T7-antibody-linked gel samples, along with parallel control gel sampleswere incubated with membrane (1000 mg total protein) orsoluble fractions (8000 mg total protein) from anaerobicallygrown MC4100 cells harboring the pTDMS28 plasmid(encoding the His6-T7-bait) for 2 h at room temperature.Wash steps were performed with buffer C until A280 of 0.01or less was reached. Any remaining bound proteins wereeluted with elution buffer (Immunopure® IgG elution buf-fer, pH 2.8), and 50 mL fractions were collected. Eluted frac-tions were analyzed via SDS-PAGE.
2.2.4 Coprecipitation protocol
Experiments were performed with AminoLink resin towhich bait protein had been directly coupled. Overexpressed,purified bait protein was dialyzed overnight in buffer D(50 mM NaH2PO4, pH 7.2, 150 mM NaCl, 1 mM DTT).Immobilization steps were carried out using ,1000 mg pu-rified protein per 200 mL of settled gel. Protein immobiliza-tion steps were carried out according to the manufacturer’sinstructions. Samples were incubated end-over-end at roomtemperature with 26400 mL soluble fractions from anaero-bic WT MC4100 for 1.5 h per incubation. Control gel sam-ples along with quenched AminoLink gel samples weresimilarly treated, however, AminoLink samples without pro-tein bound were incubated with the supplied QuenchingBuffer® (1 M Tris-HCl, pH 7.4), yielding a quenched resin.
© 2006 WILEY-VCH Verlag GmbH & Co. KGaA, Weinheim www.proteomics-journal.com

Proteomics 2006, 6, 2050–2069 Technology 2055
In all cases, washes were performed as described above togive minimal A280 readings, and samples were eluted fromthe various resins in 50–200 mL aliquots using 4 M urea,pH 7.5, rather than the supplied elution buffer.
2.2.5 SDS-PAGE methods
Samples were resuspended in ,10 mL of Laemmli solubili-zation buffer per well and heated for 10 min at 957C prior toloading. Solubilized membrane samples were incubatedwith the same ratios of LSB (but with ,3.8% SDS), andincubated at room temperature for 1 h or longer prior toloading onto discontinuous SDS-PAGE gels with 5% stack-ing and 12% separating components. Low molecular weightstandards (BioRad), suspended in LSB, were loaded as con-trols. Gels were run at 25 volts until samples entered theseparating gel, then at 100 volts. Gels were stained withCoomassie Blue.
2.2.6 Protein identification methods: Peptide
mapping
Samples were excised from Coomassie-stained SDS-PAGEgels and subjected to a 16 h, 377C in-gel trypsin digestionaccording to the ProteinChip® Applications Guide (Cipher-gen Biosystems). Individual spots on Ciphergen H4 proteinchips were prewet with 50% ACN prior to application of,2 mL of trypsin digest solution. Samples were air dried, andany residual salts were removed by a 5 mL ddH2O wash perspot. Samples were cocrystallized with 260.5 mL applica-tions of matrix (20% a-hydroxycinnamic acid in 50% ACN/0.5% TFA), and allowed to dry between applications. PMFwas performed with a PBS-II protein chip reader usingmanual optimization settings of 1000–5000 Da, with a highmass acquisition of 6000 Da, and a lag time of 320 ns. Typi-cal detector sensitivities used ranged from 2 to 7, and laserintensities of 120–150, and were optimized for individualsamples. At least 100 transients per sample were averaged,and the resulting spectra saved for future analysis. In allcases, the PBS-II ProteinChip instrument recorders werecalibrated prior to peptide mass analysis with a 1/10 dilutionof all-in-one peptide standards (Ciphergen) in 20% matrix,using the calibration dialog in the Ciphergen software.Internal calibration was performed using the appropriatedilution of Ciphergen all-in-one peptide standards, whichgave peaks of similar size to the sample peaks at the opti-mized laser intensity and sensitivity measurements. Spectrawere calibrated internally by a similar method as describedabove. Trypsin digest peaks were imported into MASCOT,PeptIDent, or ProFound databases for analysis. Identitieswere assigned based on data that were statistically significant(e.g., MASCOT score .50).
2.2.7 LC-MS/MS
Alternatively, gel regions of interest were excised and sub-jected to in-gel trypsin digestion followed by RP chromatog-raphy and tandem mass spectrometric analysis at the Ge-nome BC Proteomics Center, University of Victoria, BritishColumbia, Canada.
2.2.8 Protein profile analysis
For gel profile analysis, Kodak 1D Image Analysis Softwarewas used to assign molecular masses as well as to generateprofile information. Data were further analyzed in Excel®.
3 Results
3.1 Method 1: Protein chip approach
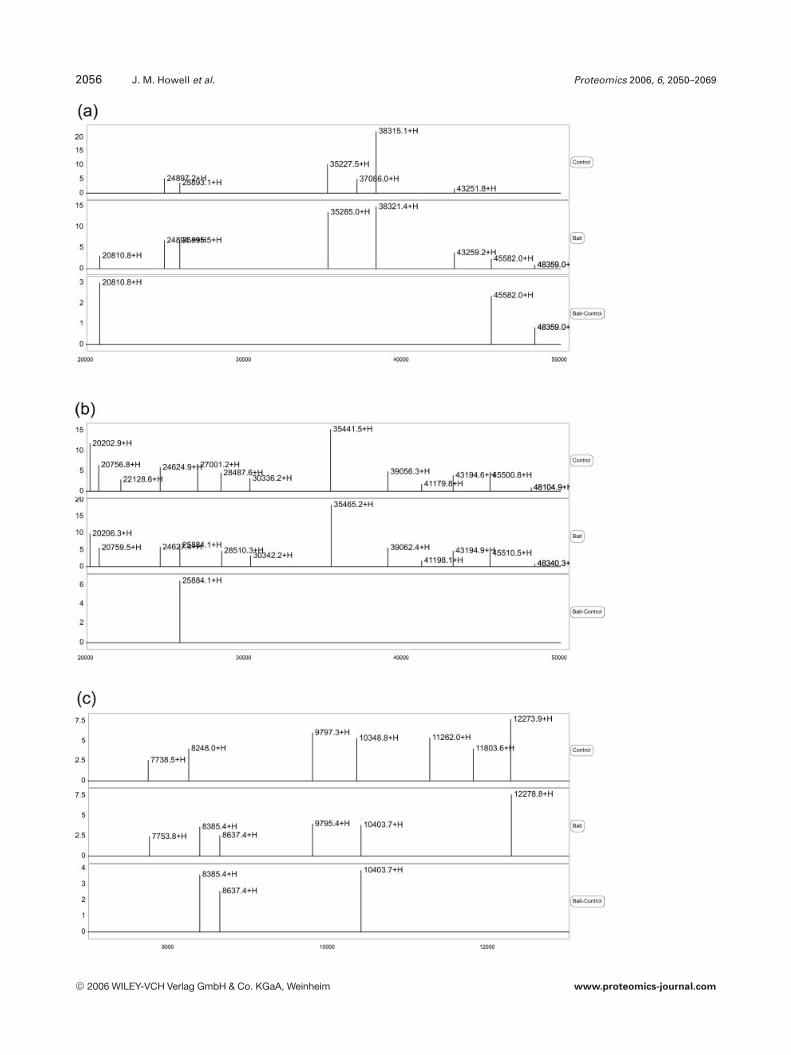
This approach used protein chip arrays with preactivatedsurfaces (PS-20) containing epoxy groups that enable thecovalent attachment of bait proteins via amine groups on theN-termini or side chains. Indeed, protein chips in conjunc-tion with SELDI-TOF/MS have been used successfully toevaluate differences in protein profiles in various bacterialstrains [28]. To date, no examples exist in the literature for theuse of PS-20 chips in protein interaction profiling. Since thistechnique yields m/z ratios of proteins desorbed from sam-ple spot following interaction and washing steps, sample-specific mass profiles can be generated and thus used forprotein–protein interaction profiling (Fig. 2). Followingcovalent attachment of the purified DmsD bait and controlprotein (TehB; a similar pI and mass to DmsD but unrelatedfunctionality with equivalent expression tag and purificationconditions) to the chip surfaces, the entire chip can be bulk-incubated with cell-free soluble or membrane prey proteinisolates. After the incubation, chips are rinsed and individualspots analyzed for interacting proteins using establishedSELDI-TOF/MS methods.
3.1.1 Background protein profiles on Ciphergen®
PS-20 protein chip arrays
Protein background on the PS-20 chip arrays can be easilycontrolled using software that enables subtraction of back-ground and/or His6-T7-epitope tag-dependent proteins toobtain a “bait-specific” profile. Examples of the binding pro-files for the control protein, as compared to the bait proteinof interest are depicted in Fig. 2. Following averaging of baitand control spectra, and subsequent subtraction of commonpeaks, proteins from various E. coli subcellular fractionswere identified as uniquely interacting with the bait proteins(Fig. 2a–d).
© 2006 WILEY-VCH Verlag GmbH & Co. KGaA, Weinheim www.proteomics-journal.com
2056 J. M. Howell et al. Proteomics 2006, 6, 2050–2069
© 2006 WILEY-VCH Verlag GmbH & Co. KGaA, Weinheim www.proteomics-journal.com
Proteomics 2006, 6, 2050–2069 Technology 2057
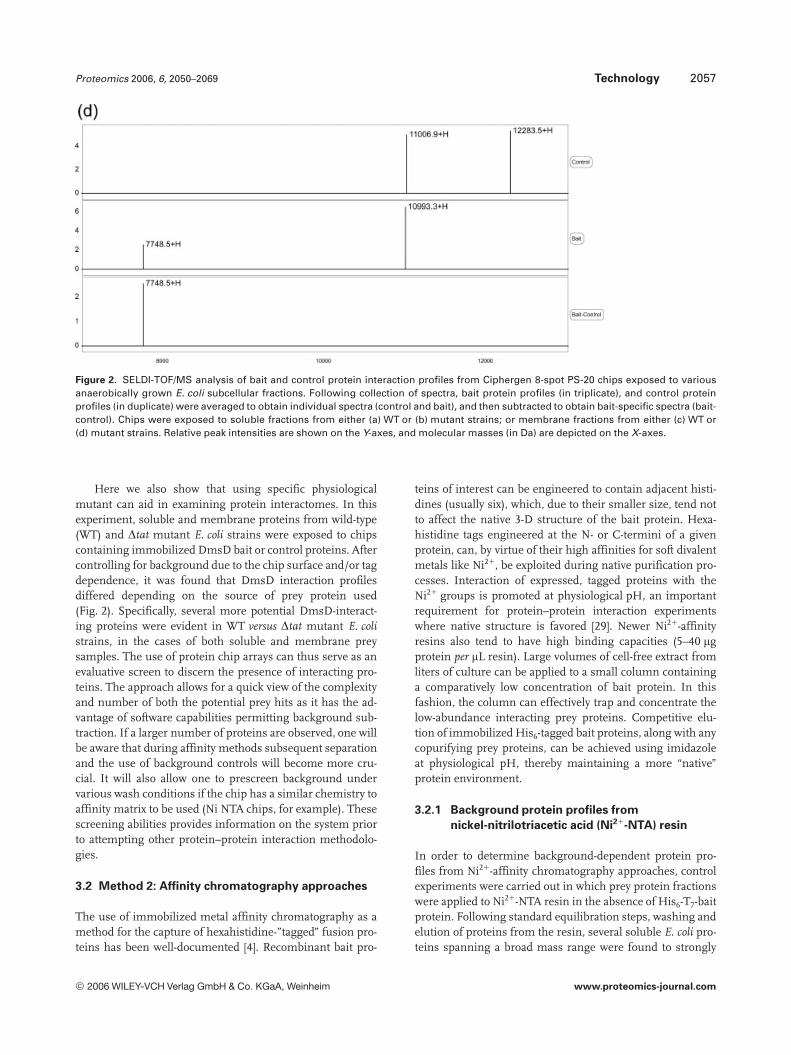
Figure 2. SELDI-TOF/MS analysis of bait and control protein interaction profiles from Ciphergen 8-spot PS-20 chips exposed to variousanaerobically grown E. coli subcellular fractions. Following collection of spectra, bait protein profiles (in triplicate), and control proteinprofiles (in duplicate) were averaged to obtain individual spectra (control and bait), and then subtracted to obtain bait-specific spectra (bait-control). Chips were exposed to soluble fractions from either (a) WT or (b) mutant strains; or membrane fractions from either (c) WT or(d) mutant strains. Relative peak intensities are shown on the Y-axes, and molecular masses (in Da) are depicted on the X-axes.
Here we also show that using specific physiologicalmutant can aid in examining protein interactomes. In thisexperiment, soluble and membrane proteins from wild-type(WT) and Dtat mutant E. coli strains were exposed to chipscontaining immobilized DmsD bait or control proteins. Aftercontrolling for background due to the chip surface and/or tagdependence, it was found that DmsD interaction profilesdiffered depending on the source of prey protein used(Fig. 2). Specifically, several more potential DmsD-interact-ing proteins were evident in WT versus Dtat mutant E. colistrains, in the cases of both soluble and membrane preysamples. The use of protein chip arrays can thus serve as anevaluative screen to discern the presence of interacting pro-teins. The approach allows for a quick view of the complexityand number of both the potential prey hits as it has the ad-vantage of software capabilities permitting background sub-traction. If a larger number of proteins are observed, one willbe aware that during affinity methods subsequent separationand the use of background controls will become more cru-cial. It will also allow one to prescreen background undervarious wash conditions if the chip has a similar chemistry toaffinity matrix to be used (Ni NTA chips, for example). Thesescreening abilities provides information on the system priorto attempting other protein–protein interaction methodolo-gies.
3.2 Method 2: Affinity chromatography approaches
The use of immobilized metal affinity chromatography as amethod for the capture of hexahistidine-”tagged” fusion pro-teins has been well-documented [4]. Recombinant bait pro-
teins of interest can be engineered to contain adjacent histi-dines (usually six), which, due to their smaller size, tend notto affect the native 3-D structure of the bait protein. Hexa-histidine tags engineered at the N- or C-termini of a givenprotein, can, by virtue of their high affinities for soft divalentmetals like Ni21, be exploited during native purification pro-cesses. Interaction of expressed, tagged proteins with theNi21 groups is promoted at physiological pH, an importantrequirement for protein–protein interaction experimentswhere native structure is favored [29]. Newer Ni21-affinityresins also tend to have high binding capacities (5–40 mgprotein per mL resin). Large volumes of cell-free extract fromliters of culture can be applied to a small column containinga comparatively low concentration of bait protein. In thisfashion, the column can effectively trap and concentrate thelow-abundance interacting prey proteins. Competitive elu-tion of immobilized His6-tagged bait proteins, along with anycopurifying prey proteins, can be achieved using imidazoleat physiological pH, thereby maintaining a more “native”protein environment.
3.2.1 Background protein profiles from
nickel-nitrilotriacetic acid (Ni21-NTA) resin
In order to determine background-dependent protein pro-files from Ni21-affinity chromatography approaches, controlexperiments were carried out in which prey protein fractionswere applied to Ni21-NTA resin in the absence of His6-T7-baitprotein. Following standard equilibration steps, washing andelution of proteins from the resin, several soluble E. coli pro-teins spanning a broad mass range were found to strongly
© 2006 WILEY-VCH Verlag GmbH & Co. KGaA, Weinheim www.proteomics-journal.com
2058 J. M. Howell et al. Proteomics 2006, 6, 2050–2069
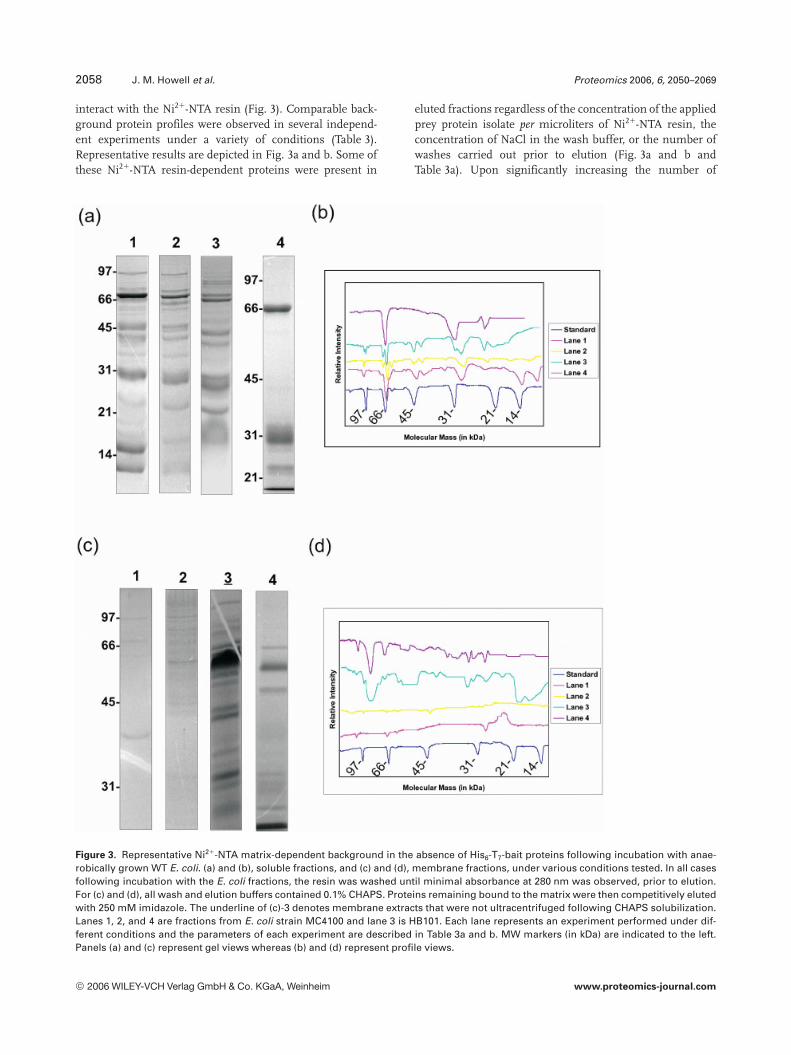
interact with the Ni21-NTA resin (Fig. 3). Comparable back-ground protein profiles were observed in several independ-ent experiments under a variety of conditions (Table 3).Representative results are depicted in Fig. 3a and b. Some ofthese Ni21-NTA resin-dependent proteins were present in
eluted fractions regardless of the concentration of the appliedprey protein isolate per microliters of Ni21-NTA resin, theconcentration of NaCl in the wash buffer, or the number ofwashes carried out prior to elution (Fig. 3a and b andTable 3a). Upon significantly increasing the number of
Figure 3. Representative Ni21-NTA matrix-dependent background in the absence of His6-T7-bait proteins following incubation with anae-robically grown WT E. coli. (a) and (b), soluble fractions, and (c) and (d), membrane fractions, under various conditions tested. In all casesfollowing incubation with the E. coli fractions, the resin was washed until minimal absorbance at 280 nm was observed, prior to elution.For (c) and (d), all wash and elution buffers contained 0.1% CHAPS. Proteins remaining bound to the matrix were then competitively elutedwith 250 mM imidazole. The underline of (c)-3 denotes membrane extracts that were not ultracentrifuged following CHAPS solubilization.Lanes 1, 2, and 4 are fractions from E. coli strain MC4100 and lane 3 is HB101. Each lane represents an experiment performed under dif-ferent conditions and the parameters of each experiment are described in Table 3a and b. MW markers (in kDa) are indicated to the left.Panels (a) and (c) represent gel views whereas (b) and (d) represent profile views.
© 2006 WILEY-VCH Verlag GmbH & Co. KGaA, Weinheim www.proteomics-journal.com
Proteomics 2006, 6, 2050–2069 Technology 2059
Table 3. Experimental parameters explored in Figs. 3, 4
(a)
Lane No. Soluble fractions
1 2 3 4
Prey protein concentration, mg/mL resin 20 20 30 45Incubation, time/temperature 1 h/47C 1 h/47C 1 h/47C 2 h/47CWash conditions: Buffer B 1 25 mM imidazole No change 1 M NaCl No change No changeWashes prior to elution (in cvs) 11 11 22 42Relative background levels Med/high Med/high Med/high Med
(b)
Lane No. Membrane fractions
1 2 3 4
Prey protein concentration, mg/mL resin 16 20 12 8.5Incubation, time/temperature 1 h/47C 1 h/47C 2 h/47C 30 min/room temp.Washes prior to elution (in cvs) 8 8 12 18Relative background levels Low Low High Med/low
(c)
Panel Soluble fractions Membrane fractions
A B C D
Prey protein concentration, mg/mL resin 30 30 12 12Incubation time/temperature 30 min/room temp. 2 h/47C 30 min/room temp. 2 h/47CWash conditions: Buffer B 1 25 mM imidazole 10.1% Tween 20 10.1% Tween 20 1500 mM NaCl 1500 mM NaClWashes prior to elution (in cvs) 22 22 9 12Relative background levels Med/low Med/low Med/low High
washes prior to elution (Fig. 3a and b, lane 4), the bindingof resin-dependent proteins was observed to be substantiallyreduced. In cases of membrane-derived prey protein sam-ples applied to the Ni21-NTA resin, reduced levels of back-ground protein binding were observed relative to that seenwith soluble prey proteins (Fig. 3c and d; Table 3b). In part,this may arise from the lower prey protein concentrationapplied per microliter resin, as compared to the solubleprotein fractions (compare Table 3a and b). Further, Ni21-NTA resin background protein profiles appeared to be lim-ited to higher mass ranges (,66 kDa and above), unlikesoluble prey samples, where background spans a widermass range (Fig. 3a and b, lanes 1–3; Fig. 3c and d, lanes 1,2, and 4). For prey protein samples derived from mem-branes following 2% CHAPS solubilization (Fig. 3c and d,lane 3), several more background proteins, spanning abroader mass range, were observed upon elution, possiblythe result of the presence of contaminating nonsolubilizedproteoliposomes. The enhanced incubation time for Fig. 3cand d, lane 3 may similarly contribute to higher back-ground.
3.2.2 Background protein profiles from Ni21-NTA
resin using a His6-T7 control protein
Experiments like those described above were carried outusing the His6-T7-TehB control protein as bait. It was hopedthat inclusion of this unrelated protein would provideanother level of control by accounting for any His6-T7 tag-specific interaction events. This was undertaken for bothsoluble and membrane prey protein samples, and examplesof protein elution profiles are shown in Fig. 4. Again, as forNi21-NTA resin-dependent background (Fig. 3), the preyprotein concentration per microliter of resin and the washstringency also influenced the protein profile observed uponelution (Fig. 4a–d, see Table 3c). Comparison of the elutionprofiles from the His6-T7-TehB control protein with thoseobserved for resin-dependent background in parallel experi-ments indicates relatively few differences, under a variety ofconditions, despite the high concentrations of His6-T7-TehBpresent (Fig. 4a–d). This suggested that any His6-T7 tag-de-pendent interactions, if they do occur in the context of theNi21-NTA resin, are minimal and/or masked by resin-
© 2006 WILEY-VCH Verlag GmbH & Co. KGaA, Weinheim www.proteomics-journal.com

2060 J. M. Howell et al. Proteomics 2006, 6, 2050–2069
Figure 4. Representative Ni21-NTA matrix-dependent back-ground in the presence or absence of the His6-T7-control proteinfollowing incubation with anaerobically grown WT E. coli solubleand membrane fractions. (a) and (b), soluble fractions; (c) and (d),membrane fractions under various conditions tested (as de-scribed in Table 3c). In all cases following incubation with theE. coli fractions, the resin was washed until minimal absorbanceat 280 nm was observed prior to elution and analysis by standardSDS-PAGE procedures. Proteins remaining bound to the matrixwere then competitively eluted with 250 mM imidazole. Under-line denotes membrane extracts that were not ultracentrifugedfollowing CHAPS solubilization. MW markers (in kDa) are indi-cated to the left. Arrows denote the presence of the His6-T7-con-trol protein.
dependent background proteins under the conditions tested.Thus, Ni21-NTA resin, with or without a bound His6-T7-con-trol, was deemed an appropriate control for His6-T7-baitinteraction experiments using this technique.
3.2.3 Identification of Ni21-matrix-dependent
background proteins
Eluted samples from a representative Ni21-NTA resin affinityexperiment using DmsD- as well as TehB-immobilized resin,to which E. coli soluble fractions had then been exposed,were subjected to in-gel trypsin digestion and analysis by LC-MS/MS. Several proteins common to these eluted fractionsare identified in Table 4. Some of these E. coli proteins havealready been shown to interact strongly with other divalentcations such as ribosomal protein L2, the ferric uptake reg-ulation protein, and an FKBP-type protein encoded by slyD[30–33]. Despite potentially informative “hits” obtained forthe DmsD bait protein (data not shown), inclusion of parallelHis6-T7-TehB controls was clearly of great importance inensuring that identified interacting proteins were indeedbait-dependent, and not the result of interactions with resin,His6-T7 tags, and/or proteins that themselves interact withbackground proteins. These findings (Table 4) are of partic-ular relevance for studies involving Ni21-affinity chromatog-raphy and endogenous E. coli proteins, or of exogenous pro-teins expressed in E. coli.
3.2.4 Identification of potential bait–prey
interactions
Previously, Ni21-NTA experiments, in which overexpressed,purified control or DmsD bait proteins were preincubatedwith the resin prior to the addition of prey protein fractions,have provided evidence for specific DmsD-dependent proteininteractions [16]. Over the course of several Ni21-NTAexperiments using a variety of experimental parameters,other DmsD interactors of potential physiological relevancewere also identified (J. Howell and R. J. Turner, submitted).Here we show how the use of a mutant strain can capture aprotein–protein interaction. Despite stringent washing(28 column volume (cv)) with both 500 mM NaCl and0.1% Tween, upon exposure of WT and Dtat mutant solubleprotein fractions to Ni21-NTA resin prebound with bait orcontrol protein, an ,85 kDa species from the mutant preyproteins was selectively retained (Fig. 5, lane 2). This proteinwas subsequently identified as a paralog of DmsA, and alsocontained a twin-arginine leader, demonstrating that Ni21-affinity techniques in this case were successful in capturing aDmsD interactor of potential physiological relevance.
3.2.5 Identification of Ni21-matrix-dependent
background proteins from copurification
experiments with a His6-bait protein
In the previous experiment, purified protein was bound tothe Ni-NTA followed by exposure to cell extracts. In thecopurification approach, the bait protein is expressed at “lowlevels” and then the interacting proteins are “copurified”under low stringency conditions. As for the in vitro Ni21-af-finity experiments (see above), the Ni21-NTA resin-depend-
© 2006 WILEY-VCH Verlag GmbH & Co. KGaA, Weinheim www.proteomics-journal.com

Proteomics 2006, 6, 2050–2069 Technology 2061
Table 4. Proteins from anaerobically grown soluble fractions from E. coli MC4100 contributing to Ni21-NTA matrix-dependent background
Gene namea) GInumber Descriptiona) Mw (mature), kDaa)
ygfK 20140976 Putative selenate reductase 115.5adhE 1805517 Aldehyde-alcohol dehydrogenase 96.0pflB 13360445 Pyruvate formate-lyase 85.2glmS 3915705 Glucosamine-fructose-6-P aminotransferase 66.7yeiH 7465981 Hypothetical 36.9ybiB 13360337 Hypothetical 34.9yrbG 7465977 Metal cation exchanger 34.7hchA 42543304 Chaperone protein 31.1rplB 42560210 Large ribosomal protein L2 29.7bcr-rplY intergenic region 7449562 Hypothetical 25.9crp 117484 Catabolite gene activator 23.5yqjI 54042857 Hypothetical 23.3ycfP 28381412 Putative hydrolase 23.2speG 584793 Spermidine-N-acetyltransferase 21.8slyD 13363673 Fkbp-type peptidyl–prolyl-cis-trans isomerase 20.9fur 120614 Ferric uptake regulation protein 16.6hfq 537013 RNA binding protein chaperone 11.0rpsO 133794 16S rRNA binding 10.1
a) From http://www.ecocyc.org
Figure 5. Representative results from a Ni21-affinity interactionexperiment following exposure to WT and mutant soluble preyprotein fractions. Ni21-affinity resin was preloaded with aero-bically purified, overexpressed His6-T7-bait (lanes 1 and 2) orHis6-T7-control proteins (lanes 3 and 4), prior to incubation withWT (lanes 1 and 3) or mutant (lanes 2 and 4) soluble fractions.Each resin sample was incubated with 80 mg prey protein/mL resinfor 3 h at 47C, and washed with 28 cv of buffer B (500 mMNaCl) 1 0.1% Tween-20 1 25 mM imidazole prior to elution andanalysis by standard SDS-PAGE procedures. Arrow indicatesenriched, unique species from the mutant prey samples interact-ing with the His6-T7-bait. MW markers (in kDa) are indicated to theleft.
ent elution profiles for the His6-T7-control protein (MC4100/pTWT124), and the empty vector (MC4100/pRSETA), didnot differ significantly (data not shown), and were compara-ble to previous background profiles (Fig. 4). Figure 6a,lanes 2 and 3, highlights similarities in resin-dependent,high-molecular weight background. In replicate experi-ments, increasing washing steps from 22 to 42 cv prior toelution had no discernable effect on resin-dependent back-ground, nor did the His6-T7-controls differ markedly fromthe empty vector controls (compare Fig. 6a and b, lanes 2 and3), again highlighting the fact that the His6-T7 tag does notcontribute substantially to the matrix background profile.However, two protein species at ,90 and 50 kDa were foundonly with the His6-T7-bait (Fig. 6a, lane 1). As these proteinsare present following a fairly long wash interval (22 cv), thissuggested that the bait-dependent proteins are bound tightly;following washes with 42 cv prior to elution, these species at,90 and ,50 kDa were no longer detectable (Fig. 6b, lane 1).
3.3 Method 3: Co-IP approaches
Co-IP has traditionally involved the incubation of a bait pro-tein-specific antibody with a cell lysate. In the originalapproach, upon addition of immobilized protein A or prote-in G, the bait-specific antibody, along with the bait proteinand any bait-associated proteins, can be coprecipitated andthen washed, eluted, and analyzed by conventional means[4]. This technique is of benefit in that antibody specificitytowards the bait protein (antigen) is high, and this is usuallytrue for monoclonal antibodies. Recent co-IP techniqueshave also utilized covalent attachment of the bait-specificantibody to a support matrix. Thus, upon elution of the bait
© 2006 WILEY-VCH Verlag GmbH & Co. KGaA, Weinheim www.proteomics-journal.com

2062 J. M. Howell et al. Proteomics 2006, 6, 2050–2069
Figure 6. Representative results from a copurification Ni21-affin-ity approach following Ni21-NTA resin exposure to soluble preyprotein fractions from anaerobically grown E. coli containingplasmids encoding His6-T7-bait and control proteins. (a) Samplesof 30 mg of prey protein per microliter resin were incubated for2 h at 47C, followed by 22 cv of buffer B 125 mM imidazole 1 0.1%Tween-20 prior to elution. Lane 1, MC4100/pTDMS28; lane 2MC4100/pTWT124; lane 3, MC4100/pRSETA. (b) Similar experi-ment as in (a), however with 42 cv of wash buffer applied prior toelution and analysis by standard SDS-PAGE procedures. Proteinsappearing to interact either directly or indirectly with the baitprotein of interest are indicated with asterisks, all other bands arethe result of bait independent background. MW markers (in kDa)are shown to the left.
protein and any (directly or indirectly interacting) prey pro-teins, the bait-specific antibody is retained on the matrix.This presents a significant advantage in that the covalentlyimmobilized antibody can no longer occlude detection ofcoimmunoprecipitated proteins [34]. Furthermore, due tothe specificity of the antibody for the antigen, interactionexperiments can be carried out under less stringent condi-tions, more closely mimicking the in vivo state, and thus maypotentially identify a greater number of physiologically rele-vant interactors. A similar technique, coprecipitation, wasalso assessed: here, purified bait protein was directly immo-bilized to the activated matrix at high protein to agaroseratios [8]. Immobilized bait proteins were then exposed toE. coli protein extracts. As with the co-IP technique usingimmobilized antibody, the covalent immobilization of highlevels of bait protein was anticipated to be an advantage uponelution, since the bait proteins would be retained on thematrix. This is unlike the Ni21-NTA affinity approach, whichresulted in the elution of the His6-bait protein, contributingto the potential occlusion of interacting proteins of compa-rable molecular size.
3.3.1 Background protein profiles from co-IP
techniques
Prior to conducting co-IP experiments, both anti-T7-antibody-linked agarose beads and nonactivated control beads (Pierce®)were incubated with purified, His6-T7 epitope-tagged DmsD inorder to verify binding to the mAb, and retention of the baitprotein through several wash steps. Compared to the controlresin, the DmsD bait protein was selectively retained on the
anti-T7-resin (data not shown). Co-IP experiments were thenundertaken with E. coli MC4100/pTDMS28 soluble andmembrane fractions, containing both bait and prey proteinswithin the same cellular source; parallel experiments werecarried out using nonactivated control beads. In the case ofMC4100/pTDMS28 soluble fractions, the bait protein wasprecipitated along with a species at ,40 kDa (Fig. 7a and b,lane 1, asterisk). For co-IP experiments carried out usingmembrane fractions, lower MW species of ,18 and ,16 kDa,respectively, were coprecipitated (Fig. 7c and d, lane 1). De-spite the high ratio of prey protein concentration to resin used(,600 mg prey protein/mL resin), little if any background wasevident in the control samples upon elution from the agarosesupport (Fig. 7a–d, lane 2).
3.3.2 Background protein profiles from
coprecipitation techniques
Overexpressed, purified bait protein was covalently immobi-lized to the AminoLink® resin, and then exposed to E. coliextracts. Initially, the supplied control resin was utilized toaccount for any matrix dependence (data not shown). How-ever in coprecipitation experiments, it was later discoveredthat the quenched AminoLink resin exhibited significantlygreater background levels as compared to the control resin.Accordingly, subsequent experiments were designed toinclude His6-T7-DmsD, the control agarose, a quenched,activated resin control, as well as activated resin to which theHis6-T7-TehB control protein was immobilized (Fig. 8a). Al-though very little protein was present in the elutionsobtained from the control resin sample (Fig. 8a, lane 2), sev-eral proteins were observed for the quenched activated resin1/2 His6-T7-TehB control protein (Fig. 8a, lanes 3 and 4). Asfor Ni21-NTA affinity experiments (see above), either quen-ched, AminoLink resin alone or with bound His6-T7-controlwere again found to be appropriate controls for bait–preyinteraction experiments using this technique. Using con-centrations of purified bait protein in excess of 2 mg permicroliters of resin during the immobilization steps andquenched AminoLink resin as a control, revealed similarprotein elution profiles from the AminoLink which can beactivated resin (Fig. 8b, lanes 1 and 3). Figure 8b, lane 1,established that the bait protein of interest remainedattached to the resin throughout the experiment until thepoint of elution. In an effort to minimize loss of less tightlybound bait-dependent proteins, fewer washes were carriedout. Although this led to more background, the protein elu-tion profiles corresponding to the AminoLink matrix werequite consistent (Fig. 8a and b).
3.3.3 Reduction of background protein profiles
during coprecipitation
Increased or prolonged washing, aimed to reduce levels ofnonspecifically bound proteins, can also contribute to loss ofbait-specific protein interactions (as was the case for Ni21-
© 2006 WILEY-VCH Verlag GmbH & Co. KGaA, Weinheim www.proteomics-journal.com

Proteomics 2006, 6, 2050–2069 Technology 2063
Figure 7. Representative results from a co-IP experiment depicting potential bait-interacting proteins eluted from anti-T7-linked and controlagarose beads following exposure to soluble and membrane fractions from anaerobically grown WT E. coli. (a) and (b), incubation withsoluble MC4100/pTDMS28. Samples of 640 mg of prey protein per microliter of antibody-linked resin were incubated for 2 h at room tem-perature, followed by washing ten times (400 mL each) with buffer C prior to elution. Lane 1: eluted fractions from anti-T7-linked agarosebeads. Lane 2: eluted fractions from control beads (no T7-antibody). (c) and (d) Incubation with MC4100/pTDMS28. Samples of 80 mg preyprotein per microliter of anti-T7-antibody-linked resin was incubated for 2 h at room temperature, followed by washing five times (400 mLwashes) with buffer C prior to elution. Asterisk indicates coprecipitating species potentially interacting with the bait protein of interest(denoted with an arrow). MW markers (in kDa) are indicated to the left. (a) and (c) represent gel views whereas (b) and (d) represent profileviews.
NTA experiments; see Fig. 6). Therefore, a salt wash gra-dient, followed by a urea elution gradient, was explored. Thisserved both to minimize the number of washing steps,potentially avoiding loss of interacting proteins, and tointroduce a range of both wash and elution conditionsrequired for this type of experiment. Minimal protein elutionoccurred following the inclusion of 0.5 M NaCl in the washbuffer (Fig. 9a), but most protein eluted from the AminoLinkresin samples upon exposure to ,3.0–4.0 M urea, the con-centration at which the DmsD bait protein is known todenature [35] (data not shown). Therefore, these sampleswere pooled and concentrated (Fig. 9b). Application ofwashing and elution gradients thus identified a minimalresin-dependent protein background (Fig. 9b, lane 2), ascompared to the resin samples to which the bait protein ofinterest had been covalently immobilized (Fig. 9b, lane 1).
Several potential bait-specific proteins of interest were thusobtained from the urea step-elution, being undetectablefrom the quenched AminoLink resin (Fig. 9b, lane 1).
3.3.4 Identification of background proteins isolated
by coprecipitation
Several AminoLink resin-dependent binding proteins fromE. coli soluble protein fractions (Fig. 9) were excised andsubjected to in-gel trypsin digestion followed by SELDI-TOF/MS to identify the most prominent of these backgroundproteins (Table 5). Further analysis of isolated proteins(Fig. 9b, lanes 1 and 2) by tryptic digestion and subsequentLC-MS/MS indicated that additional soluble proteinsappeared to be interacting with the quenched AminoLinkresin under the conditions tested (Table 5).
© 2006 WILEY-VCH Verlag GmbH & Co. KGaA, Weinheim www.proteomics-journal.com

2064 J. M. Howell et al. Proteomics 2006, 6, 2050–2069
Figure 8. Effects of time and washing on background obtainedfrom various coprecipitation studies. Depicted are eluted frac-tions from representative coprecipitation experiments using sol-uble fractions from anaerobically grown WT E. coli. (a) Exposureto ,85 mg prey protein/mL agarose for 1.5 h at room temperature.Samples were washed with 22 cv of buffer C prior to elution.Lane 1: His6-T7-bait protein immobilized resin; lane 2: controlresin; lane 3: quenched, activated resin; lane 4: His6-T7-controlprotein-immobilized resin. (b) Exposure to ,85 mg prey proteinper microliter agarose for 3 h at room temperature. Sampleswere washed with 16 cv of buffer C prior to elution. Lane 1, baitprotein immobilized resin; lane 2, control resin; lane 3, quen-ched, activated resin. In all cases, samples were eluted with 4 Murea, pH 7.5. Arrow denotes bait protein leaching off during theelution step. MW markers (in kDa) are indicated to the left.
4 Discussion
In this study, several conventional methods for detectingprotein–protein interactions, including affinity chromatog-raphy, co-IP, coprecipitation, and protein chip arrays, wereinvestigated with a focus on the background profiles gener-ated by each. It was determined that each of the methodsemployed exhibited some degree of associated matrix-de-pendent background. In this study, various background pro-tein profiles were characterized for E. coli soluble and mem-
brane protein isolates, using DmsD as a bait protein as oureventual goal is to understand the interactome of this pro-tein. Background protein profiles varied within each tech-nique. However, consistently recurring protein masses inreplicate experiments carried out under various conditions(for example, see Figs. 3, 4, and 8) indicate that some of thebackground proteins are inherent to each technique and areless influenced by technique-specific experimental parame-ters. In protein interaction studies, familiarity with theseprofiles and identities of these proteins are of paramountimportance in the detection and separation of true versusartifactual protein–protein interactions.
4.1 Protein chip approach
To date, no known protein–protein interaction studies havebeen conducted using PS-20 chips to probe for a bait-specificinteraction profile using subcellular fractions from E. coli.This method enabled high-throughput analysis of potentialprotein interactions of interest, and allowed for easy com-parison between spectra in the detection of bait–prey versusbackground matrix peaks. We observed that this techniquewas subject to an inherent background related to the fusionprotein tags, which was addressed with the inclusion of His6-T7-control protein (Fig. 2). A significant limitation of thistechnique is that on-chip protein profiling is qualitative.Peaks are assigned a molecular weight based on their mas-s:charge ratios; however, it is difficult to identify proteinsbased on this alone, particularly when post-translationalprocessing and PTMs are unknown. Nonetheless, usingmolecular weights obtained from SELDI-TOF together withavailable bioinformatics programs and databases, this meth-od can be used to identify potential bait–prey interactors andcan serve as a screening tool for the existence of aninteractome. This is possible where all spots are read underthe same PBS-II ProteinChip reader conditions, which sup-ports comparative analyses between spots containing bait
Figure 9. Representative results from a copreci-pitation study using His6-T7-bait-linked andquenched activated resin exposed to solublefractions from anaerobically grown WT E. coli.(a) Exposure to ,56 mg prey protein per micro-liter agarose for 1.5 h at room temperature, fol-lowed by washing with 2 cv each of buffer Ccontaining various salt concentrations. Lanes 1,3, and 5: bait-immobilized agarose; lanes 2, 4,and 6: quenched activated resin. (b) Pooled andconcentrated eluted fractions following resinsample exposures to 3.0 and 4.0 M urea. Lane 1:bait-immobilized resin; lane 2: quenched, acti-vated resin. MW markers (in kDa) are indicated tothe left.
© 2006 WILEY-VCH Verlag GmbH & Co. KGaA, Weinheim www.proteomics-journal.com

Proteomics 2006, 6, 2050–2069 Technology 2065
Table 5. Proteins from anaerobically grown WT E. coli soluble fractions contributing to the AminoLink (Pierce) resin background
Gene namea) GI number Descriptiona) MW (mature), kDaa)
aceE 13359574 Conversion of pyruvate to Acetyl CoA and CO2 99.5rpsA 1651439 30S ribosomal protein S1 61.1lpdA 13359576 Dihydrolipoyl dehydrogenase 50.6atpD 13364149 Catalyzes ATP formation from a proton gradient across the membrane 50.2eno 13363110 Conversion of 2-phosphoglycerate to phosphoenolpyruvate 45.5
a) From http://www.ecocyc.org
proteins that are the same or different, and also betweenchips that have been exposed to WT or mutant sources ofprey proteins and/or sources of prey proteins from culturesgrown under various conditions. For more complex cellfractions we suggest that further subfractionation (based onsolubilities or pIs), prior to interaction with the bait-contain-ing chips, may help increase consistency in the results.Regardless, the experiment needs to be performed a numberof times.
An advantage of this method is the detection of proteinsin the lower molecular weight range. Given that smallerpeptides/proteins “fly” more readily, SELDI-TOF might thusbe useful for the analysis of the lower molecular weightinteractome. Also of note is the high detection sensitivity tothis technique: femtograms of protein can be easily detectedand certain molecular weight ranges zoomed in on. SELDI-TOF approaches can therefore be an effective way to screenfor potentially interacting species of interest by identifyingmolecular weight ranges within which these proteins occur.Furthermore, this method can be used effectively in thecomparison of WT and mutant prey protein profiles (Fig. 2).
4.2 Affinity chromatography (Ni21-NTA matrix)
Ni21-NTA resins tend to have high protein binding capacity.In the case of using this approach for protein–protein inter-actions, proteins with high matrix affinities can overwhelmcomponents that bind less tightly. Multipoint weak adsorp-tion events can also add up to a strong interaction [36]. It hasbeen shown that certain proteins bind tightly to the Ni21-NTA resin by virtue of the number of surface charges andhistidine residues, and thus contribute to a background pro-file that can mask prey proteins of interest upon visualizationby PAGE, or occlude or mask binding sites and out-competeHis6-tagged fusion proteins, thereby effectively reducing theamount of bait protein available [37]. Enhancing the strin-gency of the wash steps through increased frequency (e.g.,extent of washing), salt concentration, and/or the inclusionof detergents prior to elution is required to reduce the pres-ence of these resin-dependent species (and thus any of theirown potential interacting proteins). However, attempts tominimize background came at the cost of detecting baitinteractions, especially if these were weak or transient. Dueto the nonphysiological salt concentrations required in this
technique (0.3–1 M NaCl), it is very likely that transientinteractions become disrupted. Furthermore, increasedwashing stringency is not guaranteed to eliminate resin-selective protein binding (for example, Fig. 6b). This wasobserved firsthand through our initial use of Ni21-NTAmagnetic agarose beads (Qiagen) in the detection of proteininteractions. Magnetic Ni21-NTA agarose resin exhibitedincreased levels of matrix dependence, presumably due tothe iron embedded in the support. As such, the use of Ni21-NTA magnetic bead was discontinued in favor of the Ni21-NTA resin. Despite increased washing stringency, severalsoluble proteins from WT E. coli (MC4100) were found tointeract strongly with the Ni21-NTA matrix, being retainedup to the point of elution. These proteins spanned a MWrange of ,20–60 kDa, which often reduced our ability todetect differences between control matrix samples and thoseto which purified bait protein had been immobilized. Severalof these Ni21-NTA resin-dependent background proteinswere identified through LC-MS/MS (Table 4). Thoroughassessment of this background enabled potential bait-inter-acting proteins to be detected using this technique. Further-more, protein–protein interaction experiments using Ni21-NTA affinity chromatography were also shown to be usefulfor crosscomparisons of interactions occurring in a keymutant versus WT background (Fig. 5).
This metal interaction affinity chromatography was alsoexplored using different metals in the chelate. In addition toNi we explored Zn, Cu, and Co. Overall the background wasless from columns using the other metals (data not shown).As expected, the retention of the His6-tagged protein was farsuperior with Ni21. Although background was betterreduced, the amount of bound bait protein was decreased,limiting the effectiveness of these other metals for use in thisapproach as we observed less signal-to-noise. Therefore,from this observation and from the fact that Ni21 is the mostcommonly used metal in these experiments all workdescribed here focused using Ni21-NTA.
4.3 Co-IP approaches
Anti-T7 mAb covalently immobilized to the AminoLink resinallowed for the creation of a different type of support for theaffinity system. As with the Ni21-NTA resin through the His6
tag, the DmsD bait protein containing an N-terminal T7 epi-
© 2006 WILEY-VCH Verlag GmbH & Co. KGaA, Weinheim www.proteomics-journal.com

2066 J. M. Howell et al. Proteomics 2006, 6, 2050–2069
tope binds to the antibody-linked support and is thus “dis-played”. Given the antibody specificity to the T7-epitope, thispermits direct exposure of the antibody-bound beads to cellfractions containing both the bait and prey proteins from thesame source. In this case, overexpression, purification, andimmobilization of the bait protein to the matrix prior to preyprotein exposure was not necessary. Although there was evi-dence of DmsD-T7-antibody interactions (Fig. 7a–d, lane 1),as this bait was not being overexpressed it must firstencounter and interact with the antibody on the beads inorder to be captured, while retaining its “interactors”. Addi-tionally there is no concentrating effect by this approach.
Direct immobilization of the DmsD protein to the resin(coprecipitation approach) yielded profiles that differed fromthose observed for the T7-antibody resin (compare Figs. 7and 8). Unlike the Ni21-affinity or the T7-antibody co-IPtechniques, in which most of the His6-T7-DmsD bait proteinwas displayed on the resin in a specific orientation, the directresin-immobilization of the bait protein through its aminegroups would have yielded random orientations. Thispotentially has advantages for this type of experiment if pro-tein interactions were occurring on different surfaces of thebait protein, and may explain why more proteins wereretained in the case of the coprecipitation experiments, ascompared to the co-IP experiments (compare Figs. 7 and 8).Furthermore, the significant increases in the DmsD baitprotein densities obtained by direct immobilization to theresin, as compared to capture through an immobilized anti-body exposed to lower abundance bait protein samples, mayenhance detection of potential interactors that are in lowerabundance. Depending on separation approaches and theidentification methods used to identify the interactions ofinterest the lower abundance protein interactions con-taminations should be overwhelmed. The use of immobi-lized T7 mAb in conjunction with the AminoLink resin did,however, appear to reduce background as compared to thatobserved in the coprecipitation experiments, perhaps owingin part to the added level of specificity required for proteininteractions.
Through coprecipitation studies with purified bait pro-tein, it was determined that the use of Pierce control gel isnot always a suitable control for these experiments, whenusing soluble E. coli fractions. The control gel is made of thesame crosslinked agarose as the AminoLink coupling gel,without the reactive surface aldehyde groups. Comparingsimilarly treated control gel samples and quenched Amino-Link samples with no protein immobilized, it was evidentthat the background proteins detected following exposure tosoluble extracts were present only in AminoLink samples,regardless of whether or not the resin contained covalentlyattached proteins or was simply quenched (Fig. 8a and b).Although background-dependent resin interactions identi-fied with this technique were markedly reduced under theconditions used, as compared to Ni21-affinity methods(compare Figs. 3 and 8), several other background proteinsdid emerge as a result of using the coprecipitation technique.
As such, it should not be assumed that these representinteracting proteins of interest. Some of these proteinsemerged as recurring background proteins to the Amino-Link matrix, despite increased washing stringency prior toelution of proteins from the resin (for representative results,see Figs. 8a and b, 9b). Overall, however, intensity of back-ground proteins is significantly reduced in the co-IP andcoprecipitation experiments, when compared to Ni21-NTAexperiments (compare Figs. 3 and 8). This is presumably dueto the matrix (agarose, rather than a metal chelate).
The background levels and profiles obtained for E. colisoluble fractions were found to differ significantly betweenthe AminoLink support matrix and the Ni21-NTA matrix(compare Figs. 3, 4, 8, and 9a and b). Recurring masses cor-responding to matrix-dependent background proteins be-tween the approaches are summarized in Table 6.
4.4 Conclusion
Although there appears to be an increased reliance on high-throughput methods in detecting protein–protein interac-tions, specifically through the use of techniques such as TAPtag [11], clear caveates exits. TAP tag as an in vitro method ofdetecting protein interactions or complexes requires the useof experimental conditions that selectively favor the purifica-tion of the bait protein at various stages, conditions whichmay not necessarily be conducive to the detection of bait–prey protein–protein interactions. Moreover, due to the na-ture of this approach, often only tight interactions areretained, with estimated KDs of less than 50 nM [14]. Con-sidering the likelihood of error in relying on a single detec-tion method to identify protein interactions [15], combina-tions of biochemical, immunological, and physical methodsare required in order to more fully ascertain true proteininteractions. To this end, in vitro methodologies (Table 1),such as coprecipitation, co-IP, and affinity chromatography,and more recent techniques such as protein chips areemployed. As an example the E. coli bait protein DmsD wasused with a specific focus on assessing technique-specificbackground protein profiles. However, the problems identi-fied are not unique to this protein or to E. coli. The controlexperiments suggested here are widely applicable to anyin vitro bait-prey experiment.
The approaches discussed here have associated withthem differing patterns and levels of nonspecifically bound(matrix-dependent) proteins, which can lead to confoundingdata and misinterpretation of protein interaction profiles.Assessment of these background proteins is critical in cor-rectly separating true protein interactions from artifacts.Identification of these background proteins will be of impor-tance to researchers using these techniques, in conjunctionwith E. coli-derived bait or prey proteins, particularly in thecases of Ni21-affinity chromatography or coprecipitation.Proteins adsorbing tightly to the support surfaces in the var-ious techniques described are disadvantageous in that theycan (i) bind to their own interacting proteins, further com-
© 2006 WILEY-VCH Verlag GmbH & Co. KGaA, Weinheim www.proteomics-journal.com
Proteomics 2006, 6, 2050–2069 Technology 2067
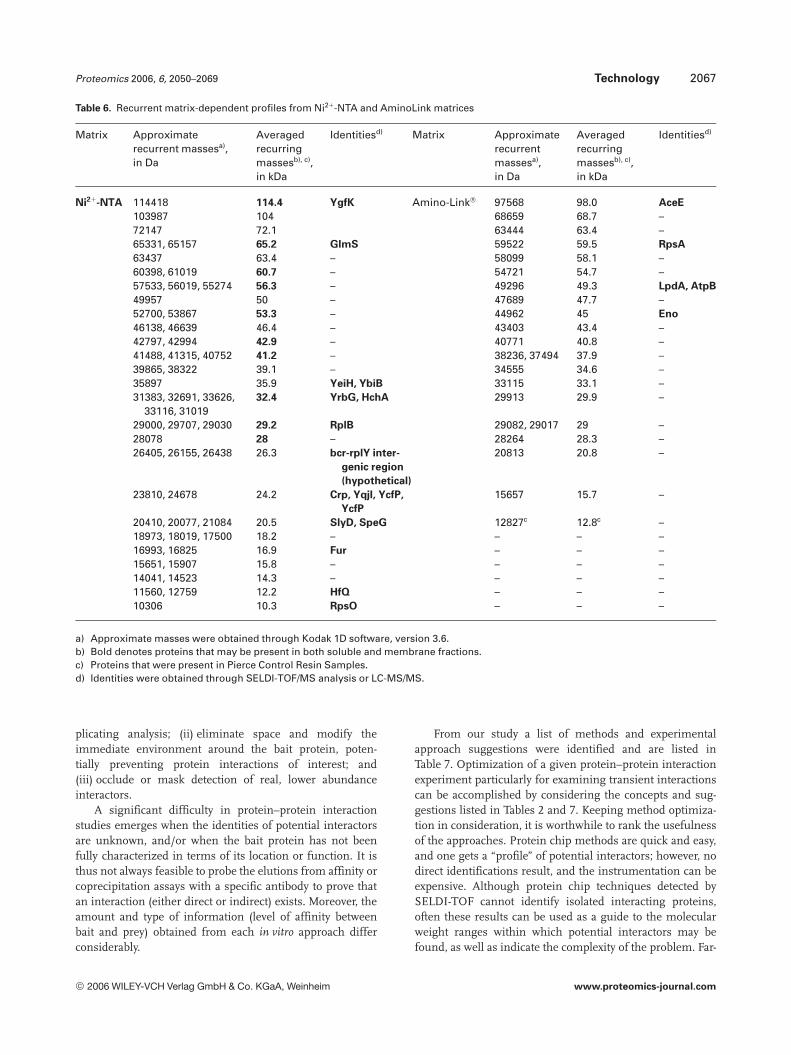
Table 6. Recurrent matrix-dependent profiles from Ni21-NTA and AminoLink matrices
Matrix Approximaterecurrent massesa),in Da
Averagedrecurringmassesb), c),in kDa
Identitiesd) Matrix Approximaterecurrentmassesa),in Da
Averagedrecurringmassesb), c),in kDa
Identitiesd)
Ni21-NTA 114418 114.4 YgfK Amino-Link® 97568 98.0 AceE
103987 104 68659 68.7 –72147 72.1 63444 63.4 –65331, 65157 65.2 GlmS 59522 59.5 RpsA
63437 63.4 – 58099 58.1 –60398, 61019 60.7 – 54721 54.7 –57533, 56019, 55274 56.3 – 49296 49.3 LpdA, AtpB
49957 50 – 47689 47.7 –52700, 53867 53.3 – 44962 45 Eno
46138, 46639 46.4 – 43403 43.4 –42797, 42994 42.9 – 40771 40.8 –41488, 41315, 40752 41.2 – 38236, 37494 37.9 –39865, 38322 39.1 – 34555 34.6 –35897 35.9 YeiH, YbiB 33115 33.1 –31383, 32691, 33626,
33116, 3101932.4 YrbG, HchA 29913 29.9 –
29000, 29707, 29030 29.2 RplB 29082, 29017 29 –28078 28 – 28264 28.3 –26405, 26155, 26438 26.3 bcr-rplY inter-
genic region
(hypothetical)
20813 20.8 –
23810, 24678 24.2 Crp, YqjI, YcfP,
YcfP
15657 15.7 –
20410, 20077, 21084 20.5 SlyD, SpeG 12827c 12.8c –18973, 18019, 17500 18.2 – – – –16993, 16825 16.9 Fur – – –15651, 15907 15.8 – – – –14041, 14523 14.3 – – – –11560, 12759 12.2 HfQ – – –10306 10.3 RpsO – – –
a) Approximate masses were obtained through Kodak 1D software, version 3.6.b) Bold denotes proteins that may be present in both soluble and membrane fractions.c) Proteins that were present in Pierce Control Resin Samples.d) Identities were obtained through SELDI-TOF/MS analysis or LC-MS/MS.
plicating analysis; (ii) eliminate space and modify theimmediate environment around the bait protein, poten-tially preventing protein interactions of interest; and(iii) occlude or mask detection of real, lower abundanceinteractors.
A significant difficulty in protein–protein interactionstudies emerges when the identities of potential interactorsare unknown, and/or when the bait protein has not beenfully characterized in terms of its location or function. It isthus not always feasible to probe the elutions from affinity orcoprecipitation assays with a specific antibody to prove thatan interaction (either direct or indirect) exists. Moreover, theamount and type of information (level of affinity betweenbait and prey) obtained from each in vitro approach differconsiderably.
From our study a list of methods and experimentalapproach suggestions were identified and are listed inTable 7. Optimization of a given protein–protein interactionexperiment particularly for examining transient interactionscan be accomplished by considering the concepts and sug-gestions listed in Tables 2 and 7. Keeping method optimiza-tion in consideration, it is worthwhile to rank the usefulnessof the approaches. Protein chip methods are quick and easy,and one gets a “profile” of potential interactors; however, nodirect identifications result, and the instrumentation can beexpensive. Although protein chip techniques detected bySELDI-TOF cannot identify isolated interacting proteins,often these results can be used as a guide to the molecularweight ranges within which potential interactors may befound, as well as indicate the complexity of the problem. Far-
© 2006 WILEY-VCH Verlag GmbH & Co. KGaA, Weinheim www.proteomics-journal.com
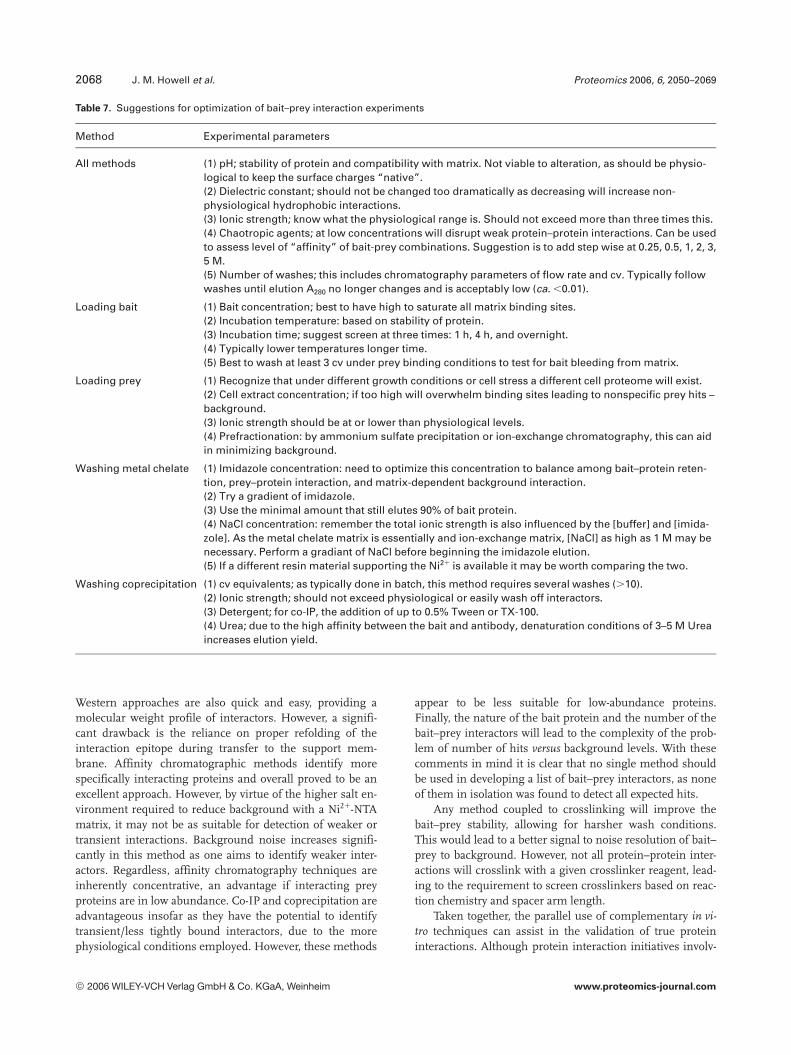
2068 J. M. Howell et al. Proteomics 2006, 6, 2050–2069
Table 7. Suggestions for optimization of bait–prey interaction experiments
Method Experimental parameters
All methods (1) pH; stability of protein and compatibility with matrix. Not viable to alteration, as should be physio-logical to keep the surface charges “native”.(2) Dielectric constant; should not be changed too dramatically as decreasing will increase non-physiological hydrophobic interactions.(3) Ionic strength; know what the physiological range is. Should not exceed more than three times this.(4) Chaotropic agents; at low concentrations will disrupt weak protein–protein interactions. Can be usedto assess level of “affinity” of bait-prey combinations. Suggestion is to add step wise at 0.25, 0.5, 1, 2, 3,5 M.(5) Number of washes; this includes chromatography parameters of flow rate and cv. Typically followwashes until elution A280 no longer changes and is acceptably low (ca. ,0.01).
Loading bait (1) Bait concentration; best to have high to saturate all matrix binding sites.(2) Incubation temperature: based on stability of protein.(3) Incubation time; suggest screen at three times: 1 h, 4 h, and overnight.(4) Typically lower temperatures longer time.(5) Best to wash at least 3 cv under prey binding conditions to test for bait bleeding from matrix.
Loading prey (1) Recognize that under different growth conditions or cell stress a different cell proteome will exist.(2) Cell extract concentration; if too high will overwhelm binding sites leading to nonspecific prey hits –background.(3) Ionic strength should be at or lower than physiological levels.(4) Prefractionation: by ammonium sulfate precipitation or ion-exchange chromatography, this can aidin minimizing background.
Washing metal chelate (1) Imidazole concentration: need to optimize this concentration to balance among bait–protein reten-tion, prey–protein interaction, and matrix-dependent background interaction.(2) Try a gradient of imidazole.(3) Use the minimal amount that still elutes 90% of bait protein.(4) NaCl concentration: remember the total ionic strength is also influenced by the [buffer] and [imida-zole]. As the metal chelate matrix is essentially and ion-exchange matrix, [NaCl] as high as 1 M may benecessary. Perform a gradiant of NaCl before beginning the imidazole elution.(5) If a different resin material supporting the Ni21 is available it may be worth comparing the two.
Washing coprecipitation (1) cv equivalents; as typically done in batch, this method requires several washes (.10).(2) Ionic strength; should not exceed physiological or easily wash off interactors.(3) Detergent; for co-IP, the addition of up to 0.5% Tween or TX-100.(4) Urea; due to the high affinity between the bait and antibody, denaturation conditions of 3–5 M Ureaincreases elution yield.
Western approaches are also quick and easy, providing amolecular weight profile of interactors. However, a signifi-cant drawback is the reliance on proper refolding of theinteraction epitope during transfer to the support mem-brane. Affinity chromatographic methods identify morespecifically interacting proteins and overall proved to be anexcellent approach. However, by virtue of the higher salt en-vironment required to reduce background with a Ni21-NTAmatrix, it may not be as suitable for detection of weaker ortransient interactions. Background noise increases signifi-cantly in this method as one aims to identify weaker inter-actors. Regardless, affinity chromatography techniques areinherently concentrative, an advantage if interacting preyproteins are in low abundance. Co-IP and coprecipitation areadvantageous insofar as they have the potential to identifytransient/less tightly bound interactors, due to the morephysiological conditions employed. However, these methods
appear to be less suitable for low-abundance proteins.Finally, the nature of the bait protein and the number of thebait–prey interactors will lead to the complexity of the prob-lem of number of hits versus background levels. With thesecomments in mind it is clear that no single method shouldbe used in developing a list of bait–prey interactors, as noneof them in isolation was found to detect all expected hits.
Any method coupled to crosslinking will improve thebait–prey stability, allowing for harsher wash conditions.This would lead to a better signal to noise resolution of bait–prey to background. However, not all protein–protein inter-actions will crosslink with a given crosslinker reagent, lead-ing to the requirement to screen crosslinkers based on reac-tion chemistry and spacer arm length.
Taken together, the parallel use of complementary in vi-tro techniques can assist in the validation of true proteininteractions. Although protein interaction initiatives involv-
© 2006 WILEY-VCH Verlag GmbH & Co. KGaA, Weinheim www.proteomics-journal.com
Proteomics 2006, 6, 2050–2069 Technology 2069
ing computational methods coupled with high-throughputscreening will undoubtedly elucidate many more proteininteractions [1, 38, 39], these approaches will require themethods described herein, in order to confirm and validatesuch findings.
We thank B. D. Haslam and A. Binding for protein purifi-cation conducted as summer undergraduate project students.C. Chan is gratefully acknowledged for useful discussions.J. M. H. was supported by an NSERC graduate scholarship. Thiswork was supported by a CIHR grant to RJT and the SELDI-TOF instrument was purchased by funds from AHFMR.
5 References
[1] Govorun, V. M., Archakov, A. I., Biochemistry (Moscow)2002, 67, 1109–1123.
[2] Colland, F., Jacq, X., Trouplin, V., Mougin, C. et al., GenomeRes. 2004, 14, 1324–1332.
[3] Han, J.-D. J., Bertin, N., Hao, T., Goldberg, D. S. et al., Nature2004, 430, 88–93.
[4] Phizicky, E., Fields, S., Microbiol. Rev. 1995, 59, 94–123.
[5] Nooren, I. M. A., Thornten, M. A., J. Mol. Biol. 2003, 325,991–1018.
[6] Onn, I., Milman-Shtepel, N., Shlomai, J., Eukaryotic Cell2004, 3, 277–278.
[7] Marchesseau, S., Mani, J.-C., Martineau, P., Roquet, F. et al.,J. Dairy Sci. 2002, 85, 2711–2721.
[8] Shen, Z., Cloud, K. G., Chen, D. J., Park, M. S., J. Biol. Chem.1996, 271, 148–152.
[9] Rigaut, G., Shevchenko, A., Rutz, B., Wilm, M. et al., Nat.Biotechnol. 1999, 17, 1030–1032.
[10] Puig, A., Caspary, F., Rigaut, G., Rutz, B. et al., Methods 2001,24, 218–229.
[11] Butland, G., Peregrin-Alvarez, J. M., Li, J., Yang, W. et al.,Nature 2005, 433, 531–537.
[12] Zhu, H., Snyder, M., Curr. Opin. Chem. Biol. 2003, 7, 55–63.
[13] Honore, B., Ostergaard, M., Vorum, H., Bioessays 2004, 26,901–915.
[14] Pieler, J., Curr Op. Struc. Biol. 2005, 15, 4–14.
[15] Sprinzak, E., Sattath, S., Margalit, H., J. Mol. Biol. 2003, 327,919–923.
[16] Oresnick, I. J., Ladner, C. L., Turner, R. J., Mol. Microbiol.2001, 40, 323–331.
[17] Turner, R. J., Papish, A. L., Sargent, F., Can. J. Microbiol.2004, 50, 225–238.
[18] Sambasivarao, D., Scraba, D. G., Trieber, C., Weiner, J. H., J.Bacteriol. 1990, 172, 5938–5948.
[19] Rothery, R. A., Weiner, J. H., Biochemistry 1993, 32, 5855–5861.
[20] Ray, N., Oates, J., Turner, R. J., Robinson, C., FEBS Lett.2003, 534, 156–160.
[21] Howell, J. M., Turner, R. J., Rec. Res. Develop. Microbiol.2004, 8, 1–14.
[22] Papish, A. L., Ladner, C. L., Turner, R. J., J. Biol. Chem. 2003,278, 32501–32506.
[23] Berks, B. C., Palmer, T., Sargent, F., Adv. Microb. Physiol.2003, 47, 187–254.
[24] Miroux, B., Walker, J. E., J. Mol. Biol. 1996, 260, 289–298.
[25] Silhavy, T. J., Berman, M. L., Enquist, L. W. (Eds.), Experi-ments with Gene Fusions, Cold Spring Harbor LaboratoryPress, NY 1984.
[26] Liu, M., Turner, R. J., Winstone, T. L., Saetre, A. et al., J. Bac-teriol. 2000, 182, 6509–6513.
[27] Markwell, M. A. K., Haas, S. M., Bieber, L. L., Tolbert, M. E.,Anal. Biochem. 1978, 87, 206–210.
[28] Barzaghi, D., Isbister, J. D., Lauer, K. P., Born, T. L., Proteom-ics 2004, 4, 2624–2628.
[29] Loetscher, P., Mottlau, L., Hochuli, E., J. Chromatogr. 1992,595, 113–119.
[30] Roof, W. D., Horne, S., Young, K. D., Young, R., J. Biol. Chem.1993, 269, 2902–2910.
[31] Wulfing, C., Lombardero, J., Pluckthun, A., J. Biol. Chem.1994, 269, 2895–2901.
[32] Althaus, E. W., Outten, C. E., Olson, K. E., Cao, H., O’Hal-loran, T. V., Biochemistry 1999, 38, 6559–6569.
[33] Katayama, A., Tsujii, A., Wada, A., Nishino, T., Ishihama, A.,Eur. J. Biochem. 2002, 269, 2403–2413.
[34] Quoronfleh, M. W., Ren, L., Emery, D., Perr, M., Kaboord, B.,J. Biomed. Biotech. 2003, 5, 291–298.
[35] Sarfo, K. J., Winstone, T. L., Papish, A. L., Howell, J. M. et al.,BBRC 2004, 315, 397–403.
[36] Mateo, C., Fernandez-Lorente, G., Pessela, B. C. C., Vian, A.et al., J. Chromatogr. 2001, 915, 97–106.
[37] Todd, R. J., Johnson, R. D., Arnold, F. H., J. Chromatogr.1994, 662, 13–26.
[38] Phizicky, E., Bastiaens, P. I. H., Zhu, H., Snyder, M., Fields, S.,Nature 2003, 422, 208–215.
[39] Bader, G. D., Hogue, C. W., BMC Bioinformatics 2003, 4, 2.
[40] Young, K. H., Biol. Reprod. 1998, 58, 302–311.
[41] Toby, G. G., Golemis, E. A., Methods 2001, 24, 201–217.
[42] Kay, B. K., Kasanov, J., Yamabhai, M., Methods 2001, 24,240–246.
[43] Willats, W. G. T., Plant Mol. Biol. 2002, 50, 837–854.
[44] Vasilescu, J., Guo, X., Kast, J., Proteomics 2004, 4, 3845–3854.
[45] Predki, P. F., Curr. Opin. Chem. Biol. 2004, 8, 8–13.
[46] Mahlknecht, U., Ottmann, O. G., Hoelzer, D., J. Biotechnol.2001, 88, 89–94.
[47] Szabo, A., Stolz, L., Granzow, R., Curr. Opin. Struc. Biol.1995, 5, 699–705.
[48] Rye, H. S., Methods 2001, 24, 278–288.
© 2006 WILEY-VCH Verlag GmbH & Co. KGaA, Weinheim www.proteomics-journal.com
Related Documents