For peer review only An Evaluation of Two Exceptional Heat Events: The Effects of a Heat Warning System in Adelaide, South Australia. Journal: BMJ Open Manuscript ID bmjopen-2016-012125 Article Type: Research Date Submitted by the Author: 04-Apr-2016 Complete List of Authors: Nitschke, Monika; South Australia Department for Health and Ageing, Public Health Services; University of Adelaide, School of Public Health Tucker, Graeme; South Australia Department for Health and Ageing Epidemiology Branch; University of Adelaide, School of Medicine Hansen, Alana; University of Adelaide, School of Public Health Williams, Susan; The University of Adelaide, School of Public Health Zhang, Ying; University of Sydney, Public Health Bi, Peng; University of Adelaide, School of Public Health <b>Primary Subject Heading</b>: Evidence based practice Secondary Subject Heading: Epidemiology, Health policy, Public health Keywords: heatwave, warning system, intervention, prevention For peer review only - http://bmjopen.bmj.com/site/about/guidelines.xhtml BMJ Open on June 12, 2020 by guest. Protected by copyright. http://bmjopen.bmj.com/ BMJ Open: first published as 10.1136/bmjopen-2016-012125 on 19 July 2016. Downloaded from

Welcome message from author
This document is posted to help you gain knowledge. Please leave a comment to let me know what you think about it! Share it to your friends and learn new things together.
Transcript
For peer review only
An Evaluation of Two Exceptional Heat Events: The Effects of a Heat Warning System in Adelaide, South Australia.
Journal: BMJ Open
Manuscript ID bmjopen-2016-012125
Article Type: Research
Date Submitted by the Author: 04-Apr-2016
Complete List of Authors: Nitschke, Monika; South Australia Department for Health and Ageing, Public Health Services; University of Adelaide, School of Public Health Tucker, Graeme; South Australia Department for Health and Ageing Epidemiology Branch; University of Adelaide, School of Medicine Hansen, Alana; University of Adelaide, School of Public Health Williams, Susan; The University of Adelaide, School of Public Health Zhang, Ying; University of Sydney, Public Health Bi, Peng; University of Adelaide, School of Public Health
<b>Primary Subject Heading</b>:
Evidence based practice
Secondary Subject Heading: Epidemiology, Health policy, Public health
Keywords: heatwave, warning system, intervention, prevention
For peer review only - http://bmjopen.bmj.com/site/about/guidelines.xhtml
BMJ Open on June 12, 2020 by guest. P
rotected by copyright.http://bm
jopen.bmj.com
/B
MJ O
pen: first published as 10.1136/bmjopen-2016-012125 on 19 July 2016. D
ownloaded from

For peer review only
1
Title page
BMJ Open
Article type: Research
Manuscript title
An Evaluation of Two Exceptional Heat Events: The Effects of a Heat Warning System in Adelaide, South Australia.
Name of authors
1 2Monika Nitschke,
1 3Graeme Tucker,
2Alana Hansen,
2Susan Williams,
4Ying Zhang
2Peng Bi
Affiliations
1 2 Monika Nitschke, Public Health Services, Department for Health and Ageing, South Australia,
Australia, Affiliated to the School of Public Health, University of Adelaide
1 3 Graeme R Tucker, Epidemiology, Department for Health and Ageing, South Australia, Australia.
Affiliated to the School of Medicine, University of Adelaide
2 Alana L Hansen, School of Public Health, University of Adelaide, Adelaide, South Australia,
Australia
2 Susan Williams, School of Public Health, University of Adelaide, Adelaide, South Australia, Australia
4 Ying Zhang, International Public Health, University of Sydney, Sydney, New South Wales, Australia
2 Peng Bi, School of Public Health, University of Adelaide, Adelaide, South Australia, Australia
Corresponding author
Dr Monika Nitschke, SA Health, Level 1, City Centre Building, 11 Hindmarsh Square, Adelaide SA 5000, Australia. Phone: +61 8 822 67126. E-mail: [email protected] Key words: Heatwave, evaluation, warning-system, intervention, prevention
Word count: 2971
Page 1 of 30
For peer review only - http://bmjopen.bmj.com/site/about/guidelines.xhtml
BMJ Open
123456789101112131415161718192021222324252627282930313233343536373839404142434445464748495051525354555657585960
on June 12, 2020 by guest. Protected by copyright.
http://bmjopen.bm
j.com/
BM
J Open: first published as 10.1136/bm
jopen-2016-012125 on 19 July 2016. Dow
nloaded from

For peer review only
2
ABSTRACT
Background Heatwave warning systems aim to assist in reducing health effects
during extreme heat. Evaluations of such systems have been limited. This study
explored the effect on morbidity and mortality of a heatwave warning program in
Adelaide, South Australia, by comparing extreme events in 2009 and 2014, the latter
with exposure to the preventive program.
Methods The health outcomes during the two heatwaves were compared using the
incidence rate ratios of daily ambulance callouts, emergency presentations and
mortality data during the heatwaves compared to non-heatwave periods during the
warm seasons. Excess or reduced numbers of cases were calculated and the
differences in cases between the two heatwaves were estimated.
Results Incidence rate ratios for total ambulance call-outs and emergency
presentations were lower during the 2014 heatwaves compared to the 2009 event.
The estimated differences in health- specific outcomes between 2009 and 2014 were
statistically significant with -207 (59%) for cardiac-related call outs, -134 (30%) for
renal and -145 (56%) for heat-related emergency presentations. Mortality was not
reduced in 2014. There were an estimated 34.5 excess deaths in 2009 and 38.2 in
2014.
Conclusion Morbidity outcomes were reduced significantly during the 2014 event.
The fact that cardiac, renal and heat-related diagnoses were significantly reduced is
likely to be associated with the intervention in 2014, which comprised not only a
public warning through media, but also intense preventive measures directed to
individual populations at risk. Further analysis of risk factors of mortality during
heatwaves should be explored.
Strength and Limitations of this study
• Heatwave warning systems based on defined temperature triggers and adaptive public health measures have been implemented in many cities, but the evaluation of the effectiveness of these systems is limited to mortality.
• This study utilised morbidity and mortality data from two extreme heatwave periods, before and after the introduction of a heatwave warning system in Adelaide, South Australia, to compare the impact.
• There are limitations in conclusively evaluating the effects of a population-based heat health intervention. It could be argued that improvements in health outcomes could be due to adaptation to heat or that it is difficult to compare heatwave events.
• Significant morbidity reductions were observed suggesting that preventive measures contributed to this success. As this was not the case for mortality,
Page 2 of 30
For peer review only - http://bmjopen.bmj.com/site/about/guidelines.xhtml
BMJ Open
123456789101112131415161718192021222324252627282930313233343536373839404142434445464748495051525354555657585960
on June 12, 2020 by guest. Protected by copyright.
http://bmjopen.bm
j.com/
BM
J Open: first published as 10.1136/bm
jopen-2016-012125 on 19 July 2016. Dow
nloaded from
For peer review only
3
further efforts have to be made to explore the reduction of risk factors for mortality during heatwaves.
• Evaluation of interventions is an iterative process and should be used continuously alongside fine tuning of the intervention measures using evidence –based research.
Page 3 of 30
For peer review only - http://bmjopen.bmj.com/site/about/guidelines.xhtml
BMJ Open
123456789101112131415161718192021222324252627282930313233343536373839404142434445464748495051525354555657585960
on June 12, 2020 by guest. Protected by copyright.
http://bmjopen.bm
j.com/
BM
J Open: first published as 10.1136/bm
jopen-2016-012125 on 19 July 2016. Dow
nloaded from

For peer review only
4
INTRODUCTION
Health effects during extreme heat should be largely preventable. However, during
recent heat events worldwide and in Australia, significant increases in morbidity and
mortality have been evident. A systematic analysis of health effects during
heatwaves (3 or more days of maximum temperature ≥ 35°C) for Adelaide, the
capital of South Australia (SA) (1993-2006) indicated morbidity incidence above what
is normally expected during summer periods, but did not show any increases in
mortality.1 This changed when a record breaking 13 day heatwave occurred in
summer 2009 during which mortality increased by 37% in the 15-64 age groups
together with large increases in renal, ischaemic heart disease and direct heat-
related morbidity.2
This unparalleled event evoked the need for a heat warning system (HWS) for
metropolitan Adelaide’s 1.30 million residents, 76.9% of the total SA population,
considering the predictions of an increased frequency of extreme heatwaves under
the climate change scenario for SA. A HWS was introduced in November 2009,
following the extreme heatwave in January and February 2009. These systems are
now in place in many cities of the world.
Several HWSs in the United States were initiated in response to extreme
heatwaves3-4
. Since the 2003 heatwave in Europe, HWSs have been also rolled out
for many European cities.5-6
Only recently, the World Health Organisation (WHO) in
conjunction with the World Meteorological Organisation (WMO) published a
guidance document on the development of HWSs.7 The Adelaide HWS addresses
most of the pertinent elements presented in the WHO/WMO framework including a
definition of the event, an across the government agreed division of roles and
responsibilities to reduce possible health effects among those at risk, and a
communications strategy to engage with the general population. The process of
establishing a HWS in Adelaide has been described in a recent qualitative study
outlining the collaborative stakeholder engagement process by the state
government.8
Another key factor mentioned in the WHO/WMO framework is the need to evaluate
the success of the health warnings; whether it has offered health protection verified
by a reduction of cases of heat-related illnesses compared to what was expected
Page 4 of 30
For peer review only - http://bmjopen.bmj.com/site/about/guidelines.xhtml
BMJ Open
123456789101112131415161718192021222324252627282930313233343536373839404142434445464748495051525354555657585960
on June 12, 2020 by guest. Protected by copyright.
http://bmjopen.bm
j.com/
BM
J Open: first published as 10.1136/bm
jopen-2016-012125 on 19 July 2016. Dow
nloaded from

For peer review only
5
from previous events, or in terms of public recall of information, and whether the
warning changed the behaviour of people at risk.7 Evaluating heat warning
interventions has been the subject of two recent reviews.9-10
They concur that the
limited intervention studies present indicated positive results. Most of the studies
were limited to the evaluation of mortality. Evaluations of impacts were hampered by
the fact that subsequent heatwaves had different intensities and durations.10-11
In summer of 2014, the Adelaide extreme heat warning system was twice activated
within a one month period, and when combined these two heatwave periods
resembled in duration and intensity the 2009 heat event. This provided a timely
opportunity to compare health outcomes during those events as part of an evaluation
of the effectiveness of the heat health intervention in Adelaide.
METHODS
The study is of ecological design comparing morbidity and mortality of two extreme
heatwaves at the population level.
Health data
Morbidity and mortality data for metropolitan Adelaide for the warm seasons
(October-March) from 1993 to 2014 were obtained from The Department for Health
and Ageing. For comparison purposes, the specific health outcome categories
chosen for analysis were those that were significantly increased during the 2009
heatwave. Ambulance callout data were obtained from SA Ambulance Service.
The following International Classification of Disease (ICD-10) categories of diseases
were selected for emergency department presentations (hospital admissions data
was also obtained and the results can be seen in the appendix online): renal (ICD-10
N00-N399) and direct heat-related (ICD-10, E86, T67, X30). The pre-defined
categories provided by SA Ambulance Service for call-outs were used. Only total
mortality data were used as cause-specific data for 2014 were unavailable.
Page 5 of 30
For peer review only - http://bmjopen.bmj.com/site/about/guidelines.xhtml
BMJ Open
123456789101112131415161718192021222324252627282930313233343536373839404142434445464748495051525354555657585960
on June 12, 2020 by guest. Protected by copyright.
http://bmjopen.bm
j.com/
BM
J Open: first published as 10.1136/bm
jopen-2016-012125 on 19 July 2016. Dow
nloaded from

For peer review only
6
Heat health interventions
Table 1 summarises the elements of Adelaide’s short-term interventions during
extreme heat warning episodes.
The HWS has an all-government approach with the State Emergency Service (SES)
as the ‘Hazard Leader’.12
It is triggered in conjunction with the Bureau of
Meteorology (BOM) when an average daily temperature of ≥32ºC is forecast
(average of daily maximum and minimum = ADT) for three or more days. This
temperature threshold is based on retrospective analysis of health and temperature
data13-14
. Upon reaching the threshold, the government activates heat-related
interventions to the specific needs of vulnerable populations. For example, all
people who access one or more social services are monitored regarding their
wellbeing. The general public is warned, informed and educated through media
announcements.
The Australian Red Cross operates an important free service in collaboration with
the state government, specifically directed to people at risk. Those who have been
registered are contacted on a daily basis during the warning period. Carers, doctors,
friends and family members can enrol a person in this system based on a
vulnerability assessment tool.15
Pre-season work is invested into re-assessing extreme heat plans and intervention
measures based on ongoing risk factors research.16-18
Lead agencies Triggers/threshold Interventions
SA State Emergency Service (SES) is advised by Bureau of Meteorology (BOM). SES informs other agencies with one lead day.
3 day rolling forecast of daily average (minimum and maximum temperatures divided by two) temperatures (ADT)
Threshold for an extreme heat warning is reached when ADT is 32C or above (e.g. 40C daytime and 24C night time)
Before/start of summer and ongoing:
• General heat health advice before summer.
• Heat plan review of all relevant government and non-government agencies.
• Meeting of all agencies before the summer
During the alert:
• Activation of specific and co-ordinated extreme heat plans (Local government, state government and non-government), see examples:
• Public alerts and advice through media
• Continuous review of emergency, ambulance and other
Page 6 of 30
For peer review only - http://bmjopen.bmj.com/site/about/guidelines.xhtml
BMJ Open
123456789101112131415161718192021222324252627282930313233343536373839404142434445464748495051525354555657585960
on June 12, 2020 by guest. Protected by copyright.
http://bmjopen.bm
j.com/
BM
J Open: first published as 10.1136/bm
jopen-2016-012125 on 19 July 2016. Dow
nloaded from

For peer review only
7
Table 1: Extreme heat warning in Adelaide, South Australia: description of the program and
interventions.
Temperature data
Temperature data were obtained from a BOM weather station which is
representative of the metropolitan area of Adelaide.
The definition (3 or more days of ≥35ºC) for heatwave impact assessments in
Adelaide was used to compare the health impacts during the 2014 heatwaves to
those in 20091-2
. The 2009 heatwave (hw2009) (26 January to 7 February) lasted 13
days with an average maximum temperature of 41°C and an average minimum
temperature of 26.1°C. The 2014 heatwave (hw2014) is a composite of two
heatwaves with only 9 days in between (12 January to 17 January and 27 January to
2 February 2014). Each of the events (hw2009 and hw2014) included one day below
35°C. The average maximum temperature during the first component of the hw2014
was 42.2°C and the minimum was 24.8; for the second composite period it was 39.4
and 21.5 accordingly. During both hw2014 periods, extreme heat warnings were
triggered. Table 1 in the online appendix shows the temperature constellation for the
2009 and 2014 heatwaves in more details.
Statistics
To compare health impacts, a case series analysis was used.19
Average daily rates
of adverse health outcomes during the defined heatwaves were compared with non-
heatwave periods during the respective warm seasons. The rate ratios of incidences
of health outcomes during ‘case’ and ‘control’ periods were expressed as incidence
rate ratios (IRR).
The analysis was conducted within years, therefore implicitly adjusting for long-term
trends for the years 1993-2014.20
To calculate the IRR, poisson regression models
were fitted using the statistical software package Stata version 13.21
Each model was
season to discuss co-ordination issues.
• Collaborative Research agenda
clinical response capabilities in the health sector.
• Australian Red Cross provision of free support calls to registered vulnerable people.
Page 7 of 30
For peer review only - http://bmjopen.bmj.com/site/about/guidelines.xhtml
BMJ Open
123456789101112131415161718192021222324252627282930313233343536373839404142434445464748495051525354555657585960
on June 12, 2020 by guest. Protected by copyright.
http://bmjopen.bm
j.com/
BM
J Open: first published as 10.1136/bm
jopen-2016-012125 on 19 July 2016. Dow
nloaded from
For peer review only
8
tested for fit, and negative binomial regression models were used to allow for over-
dispersion if required. To assess the impact of the intervention, the statistical
significance of the difference between the 2009 and 2014 IRRs were estimated
using the post estimation command ‘lincom’ in Stata. Furthermore, expected cases
were calculated from the total of the observed cases (N) during the respective
heatwave period divided by the IRR of the relevant health outcome. Excess (or
reduced) cases were obtained by subtracting expected from observed cases [N –
(N/IRR)]. The difference between excess cases in 2009 and 2014 provided an
indicator of effectiveness of the intervention. Standard errors were manipulated using
the formulae provided in Hansen et al to produce a 95% confidence interval (CI) for
the estimates of the excess/reduction and the difference in cases between the 2009
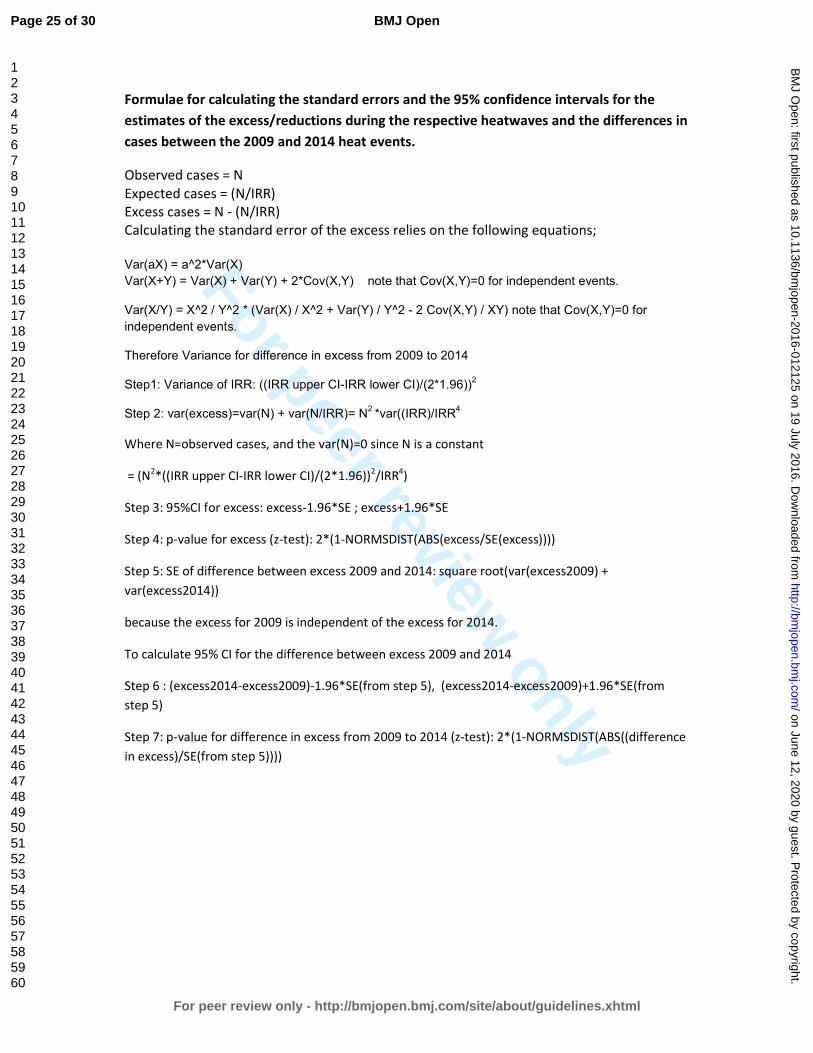
and 2014 events (see appendix for formulae).22
Page 8 of 30
For peer review only - http://bmjopen.bmj.com/site/about/guidelines.xhtml
BMJ Open
123456789101112131415161718192021222324252627282930313233343536373839404142434445464748495051525354555657585960
on June 12, 2020 by guest. Protected by copyright.
http://bmjopen.bm
j.com/
BM
J Open: first published as 10.1136/bm
jopen-2016-012125 on 19 July 2016. Dow
nloaded from

For peer review only
9
RESULTS
Table 2 provides summary statistics for daily average health outcomes during the
two comparison heatwave and non-heatwave periods in 2009 and 2014. Ambulance
call-outs during the hw2009 and hw2014 were higher compared to their respective
non-heatwave periods. Unlike in the hw2009 when average daily hospital and
emergency presentations were higher than during the respective non-heatwave
periods, this was reversed in the hw2014. As in 2009, average mortality was higher
during the heatwave compared to the non-heatwave days in 2014.
Table 2 Descriptive statistics for total daily health outcomes for summer 2008/9 and 2013/14 (October to March), for the two defined heatwaves (hw) (13 days) and non-heat wave periods(169 days): minimum, maximum, mean and standard deviation of daily incidences of ambulance call-outs, hospital admissions, emergency presentations and mortality.
Ambulance call-outs
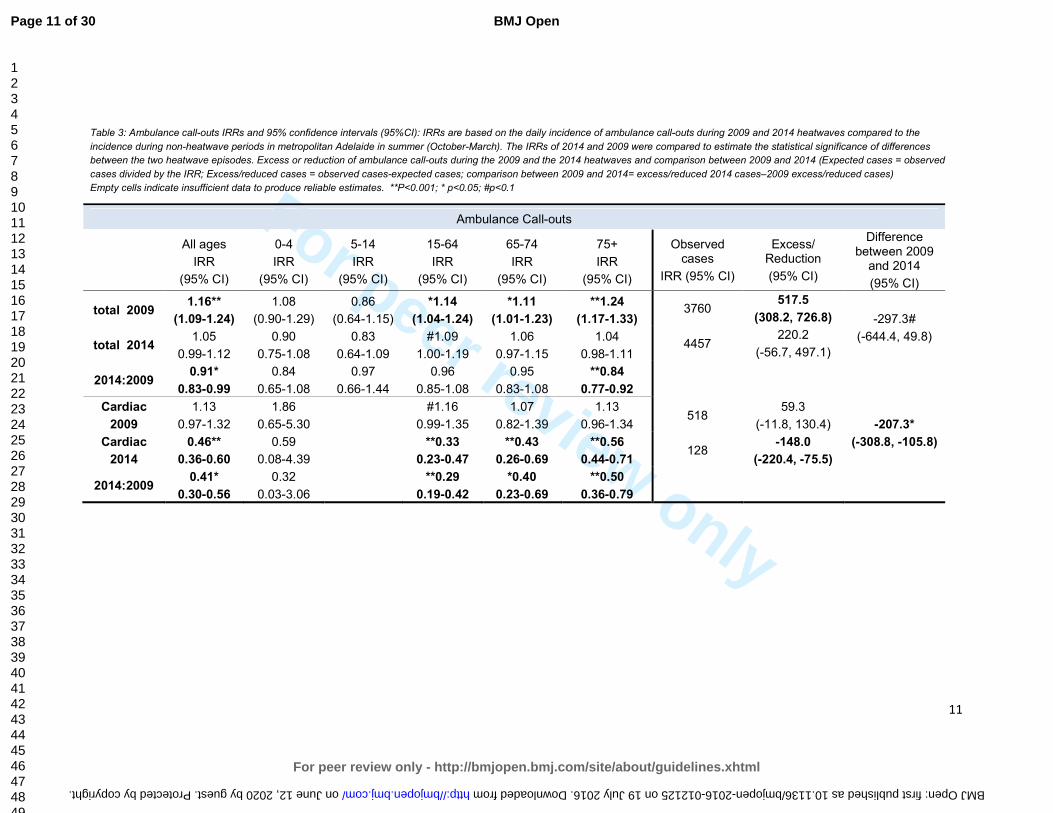
Table 3 shows the IRRs for ambulance call-outs during heatwaves compared to non-
heatwave periods in 2009 and 2014. In 2009, the incidence of total ambulance call-
outs increased by 16% over non-heatwaves in the warm season. Compared to
hw2009, total call-outs were decreased during hw2014, with the 2014 point estimate
indicating a non-significant 5% increase over non-heatwave periods. Reductions
compared to hw2009 were also evident across all age groups.
Description Min. Max. Mean SD.
Ambulance call-outs
hw 2009: 13 days 243 361 291.1 36.1
Non-hw periods in 2009 169 days
187 301 249.5 20.1
hw 2014: 13 days 306 392 342.9 25.4
Non-hw periods 2014 169 days 258 391 326.4 25.0
Hospital admissions
hw 2009 460 1742 1322.9 506.4
Non-hw periods 2009 271 1798 1231.5 523.4
hw 2014 399 1713 1300.0 528.8
Non-hw periods 2014 334 1972 1311.7 553.9
Emergency department presentations
hw 2009 905 1065 994.5 54.3
Non-hw periods 2009 802 1122 971.5 59.0
hw 2014 918 1139 999.9 55.7
Non-hw periods 2014 915 1209 1034.3 66.4
Mortality
hw 2009 15 44 28.6 9.4
Non-hw periods 2009 14 41 26.1 5.6
hw 2014 21 34 28.0 4.1
Non-hw periods 2014 15 38 25.3 4.7
Page 9 of 30
For peer review only - http://bmjopen.bmj.com/site/about/guidelines.xhtml
BMJ Open
123456789101112131415161718192021222324252627282930313233343536373839404142434445464748495051525354555657585960
on June 12, 2020 by guest. Protected by copyright.
http://bmjopen.bm
j.com/
BM
J Open: first published as 10.1136/bm
jopen-2016-012125 on 19 July 2016. Dow
nloaded from
For peer review only
10
Total and age-related cardiac-related call-outs in 2014 showed a protective effect
during the heatwaves compared to the non-heatwave periods. In 2009 the reverse
occurred.
Comparing 2014 and 2009
Comparing IRRs indicated significant reductions in all-age total and cardiac-related
call-outs occurring in 2014. Age specific differences were manifest in the 75+ age
group for total call-outs and for cardiac call-outs in all adult age groups.
There were 220 excess ambulance call-outs estimated during the hw2014 compared
to 518 in the hw2009 (table 3). Fifty nine excess cardiac-related call-outs were
estimated for the 2009 heatwave; in 2014, a significant reduction of 148 cardiac-
related call-outs was assessed. Based on these estimates there were 297 (9%)
fewer total call-outs and 207 (59%) fewer cardiac-related call-outs during the hw2014
than the hw2009 outcomes.
Page 10 of 30
For peer review only - http://bmjopen.bmj.com/site/about/guidelines.xhtml
BMJ Open
123456789101112131415161718192021222324252627282930313233343536373839404142434445464748495051525354555657585960
on June 12, 2020 by guest. Protected by copyright.
http://bmjopen.bm
j.com/
BM
J Open: first published as 10.1136/bm
jopen-2016-012125 on 19 July 2016. Dow
nloaded from
For peer review only
11
Table 3: Ambulance call-outs IRRs and 95% confidence intervals (95%CI): IRRs are based on the daily incidence of ambulance call-outs during 2009 and 2014 heatwaves compared to the
incidence during non-heatwave periods in metropolitan Adelaide in summer (October-March). The IRRs of 2014 and 2009 were compared to estimate the statistical significance of differences
between the two heatwave episodes. Excess or reduction of ambulance call-outs during the 2009 and the 2014 heatwaves and comparison between 2009 and 2014 (Expected cases = observed
cases divided by the IRR; Excess/reduced cases = observed cases-expected cases; comparison between 2009 and 2014= excess/reduced 2014 cases–2009 excess/reduced cases)
Empty cells indicate insufficient data to produce reliable estimates. **P<0.001; * p<0.05; #p<0.1
Ambulance Call-outs
All ages
IRR
(95% CI)
0-4
IRR
(95% CI)
5-14
IRR
(95% CI)
15-64
IRR
(95% CI)
65-74
IRR
(95% CI)
75+
IRR
(95% CI)
Observed cases
IRR (95% CI)
Excess/ Reduction
(95% CI)
Difference between 2009
and 2014
(95% CI)
total 2009 1.16**
(1.09-1.24)
1.08
(0.90-1.29)
0.86
(0.64-1.15)
*1.14
(1.04-1.24)
*1.11
(1.01-1.23)
**1.24
(1.17-1.33) 3760
517.5
(308.2, 726.8) -297.3#
(-644.4, 49.8) total 2014
1.05
0.99-1.12
0.90
0.75-1.08
0.83
0.64-1.09
#1.09
1.00-1.19
1.06
0.97-1.15
1.04
0.98-1.11 4457
220.2
(-56.7, 497.1)
2014:2009 0.91*
0.83-0.99
0.84
0.65-1.08
0.97
0.66-1.44
0.96
0.85-1.08
0.95
0.83-1.08
**0.84
0.77-0.92
Cardiac
2009
1.13
0.97-1.32
1.86
0.65-5.30
#1.16
0.99-1.35
1.07
0.82-1.39
1.13
0.96-1.34 518
59.3
(-11.8, 130.4) -207.3*
(-308.8, -105.8) Cardiac
2014
0.46**
0.36-0.60
0.59
0.08-4.39
**0.33
0.23-0.47
**0.43
0.26-0.69
**0.56
0.44-0.71 128
-148.0
(-220.4, -75.5)
2014:2009 0.41*
0.30-0.56
0.32
0.03-3.06
**0.29
0.19-0.42
*0.40
0.23-0.69
**0.50
0.36-0.79
Page 11 of 30
For peer review only - http://bmjopen.bmj.com/site/about/guidelines.xhtml
BMJ Open
123456789101112131415161718192021222324252627282930313233343536373839404142434445464748495051525354555657585960
on June 12, 2020 by guest. Protected by copyright. http://bmjopen.bmj.com/ BMJ Open: first published as 10.1136/bmjopen-2016-012125 on 19 July 2016. Downloaded from

For peer review only
12
Emergency presentations
Table 4 presents the IRRs of the emergency presentations for the 2009 and 2014
heatwaves. Total emergency presentations were increased during hw2009, however
in hw2014 a significant 3% decrease was observed when compared to non-
heatwave periods. This inverse risk was predominantly observed in the younger age
groups. Comparison of the hw2009 and hw2014 IRRs indicated that the reduction
was significant for emergency presentations in the 75+ age group only. Renal and
heat-related presentations were significantly increased within several age groups
during hw2009. During the hw2014, renal presentations were very similar to the non-
heatwave periods indicated by IRRs near one. Heat-related IRRs were reduced by
one-third, but still indicated significant increases over non-heatwave periods.
Comparing 2009 and 2014
When compared, renal and heat-related IRRs were statistically significantly reduced
for total presentations and for almost all age groups.
Total emergency presentations were reduced by 440 compared to non-heatwave
periods (table 4) in 2014, while in 2009 an excess of 302 cases was estimated. On
both occasions the confidence intervals were wide and the results were non-
significant. The difference between 2009 and 2014 presentations indicated a non-
significant reduction of 742 cases.
There were 125 excess renal presentations estimated during hw2009 and a
reduction of 8.7 cases in 2014.The difference between 2009 and 2014 was
statistically significant with an estimated 134 (30%) fewer renal cases than expected.
The excess in heat-related presentations during hw2014 was estimated to be 160
cases, approximately half of the excess 304 cases in 2009. The difference between
the 2009 and 2014 events showed a significant reduction of 145 (56%) heat-related
cases compared to expected cases.
Page 12 of 30
For peer review only - http://bmjopen.bmj.com/site/about/guidelines.xhtml
BMJ Open
123456789101112131415161718192021222324252627282930313233343536373839404142434445464748495051525354555657585960
on June 12, 2020 by guest. Protected by copyright.
http://bmjopen.bm
j.com/
BM
J Open: first published as 10.1136/bm
jopen-2016-012125 on 19 July 2016. Dow
nloaded from

For peer review only
13
Table 4 Emergency IRRs and 95% confidence intervals (95%CI): IRRs are based on the daily incidence of emergency presentations during 2009 and 2014 heatwaves compared to the incidence during non-heatwave periods in metropolitan Adelaide in summer (October-March). The IRRs of 2014 and 2009 were compared to estimate the statistical significance of differences between the two heatwave episodes. **P<0.001; * p<0.05; #p<0.1
Emergency presentation
All ages
IRR
(95% CI)
0-4
IRR
(95% CI)
5-14
IRR
(95% CI)
15-64
IRR
(95% CI)
65-74
IRR
(95% CI)
75+
IRR
(95% CI)
Observed
cases
Excess/ Reduction of
cases
(95% CI)
Difference between 2009
and 2014
(95% CI)
total 2009 *1.02
(1.01-1.04) *0.90
(0.81-1.00) *0.83
(0.71-0.97) 1.05
(0.99-1.12) 1.004
(0.91-1.11) **1.17
(1.11-1.22)
12928
301.7 (-318.7, 922.2) -741.5
(-1658.6, 175.6) total 2014
**0.97 (0.95-0.98)
**0.83 (0.75-0.92)
*0.78 (0.66-0.91)
1.02 (0.96-1.09)
0.97 (0.88-1.07)
0.99 (0.94-1.03)
12998 -439.8
(-1115.1, 235.6)
2014-2009 0.95
(0.88-1.01) 0.92
(0.89-1.07) 0.94
(0.75-1.18) 0.97
(089-1.07) 0.97
(0.84-1.11) **0.85
(0.79-0.90)
Renal 2009 **1.39
(1.23-1.58) *1.51
(1.02-2.23) 1.25
(0.71-2.21) **1.32
(1.16-1.50) 1.21
(0.88-1.67) **1.67
(1.32-2.13) 443
125.2 (84.4, 166.0) -133.9**
(-201.1,-66.7) Renal 2014 0.98
(0.85-1.13) 0.82
(0.51-1.31) 0.84
(0.45-1.60) 0.97
(0.84-1.12) 0.78
(0.55-1.11) 1.15
(0.88-1.49) 359
-8.7 (-62.1, 44.7)
Renal
2014;2009
**0.70 (0.58-0.85)
*0.54 (0.29-1.00)
0.67 (0.29-1.59)
*0.74 (0.61-0.89)
#0.64 (0.40-1.04)
*0.69 (0.48-0.98)
Heat-related
total 2009
**12.03 (9.23-15.68)
*3.36 (1.54-7.30)
*3.94 (1.30-11.94)
**12.41 (8.69-17.74)
**9.48 (6.13-14.65)
**15.85 (12.49-20.12)
332 304.4
(297.0, 311.8)
-144.8**
(-159.2, -130.4)
Heat-related
total 2014
**5.27 (3.81-7.30)
1.23 (0.49-3.08)
*3.91 (1.40-10.94)
**6.10 (4.02-9.25)
**4.41 (2.75-7.06)
**6.12 (4.70-7.97)
197 159.6
(147.3, 172.0)
Heat-related
2014:2009
**0.44 (0.29-0.67)
0.37 (0.11-1.22)
0.99 (0.22-4.48)
*0.49 (0.28-0.85)
*0.47 (0.25-0.88)
**0.39 (0.27-0.55)
Page 13 of 30
For peer review only - http://bmjopen.bmj.com/site/about/guidelines.xhtml
BMJ Open
123456789101112131415161718192021222324252627282930313233343536373839404142434445464748495051525354555657585960
on June 12, 2020 by guest. Protected by copyright. http://bmjopen.bmj.com/ BMJ Open: first published as 10.1136/bmjopen-2016-012125 on 19 July 2016. Downloaded from

For peer review only
14
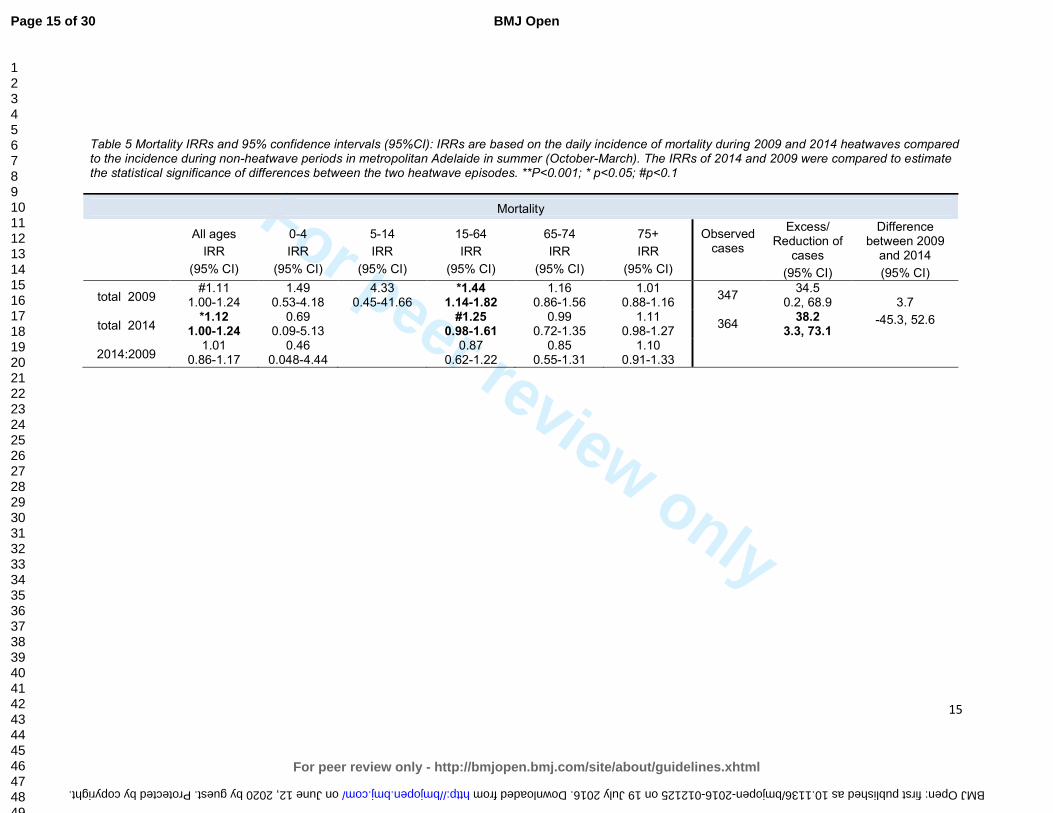
Mortality
When compared to non-heatwave periods, total mortality increased during hw2009
(11%) and hw2014 (12%) with the increase during hw2014 being statistically
significant. Table 5 displays the estimates for excess mortality for the 2009 and 2014
events and indicates that the difference between hw2009 (34.5 cases) and hw2014
(38.2 cases) were approximately 4 extra mortality cases, which was not statistically
significant.
Hospital admissions
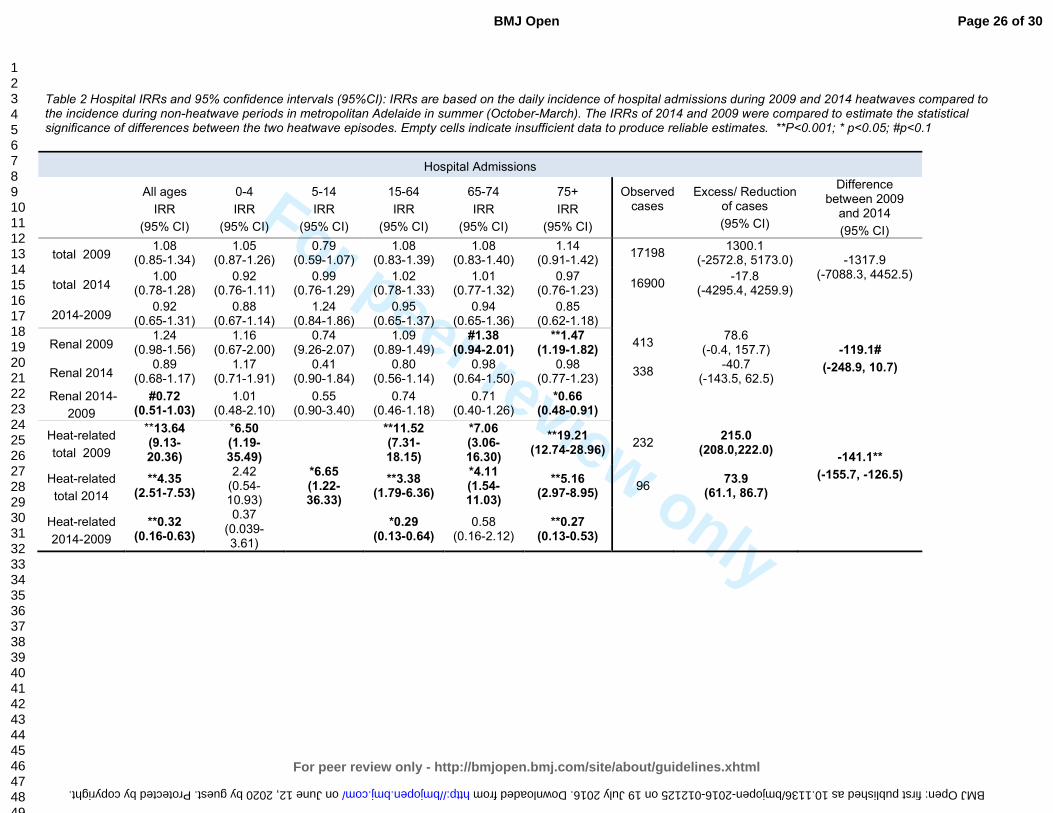
The results from the analysis of hospital admissions data showed similar trends to
emergency presentations, with a reduced impact on renal and heat-related hospital
admissions apparent during hw2014 compared to hw2009. These results are
included in the online appendix as table 2.
Page 14 of 30
For peer review only - http://bmjopen.bmj.com/site/about/guidelines.xhtml
BMJ Open
123456789101112131415161718192021222324252627282930313233343536373839404142434445464748495051525354555657585960
on June 12, 2020 by guest. Protected by copyright.
http://bmjopen.bm
j.com/
BM
J Open: first published as 10.1136/bm
jopen-2016-012125 on 19 July 2016. Dow
nloaded from
For peer review only
15
Table 5 Mortality IRRs and 95% confidence intervals (95%CI): IRRs are based on the daily incidence of mortality during 2009 and 2014 heatwaves compared to the incidence during non-heatwave periods in metropolitan Adelaide in summer (October-March). The IRRs of 2014 and 2009 were compared to estimate the statistical significance of differences between the two heatwave episodes. **P<0.001; * p<0.05; #p<0.1
Mortality
All ages
IRR
(95% CI)
0-4
IRR
(95% CI)
5-14
IRR
(95% CI)
15-64
IRR
(95% CI)
65-74
IRR
(95% CI)
75+
IRR
(95% CI)
Observed cases
Excess/ Reduction of
cases
(95% CI)
Difference between 2009
and 2014
(95% CI)
total 2009 #1.11
1.00-1.24 1.49
0.53-4.18 4.33
0.45-41.66 *1.44
1.14-1.82 1.16
0.86-1.56 1.01
0.88-1.16 347
34.5 0.2, 68.9 3.7
-45.3, 52.6 total 2014 *1.12
1.00-1.24 0.69
0.09-5.13
#1.25 0.98-1.61
0.99 0.72-1.35
1.11 0.98-1.27
364 38.2
3.3, 73.1
2014:2009 1.01
0.86-1.17 0.46
0.048-4.44
0.87 0.62-1.22
0.85 0.55-1.31
1.10 0.91-1.33
Page 15 of 30
For peer review only - http://bmjopen.bmj.com/site/about/guidelines.xhtml
BMJ Open
123456789101112131415161718192021222324252627282930313233343536373839404142434445464748495051525354555657585960
on June 12, 2020 by guest. Protected by copyright. http://bmjopen.bmj.com/ BMJ Open: first published as 10.1136/bmjopen-2016-012125 on 19 July 2016. Downloaded from
For peer review only
16
DISCUSSION
Quantitative evaluation of the effectiveness of public health interventions for
heatwaves can be difficult if comparable weather conditions do not occur thereafter.
In summer 2014, extreme heat warnings were pronounced twice in short succession
in Adelaide and the heat intensity and duration closely resembled the single extreme
2009 event. This conjuncture enabled a quantitative assessment of a HWS (the
intervention) which was introduced after the 2009 heatwave.
The evaluation of an intervention is an important task considering that intervention
measures can be costly. There are various measures of success including
improvement of public awareness, behaviour changes or reduced health outcomes.23
The latter was the aim of this evaluation. The cornerstones of the intervention are the
threshold-based triggers for activation of the system, the Red Cross welfare checks,
extensive media coverage and the roll-out of heat plans into the relevant vulnerable
communities.13-14
Our analysis indicates that the heatwave event in 2014 was associated with fewer
adverse health outcomes than observed during hw2009, including ambulance call-
outs, emergency presentations and hospital admissions. As the two heatwave
events were comparable in their duration and intensity, our findings suggest that the
interventions during hw2014 were effective in minimising the population health
impact of this event.
It is possible that post hw2009 adaptation has occurred and people have
implemented changes in their households such as the installation of air conditioners,
extra shading, heat-related structural changes to the built environment and
behaviour changes. Notwithstanding, the large reductions in health outcomes are
unlikely to have occurred without the parallel development of the HWS. This is
supported by the findings from a recent heat-related representative survey in the
older population in South Australia following introduction of the HWS, which
established that 76.4% of the 499 responders recalled health warnings being issued
during extreme heat in SA.17
The two messages that stood out most as being
Page 16 of 30
For peer review only - http://bmjopen.bmj.com/site/about/guidelines.xhtml
BMJ Open
123456789101112131415161718192021222324252627282930313233343536373839404142434445464748495051525354555657585960
on June 12, 2020 by guest. Protected by copyright.
http://bmjopen.bm
j.com/
BM
J Open: first published as 10.1136/bm
jopen-2016-012125 on 19 July 2016. Dow
nloaded from
For peer review only
17
recalled were “stay hydrated” (78%) and “minimise sun exposure” (53%). Also, when
asked about change of behaviour due to heat warnings, 44% of respondents
answered positively.
While direct-heat related IRRs were reduced in the hw2014 compared to the
hw2009, they still were significantly increased indicating scope for further prevention
measures. Not so for renal disease, where no detectable increases in renal
presentations were indicated in the hw2014. This is surprising considering the
consistency in renal studies reporting increases during heatwaves 24-25
and
associations between temperature and the number of renal admissions.26,27
The
messages disseminated during the heat warnings in 2014 focussed on personal
reduction of heat exposure and the need for adequate hydration.28
It is possible that
the reductions in renal and heat-related cases may have been due to people
changing behaviours as a result of the wide distribution of these messages and the
special attention attributed to the at-risk population.
While the results show morbidity reductions in 2014 compared with 2009, the excess
mortality remained relatively constant. In 2009, 34.5 excess deaths (11%) were
estimated and 38.2 (12%) in 2014. Compared to other cities, and considering
population size, Adelaide has a low excess mortality during extreme heat. In 2009,
simultaneously to the Adelaide heatwave, Victoria reported 374 excess deaths (62%
increase).29
In Chicago in 1995, 700 excess deaths (74% increase on the day with
highest excess deaths) were reported and in the major European heat wave of 2003,
more than 15,000 (60%) excess deaths occurred in France alone. 30-32
The lower
excess mortality in Adelaide, especially in comparison to Victoria, may be explained
by better adaptation to heat due to more extensive and extreme historical heat
experience. A comparison of heat-health behaviours in older people in Victoria and
SA after the 2009 event indicated that older people in SA had a higher prevalence of
air conditioners and a higher recall of heat-related warning messages compared to
their Victorian counterparts.33
Nevertheless, an increase of 12% of mortality is still
too high considering that deaths due to high temperatures should, in theory, be
avoidable. Information about the underlying contributing factors is important to
understand how to further refine prevention measures.
Our findings show that during the 2009 and 2014 episodes, the 15-64 year age
group was particularly affected by mortality. Occupational exposures and the attitude
Page 17 of 30
For peer review only - http://bmjopen.bmj.com/site/about/guidelines.xhtml
BMJ Open
123456789101112131415161718192021222324252627282930313233343536373839404142434445464748495051525354555657585960
on June 12, 2020 by guest. Protected by copyright.
http://bmjopen.bm
j.com/
BM
J Open: first published as 10.1136/bm
jopen-2016-012125 on 19 July 2016. Dow
nloaded from

For peer review only
18
of having to get on with life and work despite the heat, may have contributed to the
increased mortality in this age group. Preliminary evidence from a case-control study
in Adelaide indicates that those who died during the 2009 heatwave were much
more likely to have had pre-existing heart disease and be lacking in social support
compared to the general community control group.34
This evidence could be useful
for the development of further preventive measures and focussed health warnings.
There are some limitations to this study, particularly related to the separation of the
hw2014 by a 9 day non-heatwave break. This may have rendered the intervention
hw2014 as not entirely comparable to the 13 day continuing episode in 2009.
Nevertheless, during both parts of the 2014 heatwaves, maximum temperatures of
above 40°C were experienced over several days indicating risks to human health
according to heat-health thresholds investigations in Adelaide 13-14
.
The evaluation of the effectiveness of the HWS and interventions in Adelaide is at an
early stage and this study has explored the effect of the intervention on health
outcomes only. In order to make further progress and achieve further reductions it
will be necessary to assess how the services provided are received, whether they
penetrate to the people most at need, whether their heightened awareness is
transformed into likely beneficial behaviour changes and whether these
improvements can be sustained.
CONCLUSION
This comparison of two extreme heat events in metropolitan Adelaide, separated by
five years, has provided evidence of improvements in health outcomes post
intervention measures, mostly linked to reductions in renal and heat-related
morbidity. The renal-related health outcomes in 2014 showed significant reductions
compared to what was expected in relation to hw2009 suggesting that awareness of
warnings and advice during the heatwave may be a contributing factor. While direct
heat-related illness dropped significantly, excess cases were still observed during
the hw2014. Knowing that long term prognosis can be poor following heat stress and
heat stroke, particularly for older people, more emphasis should be placed on better
communication with vulnerable groups to reduce heat exposure. While mortality is
relatively low during heatwaves in Adelaide compared to other larger cities worldwide
Page 18 of 30
For peer review only - http://bmjopen.bmj.com/site/about/guidelines.xhtml
BMJ Open
123456789101112131415161718192021222324252627282930313233343536373839404142434445464748495051525354555657585960
on June 12, 2020 by guest. Protected by copyright.
http://bmjopen.bm
j.com/
BM
J Open: first published as 10.1136/bm
jopen-2016-012125 on 19 July 2016. Dow
nloaded from

For peer review only
19
and in Australia, better outcomes could still be achieved. Targeted preventive
measures may also have benefits to the wider population considering that everybody
is potentially at risk. Evaluation of interventions is an iterative process and should be
used continuously alongside fine tuning of the intervention measures using
evidence-based research.
Page 19 of 30
For peer review only - http://bmjopen.bmj.com/site/about/guidelines.xhtml
BMJ Open
123456789101112131415161718192021222324252627282930313233343536373839404142434445464748495051525354555657585960
on June 12, 2020 by guest. Protected by copyright.
http://bmjopen.bm
j.com/
BM
J Open: first published as 10.1136/bm
jopen-2016-012125 on 19 July 2016. Dow
nloaded from

For peer review only
20
Acknowledgement
The authors thank Dr David Simon, Director Scientific Services in SA Health for
supporting this study.
Contributor statement
MN: has contributed to the conception and design of the study, has interpreted the
data and has drafted the work and revised it critically for important intellectual
content.
GT: has contributed to the design of the study, the acquisition, analysis and
interpretation of the data and has revised the work for important intellectual content.
AH: has contributed to the interpretation of the data, the draft and revision of the
work for important intellectual content.
SW: has contributed to the interpretation of the data, the draft and revision of the
work for important intellectual content.
YZ: has contributed to the interpretation of the data, the draft and revision of the
work for important intellectual content.
PB: has contributed to the conception of the study and has revised the work critically
for important intellectual content.
All authors: have provided final approval of the version published and are in
agreement to be accountable for all aspects of the work in ensuring that questions
related to the accuracy or integrity of any part of the work are appropriately
investigated and resolved.
Competing Interests:
None declared
Funding:
No funding was received for this study
Data sharing statement:
The routine data analysed for this study are held with the Department for Health and
Ageing, Adelaide, South Australia.
No additional data is available.
Ethical approval:
No ethical approval was required. The study is based on yearly routine heatwave impact assessment using de-identified and aggregated health data.
Page 20 of 30
For peer review only - http://bmjopen.bmj.com/site/about/guidelines.xhtml
BMJ Open
123456789101112131415161718192021222324252627282930313233343536373839404142434445464748495051525354555657585960
on June 12, 2020 by guest. Protected by copyright.
http://bmjopen.bm
j.com/
BM
J Open: first published as 10.1136/bm
jopen-2016-012125 on 19 July 2016. Dow
nloaded from
For peer review only
21
Reference List
1 Nitschke M, Tucker G, Bi P. Morbidity and mortality during heatwaves in metropolitan
Adelaide. MJA 2007;187(11-12):662-5.
2 Nitschke M, Tucker G, Hansen A et al. Impact of two recent extreme heat episodes on
morbidity and mortality in Adelaide, South Australia: a case-series analysis. Environ Health
2011;10(42).
3 Palecki MA, Changnon SA, Kunkel KE. The nature and impacts of the July 1999 heat wave in
the midwestern United States: learning from the lessons of 1995. Bull Am Meteorol Soc
2001; 82:1353-67.
4 White-Newsome JL, Sanchez BN, Parker EA et al. Assessing heat-adaptive behaviors among
older, urban-dwelling adults. Maturitas 2011. (doi: 10.1016/j.maturitas.2011.06.015. Epub
2011 Jul 23).
5 Kalkstein LS, Sheridan SC, Kalkstein AJ. Heat/Health Warning Systems: Development,
Implementation, and Intervention Activities. In: Ebi KL, editor. Biometeorology for
Adaptation to Climate Variability and Change. Springer Science + Business Media; 2009.33-
48.
6 Lowe D, Ebi KL, Forsberg B. Heatwave early warning systems and adaptation advice to
reduce human health consequences of heatwaves. Int J Environ Res Public Health 2011;
8:4623-48.
7 WMO (World Meteorological Organization), 2015: Heatwaves and health: guidance on
warning-system development. WMO-No. 1142, Geneva.
http://www.who.int/globalchange/publications/WMO_WHO_Heat_Health_Guidance_2015.
pdf (accessed: 26 February 2016).
8 Akompab D, Bi P, Williams S et al. Engaging stakeholders in an adaptation process:
governance and institutional arrangements in heat-health policy development in Adelaide,
Australia. Mitig & Adapt Strateg Glob Change 2012;18(7):1001.
9 Toloo G, Fitzgerald G, Aitken P et al. Are heat warning systems effective? Environ Health
2013;12(1):27.
10 Boeckmann M, Rohn I. Is planned adaptation to heat reducing heat-related mortality and
illness? A systematic review. BMC Public Health 2014;14(1):1112.
11 Fouillet A, Rey G, Wagner V, et al. Has the impact of heat waves on mortality changed in
France since the European heat wave of summer 2003? A study of the 2006 heat wave. Int J
Epidemiol 2008;37:309-17.
12 South Australian State Emergency Service. Extreme Heat Plan.
http://www.ses.sa.gov.au/site/community_safety/heatsafe/extreme_heat_plan.jsp
(accessed 26 February 2016).
Page 21 of 30
For peer review only - http://bmjopen.bmj.com/site/about/guidelines.xhtml
BMJ Open
123456789101112131415161718192021222324252627282930313233343536373839404142434445464748495051525354555657585960
on June 12, 2020 by guest. Protected by copyright.
http://bmjopen.bm
j.com/
BM
J Open: first published as 10.1136/bm
jopen-2016-012125 on 19 July 2016. Dow
nloaded from

For peer review only
22
13 Williams S, Nitschke M, Sullivan T et al. Heat and health in Adelaide, South Australia:
Assessment of heat thresholds and temperature relationships. Sci Total Environ2012;
414:128-33.
14 Williams S, Nitschke M, Tucker G et al. Extreme Heat Arrangements in South Australia: an
assessment of trigger temperatures. Health Promot J Austr 2011:S21-7.
15 Red Cross. Telecross REDi Service. http://www.redcross.org.au/telecross-redi.aspx (accessed
26 February 2016).
16 Hansen A, Bi P, Nitschke M et al. Perceptions of heat-susceptibility in older persons: Barriers
to Adaptation. Int J Environ Res Public Health 2013;8:4714-28.
17 Nitschke M, Hansen AL, Bi P et al. Risk factors, health effects and behaviour in older people
during extreme heat: a survey in South Australia. Int J Environ Res Public Health 2013;10:
6721-33.
18 Zhang Y, Nitschke M, Bi P. Risk factors for direct heat-related hospitalization during the 2009
Adelaide heatwave: A case crossover study. Sci Total Environ 2013;442:1-5.
19 Whitaker HJ, Hocine MN, Farrington CP. The methodology of self-controlled case series
studies. Stat Methods Med Res 2009;18(1):7-26.
20 Whitaker HJ, Farrington CP, Spiessens B et al. Tutorial in biostatistics: the self-controlled case
series method. Stat Med 2006;25(10):1768-97.
21 StataCorp. 2013. Stata Statistical Software: Release 13.1. College Station, TX: StataCorp LP.
22 Hansen, MH, Hurwitz, WN, Madow, WG. Sample Survey Methods and Theory, Volumes I and
II, New York: John Wiley & Sons 1953.
23 Bassil KL, Cole DC. Effectiveness of public health interventions in reducing morbidity and
mortality during heat episodes: a structered review. Int J Environ Res Public Health
2010;7:991-01.
24 Semenza JC, McCullough JE, Flanders WD et al. Excess hospital admissions during the July
1995 heat wave in Chicago. Am J Prev Med 1999;16:269-277.
25 Hansen AL, Bi P, Ryan P et al. The effect of heat waves on hospital admissions for renal
disease in a temperate city of Australia. Int J Epidemiol 2008;37(6):1359-65.
26 Green R, Basu R, Malig B et al. The effect of temperature on hospital admissions in nine
California counties. Int J Public Health 2010;55(2):113-21.
27 Fletcher BA, Lin S, Fitzgerald EF, Hwang SA. Association of summer temperatures with
hospital admissions for renal diseases in New York State: a case-crossover study. Am J
Epidemiol 2012;175(9):907-16.
28 SA Health. Extreme Heat.
http://www.sahealth.sa.gov.au/wps/wcm/connect/public+content/sa+health+internet/prot
ecting+public+health/emergency+management/extreme+heat (accessed 26 February 2016).
Page 22 of 30
For peer review only - http://bmjopen.bmj.com/site/about/guidelines.xhtml
BMJ Open
123456789101112131415161718192021222324252627282930313233343536373839404142434445464748495051525354555657585960
on June 12, 2020 by guest. Protected by copyright.
http://bmjopen.bm
j.com/
BM
J Open: first published as 10.1136/bm
jopen-2016-012125 on 19 July 2016. Dow
nloaded from

For peer review only
23
29 Department of Human Services. January 2009 heatwave in Victoria: an assessment of health
impacts. 2009. Melbourne, Victoria,
https://www2.health.vic.gov.au/getfile/?sc_itemid=%7B78C32CE8-A619-47A6-8ED1-
1C1D34566326%7D&title=January%202009%20Heatwave%20in%20Victoria%3A%20an%20A
ssessment%20of%20Health%20Impacts. (accessed 26 February 2016).
30 Semenza JC, Rubin CH, Falter KH et al. Heat-related death during the July 1995 heat wave in
Chicago. N Engl J Med 1996;335(2):84-90.
31 Fouillet A, Rey G, Laurent F et al. Excess mortality related to the August 2003 heat wave in
France. Int Arch Occup Environ Health 2006;80:16-24.
32 Pascal M, Le Tertre A, Saoudi A. Quantification of the heat wave effect on mortality in nine
French cities during summer. PLoS Curr 2012; RRN1307.
33 Hansen A, Bi P, Pisaniello D et al. Heat-health behaviours of older people in two Australian
states. Australas J Ageing 2014;34(1):E19-25.
34 Zhang Y, Nitschke M, Krackowizer A et al. In: Abstracts of the 2011 Conference of the
International Society of Environmental Epidemiology (ISEE). Abstract [O-o53]. Research
Triangle Park, NC: Environ Health Perspect; http://dx.doi.org/10.1289/ehp.isee2014.
Page 23 of 30
For peer review only - http://bmjopen.bmj.com/site/about/guidelines.xhtml
BMJ Open
123456789101112131415161718192021222324252627282930313233343536373839404142434445464748495051525354555657585960
on June 12, 2020 by guest. Protected by copyright.
http://bmjopen.bm
j.com/
BM
J Open: first published as 10.1136/bm
jopen-2016-012125 on 19 July 2016. Dow
nloaded from

For peer review only
Supplementary file
An Evaluation of Two Exceptional Heat Events: The Effects of a Heat Warning System in Adelaide, South Australia.
Table 1 Daily maximum and minimum temperature during the 2009 and the 2014 heatwaves. Shaded area represent days with
extreme heat warning in 2014. No warning was implemented in 2009.
Extreme heat period 2009 Extreme heat period 2014/1 Extreme heat period 2014/2
Date Min T Max T Date Min T Max T Date Min T Max T
26-01-09 16.9 36.6 12-01-14 16.6 35.5 27-01-14 17.6 39.1
27-01-09 21.2 43.2 13-01-14 22.1 42.1 28-01-14 20.3 43
28-01-09 30.7 45.7 14-01-14 25.3 45.1 29-01-14 18.8 31.3
29-01-09 33.9 43.4 15 01-14 27.1 43.7 30-01-14 21.7 36.7
30-01-09 29.4 43.1 16 01-14 29.9 44.2 31-01-14 20.9 37.6
31-01-09 27.5 41.1 17-01-14 28.3 42.7 01-02-14 22.7 43.4
01-02-09 25.9 40.6 02-02-14 28.7 44.7
02-02-09 28.3 38.8
03-02-09 21.5 36.3
04-02-09 19.3 33
05-02-09 19.1 35.6
06-02-09 21 43.9
07-02-09 25.8 41.5
Average T 26.1 41.0 24.9 42.2 21.5 39.4
Min T 16.9 36.3 16.6 35.5 17.6 31.3
Max T 33.9 45.7 29.9 45.1 28.7 44.7
Page 24 of 30
For peer review only - http://bmjopen.bmj.com/site/about/guidelines.xhtml
BMJ Open
123456789101112131415161718192021222324252627282930313233343536373839404142434445464748495051525354555657585960
on June 12, 2020 by guest. Protected by copyright.
http://bmjopen.bm
j.com/
BM
J Open: first published as 10.1136/bm
jopen-2016-012125 on 19 July 2016. Dow
nloaded from
For peer review only
Formulae for calculating the standard errors and the 95% confidence intervals for the
estimates of the excess/reductions during the respective heatwaves and the differences in
cases between the 2009 and 2014 heat events.
Observed cases = N
Expected cases = (N/IRR)
Excess cases = N - (N/IRR)
Calculating the standard error of the excess relies on the following equations;
Var(aX) = a^2*Var(X)
Var(X+Y) = Var(X) + Var(Y) + 2*Cov(X,Y) note that Cov(X,Y)=0 for independent events.
Var(X/Y) = X^2 / Y^2 * (Var(X) / X^2 + Var(Y) / Y^2 - 2 Cov(X,Y) / XY) note that Cov(X,Y)=0 for
independent events.
Therefore Variance for difference in excess from 2009 to 2014
Step1: Variance of IRR: ((IRR upper CI-IRR lower CI)/(2*1.96))2
Step 2: var(excess)=var(N) + var(N/IRR)= N2 *var((IRR)/IRR
4
Where N=observed cases, and the var(N)=0 since N is a constant
= (N2*((IRR upper CI-IRR lower CI)/(2*1.96))
2/IRR
4)
Step 3: 95%CI for excess: excess-1.96*SE ; excess+1.96*SE
Step 4: p-value for excess (z-test): 2*(1-NORMSDIST(ABS(excess/SE(excess))))
Step 5: SE of difference between excess 2009 and 2014: square root(var(excess2009) +
var(excess2014))
because the excess for 2009 is independent of the excess for 2014.
To calculate 95% CI for the difference between excess 2009 and 2014
Step 6 : (excess2014-excess2009)-1.96*SE(from step 5), (excess2014-excess2009)+1.96*SE(from
step 5)
Step 7: p-value for difference in excess from 2009 to 2014 (z-test): 2*(1-NORMSDIST(ABS((difference
in excess)/SE(from step 5))))
Page 25 of 30
For peer review only - http://bmjopen.bmj.com/site/about/guidelines.xhtml
BMJ Open
123456789101112131415161718192021222324252627282930313233343536373839404142434445464748495051525354555657585960
on June 12, 2020 by guest. Protected by copyright.
http://bmjopen.bm
j.com/
BM
J Open: first published as 10.1136/bm
jopen-2016-012125 on 19 July 2016. Dow
nloaded from
For peer review only
Table 2 Hospital IRRs and 95% confidence intervals (95%CI): IRRs are based on the daily incidence of hospital admissions during 2009 and 2014 heatwaves compared to the incidence during non-heatwave periods in metropolitan Adelaide in summer (October-March). The IRRs of 2014 and 2009 were compared to estimate the statistical significance of differences between the two heatwave episodes. Empty cells indicate insufficient data to produce reliable estimates. **P<0.001; * p<0.05; #p<0.1
Hospital Admissions
All ages
IRR
(95% CI)
0-4
IRR
(95% CI)
5-14
IRR
(95% CI)
15-64
IRR
(95% CI)
65-74
IRR
(95% CI)
75+
IRR
(95% CI)
Observed cases
Excess/ Reduction of cases
(95% CI)
Difference between 2009 and 2014
(95% CI)
total 2009 1.08
(0.85-1.34) 1.05
(0.87-1.26) 0.79
(0.59-1.07) 1.08
(0.83-1.39) 1.08
(0.83-1.40) 1.14
(0.91-1.42) 17198
1300.1 (-2572.8, 5173.0)
-1317.9
(-7088.3, 4452.5)
total 2014
1.00 (0.78-1.28)
0.92 (0.76-1.11)
0.99 (0.76-1.29)
1.02 (0.78-1.33)
1.01 (0.77-1.32)
0.97 (0.76-1.23)
16900 -17.8
(-4295.4, 4259.9)
2014-2009 0.92
(0.65-1.31) 0.88
(0.67-1.14) 1.24
(0.84-1.86) 0.95
(0.65-1.37) 0.94
(0.65-1.36) 0.85
(0.62-1.18)
Renal 2009 1.24
(0.98-1.56) 1.16
(0.67-2.00) 0.74
(9.26-2.07) 1.09
(0.89-1.49) #1.38
(0.94-2.01) **1.47
(1.19-1.82) 413
78.6 (-0.4, 157.7) -119.1#
(-248.9, 10.7) Renal 2014 0.89
(0.68-1.17) 1.17
(0.71-1.91) 0.41
(0.90-1.84) 0.80
(0.56-1.14) 0.98
(0.64-1.50) 0.98
(0.77-1.23) 338
-40.7 (-143.5, 62.5)
Renal 2014-
2009
#0.72 (0.51-1.03)
1.01 (0.48-2.10)
0.55 (0.90-3.40)
0.74 (0.46-1.18)
0.71 (0.40-1.26)
*0.66 (0.48-0.91)
Heat-related
total 2009
**13.64 (9.13-20.36)
*6.50 (1.19-35.49)
**11.52 (7.31-18.15)
*7.06 (3.06-16.30)
**19.21 (12.74-28.96)
232 215.0
(208.0,222.0)
-141.1**
(-155.7, -126.5)
Heat-related
total 2014
**4.35 (2.51-7.53)
2.42 (0.54-10.93)
*6.65 (1.22-36.33)
**3.38 (1.79-6.36)
*4.11 (1.54-11.03)
**5.16 (2.97-8.95)
96 73.9
(61.1, 86.7)
Heat-related
2014-2009
**0.32 (0.16-0.63)
0.37 (0.039-3.61)
*0.29
(0.13-0.64) 0.58
(0.16-2.12) **0.27
(0.13-0.53)
Page 26 of 30
For peer review only - http://bmjopen.bmj.com/site/about/guidelines.xhtml
BMJ Open
123456789101112131415161718192021222324252627282930313233343536373839404142434445464748495051525354555657585960
on June 12, 2020 by guest. Protected by copyright. http://bmjopen.bmj.com/ BMJ Open: first published as 10.1136/bmjopen-2016-012125 on 19 July 2016. Downloaded from

For peer review only
Page 27 of 30
For peer review only - http://bmjopen.bmj.com/site/about/guidelines.xhtml
BMJ Open
123456789101112131415161718192021222324252627282930313233343536373839404142434445464748495051525354555657585960
on June 12, 2020 by guest. Protected by copyright.
http://bmjopen.bm
j.com/
BM
J Open: first published as 10.1136/bm
jopen-2016-012125 on 19 July 2016. Dow
nloaded from
For peer review only
1
STROBE Statement—checklist of items that should be included in reports of observational studies
Item
No Recommendation
Title and abstract
Pg 1
Pg 2
1 (a) Indicate the study’s design with a commonly used term in the title or the
abstract
(b) Provide in the abstract an informative and balanced summary of what was
done and what was found
Introduction
Background/rationale
Pg 4
2 Explain the scientific background and rationale for the investigation being
reported
Objectives
Pg 5
3 State specific objectives, including any prespecified hypotheses
Methods
Study design
Pg 5
4 Present key elements of study design early in the paper
Setting
Pg 4 and 5
5 Describe the setting, locations, and relevant dates, including periods of
recruitment, exposure, follow-up, and data collection
Participants
Pg 5
6 (a) Cohort study—Give the eligibility criteria, and the sources and methods of
selection of participants. Describe methods of follow-up
Case-control study—Give the eligibility criteria, and the sources and methods
of case ascertainment and control selection. Give the rationale for the choice of
cases and controls
Cross-sectional study—Give the eligibility criteria, and the sources and
methods of selection of participants
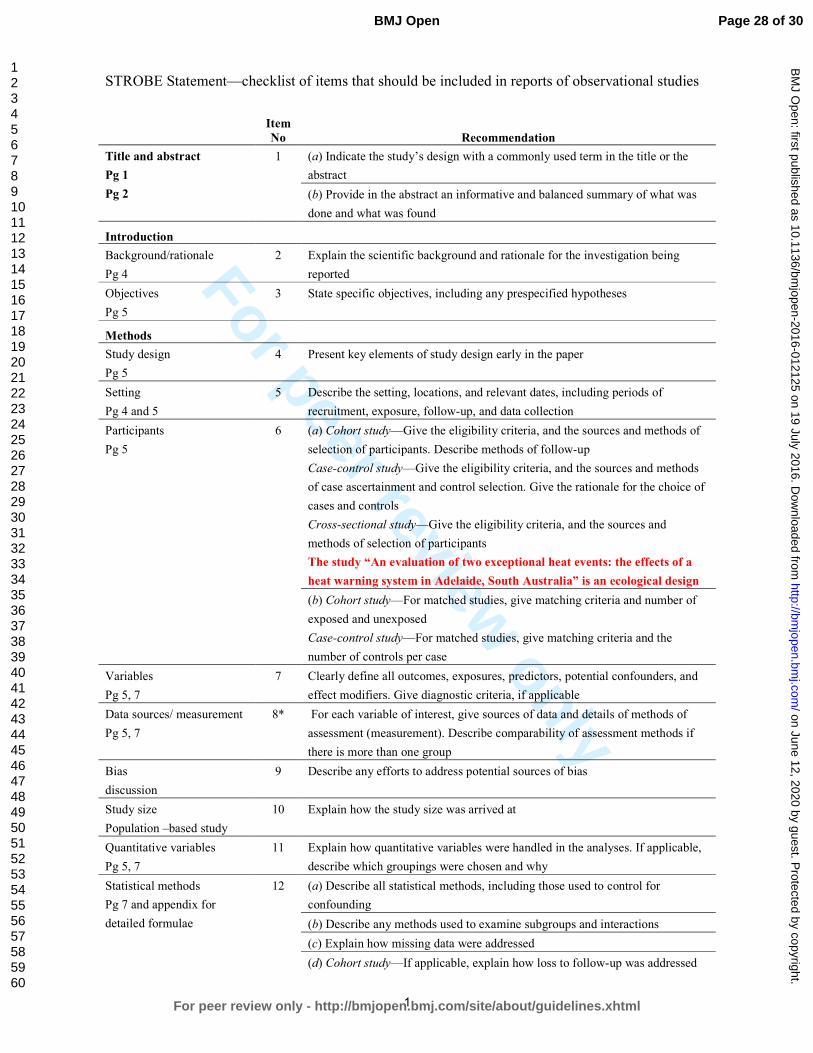
The study “An evaluation of two exceptional heat events: the effects of a
heat warning system in Adelaide, South Australia” is an ecological design
(b) Cohort study—For matched studies, give matching criteria and number of
exposed and unexposed
Case-control study—For matched studies, give matching criteria and the
number of controls per case
Variables
Pg 5, 7
7 Clearly define all outcomes, exposures, predictors, potential confounders, and
effect modifiers. Give diagnostic criteria, if applicable
Data sources/ measurement
Pg 5, 7
8* For each variable of interest, give sources of data and details of methods of
assessment (measurement). Describe comparability of assessment methods if
there is more than one group
Bias
discussion
9 Describe any efforts to address potential sources of bias
Study size
Population –based study
10 Explain how the study size was arrived at
Quantitative variables
Pg 5, 7
11 Explain how quantitative variables were handled in the analyses. If applicable,
describe which groupings were chosen and why
Statistical methods
Pg 7 and appendix for
detailed formulae
12 (a) Describe all statistical methods, including those used to control for
confounding
(b) Describe any methods used to examine subgroups and interactions
(c) Explain how missing data were addressed
(d) Cohort study—If applicable, explain how loss to follow-up was addressed
Page 28 of 30
For peer review only - http://bmjopen.bmj.com/site/about/guidelines.xhtml
BMJ Open
123456789101112131415161718192021222324252627282930313233343536373839404142434445464748495051525354555657585960
on June 12, 2020 by guest. Protected by copyright.
http://bmjopen.bm
j.com/
BM
J Open: first published as 10.1136/bm
jopen-2016-012125 on 19 July 2016. Dow
nloaded from
For peer review only
2
Case-control study—If applicable, explain how matching of cases and controls
was addressed
Cross-sectional study—If applicable, describe analytical methods taking
account of sampling strategy
(e) Describe any sensitivity analyses
Continued on next page
Page 29 of 30
For peer review only - http://bmjopen.bmj.com/site/about/guidelines.xhtml
BMJ Open
123456789101112131415161718192021222324252627282930313233343536373839404142434445464748495051525354555657585960
on June 12, 2020 by guest. Protected by copyright.
http://bmjopen.bm
j.com/
BM
J Open: first published as 10.1136/bm
jopen-2016-012125 on 19 July 2016. Dow
nloaded from
For peer review only
3
Results
Participants
Population-based
study
13* (a) Report numbers of individuals at each stage of study—eg numbers potentially eligible,
examined for eligibility, confirmed eligible, included in the study, completing follow-up,
and analysed
(b) Give reasons for non-participation at each stage
(c) Consider use of a flow diagram
Descriptive data
Ecological design
14* (a) Give characteristics of study participants (eg demographic, clinical, social) and
information on exposures and potential confounders
(b) Indicate number of participants with missing data for each variable of interest
(c) Cohort study—Summarise follow-up time (eg, average and total amount)
Outcome data
Pg 9
15* Cohort study—Report numbers of outcome events or summary measures over time
Case-control study—Report numbers in each exposure category, or summary measures of
exposure
Cross-sectional study—Report numbers of outcome events or summary measures
Main results
Pg 9-15
16 (a) Give unadjusted estimates and, if applicable, confounder-adjusted estimates and their
precision (eg, 95% confidence interval). Make clear which confounders were adjusted for
and why they were included
(b) Report category boundaries when continuous variables were categorized
(c) If relevant, consider translating estimates of relative risk into absolute risk for a
meaningful time period
Other analyses 17 Report other analyses done—eg analyses of subgroups and interactions, and sensitivity
analyses
Discussion
Key results
Pg 16
18 Summarise key results with reference to study objectives
Limitations
Pg 16, 18
19 Discuss limitations of the study, taking into account sources of potential bias or
imprecision. Discuss both direction and magnitude of any potential bias
Interpretation
Pg 18
20 Give a cautious overall interpretation of results considering objectives, limitations,
multiplicity of analyses, results from similar studies, and other relevant evidence
Generalisability
Pg 18
21 Discuss the generalisability (external validity) of the study results
Other information
Funding
N/A
22 Give the source of funding and the role of the funders for the present study and, if
applicable, for the original study on which the present article is based
*Give information separately for cases and controls in case-control studies and, if applicable, for exposed and
unexposed groups in cohort and cross-sectional studies.
Note: An Explanation and Elaboration article discusses each checklist item and gives methodological background and
published examples of transparent reporting. The STROBE checklist is best used in conjunction with this article (freely
available on the Web sites of PLoS Medicine at http://www.plosmedicine.org/, Annals of Internal Medicine at
http://www.annals.org/, and Epidemiology at http://www.epidem.com/). Information on the STROBE Initiative is
available at www.strobe-statement.org.
Page 30 of 30
For peer review only - http://bmjopen.bmj.com/site/about/guidelines.xhtml
BMJ Open
123456789101112131415161718192021222324252627282930313233343536373839404142434445464748495051525354555657585960
on June 12, 2020 by guest. Protected by copyright.
http://bmjopen.bm
j.com/
BM
J Open: first published as 10.1136/bm
jopen-2016-012125 on 19 July 2016. Dow
nloaded from

For peer review only
An evaluation of a heat warning system in Adelaide, South Australia, using case-series analysis
Journal: BMJ Open
Manuscript ID bmjopen-2016-012125.R1
Article Type: Research
Date Submitted by the Author: 17-May-2016
Complete List of Authors: Nitschke, Monika; South Australia Department for Health and Ageing, Public Health Services; University of Adelaide, School of Public Health Tucker, Graeme; South Australia Department for Health and Ageing Epidemiology Branch; University of Adelaide, School of Medicine Hansen, Alana; University of Adelaide, School of Public Health Williams, Susan; The University of Adelaide, School of Public Health Zhang, Ying; University of Sydney, Public Health Bi, Peng; University of Adelaide, School of Public Health
<b>Primary Subject Heading</b>:
Epidemiology
Secondary Subject Heading: Epidemiology, Health policy, Public health
Keywords: heatwave, warning system, intervention, prevention
For peer review only - http://bmjopen.bmj.com/site/about/guidelines.xhtml
BMJ Open on June 12, 2020 by guest. P
rotected by copyright.http://bm
jopen.bmj.com
/B
MJ O
pen: first published as 10.1136/bmjopen-2016-012125 on 19 July 2016. D
ownloaded from

For peer review only
1
Title page
BMJ Open
Article type: Research
Manuscript title
An evaluation of a heat warning system in Adelaide, South Australia, using case-series analysis
Name of authors
1 2Monika Nitschke,
1 3Graeme Tucker,
2Alana Hansen,
2Susan Williams,
4Ying Zhang
2Peng Bi
Affiliations
1 2 Monika Nitschke, Public Health Services, Department for Health and Ageing, South Australia,
Australia, Affiliated to the School of Public Health, University of Adelaide
1 3 Graeme R Tucker, Epidemiology, Department for Health and Ageing, South Australia, Australia.
Affiliated to the School of Medicine, University of Adelaide
2 Alana L Hansen, School of Public Health, University of Adelaide, Adelaide, South Australia,
Australia
2 Susan Williams, School of Public Health, University of Adelaide, Adelaide, South Australia, Australia
4 Ying Zhang, International Public Health, University of Sydney, Sydney, New South Wales, Australia
2 Peng Bi, School of Public Health, University of Adelaide, Adelaide, South Australia, Australia
Corresponding author
Dr Monika Nitschke, SA Health, Level 1, City Centre Building, 11 Hindmarsh Square, Adelaide SA 5000, Australia. Phone: +61 8 822 67126. E-mail: [email protected] Key words: Heatwave, evaluation, warning-system, intervention, prevention
Word count: 3204
Page 1 of 31
For peer review only - http://bmjopen.bmj.com/site/about/guidelines.xhtml
BMJ Open
123456789101112131415161718192021222324252627282930313233343536373839404142434445464748495051525354555657585960
on June 12, 2020 by guest. Protected by copyright.
http://bmjopen.bm
j.com/
BM
J Open: first published as 10.1136/bm
jopen-2016-012125 on 19 July 2016. Dow
nloaded from
For peer review only
2
ABSTRACT
Background Heatwave warning systems aim to assist in reducing health effects
during extreme heat. Evaluations of such systems have been limited. This study
explored the effect on morbidity and mortality of a heatwave warning program in
Adelaide, South Australia, by comparing extreme events in 2009 and 2014, the latter
with exposure to the preventive program.
Methods The health outcomes during the two heatwaves were compared using the
incidence rate ratios of daily ambulance callouts, emergency presentations and
mortality data during the heatwaves compared to non-heatwave periods during the
warm seasons. Excess or reduced numbers of cases were calculated and the
differences in cases between the two heatwaves were estimated.
Results Incidence rate ratios for total ambulance call-outs and emergency
presentations were lower during the 2014 heatwaves compared to the 2009 event.
The estimated differences in health- specific outcomes between 2009 and 2014 were
statistically significant with -207 (59%) for cardiac-related call outs, -134 (30%) for
renal and -145 (56%) for heat-related emergency presentations. Mortality was not
reduced in 2014. There were an estimated 34.5 excess deaths in 2009 and 38.2 in
2014.
Conclusion Morbidity outcomes were reduced significantly during the 2014 event.
The fact that cardiac, renal and heat-related diagnoses were significantly reduced is
likely to be associated with the intervention in 2014, which comprised not only a
public warning through media, but also intense preventive measures directed to
individual populations at risk. Further analysis of risk factors of mortality during
heatwaves should be explored.
Strength and Limitations of this study
• Heatwave warning systems based on defined temperature triggers and adaptive public health measures have been implemented in many cities, but the evaluation of the effectiveness of these systems is limited to mortality.
• This study utilised morbidity and mortality data from two extreme heatwave periods, before and after the introduction of a heatwave warning system in Adelaide, South Australia, to compare the impact.
• There are limitations in conclusively evaluating the effects of a population-based heat health intervention. It could be argued that improvements in health outcomes could be due to adaptation to heat or that it is difficult to compare heatwave events.
• Significant morbidity reductions were observed suggesting that preventive measures contributed to this success. As this was not the case for mortality,
Page 2 of 31
For peer review only - http://bmjopen.bmj.com/site/about/guidelines.xhtml
BMJ Open
123456789101112131415161718192021222324252627282930313233343536373839404142434445464748495051525354555657585960
on June 12, 2020 by guest. Protected by copyright.
http://bmjopen.bm
j.com/
BM
J Open: first published as 10.1136/bm
jopen-2016-012125 on 19 July 2016. Dow
nloaded from

For peer review only
3
further efforts have to be made to explore the reduction of risk factors for mortality during heatwaves.
• Evaluation of interventions is an iterative process and should be used continuously alongside fine tuning of the intervention measures using evidence –based research.
Contributor statement
MN: has contributed to the conception and design of the study, has interpreted the
data and has drafted the work and revised it critically for important intellectual
content.
GT: has contributed to the design of the study, the acquisition, analysis and
interpretation of the data and has revised the work for important intellectual content.
AH: has contributed to the interpretation of the data, the draft and revision of the
work for important intellectual content.
SW: has contributed to the interpretation of the data, the draft and revision of the
work for important intellectual content.
YZ: has contributed to the interpretation of the data, the draft and revision of the
work for important intellectual content.
PB: has contributed to the conception of the study and has revised the work critically
for important intellectual content.
All authors: have provided final approval of the version published and are in
agreement to be accountable for all aspects of the work in ensuring that questions
related to the accuracy or integrity of any part of the work are appropriately
investigated and resolved.
Page 3 of 31
For peer review only - http://bmjopen.bmj.com/site/about/guidelines.xhtml
BMJ Open
123456789101112131415161718192021222324252627282930313233343536373839404142434445464748495051525354555657585960
on June 12, 2020 by guest. Protected by copyright.
http://bmjopen.bm
j.com/
BM
J Open: first published as 10.1136/bm
jopen-2016-012125 on 19 July 2016. Dow
nloaded from

For peer review only
4
INTRODUCTION
Health effects during extreme heat should be largely preventable. However, during
recent heat events worldwide and in Australia, significant increases in morbidity and
mortality have been evident. A systematic analysis of health effects during
heatwaves (3 or more days of maximum temperature ≥ 35°C) for Adelaide, the
capital of South Australia (SA) (1993-2006) indicated morbidity incidence above what
is normally expected during summer periods, but did not show any increases in
mortality.1 This changed when a record breaking 13 day heatwave occurred in
summer 2009 during which mortality increased by 37% in the 15-64 age groups
together with large increases in renal, ischaemic heart disease and direct heat-
related morbidity.2
The unparalleled event in summer 2009 evoked the need for a heat warning system
(HWS) for metropolitan Adelaide’s 1.30 million residents, 76.9% of the total SA
population, considering the predictions of an increased frequency of extreme
heatwaves under the climate change scenario for SA. A HWS was introduced in
November 2009, following the extreme heatwave in January and February 2009.
These systems are now in place in many cities of the world.
Several HWSs in the United States were initiated in response to extreme
heatwaves.3-4
Since the 2003 heatwave in Europe, HWSs have been also rolled out
for many European cities.5-6
Only recently, the World Health Organisation (WHO) in
conjunction with the World Meteorological Organisation (WMO) published a
guidance document on the development of HWSs.7 The Adelaide HWS addresses
most of the pertinent elements presented in the WHO/WMO framework including a
definition of the event, an across the government agreed division of roles and
responsibilities to reduce possible health effects among those at risk, and a
communications strategy to engage with the general population. The process of
establishing a HWS in Adelaide has been described in a recent qualitative study
outlining the collaborative stakeholder engagement process by the state
government.8
Another key factor mentioned in the WHO/WMO framework is the need to evaluate
the success of the health warnings; whether it has offered health protection verified
by a reduction of cases of heat-related illnesses compared to what was expected
Page 4 of 31
For peer review only - http://bmjopen.bmj.com/site/about/guidelines.xhtml
BMJ Open
123456789101112131415161718192021222324252627282930313233343536373839404142434445464748495051525354555657585960
on June 12, 2020 by guest. Protected by copyright.
http://bmjopen.bm
j.com/
BM
J Open: first published as 10.1136/bm
jopen-2016-012125 on 19 July 2016. Dow
nloaded from
For peer review only
5
from previous events, or in terms of public recall of information, and whether the
warning changed the behaviour of people at risk.7 Evaluating heat warning
interventions has been the subject of two recent reviews.9-10
They concur that the
limited intervention studies present indicated positive results. Most of the studies
were limited to the evaluation of mortality. Evaluations of impacts were hampered by
the fact that subsequent heatwaves had different intensities and durations.10-11
In summer of 2014, the Adelaide extreme heat warning system was twice activated
within a one month period, and when combined these two heatwave periods
resembled in duration and intensity the 2009 heat event. This provided a timely
opportunity to compare health outcomes during those events as part of an evaluation
of the effectiveness of the heat health intervention in Adelaide.
METHODS
The study is of ecological design comparing morbidity and mortality of two extreme
heatwaves at the population level.
Health data
Morbidity and mortality data for metropolitan Adelaide for the warm seasons
(October-March) from 1993 to 2014 were obtained from The Department for Health
and Ageing. For comparison purposes, the specific health outcome categories
chosen for analysis were those that were significantly increased during the 2009
heatwave. Ambulance callout data were obtained from SA Ambulance Service.
The following International Classification of Disease (ICD-10) categories of diseases
were selected for emergency department presentations (hospital admissions data
was also obtained and the results can be seen in the appendix online): renal (ICD-10
N00-N399) and direct heat-related (ICD-10, E86, T67, X30). The pre-defined
categories provided by SA Ambulance Service for call-outs were used. Only total
mortality data were used as cause-specific data for 2014 were unavailable.
Page 5 of 31
For peer review only - http://bmjopen.bmj.com/site/about/guidelines.xhtml
BMJ Open
123456789101112131415161718192021222324252627282930313233343536373839404142434445464748495051525354555657585960
on June 12, 2020 by guest. Protected by copyright.
http://bmjopen.bm
j.com/
BM
J Open: first published as 10.1136/bm
jopen-2016-012125 on 19 July 2016. Dow
nloaded from

For peer review only
6
Heat health interventions
Table 1 summarises the elements of Adelaide’s short-term interventions during
extreme heat warning episodes.
The HWS has an all-government approach with the State Emergency Service (SES)
as the ‘Hazard Leader’.12
A HWS is triggered during extreme heat events in
conjunction with the Bureau of Meteorology (BOM) when an average daily
temperature (ADT) of ≥32ºC is forecast for three or more days (average of daily
maximum and minimum = ADT; for example 40°C + 24°C/2=32). This temperature
threshold is based on retrospective analysis of health and temperature data.13-14
Upon reaching the threshold, the government activates heat-related interventions to
the specific needs of vulnerable populations. For example, all people who access
one or more social services are monitored regarding their wellbeing. The general
public is warned, informed and educated through media announcements.
The Australian Red Cross operates an important free service in collaboration with
the state government, specifically directed to people at risk. Those who have been
registered are contacted on a daily basis during the warning period. Carers, doctors,
friends and family members can enrol a person in this system based on a
vulnerability assessment tool.15
Pre-season work is invested into re-assessing extreme heat plans and intervention
measures based on ongoing risk factors research.16-18
Lead agencies Triggers/threshold Interventions
SA State Emergency Service (SES) is advised by Bureau of Meteorology (BOM). SES informs other agencies with one lead day.
3 day rolling forecast of daily average (minimum and maximum temperatures divided by two) temperatures (ADT)
Threshold for an extreme heat warning is reached when ADT is 32C or above (e.g. 40C daytime and 24C night time)
Before/start of summer and ongoing:
• General heat health advice before summer.
• Heat plan review of all relevant government and non-government agencies.
• Meeting of all agencies before the summer
During the alert:
• Activation of specific and co-ordinated extreme heat plans (Local government, state government and non-government), see examples:
• Public alerts and advice through media
• Continuous review of emergency, ambulance and other
Page 6 of 31
For peer review only - http://bmjopen.bmj.com/site/about/guidelines.xhtml
BMJ Open
123456789101112131415161718192021222324252627282930313233343536373839404142434445464748495051525354555657585960
on June 12, 2020 by guest. Protected by copyright.
http://bmjopen.bm
j.com/
BM
J Open: first published as 10.1136/bm
jopen-2016-012125 on 19 July 2016. Dow
nloaded from

For peer review only
7
Table 1: Extreme heat warning in Adelaide, South Australia: description of the program and
interventions.
Temperature data
Temperature data were obtained from a BOM weather station which is
representative of the metropolitan area of Adelaide.
The definition (3 or more days of ≥35ºC) for heatwave impact assessments in
Adelaide was used to compare the health impacts during the 2014 heatwaves to
those in 2009.1-2
The 2009 heatwave (hw2009) (26 January to 7 February) lasted 13
days with an average maximum temperature of 41°C and an average minimum
temperature of 26.1°C. The 2014 heatwave (hw2014) is a composite of two
heatwaves with only 9 days in between (12 January to 17 January and 27 January to
2 February 2014). Each of the events (hw2009 and hw2014) included one day below
35°C. The average maximum temperature during the first component of the hw2014
was 42.2°C and the minimum was 24.8; for the second composite period it was 39.4
and 21.5 accordingly. During both hw2014 periods, extreme heat warnings were
triggered. Table 1 in the online appendix shows the temperature constellation for the
2009 and 2014 heatwaves in more details highlighting the days during which an
extreme heat warning was triggered (based on ADT=32°C forecast by BOM).
Statistics
To compare health impacts, a case series analysis was used.19
Average daily rates
of adverse health outcomes during the defined heatwaves were compared with non-
heatwave periods during the respective warm seasons. The rate ratios of incidences
of health outcomes during ‘case’ and ‘control’ periods were expressed as incidence
rate ratios (IRR).
The analysis was conducted within years, therefore implicitly adjusting for long-term
trends for the years 1993-2014 which provides more accurate standard errors when
season to discuss co-ordination issues.
• Collaborative Research agenda
clinical response capabilities in the health sector.
• Australian Red Cross provision of free support calls to registered vulnerable people.
Page 7 of 31
For peer review only - http://bmjopen.bmj.com/site/about/guidelines.xhtml
BMJ Open
123456789101112131415161718192021222324252627282930313233343536373839404142434445464748495051525354555657585960
on June 12, 2020 by guest. Protected by copyright.
http://bmjopen.bm
j.com/
BM
J Open: first published as 10.1136/bm
jopen-2016-012125 on 19 July 2016. Dow
nloaded from
For peer review only
8
data are over dispersed.20
To calculate the IRR, poisson regression models were
fitted using the statistical software package Stata version 13.21
Each model was
tested for fit, and negative binomial regression models were used to allow for over-
dispersion if required. To assess the impact of the intervention, the statistical
significance of the difference between the 2009 and 2014 IRRs were estimated
using the post estimation command ‘lincom’ in Stata. Furthermore, expected cases
were calculated from the total of the observed cases (N) during the respective
heatwave period divided by the IRR of the relevant health outcome. Excess (or
reduced) cases were obtained by subtracting expected from observed cases [N –
(N/IRR)]. The difference between excess cases in 2009 and 2014 provided an
indicator of effectiveness of the intervention. Standard errors were manipulated using
the formulae provided in Hansen et al to produce a 95% confidence interval (CI) for
the estimates of the excess/reduction and the difference in cases between the 2009
and 2014 events (see appendix for formulae).22
Page 8 of 31
For peer review only - http://bmjopen.bmj.com/site/about/guidelines.xhtml
BMJ Open
123456789101112131415161718192021222324252627282930313233343536373839404142434445464748495051525354555657585960
on June 12, 2020 by guest. Protected by copyright.
http://bmjopen.bm
j.com/
BM
J Open: first published as 10.1136/bm
jopen-2016-012125 on 19 July 2016. Dow
nloaded from

For peer review only
9
RESULTS
Table 2 provides summary statistics for daily average health outcomes during the
two comparison heatwave and non-heatwave periods in 2009 and 2014. Ambulance
call-outs during the hw2009 and hw2014 were higher compared to their respective
non-heatwave periods. Unlike in the hw2009 when average daily hospital and
emergency presentations were higher than during the respective non-heatwave
periods, this was reversed in the hw2014. As in 2009, average mortality was higher
during the heatwave compared to the non-heatwave days in 2014.
Table 2 Descriptive statistics for total daily health outcomes for summer 2008/9 and 2013/14 (October to March), for the two defined heatwaves (hw) (13 days) and non-heat wave periods(169 days): minimum, maximum, mean and standard deviation of daily incidences of ambulance call-outs, hospital admissions, emergency presentations and mortality.
Ambulance call-outs
Table 3 shows the IRRs for ambulance call-outs during heatwaves compared to non-
heatwave periods in 2009 and 2014. In 2009, the incidence of total ambulance call-
outs increased by 16% over non-heatwaves in the warm season. Compared to
hw2009, total call-outs were decreased during hw2014, with the 2014 point estimate
indicating a non-significant 5% increase over non-heatwave periods. Reductions
compared to hw2009 were also evident across all age groups.
Description Min. Max. Mean SD.
Ambulance call-outs
hw 2009: 13 days 243 361 291.1 36.1
Non-hw periods in 2009 169 days
187 301 249.5 20.1
hw 2014: 13 days 306 392 342.9 25.4
Non-hw periods 2014 169 days 258 391 326.4 25.0
Hospital admissions
hw 2009 460 1742 1322.9 506.4
Non-hw periods 2009 271 1798 1231.5 523.4
hw 2014 399 1713 1300.0 528.8
Non-hw periods 2014 334 1972 1311.7 553.9
Emergency department presentations
hw 2009 905 1065 994.5 54.3
Non-hw periods 2009 802 1122 971.5 59.0
hw 2014 918 1139 999.9 55.7
Non-hw periods 2014 915 1209 1034.3 66.4
Mortality
hw 2009 15 44 28.6 9.4
Non-hw periods 2009 14 41 26.1 5.6
hw 2014 21 34 28.0 4.1
Non-hw periods 2014 15 38 25.3 4.7
Page 9 of 31
For peer review only - http://bmjopen.bmj.com/site/about/guidelines.xhtml
BMJ Open
123456789101112131415161718192021222324252627282930313233343536373839404142434445464748495051525354555657585960
on June 12, 2020 by guest. Protected by copyright.
http://bmjopen.bm
j.com/
BM
J Open: first published as 10.1136/bm
jopen-2016-012125 on 19 July 2016. Dow
nloaded from

For peer review only
10
Total and age-related cardiac-related call-outs in 2014 showed a protective effect
during the heatwaves compared to the non-heatwave periods. In 2009 the reverse
occurred.
Comparing 2014 and 2009
Comparing IRRs indicated significant reductions in all-age total and cardiac-related
call-outs occurring in 2014. Age specific differences were manifest in the 75+ age
group for total call-outs and for cardiac call-outs in all adult age groups.
There were 220 excess ambulance call-outs estimated during the hw2014 compared
to 518 in the hw2009 (table 3). Fifty nine excess cardiac-related call-outs were
estimated for the 2009 heatwave; in 2014, a significant reduction of 148 cardiac-
related call-outs was assessed. Based on these estimates there were 297 (9%)
fewer total call-outs and 207 (59%) fewer cardiac-related call-outs during the hw2014
than the hw2009 outcomes.
Page 10 of 31
For peer review only - http://bmjopen.bmj.com/site/about/guidelines.xhtml
BMJ Open
123456789101112131415161718192021222324252627282930313233343536373839404142434445464748495051525354555657585960
on June 12, 2020 by guest. Protected by copyright.
http://bmjopen.bm
j.com/
BM
J Open: first published as 10.1136/bm
jopen-2016-012125 on 19 July 2016. Dow
nloaded from

For peer review only
11
Table 3: Ambulance call-outs IRRs and 95% confidence intervals (95%CI): IRRs are based on the daily incidence of ambulance call-outs during 2009 and 2014 heatwaves compared to the
incidence during non-heatwave periods in metropolitan Adelaide in summer (October-March). The IRRs of 2014 and 2009 were compared to estimate the statistical significance of differences
between the two heatwave episodes. Excess or reduction of ambulance call-outs during the 2009 and the 2014 heatwaves and comparison between 2009 and 2014 (Expected cases = observed
cases divided by the IRR; Excess/reduced cases = observed cases-expected cases; comparison between 2009 and 2014= excess/reduced 2014 cases–2009 excess/reduced cases)
Empty cells indicate insufficient data to produce reliable estimates. **P<0.001; * p<0.05; #p<0.1
Ambulance Call-outs
All ages
IRR
(95% CI)
0-4
IRR
(95% CI)
5-14
IRR
(95% CI)
15-64
IRR
(95% CI)
65-74
IRR
(95% CI)
75+
IRR
(95% CI)
Observed cases
IRR (95% CI)
Excess/ Reduction
(95% CI)
Difference between 2009
and 2014
(95% CI)
total 2009 1.16**
(1.09-1.24)
1.08
(0.90-1.29)
0.86
(0.64-1.15)
*1.14
(1.04-1.24)
*1.11
(1.01-1.23)
**1.24
(1.17-1.33) 3760
517.5
(308.2, 726.8) -297.3#
(-644.4, 49.8) total 2014
1.05
0.99-1.12
0.90
0.75-1.08
0.83
0.64-1.09
#1.09
1.00-1.19
1.06
0.97-1.15
1.04
0.98-1.11 4457
220.2
(-56.7, 497.1)
2014:2009 0.91*
0.83-0.99
0.84
0.65-1.08
0.97
0.66-1.44
0.96
0.85-1.08
0.95
0.83-1.08
**0.84
0.77-0.92
Cardiac
2009
1.13
0.97-1.32
1.86
0.65-5.30
#1.16
0.99-1.35
1.07
0.82-1.39
1.13
0.96-1.34 518
59.3
(-11.8, 130.4) -207.3*
(-308.8, -105.8) Cardiac
2014
0.46**
0.36-0.60
0.59
0.08-4.39
**0.33
0.23-0.47
**0.43
0.26-0.69
**0.56
0.44-0.71 128
-148.0
(-220.4, -75.5)
2014:2009 0.41*
0.30-0.56
0.32
0.03-3.06
**0.29
0.19-0.42
*0.40
0.23-0.69
**0.50
0.36-0.79
Page 11 of 31
For peer review only - http://bmjopen.bmj.com/site/about/guidelines.xhtml
BMJ Open
123456789101112131415161718192021222324252627282930313233343536373839404142434445464748495051525354555657585960
on June 12, 2020 by guest. Protected by copyright. http://bmjopen.bmj.com/ BMJ Open: first published as 10.1136/bmjopen-2016-012125 on 19 July 2016. Downloaded from

For peer review only
12
Emergency presentations
Table 4 presents the IRRs of the emergency presentations for the 2009 and 2014
heatwaves. Total emergency presentations were increased during hw2009, however
in hw2014 a significant 3% decrease was observed when compared to non-
heatwave periods. This inverse risk was predominantly observed in the younger age
groups. Comparison of the hw2009 and hw2014 IRRs indicated that the reduction
was significant for emergency presentations in the 75+ age group only. Renal and
heat-related presentations were significantly increased within several age groups
during hw2009. During the hw2014, renal presentations were very similar to the non-
heatwave periods indicated by IRRs near one. Heat-related IRRs were reduced by
by more than half, but still indicated significant increases over non-heatwave periods.
Comparing 2009 and 2014
When compared, renal and heat-related IRRs were statistically significantly reduced
for total presentations and for almost all age groups.
Total emergency presentations were reduced by 440 compared to non-heatwave
periods (table 4) in 2014, while in 2009 an excess of 302 cases was estimated. On
both occasions the confidence intervals were wide and the results were non-
significant. The difference between 2009 and 2014 presentations indicated a non-
significant reduction of 742 cases.
There were 125 excess renal presentations estimated during hw2009 and a
reduction of 8.7 cases in 2014.The difference between 2009 and 2014 was
statistically significant with an estimated 134 (30%) fewer renal cases than expected.
The excess in heat-related presentations during hw2014 was estimated to be 160
cases, approximately half of the excess 304 cases in 2009. The difference between
the 2009 and 2014 events showed a significant reduction of 145 (56%) heat-related
cases compared to expected cases.
Page 12 of 31
For peer review only - http://bmjopen.bmj.com/site/about/guidelines.xhtml
BMJ Open
123456789101112131415161718192021222324252627282930313233343536373839404142434445464748495051525354555657585960
on June 12, 2020 by guest. Protected by copyright.
http://bmjopen.bm
j.com/
BM
J Open: first published as 10.1136/bm
jopen-2016-012125 on 19 July 2016. Dow
nloaded from

For peer review only
13
Table 4 Emergency IRRs and 95% confidence intervals (95%CI): IRRs are based on the daily incidence of emergency presentations during 2009 and 2014 heatwaves compared to the incidence during non-heatwave periods in metropolitan Adelaide in summer (October-March). The IRRs of 2014 and 2009 were compared to estimate the statistical significance of differences between the two heatwave episodes. **P<0.001; * p<0.05; #p<0.1
Emergency presentation
All ages
IRR
(95% CI)
0-4
IRR
(95% CI)
5-14
IRR
(95% CI)
15-64
IRR
(95% CI)
65-74
IRR
(95% CI)
75+
IRR
(95% CI)
Observed
cases
Excess/ Reduction of
cases
(95% CI)
Difference between 2009
and 2014
(95% CI)
total 2009 *1.02
(1.01-1.04) *0.90
(0.81-1.00) *0.83
(0.71-0.97) 1.05
(0.99-1.12) 1.004
(0.91-1.11) **1.17
(1.11-1.22)
12928
301.7 (-318.7, 922.2) -741.5
(-1658.6, 175.6) total 2014
**0.97 (0.95-0.98)
**0.83 (0.75-0.92)
*0.78 (0.66-0.91)
1.02 (0.96-1.09)
0.97 (0.88-1.07)
0.99 (0.94-1.03)
12998 -439.8
(-1115.1, 235.6)
2014-2009 0.95
(0.88-1.01) 0.92
(0.89-1.07) 0.94
(0.75-1.18) 0.97
(089-1.07) 0.97
(0.84-1.11) **0.85
(0.79-0.90)
Renal 2009 **1.39
(1.23-1.58) *1.51
(1.02-2.23) 1.25
(0.71-2.21) **1.32
(1.16-1.50) 1.21
(0.88-1.67) **1.67
(1.32-2.13) 443
125.2 (84.4, 166.0) -133.9**
(-201.1,-66.7) Renal 2014 0.98
(0.85-1.13) 0.82
(0.51-1.31) 0.84
(0.45-1.60) 0.97
(0.84-1.12) 0.78
(0.55-1.11) 1.15
(0.88-1.49) 359
-8.7 (-62.1, 44.7)
Renal
2014;2009
**0.70 (0.58-0.85)
*0.54 (0.29-1.00)
0.67 (0.29-1.59)
*0.74 (0.61-0.89)
#0.64 (0.40-1.04)
*0.69 (0.48-0.98)
Heat-related
total 2009
**12.03 (9.23-15.68)
*3.36 (1.54-7.30)
*3.94 (1.30-11.94)
**12.41 (8.69-17.74)
**9.48 (6.13-14.65)
**15.85 (12.49-20.12)
332 304.4
(297.0, 311.8)
-144.8**
(-159.2, -130.4)
Heat-related
total 2014
**5.27 (3.81-7.30)
1.23 (0.49-3.08)
*3.91 (1.40-10.94)
**6.10 (4.02-9.25)
**4.41 (2.75-7.06)
**6.12 (4.70-7.97)
197 159.6
(147.3, 172.0)
Heat-related
2014:2009
**0.44 (0.29-0.67)
0.37 (0.11-1.22)
0.99 (0.22-4.48)
*0.49 (0.28-0.85)
*0.47 (0.25-0.88)
**0.39 (0.27-0.55)
Page 13 of 31
For peer review only - http://bmjopen.bmj.com/site/about/guidelines.xhtml
BMJ Open
123456789101112131415161718192021222324252627282930313233343536373839404142434445464748495051525354555657585960
on June 12, 2020 by guest. Protected by copyright. http://bmjopen.bmj.com/ BMJ Open: first published as 10.1136/bmjopen-2016-012125 on 19 July 2016. Downloaded from
For peer review only
14
Mortality
When compared to non-heatwave periods, total mortality increased during hw2009
(11%) and hw2014 (12%) with the increase during hw2014 being statistically
significant. Table 5 displays the estimates for excess mortality for the 2009 and 2014
events and indicates that the difference between hw2009 (34.5 cases) and hw2014
(38.2 cases) were approximately 4 extra mortality cases, which was not statistically
significant.
Hospital admissions
The results from the analysis of hospital admissions data showed similar trends to
emergency presentations, with a reduced impact on renal and heat-related hospital
admissions apparent during hw2014 compared to hw2009. These results are
included in the online appendix as table 2.
Page 14 of 31
For peer review only - http://bmjopen.bmj.com/site/about/guidelines.xhtml
BMJ Open
123456789101112131415161718192021222324252627282930313233343536373839404142434445464748495051525354555657585960
on June 12, 2020 by guest. Protected by copyright.
http://bmjopen.bm
j.com/
BM
J Open: first published as 10.1136/bm
jopen-2016-012125 on 19 July 2016. Dow
nloaded from

For peer review only
15
Table 5 Mortality IRRs and 95% confidence intervals (95%CI): IRRs are based on the daily incidence of mortality during 2009 and 2014 heatwaves compared to the incidence during non-heatwave periods in metropolitan Adelaide in summer (October-March). The IRRs of 2014 and 2009 were compared to estimate the statistical significance of differences between the two heatwave episodes. **P<0.001; * p<0.05; #p<0.1
Mortality
All ages
IRR
(95% CI)
0-4
IRR
(95% CI)
5-14
IRR
(95% CI)
15-64
IRR
(95% CI)
65-74
IRR
(95% CI)
75+
IRR
(95% CI)
Observed cases
Excess/ Reduction of
cases
(95% CI)
Difference between 2009
and 2014
(95% CI)
total 2009 #1.11
1.00-1.24 1.49
0.53-4.18 4.33
0.45-41.66 *1.44
1.14-1.82 1.16
0.86-1.56 1.01
0.88-1.16 347
34.5 0.2, 68.9 3.7
-45.3, 52.6 total 2014 *1.12
1.00-1.24 0.69
0.09-5.13
#1.25 0.98-1.61
0.99 0.72-1.35
1.11 0.98-1.27
364 38.2
3.3, 73.1
2014:2009 1.01
0.86-1.17 0.46
0.048-4.44
0.87 0.62-1.22
0.85 0.55-1.31
1.10 0.91-1.33
Page 15 of 31
For peer review only - http://bmjopen.bmj.com/site/about/guidelines.xhtml
BMJ Open
123456789101112131415161718192021222324252627282930313233343536373839404142434445464748495051525354555657585960
on June 12, 2020 by guest. Protected by copyright. http://bmjopen.bmj.com/ BMJ Open: first published as 10.1136/bmjopen-2016-012125 on 19 July 2016. Downloaded from
For peer review only
16
DISCUSSION
Quantitative evaluation of the effectiveness of public health interventions for
heatwaves can be difficult if comparable weather conditions do not occur thereafter.
In summer 2014, extreme heat warnings were pronounced twice in short succession
in Adelaide and the heat intensity and duration closely resembled the single extreme
2009 event. This conjuncture enabled a quantitative assessment of a HWS (the
intervention) which was introduced after the 2009 heatwave.
There was only one other notable heat event in recent years occurring in March
2008, with 15 consecutive days of 35°C and over, but temperatures merely skimmed
the 40°C mark. The heatwave was therefore not comparable with the 2009 and 2014
events which all included consecutive days well over 40°C including high overnight
temperatures, a heat health threshold pattern that is now recognised as being
associated with considerable risks in Adelaide’s population.2, 13-14
The evaluation of an intervention is an important task considering that intervention
measures can be costly. There are various measures of success including
improvement of public awareness, behaviour changes or reduced health outcomes.23
The latter was the aim of this evaluation. The cornerstones of the intervention are the
threshold-based triggers for activation of the system, the Red Cross welfare checks,
extensive media coverage and the roll-out of heat plans into the relevant vulnerable
communities.13-14
Our analysis indicates that the heatwave event in 2014 was associated with fewer
adverse health outcomes than observed during hw2009, including ambulance call-
outs, emergency presentations and hospital admissions. As the two heatwave
events were comparable in their duration and intensity, our findings suggest that the
interventions during hw2014 were effective in minimising the population health
impact of this event.
It is possible that post hw2009 adaptation has occurred and people have
implemented changes in their households such as the installation of air conditioners,
extra shading, heat-related structural changes to the built environment and
Page 16 of 31
For peer review only - http://bmjopen.bmj.com/site/about/guidelines.xhtml
BMJ Open
123456789101112131415161718192021222324252627282930313233343536373839404142434445464748495051525354555657585960
on June 12, 2020 by guest. Protected by copyright.
http://bmjopen.bm
j.com/
BM
J Open: first published as 10.1136/bm
jopen-2016-012125 on 19 July 2016. Dow
nloaded from

For peer review only
17
behaviour changes. Notwithstanding, the large reductions in health outcomes are
unlikely to have occurred without the parallel development of the HWS. This is
supported by the findings from a recent heat-related representative survey in the
older population in South Australia following introduction of the HWS, which
established that 76.4% of the 499 responders recalled health warnings being issued
during extreme heat in SA.17
The two messages that stood out most as being
recalled were “stay hydrated” (78%) and “minimise sun exposure” (53%). Also, when
asked about change of behaviour due to heat warnings, 44% of respondents
answered positively.
While direct-heat related IRRs were reduced in the hw2014 compared to the
hw2009, they still were significantly increased indicating scope for further prevention
measures. An apparent protective effect of heatwaves on renal emergency
presentations in 2014 (and hospital-related; in supplementary file) is counter-intuitive
considering our previous renal results and evidence from other studies.24-27
It may
have been due to people being particularly cautious about maintaining hydration in
response to heat warnings, but overlooking the importance of fluid intake throughout
summer. The messages disseminated during the heat warnings in 2014 focussed on
personal reduction of heat exposure and the need for adequate hydration.28
It is
possible that the reductions in renal and heat-related cases may have been due to
people changing behaviours as a result of the wide distribution of these messages
and the special attention attributed to the at-risk population.
While the results show morbidity reductions in 2014 compared with 2009, the excess
mortality remained relatively constant. In 2009, 34.5 excess deaths (11%) were
estimated and 38.2 (12%) in 2014. Compared to other cities, and considering
population size, Adelaide has a low excess mortality during extreme heat. In 2009,
simultaneously to the Adelaide heatwave, Victoria reported 374 excess deaths (62%
increase).29
In Chicago in 1995, 700 excess deaths (74% increase on the day with
highest excess deaths) were reported and in the major European heat wave of 2003,
more than 15,000 (60%) excess deaths occurred in France alone. 30-32
The lower
excess mortality in Adelaide, especially in comparison to Victoria, may be explained
by better adaptation to heat due to more extensive and extreme historical heat
experience. A comparison of heat-health behaviours in older people in Victoria and
SA after the 2009 event indicated that older people in SA had a higher prevalence of
Page 17 of 31
For peer review only - http://bmjopen.bmj.com/site/about/guidelines.xhtml
BMJ Open
123456789101112131415161718192021222324252627282930313233343536373839404142434445464748495051525354555657585960
on June 12, 2020 by guest. Protected by copyright.
http://bmjopen.bm
j.com/
BM
J Open: first published as 10.1136/bm
jopen-2016-012125 on 19 July 2016. Dow
nloaded from

For peer review only
18
air conditioners and a higher recall of heat-related warning messages compared to
their Victorian counterparts.33
Nevertheless, an increase of 12% of mortality is still
too high considering that deaths due to high temperatures should, in theory, be
avoidable. Information about the underlying contributing factors is important to
understand how to further refine prevention measures.
Our findings show that during the 2009 and 2014 episodes, the 15-64 year age
group was particularly affected by mortality. Occupational exposures and the attitude
of having to get on with life and work despite the heat, may have contributed to the
increased mortality in this age group. Preliminary evidence from a case-control study
in Adelaide indicates that those who died during the 2009 heatwave were much
more likely to have had pre-existing heart disease and be lacking in social support
compared to the general community control group.34
This evidence could be useful
for the development of further preventive measures and focussed health warnings.
There are some limitations to this study, particularly related to the separation of the
hw2014 by a 9 day non-heatwave break. This may have rendered the intervention
hw2014 as not entirely comparable to the 13 day continuing episode in 2009.
Nevertheless, during both parts of the 2014 heatwaves, maximum temperatures of
above 40°C were experienced over several days indicating risks to human health
according to heat-health thresholds investigations in Adelaide. 13-14
It is essential to
continue evaluating future extreme heatwaves considering that the 2014 heatwaves
are so far the only ones comparable in severity to the pre-intervention 2009
heatwave. The evaluation of the effectiveness of the HWS and interventions in
Adelaide are therefore at an early stage and this study has explored the effect of the
intervention on health outcomes only. In order to make further progress and achieve
further reductions it will be necessary to assess how the services provided are
received, whether they penetrate to the people most at need, whether their
heightened awareness is transformed into likely beneficial behaviour changes and
whether these improvements can be sustained.
Further studies requiring more detailed information about severity and sub-
categories of the critical health outcomes studied, co-existing diseases and other risk
factors will enhance future evaluations.
Page 18 of 31
For peer review only - http://bmjopen.bmj.com/site/about/guidelines.xhtml
BMJ Open
123456789101112131415161718192021222324252627282930313233343536373839404142434445464748495051525354555657585960
on June 12, 2020 by guest. Protected by copyright.
http://bmjopen.bm
j.com/
BM
J Open: first published as 10.1136/bm
jopen-2016-012125 on 19 July 2016. Dow
nloaded from
For peer review only
19
CONCLUSION
Monitoring population health outcomes during extreme heat events is essential to
inform the ongoing development of public health interventions. This comparison of
extreme heat events in metropolitan Adelaide, five years apart, has provided initial
evidence of improvements in health outcomes, possibly associated with the
introduction of a heat warning system and public health intervention measures.
Notwithstanding some differences between the two heatwaves, they represent the
most significant recent heat events recorded for this population. Our findings showed
there were marked reductions in renal and heat-related morbidity in 2014 compared
to what was expected in relation to hw2009 suggesting that awareness of warnings
and advice during the heatwave may be a contributing factor. While direct heat-
related illness dropped significantly, excess cases were still observed during the
hw2014. Knowing that long term prognosis can be poor following heat stress and
heat stroke, particularly for older people, more emphasis should be placed on better
communication with vulnerable groups to reduce heat exposure. While mortality is
relatively low during heatwaves in Adelaide compared to other larger cities worldwide
and in Australia, better outcomes could still be achieved. Targeted preventive
measures may also have benefits to the wider population considering that everybody
is potentially at risk. Evaluation of interventions is an iterative process and should be
used continuously alongside fine tuning of the intervention measures using
evidence-based research.
Page 19 of 31
For peer review only - http://bmjopen.bmj.com/site/about/guidelines.xhtml
BMJ Open
123456789101112131415161718192021222324252627282930313233343536373839404142434445464748495051525354555657585960
on June 12, 2020 by guest. Protected by copyright.
http://bmjopen.bm
j.com/
BM
J Open: first published as 10.1136/bm
jopen-2016-012125 on 19 July 2016. Dow
nloaded from

For peer review only
20
Acknowledgement
The authors thank Dr David Simon, Director Scientific Services in SA Health for
supporting this study.
Competing Interests:
None declared
Funding:
No funding was received for this study
Data sharing statement:
The routine data analysed for this study are held with the Department for Health and
Ageing, Adelaide, South Australia.
No additional data is available.
Ethical approval:
No ethical approval was required. The study is based on yearly routine heatwave impact assessment using de-identified and aggregated health data.
Page 20 of 31
For peer review only - http://bmjopen.bmj.com/site/about/guidelines.xhtml
BMJ Open
123456789101112131415161718192021222324252627282930313233343536373839404142434445464748495051525354555657585960
on June 12, 2020 by guest. Protected by copyright.
http://bmjopen.bm
j.com/
BM
J Open: first published as 10.1136/bm
jopen-2016-012125 on 19 July 2016. Dow
nloaded from

For peer review only
21
Reference List
1 Nitschke M, Tucker G, Bi P. Morbidity and mortality during heatwaves in metropolitan
Adelaide. MJA 2007;187(11-12):662-5.
2 Nitschke M, Tucker G, Hansen A et al. Impact of two recent extreme heat episodes on
morbidity and mortality in Adelaide, South Australia: a case-series analysis. Environ Health
2011;10(42).
3 Palecki MA, Changnon SA, Kunkel KE. The nature and impacts of the July 1999 heat wave in
the midwestern United States: learning from the lessons of 1995. Bull Am Meteorol Soc
2001; 82:1353-67.
4 White-Newsome JL, Sanchez BN, Parker EA et al. Assessing heat-adaptive behaviors among
older, urban-dwelling adults. Maturitas 2011. (doi: 10.1016/j.maturitas.2011.06.015. Epub
2011 Jul 23).
5 Kalkstein LS, Sheridan SC, Kalkstein AJ. Heat/Health Warning Systems: Development,
Implementation, and Intervention Activities. In: Ebi KL, editor. Biometeorology for
Adaptation to Climate Variability and Change. Springer Science + Business Media; 2009.33-
48.
6 Lowe D, Ebi KL, Forsberg B. Heatwave early warning systems and adaptation advice to
reduce human health consequences of heatwaves. Int J Environ Res Public Health 2011;
8:4623-48.
7 WMO (World Meteorological Organization), 2015: Heatwaves and health: guidance on
warning-system development. WMO-No. 1142, Geneva.
http://www.who.int/globalchange/publications/WMO_WHO_Heat_Health_Guidance_2015.
pdf (accessed: 26 February 2016).
8 Akompab D, Bi P, Williams S et al. Engaging stakeholders in an adaptation process:
governance and institutional arrangements in heat-health policy development in Adelaide,
Australia. Mitig & Adapt Strateg Glob Change 2012;18(7):1001.
9 Toloo G, Fitzgerald G, Aitken P et al. Are heat warning systems effective? Environ Health
2013;12(1):27.
10 Boeckmann M, Rohn I. Is planned adaptation to heat reducing heat-related mortality and
illness? A systematic review. BMC Public Health 2014;14(1):1112.
11 Fouillet A, Rey G, Wagner V, et al. Has the impact of heat waves on mortality changed in
France since the European heat wave of summer 2003? A study of the 2006 heat wave. Int J
Epidemiol 2008;37:309-17.
Page 21 of 31
For peer review only - http://bmjopen.bmj.com/site/about/guidelines.xhtml
BMJ Open
123456789101112131415161718192021222324252627282930313233343536373839404142434445464748495051525354555657585960
on June 12, 2020 by guest. Protected by copyright.
http://bmjopen.bm
j.com/
BM
J Open: first published as 10.1136/bm
jopen-2016-012125 on 19 July 2016. Dow
nloaded from
For peer review only
22
12 South Australian State Emergency Service. Extreme Heat Plan.
http://www.ses.sa.gov.au/site/community_safety/heatsafe/extreme_heat_plan.jsp
(accessed 26 February 2016).
13 Williams S, Nitschke M, Sullivan T et al. Heat and health in Adelaide, South Australia:
Assessment of heat thresholds and temperature relationships. Sci Total Environ2012;
414:128-33.
14 Williams S, Nitschke M, Tucker G et al. Extreme Heat Arrangements in South Australia: an
assessment of trigger temperatures. Health Promot J Austr 2011:S21-7.
15 Red Cross. Telecross REDi Service. http://www.redcross.org.au/telecross-redi.aspx (accessed
26 February 2016).
16 Hansen A, Bi P, Nitschke M et al. Perceptions of heat-susceptibility in older persons: Barriers
to Adaptation. Int J Environ Res Public Health 2013;8:4714-28.
17 Nitschke M, Hansen AL, Bi P et al. Risk factors, health effects and behaviour in older people
during extreme heat: a survey in South Australia. Int J Environ Res Public Health 2013;10:
6721-33.
18 Zhang Y, Nitschke M, Bi P. Risk factors for direct heat-related hospitalization during the 2009
Adelaide heatwave: A case crossover study. Sci Total Environ 2013;442:1-5.
19 Whitaker HJ, Hocine MN, Farrington CP. The methodology of self-controlled case series
studies. Stat Methods Med Res 2009;18(1):7-26.
20 Whitaker HJ, Farrington CP, Spiessens B et al. Tutorial in biostatistics: the self-controlled case
series method. Stat Med 2006;25(10):1768-97.
21 StataCorp. 2013. Stata Statistical Software: Release 13.1. College Station, TX: StataCorp LP.
22 Hansen, MH, Hurwitz, WN, Madow, WG. Sample Survey Methods and Theory, Volumes I and
II, New York: John Wiley & Sons 1953.
23 Bassil KL, Cole DC. Effectiveness of public health interventions in reducing morbidity and
mortality during heat episodes: a structered review. Int J Environ Res Public Health
2010;7:991-01.
24 Semenza JC, McCullough JE, Flanders WD et al. Excess hospital admissions during the July
1995 heat wave in Chicago. Am J Prev Med 1999;16:269-277.
25 Hansen AL, Bi P, Ryan P et al. The effect of heat waves on hospital admissions for renal
disease in a temperate city of Australia. Int J Epidemiol 2008;37(6):1359-65.
26 Green R, Basu R, Malig B et al. The effect of temperature on hospital admissions in nine
California counties. Int J Public Health 2010;55(2):113-21.
27 Fletcher BA, Lin S, Fitzgerald EF, Hwang SA. Association of summer temperatures with
hospital admissions for renal diseases in New York State: a case-crossover study. Am J
Epidemiol 2012;175(9):907-16.
Page 22 of 31
For peer review only - http://bmjopen.bmj.com/site/about/guidelines.xhtml
BMJ Open
123456789101112131415161718192021222324252627282930313233343536373839404142434445464748495051525354555657585960
on June 12, 2020 by guest. Protected by copyright.
http://bmjopen.bm
j.com/
BM
J Open: first published as 10.1136/bm
jopen-2016-012125 on 19 July 2016. Dow
nloaded from

For peer review only
23
28 SA Health. Extreme Heat.
http://www.sahealth.sa.gov.au/wps/wcm/connect/public+content/sa+health+internet/prot
ecting+public+health/emergency+management/extreme+heat (accessed 26 February 2016).
29 Department of Human Services. January 2009 heatwave in Victoria: an assessment of health
impacts. 2009. Melbourne, Victoria,
https://www2.health.vic.gov.au/getfile/?sc_itemid=%7B78C32CE8-A619-47A6-8ED1-
1C1D34566326%7D&title=January%202009%20Heatwave%20in%20Victoria%3A%20an%20A
ssessment%20of%20Health%20Impacts. (accessed 26 February 2016).
30 Semenza JC, Rubin CH, Falter KH et al. Heat-related death during the July 1995 heat wave in
Chicago. N Engl J Med 1996;335(2):84-90.
31 Fouillet A, Rey G, Laurent F et al. Excess mortality related to the August 2003 heat wave in
France. Int Arch Occup Environ Health 2006;80:16-24.
32 Pascal M, Le Tertre A, Saoudi A. Quantification of the heat wave effect on mortality in nine
French cities during summer. PLoS Curr 2012; RRN1307.
33 Hansen A, Bi P, Pisaniello D et al. Heat-health behaviours of older people in two Australian
states. Australas J Ageing 2014;34(1):E19-25.
34 Zhang Y, Nitschke M, Krackowizer A et al. In: Abstracts of the 2011 Conference of the
International Society of Environmental Epidemiology (ISEE). Abstract [O-o53]. Research
Triangle Park, NC: Environ Health Perspect; http://dx.doi.org/10.1289/ehp.isee2014.
Page 23 of 31
For peer review only - http://bmjopen.bmj.com/site/about/guidelines.xhtml
BMJ Open
123456789101112131415161718192021222324252627282930313233343536373839404142434445464748495051525354555657585960
on June 12, 2020 by guest. Protected by copyright.
http://bmjopen.bm
j.com/
BM
J Open: first published as 10.1136/bm
jopen-2016-012125 on 19 July 2016. Dow
nloaded from
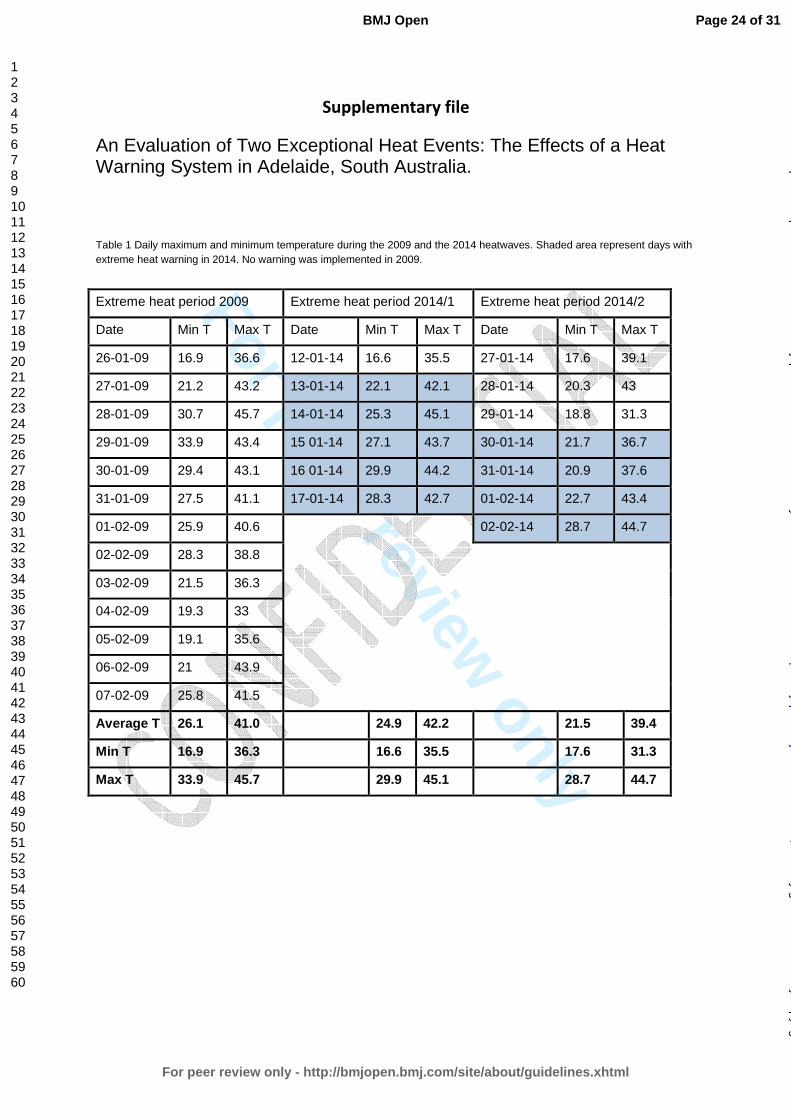
For peer review only
Supplementary file
An Evaluation of Two Exceptional Heat Events: The Effects of a Heat Warning System in Adelaide, South Australia.
Table 1 Daily maximum and minimum temperature during the 2009 and the 2014 heatwaves. Shaded area represent days with extreme heat warning in 2014. No warning was implemented in 2009.
Extreme heat period 2009 Extreme heat period 2014/1 Extreme heat period 2014/2
Date Min T Max T Date Min T Max T Date Min T Max T
26-01-09 16.9 36.6 12-01-14 16.6 35.5 27-01-14 17.6 39.1
27-01-09 21.2 43.2 13-01-14 22.1 42.1 28-01-14 20.3 43
28-01-09 30.7 45.7 14-01-14 25.3 45.1 29-01-14 18.8 31.3
29-01-09 33.9 43.4 15 01-14 27.1 43.7 30-01-14 21.7 36.7
30-01-09 29.4 43.1 16 01-14 29.9 44.2 31-01-14 20.9 37.6
31-01-09 27.5 41.1 17-01-14 28.3 42.7 01-02-14 22.7 43.4
01-02-09 25.9 40.6 02-02-14 28.7 44.7
02-02-09 28.3 38.8
03-02-09 21.5 36.3
04-02-09 19.3 33
05-02-09 19.1 35.6
06-02-09 21 43.9
07-02-09 25.8 41.5
Average T 26.1 41.0 24.9 42.2 21.5 39.4
Min T 16.9 36.3 16.6 35.5 17.6 31.3
Max T 33.9 45.7 29.9 45.1 28.7 44.7
Page 24 of 31
For peer review only - http://bmjopen.bmj.com/site/about/guidelines.xhtml
BMJ Open
123456789101112131415161718192021222324252627282930313233343536373839404142434445464748495051525354555657585960
on June 12, 2020 by guest. Protected by copyright.
http://bmjopen.bm
j.com/
BM
J Open: first published as 10.1136/bm
jopen-2016-012125 on 19 July 2016. Dow
nloaded from

For peer review only
Formulae for calculating the standard errors and the 95% confidence intervals for the
estimates of the excess/reductions during the respective heatwaves and the differences in
cases between the 2009 and 2014 heat events.
Observed cases = N
Expected cases = (N/IRR)
Excess cases = N - (N/IRR)
Calculating the standard error of the excess relies on the following equations;
Var(aX) = a^2*Var(X) Var(X+Y) = Var(X) + Var(Y) + 2*Cov(X,Y) note that Cov(X,Y)=0 for independent events.
Var(X/Y) = X^2 / Y^2 * (Var(X) / X^2 + Var(Y) / Y^2 - 2 Cov(X,Y) / XY) note that Cov(X,Y)=0 for independent events.
Therefore Variance for difference in excess from 2009 to 2014
Step1: Variance of IRR: ((IRR upper CI-IRR lower CI)/(2*1.96))2
Step 2: var(excess)=var(N) + var(N/IRR)= N2 *var((IRR)/IRR4
Where N=observed cases, and the var(N)=0 since N is a constant
= (N2*((IRR upper CI-IRR lower CI)/(2*1.96))
2/IRR
4)
Step 3: 95%CI for excess: excess-1.96*SE ; excess+1.96*SE
Step 4: p-value for excess (z-test): 2*(1-NORMSDIST(ABS(excess/SE(excess))))
Step 5: SE of difference between excess 2009 and 2014: square root(var(excess2009) +
var(excess2014))
because the excess for 2009 is independent of the excess for 2014.
To calculate 95% CI for the difference between excess 2009 and 2014
Step 6 : (excess2014-excess2009)-1.96*SE(from step 5), (excess2014-excess2009)+1.96*SE(from
step 5)
Step 7: p-value for difference in excess from 2009 to 2014 (z-test): 2*(1-NORMSDIST(ABS((difference
in excess)/SE(from step 5))))
Page 25 of 31
For peer review only - http://bmjopen.bmj.com/site/about/guidelines.xhtml
BMJ Open
123456789101112131415161718192021222324252627282930313233343536373839404142434445464748495051525354555657585960
on June 12, 2020 by guest. Protected by copyright.
http://bmjopen.bm
j.com/
BM
J Open: first published as 10.1136/bm
jopen-2016-012125 on 19 July 2016. Dow
nloaded from

For peer review only
Table 2 Hospital IRRs and 95% confidence intervals (95%CI): IRRs are based on the daily incidence of hospital admissions during 2009 and 2014 heatwaves compared to the incidence during non-heatwave periods in metropolitan Adelaide in summer (October-March). The IRRs of 2014 and 2009 were compared to estimate the statistical
significance of differences between the two heatwave episodes. Empty cells indicate insufficient data to produce reliable estimates. **P<0.001; * p<0.05; #p<0.1
Hospital Admissions
All ages
IRR (95% CI)
0-4 IRR
(95% CI)
5-14 IRR
(95% CI)
15-64 IRR
(95% CI)
65-74 IRR
(95% CI)
75+ IRR
(95% CI)
Observed cases
Excess/ Reduction of cases (95% CI)
Difference between 2009
and 2014 (95% CI)
total 2009 1.08
(0.85-1.34) 1.05
(0.87-1.26) 0.79
(0.59-1.07) 1.08
(0.83-1.39) 1.08
(0.83-1.40) 1.14
(0.91-1.42) 17198 1300.1
(-2572.8, 5173.0)
-1317.9 (-7088.3, 4452.5)
total 2014 1.00
(0.78-1.28) 0.92
(0.76-1.11) 0.99
(0.76-1.29) 1.02
(0.78-1.33) 1.01
(0.77-1.32) 0.97
(0.76-1.23) 16900 -17.8
(-4295.4, 4259.9)
2014-2009 0.92
(0.65-1.31) 0.88
(0.67-1.14) 1.24
(0.84-1.86) 0.95
(0.65-1.37) 0.94
(0.65-1.36) 0.85
(0.62-1.18)
Renal 2009 1.24
(0.98-1.56) 1.16
(0.67-2.00) 0.74
(9.26-2.07) 1.09
(0.89-1.49) #1.38
(0.94-2.01) **1.47
(1.19-1.82) 413 78.6
(-0.4, 157.7) -119.1# (-248.9, 10.7) Renal 2014
0.89 (0.68-1.17)
1.17 (0.71-1.91)
0.41 (0.90-1.84)
0.80 (0.56-1.14)
0.98 (0.64-1.50)
0.98 (0.77-1.23)
338 -40.7
(-143.5, 62.5) Renal 2014-
2009 #0.72
(0.51-1.03) 1.01
(0.48-2.10) 0.55
(0.90-3.40) 0.74
(0.46-1.18) 0.71
(0.40-1.26) *0.66
(0.48-0.91)
Heat-related total 2009
**13.64 (9.13-20.36)
*6.50 (1.19-35.49)
**11.52 (7.31-18.15)
*7.06 (3.06-16.30)
**19.21 (12.74-28.96) 232
215.0 (208.0,222.0)
-141.1**
Page 26 of 31
For peer review only - http://bmjopen.bmj.com/site/about/guidelines.xhtml
BMJ Open
123456789101112131415161718192021222324252627282930313233343536373839404142434445464748495051525354555657585960
on June 12, 2020 by guest. Protected by copyright. http://bmjopen.bmj.com/ BMJ Open: first published as 10.1136/bmjopen-2016-012125 on 19 July 2016. Downloaded from
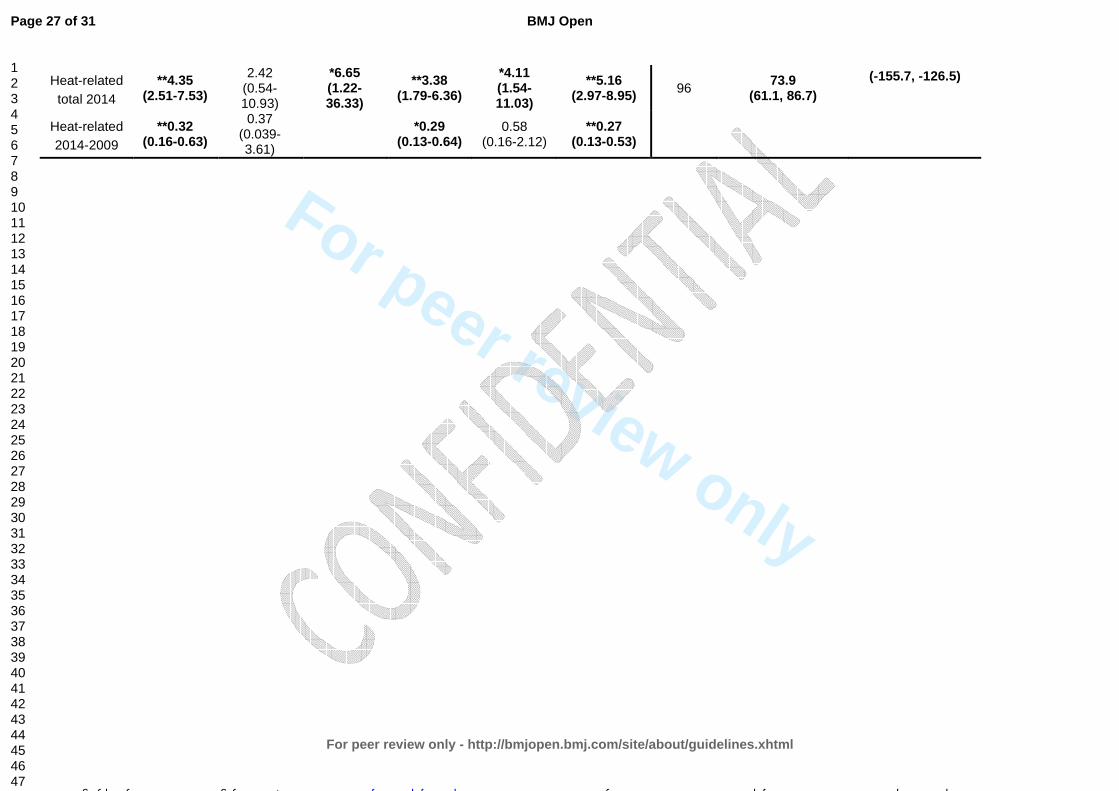
For peer review only
Heat-related total 2014
**4.35 (2.51-7.53)
2.42 (0.54-10.93)
*6.65 (1.22-36.33)
**3.38 (1.79-6.36)
*4.11 (1.54-11.03)
**5.16 (2.97-8.95) 96
73.9 (61.1, 86.7)
(-155.7, -126.5)
Heat-related 2014-2009
**0.32 (0.16-0.63)
0.37 (0.039-3.61)
*0.29
(0.13-0.64) 0.58
(0.16-2.12) **0.27
(0.13-0.53)
Page 27 of 31
For peer review only - http://bmjopen.bmj.com/site/about/guidelines.xhtml
BMJ Open
123456789101112131415161718192021222324252627282930313233343536373839404142434445464748495051525354555657585960
on June 12, 2020 by guest. Protected by copyright. http://bmjopen.bmj.com/ BMJ Open: first published as 10.1136/bmjopen-2016-012125 on 19 July 2016. Downloaded from

For peer review only
Page 28 of 31
For peer review only - http://bmjopen.bmj.com/site/about/guidelines.xhtml
BMJ Open
123456789101112131415161718192021222324252627282930313233343536373839404142434445464748495051525354555657585960
on June 12, 2020 by guest. Protected by copyright.
http://bmjopen.bm
j.com/
BM
J Open: first published as 10.1136/bm
jopen-2016-012125 on 19 July 2016. Dow
nloaded from

For peer review only
1
STROBE Statement—checklist of items that should be included in reports of observational studies
Item
No Recommendation
Title and abstract
Pg 1
Pg 2
1 (a) Indicate the study’s design with a commonly used term in the title or the
abstract
(b) Provide in the abstract an informative and balanced summary of what was
done and what was found
Introduction
Background/rationale
Pg 4
2 Explain the scientific background and rationale for the investigation being
reported
Objectives
Pg 5
3 State specific objectives, including any prespecified hypotheses
Methods
Study design
Pg 5
4 Present key elements of study design early in the paper
Setting
Pg 4 and 5
5 Describe the setting, locations, and relevant dates, including periods of
recruitment, exposure, follow-up, and data collection
Participants
Pg 5
6 (a) Cohort study—Give the eligibility criteria, and the sources and methods of
selection of participants. Describe methods of follow-up
Case-control study—Give the eligibility criteria, and the sources and methods
of case ascertainment and control selection. Give the rationale for the choice of
cases and controls
Cross-sectional study—Give the eligibility criteria, and the sources and
methods of selection of participants
The study “An evaluation of two exceptional heat events: the effects of a
heat warning system in Adelaide, South Australia” is an ecological design
(b) Cohort study—For matched studies, give matching criteria and number of
exposed and unexposed
Case-control study—For matched studies, give matching criteria and the
number of controls per case
Variables
Pg 5, 7
7 Clearly define all outcomes, exposures, predictors, potential confounders, and
effect modifiers. Give diagnostic criteria, if applicable
Data sources/ measurement
Pg 5, 7
8* For each variable of interest, give sources of data and details of methods of
assessment (measurement). Describe comparability of assessment methods if
there is more than one group
Bias
discussion
9 Describe any efforts to address potential sources of bias
Study size
Population –based study
10 Explain how the study size was arrived at
Quantitative variables
Pg 5, 7
11 Explain how quantitative variables were handled in the analyses. If applicable,
describe which groupings were chosen and why
Statistical methods
Pg 7 and appendix for
detailed formulae
12 (a) Describe all statistical methods, including those used to control for
confounding
(b) Describe any methods used to examine subgroups and interactions
(c) Explain how missing data were addressed
(d) Cohort study—If applicable, explain how loss to follow-up was addressed
Page 29 of 31
For peer review only - http://bmjopen.bmj.com/site/about/guidelines.xhtml
BMJ Open
123456789101112131415161718192021222324252627282930313233343536373839404142434445464748495051525354555657585960
on June 12, 2020 by guest. Protected by copyright.
http://bmjopen.bm
j.com/
BM
J Open: first published as 10.1136/bm
jopen-2016-012125 on 19 July 2016. Dow
nloaded from
For peer review only
2
Case-control study—If applicable, explain how matching of cases and controls
was addressed
Cross-sectional study—If applicable, describe analytical methods taking
account of sampling strategy
(e) Describe any sensitivity analyses
Continued on next page
Page 30 of 31
For peer review only - http://bmjopen.bmj.com/site/about/guidelines.xhtml
BMJ Open
123456789101112131415161718192021222324252627282930313233343536373839404142434445464748495051525354555657585960
on June 12, 2020 by guest. Protected by copyright.
http://bmjopen.bm
j.com/
BM
J Open: first published as 10.1136/bm
jopen-2016-012125 on 19 July 2016. Dow
nloaded from

For peer review only
3
Results
Participants
Population-based
study
13* (a) Report numbers of individuals at each stage of study—eg numbers potentially eligible,
examined for eligibility, confirmed eligible, included in the study, completing follow-up,
and analysed
(b) Give reasons for non-participation at each stage
(c) Consider use of a flow diagram
Descriptive data
Ecological design
14* (a) Give characteristics of study participants (eg demographic, clinical, social) and
information on exposures and potential confounders
(b) Indicate number of participants with missing data for each variable of interest
(c) Cohort study—Summarise follow-up time (eg, average and total amount)
Outcome data
Pg 9
15* Cohort study—Report numbers of outcome events or summary measures over time
Case-control study—Report numbers in each exposure category, or summary measures of
exposure
Cross-sectional study—Report numbers of outcome events or summary measures
Main results
Pg 9-15
16 (a) Give unadjusted estimates and, if applicable, confounder-adjusted estimates and their
precision (eg, 95% confidence interval). Make clear which confounders were adjusted for
and why they were included
(b) Report category boundaries when continuous variables were categorized
(c) If relevant, consider translating estimates of relative risk into absolute risk for a
meaningful time period
Other analyses 17 Report other analyses done—eg analyses of subgroups and interactions, and sensitivity
analyses
Discussion
Key results
Pg 16
18 Summarise key results with reference to study objectives
Limitations
Pg 16, 18
19 Discuss limitations of the study, taking into account sources of potential bias or
imprecision. Discuss both direction and magnitude of any potential bias
Interpretation
Pg 18
20 Give a cautious overall interpretation of results considering objectives, limitations,
multiplicity of analyses, results from similar studies, and other relevant evidence
Generalisability
Pg 18
21 Discuss the generalisability (external validity) of the study results
Other information
Funding
N/A
22 Give the source of funding and the role of the funders for the present study and, if
applicable, for the original study on which the present article is based
*Give information separately for cases and controls in case-control studies and, if applicable, for exposed and
unexposed groups in cohort and cross-sectional studies.
Note: An Explanation and Elaboration article discusses each checklist item and gives methodological background and
published examples of transparent reporting. The STROBE checklist is best used in conjunction with this article (freely
available on the Web sites of PLoS Medicine at http://www.plosmedicine.org/, Annals of Internal Medicine at
http://www.annals.org/, and Epidemiology at http://www.epidem.com/). Information on the STROBE Initiative is
available at www.strobe-statement.org.
Page 31 of 31
For peer review only - http://bmjopen.bmj.com/site/about/guidelines.xhtml
BMJ Open
123456789101112131415161718192021222324252627282930313233343536373839404142434445464748495051525354555657585960
on June 12, 2020 by guest. Protected by copyright.
http://bmjopen.bm
j.com/
BM
J Open: first published as 10.1136/bm
jopen-2016-012125 on 19 July 2016. Dow
nloaded from
Related Documents