Velez, Homola, Chan. An Evaluation of the Maximum Uphill and Downhill Grades for Low Clearance Vehicles 1 2 3 4 Andres Velez 5 Transoft Solutions Inc. 6 Suite 250-13575 Commerce Parkway, Richmond, BC, Canada, V6V 2L1 7 Tel: 604-244-8387 Fax: 604-244-1770; Email: [email protected] 8 9 David Homola 10 Transoft Solutions Inc. 11 Peterhegyi lejto 5 Budapest, Hungary, 1112 12 Tel: +36-20-358-2702; Email: [email protected] 13 14 Steven Chan, P.Eng. 15 Transoft Solutions Inc. 16 Suite 250-13575 Commerce Parkway, Richmond, BC, Canada, V6V 2L1 17 Tel: 604-244-8387 Fax: 604-244-1770; Email: [email protected] 18 19 20 Word Count: 4,434 text + 2 Tables x 250 and 11 Figures x 250= 7,684 words 21 22 23 Submitted to Transportation Research Board 24 December 2014 25 26 27 28 29 30 31 32 33 34 35 36 37 38 39 40 41 42 43 44 45 46

Welcome message from author
This document is posted to help you gain knowledge. Please leave a comment to let me know what you think about it! Share it to your friends and learn new things together.
Transcript
Velez, Homola, Chan.
An Evaluation of the Maximum Uphill and Downhill Grades for Low Clearance Vehicles 1 2 3 4
Andres Velez 5 Transoft Solutions Inc. 6 Suite 250-13575 Commerce Parkway, Richmond, BC, Canada, V6V 2L1 7 Tel: 604-244-8387 Fax: 604-244-1770; Email: [email protected] 8
9
David Homola 10 Transoft Solutions Inc. 11 Peterhegyi lejto 5 Budapest, Hungary, 1112 12
Tel: +36-20-358-2702; Email: [email protected] 13 14
Steven Chan, P.Eng. 15 Transoft Solutions Inc. 16 Suite 250-13575 Commerce Parkway, Richmond, BC, Canada, V6V 2L1 17
Tel: 604-244-8387 Fax: 604-244-1770; Email: [email protected] 18 19 20
Word Count: 4,434 text + 2 Tables x 250 and 11 Figures x 250= 7,684 words 21 22
23 Submitted to Transportation Research Board 24
December 2014 25 26
27 28 29
30 31
32 33
34 35 36
37 38 39 40
41 42 43 44 45 46
Velez, Homola, Chan.
ABSTRACT 1
For road infrastructure design and planning, design vehicles are referenced from design 2
guidelines for performing the turning template check. This evaluation allows designers to 3
develop the geometric design of intersections, roundabouts, and interchanges that accommodate 4
the design vehicle swept paths. Typically, design guidelines provide turning templates for the 5
plan view and only general guidelines like maximum grades and vertical curves for the profile 6
design. While the turning template is useful for capturing the basic turning characteristics of 7
design-vehicles from the horizontal perspective, the turning characteristics from the vertical 8
perspective could be equally important for evaluating ground clearances at driveways, railroad 9
crossings, and roadways. Ground clearance conflicts between the vehicle and terrain can lead to 10
traffic congestions, pavement and vehicle damages. For driveway design, past research has been 11
done to provide recommendations on maximum uphill and downhill grades for passenger car 12
accessibility; however, more research is needed for vehicles with long wheelbases, long front 13
and rear overhangs or low underside clearances. Moreover, past research and analysis on the 14
vertical geometry design of the driveway, where the vertical profile of the driveway is evaluated 15
against the vehicle’s profile, is normally performed in two-dimension (2D). This study presents 16
the results of the analysis of two configurations of driveways in 2D and 3D for low-clearance 17
vehicles (LCVs) that may require access to residential and low-volume commercial driveways. 18
In addition, the findings and differences between the two types of evaluations are highlighted. 19
20
21
22
23
24
25
26
27
28
29
30
31
32
33
34
35
36
37
38
39
Velez, Homola, Chan.
INTRODUCTION 1
Driveways, as junction points between public and private roads, can potentially impact capacity, 2
safety and most of the users of public roads (1). Up to now, passenger cars have been the most 3
commonly used design vehicle for driveways and design guidelines have been focused on these 4
vehicles. However, these guidelines may not address the issues for other design vehicles that 5
may also access the driveway including those with low-clearances and large overhangs. 6
Service vehicles, specifically fire-trucks and garbage-trucks, may encounter difficulties trying to 7
access a driveway due to their physical characteristics. Fire-trucks, in particular, may need to use 8
driveways for emergency purposes. They should not be hindered by the driveway design in terms 9
of response time or accessibility during an emergency operation. In some cases, the vertical 10
design for residential and commercial driveways could present a significant obstacle causing 11
delays or damages to these vehicles. 12
This study evaluates two different sets of driveways. The maximum recommended grades in two 13
dimension (2D) and three dimension (3D) is determined for a set of low-clearance vehicles 14
(LCVs) with the help of a turn simulation tool. Possible conflicts between low-clearance vehicles 15
(LCVs) and the vertical geometry is evaluated in 2D initially using the traditional method, then 16
the driveway geometry is created in a 3D environment and 3D turn simulation is used to check 17
for ground clearance issues. By creating the design surface of the driveway and evaluating the 18
turning simulation in 3D, the results would be more realistic than a 2D analysis. 19
LITERATURE REVIEW 20
Several publications related to LCVs and driveways’ design were reviewed, including 21
researches, policies, and design guidelines. Standards for street design for trucks (2), service 22
vehicles (3) and fire vehicles (4) describing accessibility conditions and geometry 23
recommendations were reviewed in order to formulate a basis for the scenarios. 24
The study performed by McConnell (5) analyzed different vehicle trends and their evolution over 25
a period of time, and highlighted their critical dimensions, such as key ground clearances and 26
approach/departure angles in order to identify possible conflicts for vertical profiles. He 27
identified vertical curves’ radii that would pose problems for long or short vehicles based on 28
their length. The study also provided recommendations for the slope changes, indicating that 29
slopes shouldn’t exceed 6.5% between two 5 feet chords. 30
Using a cardboard-car model, Bauer (6) conducted a separate study and encountered issues 31
between residential driveways and the vehicle due to grade changes. Bauer made 32
recommendations for profiles indicating rates of ascend and descend. Also, his study 33
recommended a safety clearance buffer of 2 inches (vertically) in order to account for the 34
dynamic effects (e.g. downward thrust) from passenger vehicles braking and/or traversing the 35
changing road profile. With larger and heavier vehicles, the dynamic effects could be greater. No 36
research was identified for the appropriate safety clearance buffer. 37
Velez, Homola, Chan.
Highway and railway associations have conducted comprehensive studies and produced 1
recommendations for rail crossings (7) to prevent (LCVs) encountering ‘hang-ups’ on railway 2
tracks. The research performed by Eck and Kang (8) contributed to these guidelines since the 3
evaluation of (LCVs) is a recommended practice for rail crossing designs. 4
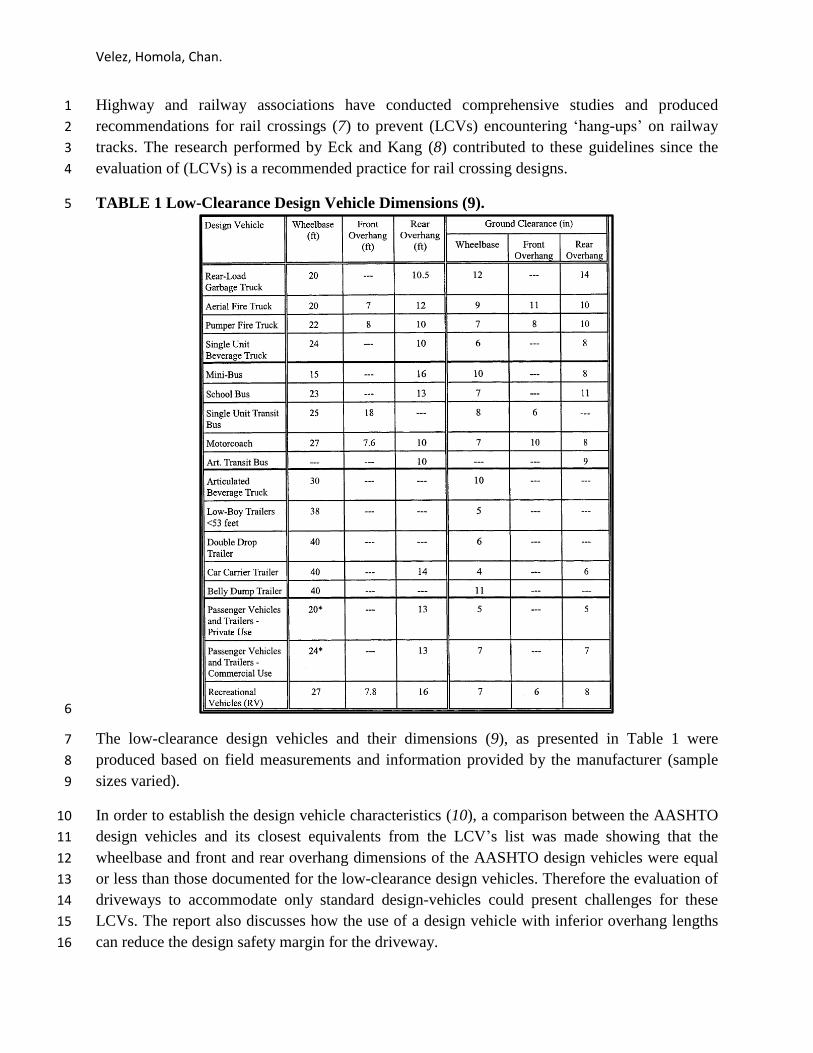
TABLE 1 Low-Clearance Design Vehicle Dimensions (9). 5
6
The low-clearance design vehicles and their dimensions (9), as presented in Table 1 were 7
produced based on field measurements and information provided by the manufacturer (sample 8
sizes varied). 9
In order to establish the design vehicle characteristics (10), a comparison between the AASHTO 10
design vehicles and its closest equivalents from the LCV’s list was made showing that the 11
wheelbase and front and rear overhang dimensions of the AASHTO design vehicles were equal 12
or less than those documented for the low-clearance design vehicles. Therefore the evaluation of 13
driveways to accommodate only standard design-vehicles could present challenges for these 14
LCVs. The report also discusses how the use of a design vehicle with inferior overhang lengths 15
can reduce the design safety margin for the driveway. 16
Velez, Homola, Chan.
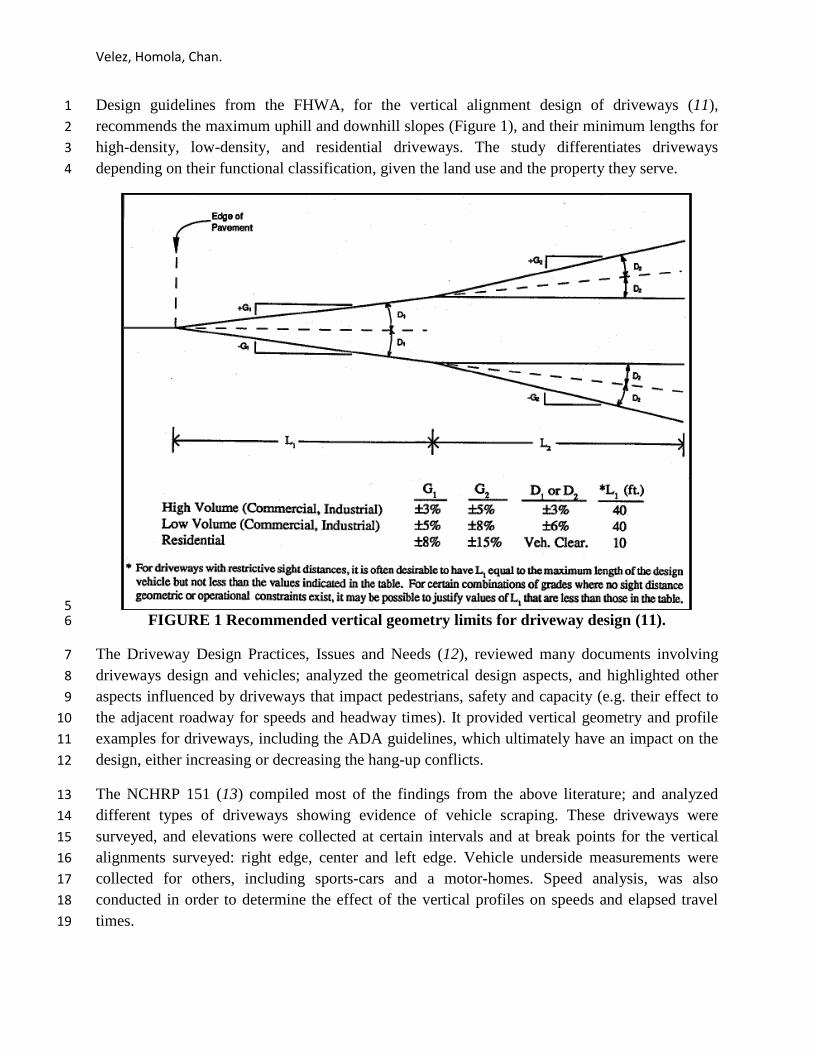
Design guidelines from the FHWA, for the vertical alignment design of driveways (11), 1
recommends the maximum uphill and downhill slopes (Figure 1), and their minimum lengths for 2
high-density, low-density, and residential driveways. The study differentiates driveways 3
depending on their functional classification, given the land use and the property they serve. 4
5 FIGURE 1 Recommended vertical geometry limits for driveway design (11). 6
The Driveway Design Practices, Issues and Needs (12), reviewed many documents involving 7
driveways design and vehicles; analyzed the geometrical design aspects, and highlighted other 8
aspects influenced by driveways that impact pedestrians, safety and capacity (e.g. their effect to 9
the adjacent roadway for speeds and headway times). It provided vertical geometry and profile 10
examples for driveways, including the ADA guidelines, which ultimately have an impact on the 11
design, either increasing or decreasing the hang-up conflicts. 12
The NCHRP 151 (13) compiled most of the findings from the above literature; and analyzed 13
different types of driveways showing evidence of vehicle scraping. These driveways were 14
surveyed, and elevations were collected at certain intervals and at break points for the vertical 15
alignments surveyed: right edge, center and left edge. Vehicle underside measurements were 16
collected for others, including sports-cars and a motor-homes. Speed analysis, was also 17
conducted in order to determine the effect of the vertical profiles on speeds and elapsed travel 18
times. 19
Velez, Homola, Chan.
Based on the findings, the NCHRP study recommended the maximum allowable sag profile 1
breakover to be 9%, even though it indicates that undersides’ dragging is possible at less than 2
that percentage. Additionally, the study acknowledged that in cases where the crest and the sag 3
breakovers were too close, the component causing the drag couldn’t be identified. It is worth 4
mentioning that, it is possible that the dragging was caused by vehicles outside the scope of the 5
Report (13), which is why this study intends to evaluate the recommended vertical geometry for 6
LCVs. 7
Finally the NCHRP report 659 (14) consolidates the most relevant driveway design controls and 8
elements including LCVs as they may be expected to use the driveways. The design vehicle 9
selection is based on turning capabilities to verify the horizontal geometry and ground clearances 10
to evaluate the vertical geometry, however they are analyzed separately. The Report (14) also 11
highlights the fact that the geometry for the vertical profile of the driveway isn’t uniquely 12
controlled by the maximum allowable grade but by the change of grades, as this is more relevant 13
to the crests and sags that cause the undersides of the vehicles to drag. 14
METHODOLOGY 15
Scenarios: 16
Two types of driveways were modeled by varying the profile’s vertical geometry to evaluate 17
LCVs other than passenger cars. For each section of the driveway, the lengths, slopes and 18
breakovers were set based on the maximum allowable values (13) without applying vertical 19
curves. These driveway types correspond to those classified as low-volume commercial or 20
industrial and residential driveways. 21
In the case of the residential driveways, the recommended geometry, as well as a variation of it, 22
were analyzed (Figure 2). The variation (Residential Driveway 2) includes of a sidewalk. The 23
impact of the sidewalk on the accessibility of the LCVs was evaluated. 24
The scenarios were created and evaluated using CAD (21), as well as other design and vehicle 25
simulation analysis software (18, 20). Figure 2 depicts the vertical geometry for the 2D 26
scenarios. This was set as the centerline vertical geometry for the 3D scenarios. 27
Velez, Homola, Chan.
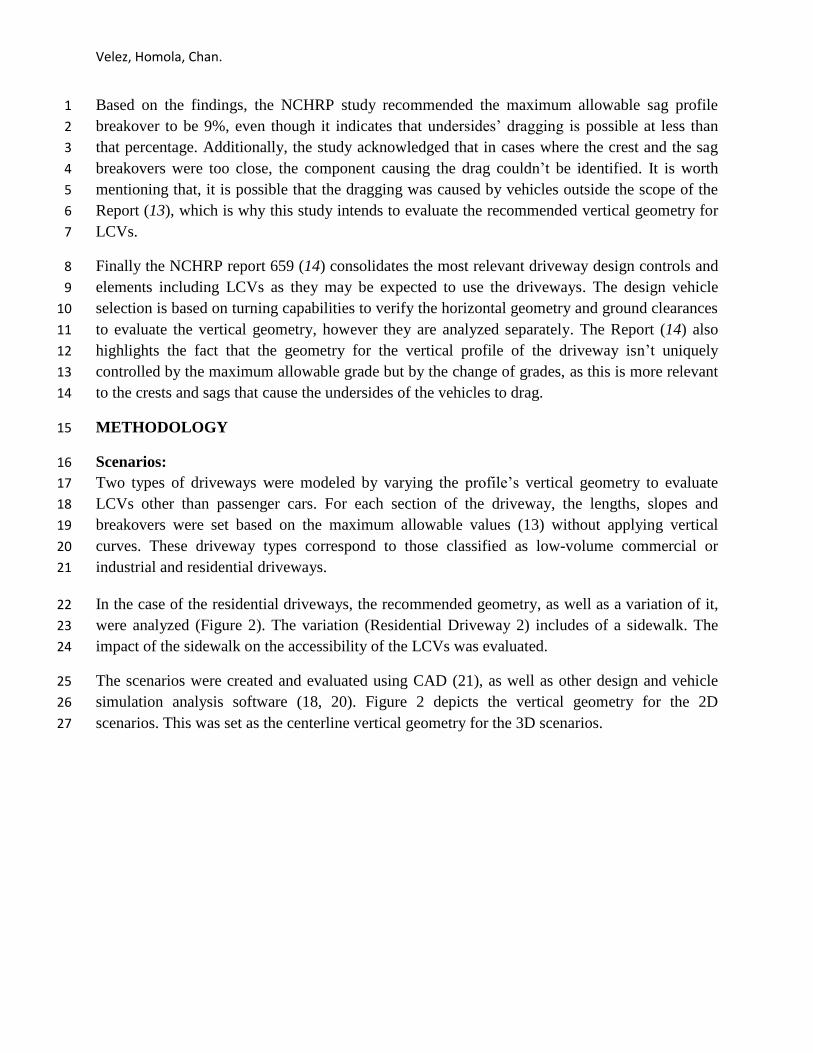
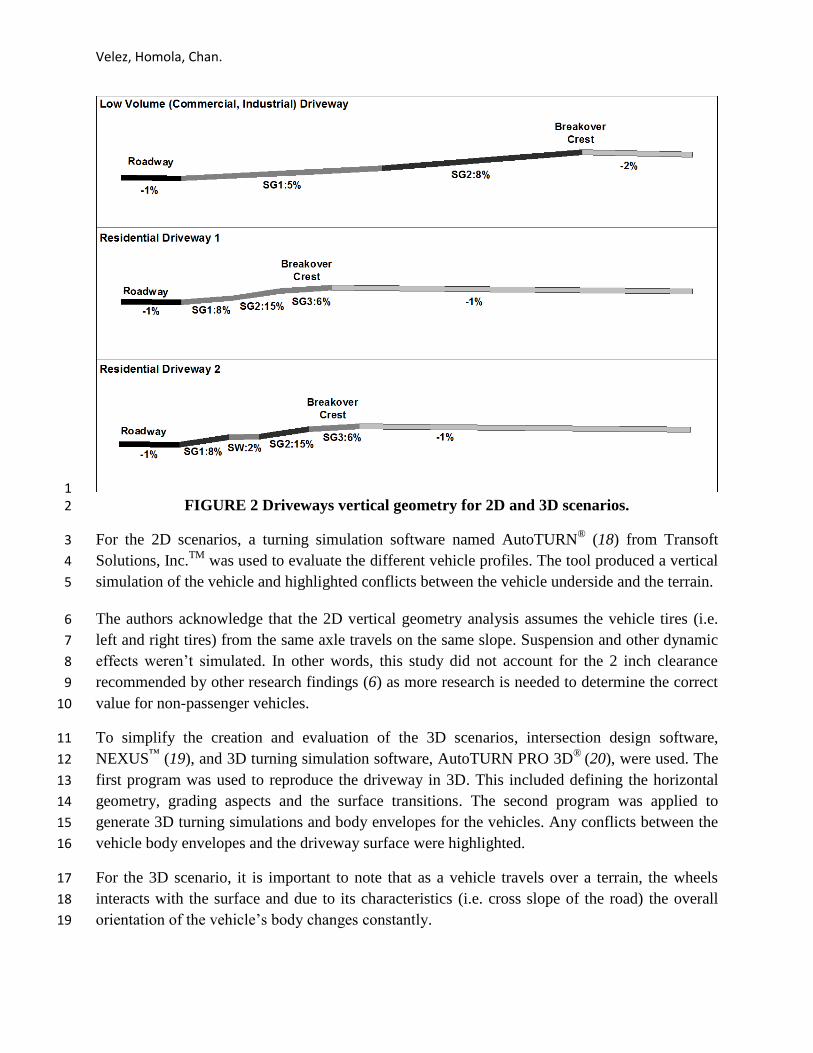
1 FIGURE 2 Driveways vertical geometry for 2D and 3D scenarios. 2
For the 2D scenarios, a turning simulation software named AutoTURN® (18) from Transoft 3
Solutions, Inc.TM
was used to evaluate the different vehicle profiles. The tool produced a vertical 4
simulation of the vehicle and highlighted conflicts between the vehicle underside and the terrain. 5
The authors acknowledge that the 2D vertical geometry analysis assumes the vehicle tires (i.e. 6
left and right tires) from the same axle travels on the same slope. Suspension and other dynamic 7
effects weren’t simulated. In other words, this study did not account for the 2 inch clearance 8
recommended by other research findings (6) as more research is needed to determine the correct 9
value for non-passenger vehicles. 10
To simplify the creation and evaluation of the 3D scenarios, intersection design software, 11
NEXUS™
(19), and 3D turning simulation software, AutoTURN PRO 3D®
(20), were used. The 12
first program was used to reproduce the driveway in 3D. This included defining the horizontal 13
geometry, grading aspects and the surface transitions. The second program was applied to 14
generate 3D turning simulations and body envelopes for the vehicles. Any conflicts between the 15
vehicle body envelopes and the driveway surface were highlighted. 16
For the 3D scenario, it is important to note that as a vehicle travels over a terrain, the wheels 17
interacts with the surface and due to its characteristics (i.e. cross slope of the road) the overall 18
orientation of the vehicle’s body changes constantly. 19
Velez, Homola, Chan.
Low Volume Commercial/Industrial Driveway: 1
For this scenario, the roadway cross-slope was set at -1%. To maintain the maximum 2
recommended grade change, the slope of grade 1 (+G1) was set to 5% with a length of grade 1 L1 3
of 40 feet. The slope of grade 2 (G2) was set at 8% with a length for this grade (L2) of 40 feet. 4
The grade break for this section was +3%. A breakover crest was also introduced. However, 5
since the grade brake exceeds the maximum recommended value of +/-6%, the highlighted 6
conflicts for the vehicles aren’t reported. 7
Finally, further studies are recommended to evaluate the effects of sidewalks for both low and 8
high volume commercial driveways; as these types, given their location and use, need to 9
incorporate them. Additionally, other types of vehicles should be analyzed due to specific 10
components of their bodies, e.g. semi-trailer’s kickstands or fuel tanks that might scrape the 11
surface. 12
The 3D scenario used the vertical geometry from the 2D analysis as reference to create the 13
surface for roadway and driveway. The horizontal geometry followed the ITE (15) 14
recommendations for a two-way commercial or industrial driveway. Using an intersection design 15
program (19), the driveway’s 3D surface was generated. The angle for the driveway’s alignment 16
was set to 90 degrees from the main road, the corner radii were set to 20 feet with a throat width 17
of 30 feet. 18
The horizontal geometry covered the recommendations for both residential and commercial 19
driveways, with enough space to accommodate trucks and two-part vehicles. 20
Residential Driveways: 21
In this case, two scenarios were evaluated, both used the maximum allowable grade slopes and 22
grade breakovers presented in the NCHRP report 151. However, one incorporated a sidewalk to 23
analyze the effects on the LCVs (Figure 2). 24
In the first scenario, the cross-slope of the roadway was set to -1%; the - slope of grade 1 (G1) 25
was set to 8% and its length L1 to 10 feet. The slope of grade 2 (G2) was set to 15% and the 26
length for this grade (L2) was set to 10 feet. In order to produce a breakover crest for driveway’s 27
vertical geometry, a slope of grade (G3) at 6% and 10 feet of length were added to reduce the 28
grade brake angle to an acceptable value. 29
Finally, a crest for the driveway was generated by introducing a -1% slope, complying with the 30
breakover maximum recommendation which highlights the conflicts between vehicles and 31
profile or surface. 32
The second scenario, incorporated a 6 feet wide sidewalk (SW) at a 2% slope between the two 33
grade slopes (G1 and G2). All other slopes of grade, lengths and grade breaks were identical to 34
those defined for the first residential driveway scenario (Figure 2). 35
Velez, Homola, Chan.
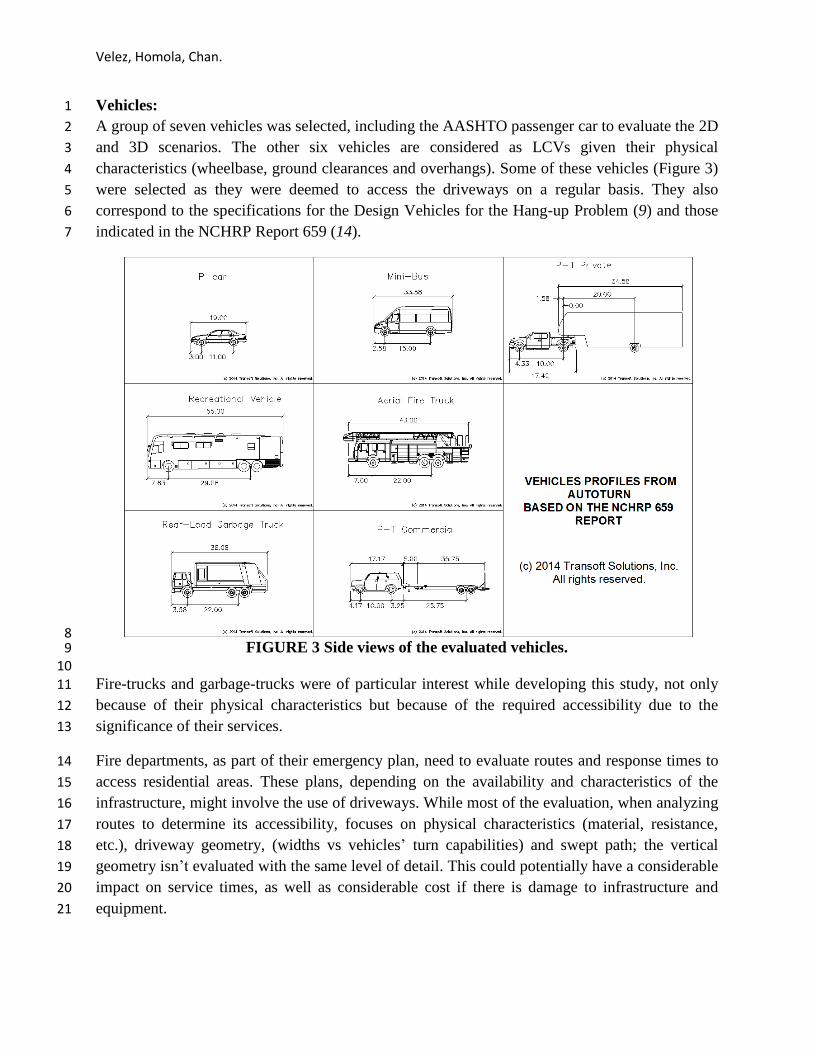
Vehicles: 1
A group of seven vehicles was selected, including the AASHTO passenger car to evaluate the 2D 2
and 3D scenarios. The other six vehicles are considered as LCVs given their physical 3
characteristics (wheelbase, ground clearances and overhangs). Some of these vehicles (Figure 3) 4
were selected as they were deemed to access the driveways on a regular basis. They also 5
correspond to the specifications for the Design Vehicles for the Hang-up Problem (9) and those 6
indicated in the NCHRP Report 659 (14). 7
8 FIGURE 3 Side views of the evaluated vehicles. 9
10
Fire-trucks and garbage-trucks were of particular interest while developing this study, not only 11
because of their physical characteristics but because of the required accessibility due to the 12
significance of their services. 13
Fire departments, as part of their emergency plan, need to evaluate routes and response times to 14
access residential areas. These plans, depending on the availability and characteristics of the 15
infrastructure, might involve the use of driveways. While most of the evaluation, when analyzing 16
routes to determine its accessibility, focuses on physical characteristics (material, resistance, 17
etc.), driveway geometry, (widths vs vehicles’ turn capabilities) and swept path; the vertical 18
geometry isn’t evaluated with the same level of detail. This could potentially have a considerable 19
impact on service times, as well as considerable cost if there is damage to infrastructure and 20
equipment. 21
Velez, Homola, Chan.
For the garbage-trucks, many homes have only alleys to keep their trash cans. These alleys (i.e. 1
driveways) are part of the recollection route for these vehicles. 2
In addition, since garbage-collection takes place during daytime hours and may overlap with the 3
peak-hour traffic, the driveway design may affect the exit speed from the main roads for these 4
vehicles with a significant impact to the traffic flow as described in the NCHRP report 151 (13). 5
Finally the other evaluated vehicles represent private LCVs (i.e. recreational vehicles, mini 6
buses, etc.) that may also need to access the driveways. 7
RESULTS & ANALYSIS 8
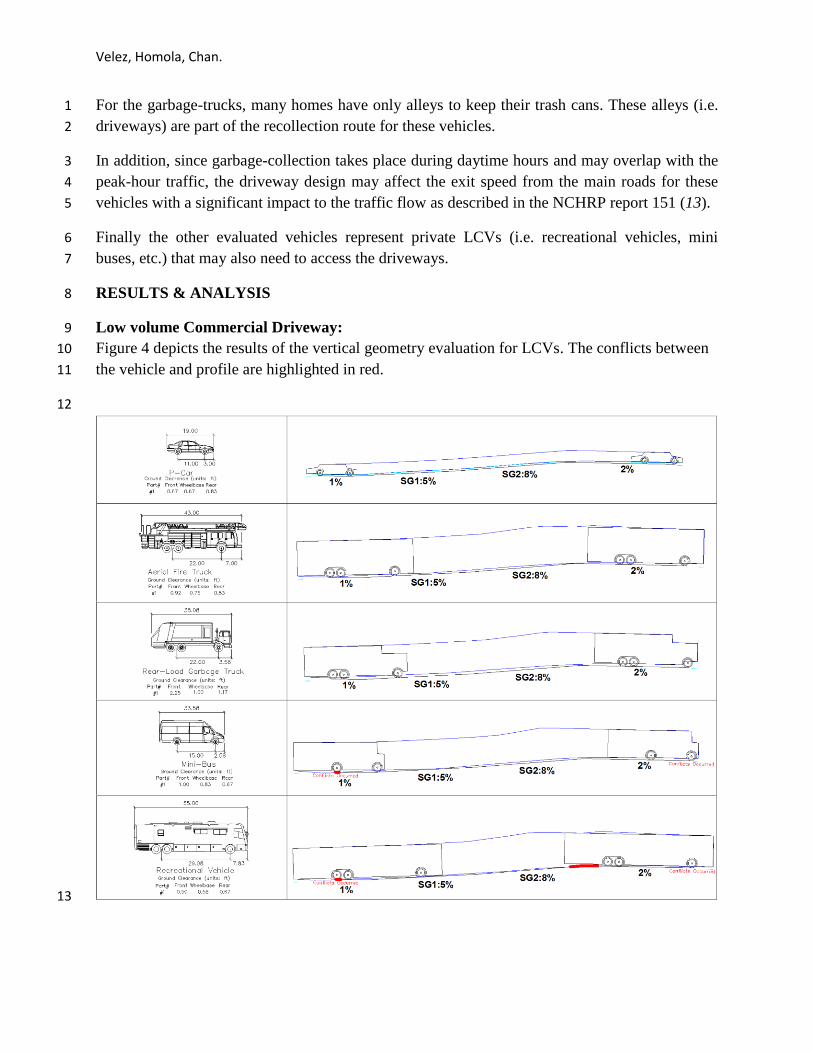
Low volume Commercial Driveway: 9
Figure 4 depicts the results of the vertical geometry evaluation for LCVs. The conflicts between 10
the vehicle and profile are highlighted in red. 11
12
13
Velez, Homola, Chan.
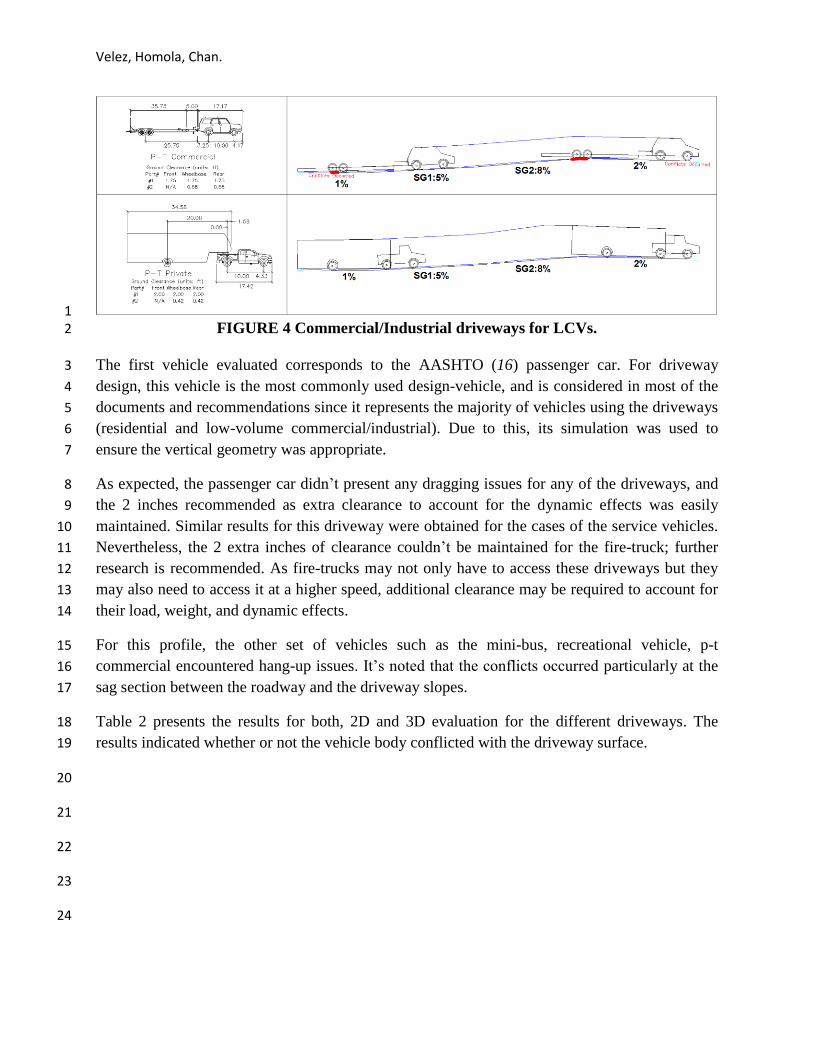
1 FIGURE 4 Commercial/Industrial driveways for LCVs. 2
The first vehicle evaluated corresponds to the AASHTO (16) passenger car. For driveway 3
design, this vehicle is the most commonly used design-vehicle, and is considered in most of the 4
documents and recommendations since it represents the majority of vehicles using the driveways 5
(residential and low-volume commercial/industrial). Due to this, its simulation was used to 6
ensure the vertical geometry was appropriate. 7
As expected, the passenger car didn’t present any dragging issues for any of the driveways, and 8
the 2 inches recommended as extra clearance to account for the dynamic effects was easily 9
maintained. Similar results for this driveway were obtained for the cases of the service vehicles. 10
Nevertheless, the 2 extra inches of clearance couldn’t be maintained for the fire-truck; further 11
research is recommended. As fire-trucks may not only have to access these driveways but they 12
may also need to access it at a higher speed, additional clearance may be required to account for 13
their load, weight, and dynamic effects. 14
For this profile, the other set of vehicles such as the mini-bus, recreational vehicle, p-t 15
commercial encountered hang-up issues. It’s noted that the conflicts occurred particularly at the 16
sag section between the roadway and the driveway slopes. 17
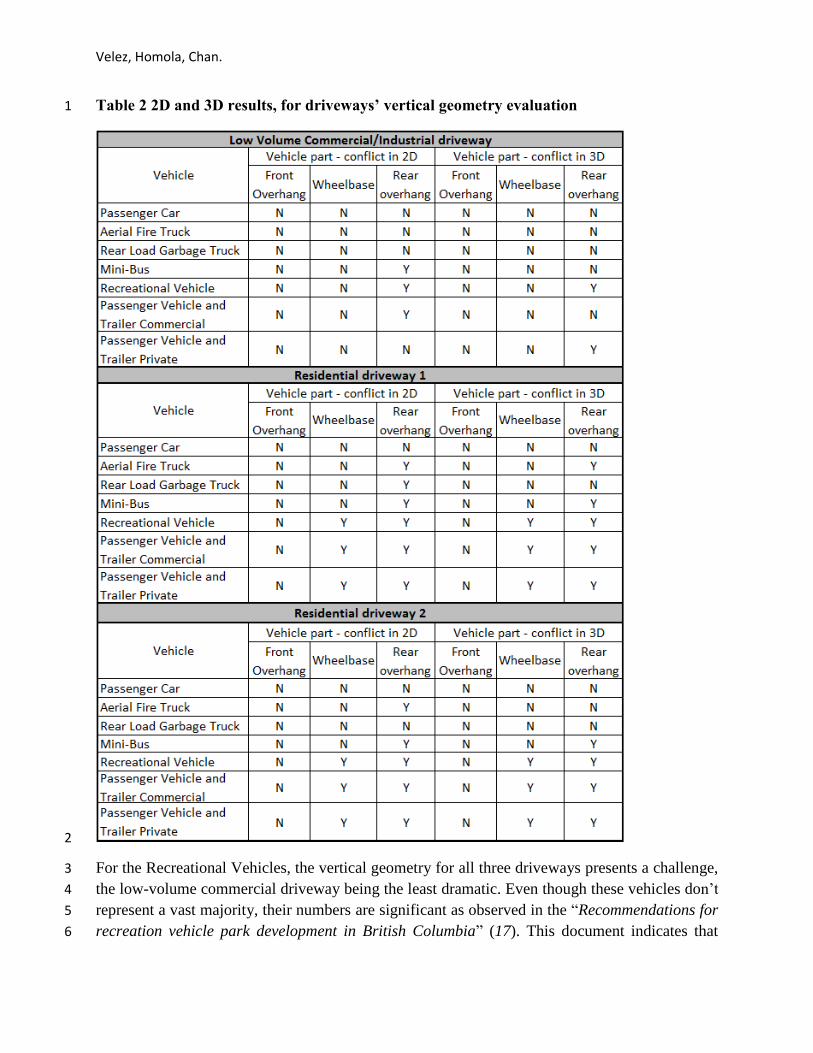
Table 2 presents the results for both, 2D and 3D evaluation for the different driveways. The 18
results indicated whether or not the vehicle body conflicted with the driveway surface. 19
20
21
22
23
24
Velez, Homola, Chan.
Table 2 2D and 3D results, for driveways’ vertical geometry evaluation 1
2
For the Recreational Vehicles, the vertical geometry for all three driveways presents a challenge, 3
the low-volume commercial driveway being the least dramatic. Even though these vehicles don’t 4
represent a vast majority, their numbers are significant as observed in the “Recommendations for 5
recreation vehicle park development in British Columbia” (17). This document indicates that 6
Velez, Homola, Chan.
around 800,000 of these vehicles were on the road in Canada in 2005 and this number is 1
expected to grow 30% by 2015 with a similar trend expected for the US. Therefore, it would be 2
reasonable to expect an increase in the demand of infrastructure, including driveways that are 3
accessible for these vehicles (e.g. to access gas stations, residential driveways, alleys, parking 4
lots.) as they can affect and be affected by the driveway geometry, and affect the traffic flow for 5
the adjacent roads. 6
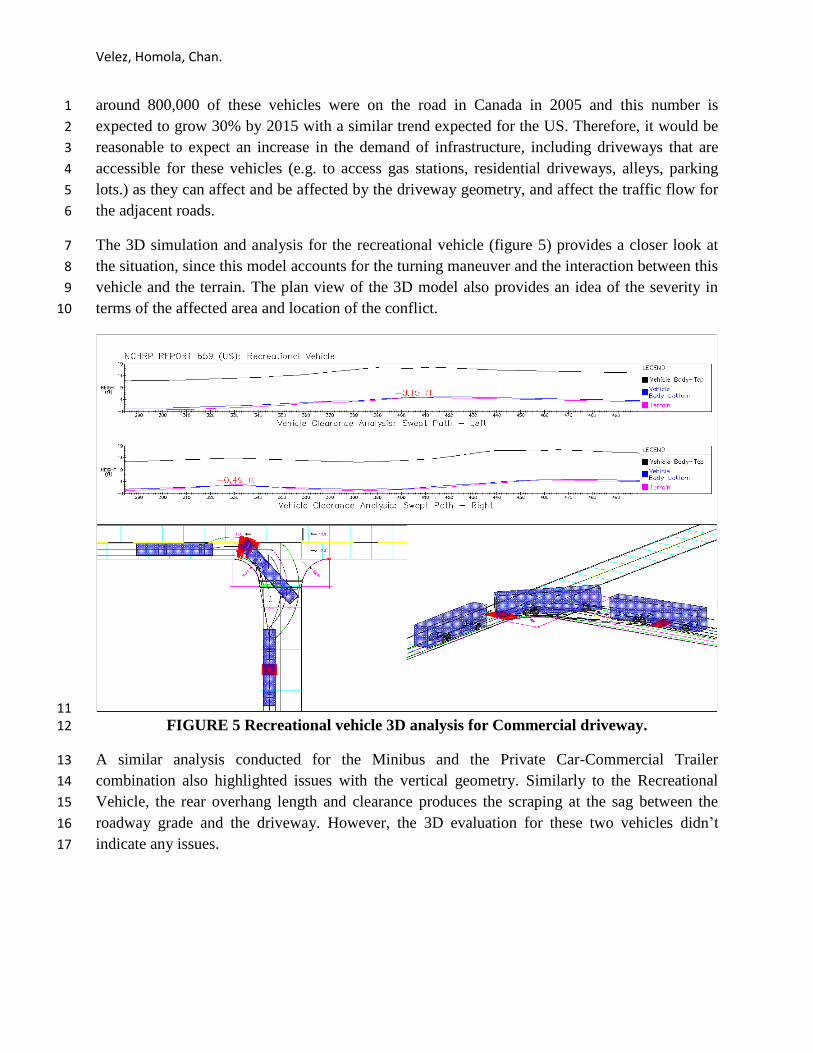
The 3D simulation and analysis for the recreational vehicle (figure 5) provides a closer look at 7
the situation, since this model accounts for the turning maneuver and the interaction between this 8
vehicle and the terrain. The plan view of the 3D model also provides an idea of the severity in 9
terms of the affected area and location of the conflict. 10
11 FIGURE 5 Recreational vehicle 3D analysis for Commercial driveway. 12
A similar analysis conducted for the Minibus and the Private Car-Commercial Trailer 13
combination also highlighted issues with the vertical geometry. Similarly to the Recreational 14
Vehicle, the rear overhang length and clearance produces the scraping at the sag between the 15
roadway grade and the driveway. However, the 3D evaluation for these two vehicles didn’t 16
indicate any issues. 17
Velez, Homola, Chan.
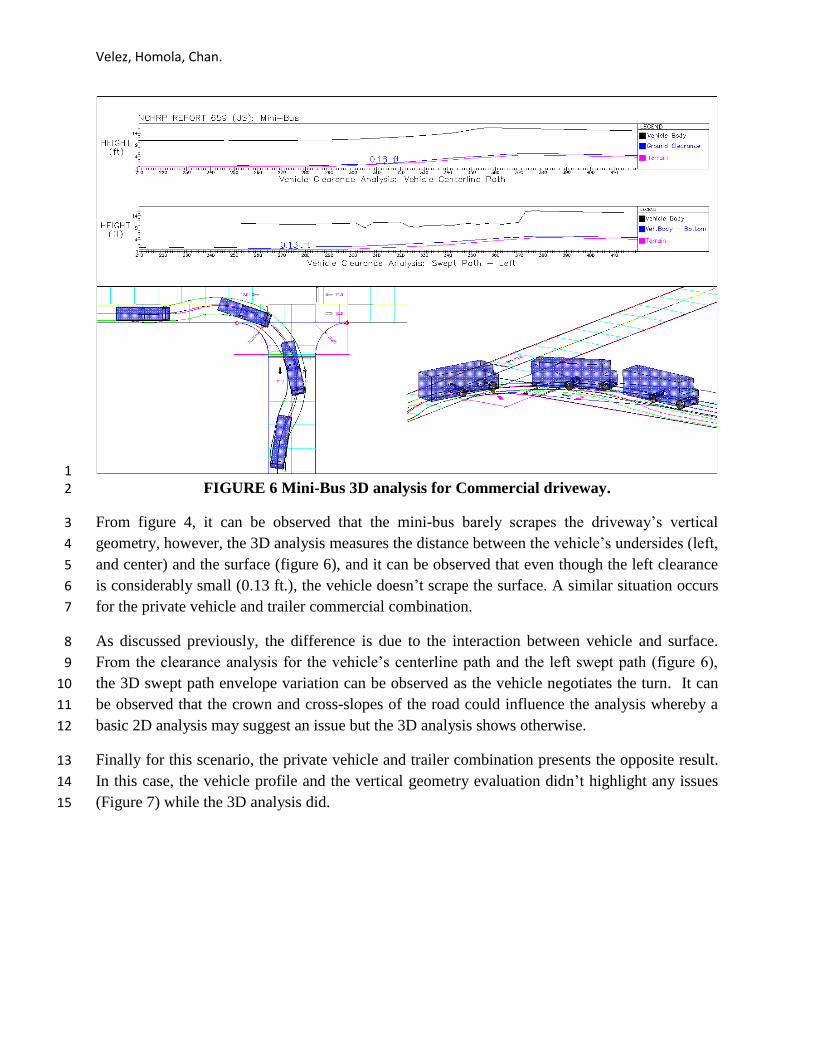
1 FIGURE 6 Mini-Bus 3D analysis for Commercial driveway. 2
From figure 4, it can be observed that the mini-bus barely scrapes the driveway’s vertical 3
geometry, however, the 3D analysis measures the distance between the vehicle’s undersides (left, 4
and center) and the surface (figure 6), and it can be observed that even though the left clearance 5
is considerably small (0.13 ft.), the vehicle doesn’t scrape the surface. A similar situation occurs 6
for the private vehicle and trailer commercial combination. 7
As discussed previously, the difference is due to the interaction between vehicle and surface. 8
From the clearance analysis for the vehicle’s centerline path and the left swept path (figure 6), 9
the 3D swept path envelope variation can be observed as the vehicle negotiates the turn. It can 10
be observed that the crown and cross-slopes of the road could influence the analysis whereby a 11
basic 2D analysis may suggest an issue but the 3D analysis shows otherwise. 12
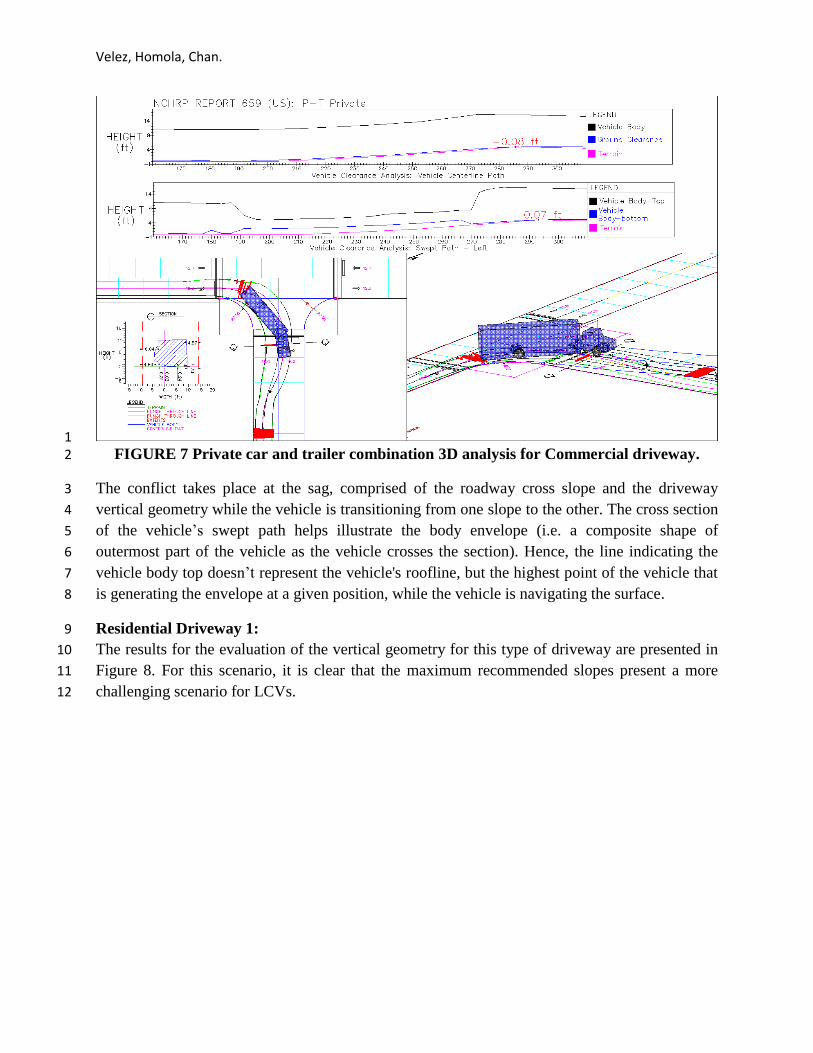
Finally for this scenario, the private vehicle and trailer combination presents the opposite result. 13
In this case, the vehicle profile and the vertical geometry evaluation didn’t highlight any issues 14
(Figure 7) while the 3D analysis did. 15
Velez, Homola, Chan.
1 FIGURE 7 Private car and trailer combination 3D analysis for Commercial driveway. 2
The conflict takes place at the sag, comprised of the roadway cross slope and the driveway 3
vertical geometry while the vehicle is transitioning from one slope to the other. The cross section 4
of the vehicle’s swept path helps illustrate the body envelope (i.e. a composite shape of 5
outermost part of the vehicle as the vehicle crosses the section). Hence, the line indicating the 6
vehicle body top doesn’t represent the vehicle's roofline, but the highest point of the vehicle that 7
is generating the envelope at a given position, while the vehicle is navigating the surface. 8
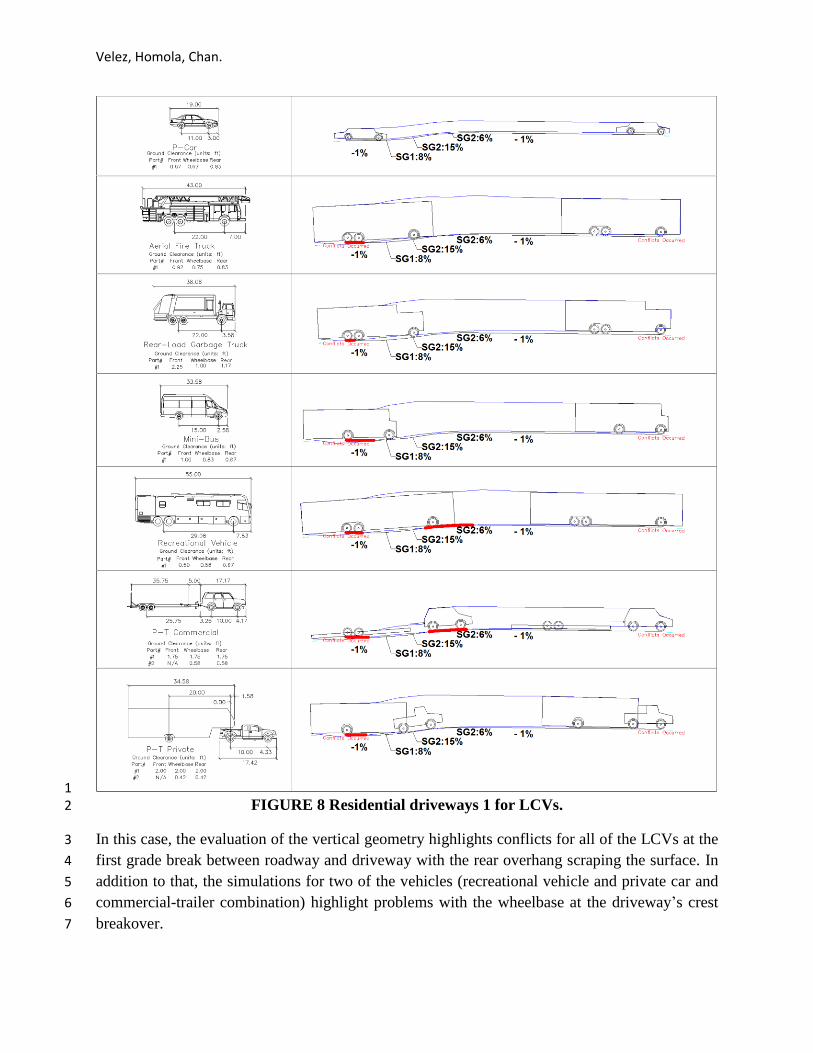
Residential Driveway 1: 9
The results for the evaluation of the vertical geometry for this type of driveway are presented in 10
Figure 8. For this scenario, it is clear that the maximum recommended slopes present a more 11
challenging scenario for LCVs. 12
Velez, Homola, Chan.
1 FIGURE 8 Residential driveways 1 for LCVs. 2
In this case, the evaluation of the vertical geometry highlights conflicts for all of the LCVs at the 3
first grade break between roadway and driveway with the rear overhang scraping the surface. In 4
addition to that, the simulations for two of the vehicles (recreational vehicle and private car and 5
commercial-trailer combination) highlight problems with the wheelbase at the driveway’s crest 6
breakover. 7
Velez, Homola, Chan.
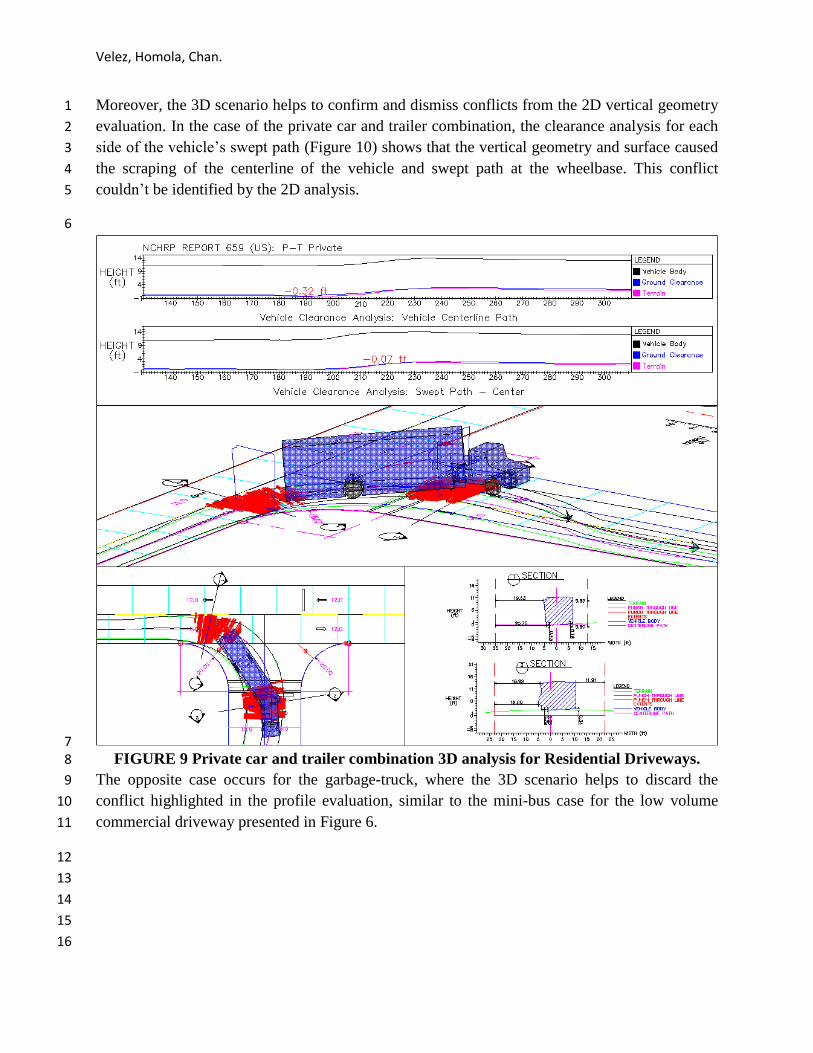
Moreover, the 3D scenario helps to confirm and dismiss conflicts from the 2D vertical geometry 1
evaluation. In the case of the private car and trailer combination, the clearance analysis for each 2
side of the vehicle’s swept path (Figure 10) shows that the vertical geometry and surface caused 3
the scraping of the centerline of the vehicle and swept path at the wheelbase. This conflict 4
couldn’t be identified by the 2D analysis. 5
6
7 FIGURE 9 Private car and trailer combination 3D analysis for Residential Driveways. 8
The opposite case occurs for the garbage-truck, where the 3D scenario helps to discard the 9
conflict highlighted in the profile evaluation, similar to the mini-bus case for the low volume 10
commercial driveway presented in Figure 6. 11
12
13
14
15
16
Velez, Homola, Chan.
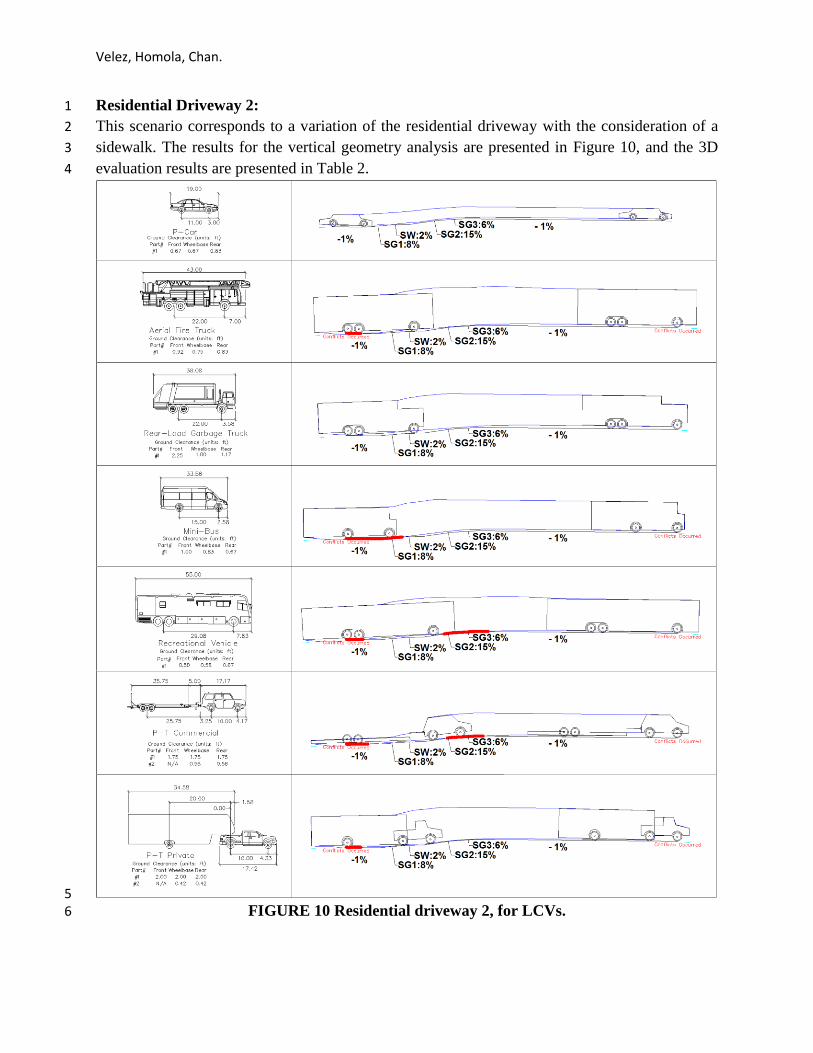
Residential Driveway 2: 1
This scenario corresponds to a variation of the residential driveway with the consideration of a 2
sidewalk. The results for the vertical geometry analysis are presented in Figure 10, and the 3D 3
evaluation results are presented in Table 2. 4
5 FIGURE 10 Residential driveway 2, for LCVs. 6
Velez, Homola, Chan.
From the 2D analysis (Figure 10), the sidewalk seems to have a positive effect for the 1
accessibility of the service vehicles, however for the mini-bus, the scraping increases for the rear 2
overhang. The grade lengths of 10 feet make the break changes more challenging for this vehicle 3
due to the vehicle’s wheelbase and rear overhang. 4
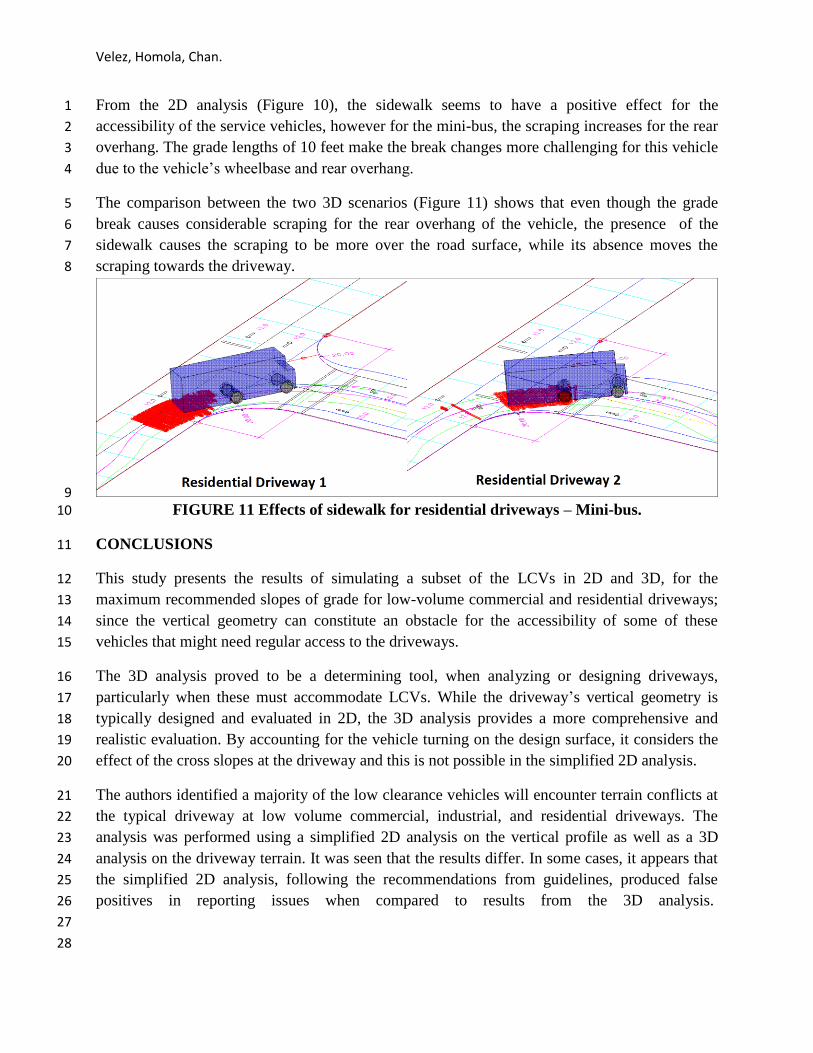
The comparison between the two 3D scenarios (Figure 11) shows that even though the grade 5
break causes considerable scraping for the rear overhang of the vehicle, the presence of the 6
sidewalk causes the scraping to be more over the road surface, while its absence moves the 7
scraping towards the driveway. 8
9 FIGURE 11 Effects of sidewalk for residential driveways – Mini-bus. 10
CONCLUSIONS 11
This study presents the results of simulating a subset of the LCVs in 2D and 3D, for the 12
maximum recommended slopes of grade for low-volume commercial and residential driveways; 13
since the vertical geometry can constitute an obstacle for the accessibility of some of these 14
vehicles that might need regular access to the driveways. 15
The 3D analysis proved to be a determining tool, when analyzing or designing driveways, 16
particularly when these must accommodate LCVs. While the driveway’s vertical geometry is 17
typically designed and evaluated in 2D, the 3D analysis provides a more comprehensive and 18
realistic evaluation. By accounting for the vehicle turning on the design surface, it considers the 19
effect of the cross slopes at the driveway and this is not possible in the simplified 2D analysis. 20
The authors identified a majority of the low clearance vehicles will encounter terrain conflicts at 21
the typical driveway at low volume commercial, industrial, and residential driveways. The 22
analysis was performed using a simplified 2D analysis on the vertical profile as well as a 3D 23
analysis on the driveway terrain. It was seen that the results differ. In some cases, it appears that 24
the simplified 2D analysis, following the recommendations from guidelines, produced false 25
positives in reporting issues when compared to results from the 3D analysis. 26
27
28
Velez, Homola, Chan.
The primary reason for the difference is that a 2D analysis over-simplifies the vehicle body’s 1
orientation on the terrain when all wheels are at different elevations. The cross-slopes and grades 2
along the alignment longitudinally forces the vehicle tires to be on different elevations, as a 3
result, the vehicle body’s tilt would be oriented according to the 3D terrain. 4
5
The authors recommend the following (1) a supplement section or update on the design vehicle 6
section in the AASHTO ‘Greenbook’ to capture typical low clearance vehicles (2) a further study 7
on identifying more forgiving driveway configurations when LCV are the design vehicles (3) 8
perform 3D analysis when the cross slopes and vertical grades may cause the vehicle body to tilt 9
and scrape the ground. 10
REFERENCES 11
1. J.L. Gattis, J.S. Gluck, J.M. Barlow, R.W. Eck, W.F. Hecker, H.S. Levinson, Driveway 12
Design Issues in the United States. March 2010. 13
2. Designing for truck movements and other large vehicles in Portland. October 2008. 14
3. Waste Handling Guidelines, City of Fremont, Environmental Services Division. January 15
2013. 16
4. Fire Department Access Standard, The City of Calgary fire department. October 2008. 17
5. W.A. McConnel, Passenger Car Overhang and Underclearance as related to Driveway 18
Profile Design, Part I-Vehicle Data – Washington D.C. 1958. 19
6. Bauer LA, “Passenger Car Overhang and Underclearance as related to Driveway Profile 20
Design. Part II-Street and Highway Design Washington D.C. 1958. 21
7. John O. Sobajo, Design Guidelines for Highway Railroad Grade Crossing Profiles in 22
Florida, Final Report – Florida State University. 23
8. R.W Eck and S.K. Kang, Low-C1earance Vehicles at Rail-Highway Grade Crossings: An 24
Overview of the Problem and Potential Solutions. Washington D.C., 1991. 25
9. L. James French and R.W Eck, Development of Design Vehicles and Characteristics for 26
the Hangup Problem; West Virginia Department of Transportation; May 2002. 27
10. Amy L. Clawson, Establishing Design Vehicles for the Hang-Up Problem; West Virginia 28
Department of Civil Engineering. Master Thesis 2002. 29
11. Marc D. Williams, Daniel B. Fambro and Vergil G. Stover, The recommended design 30
guidelines for the vertical alignment of driveways. Texas Department of Transportation 31
TTI 990-2, 1991. 32
12. Herbert S. Levinson and Jerome S. Gluck, The Driveway Design Practices, Issues and 33
Needs. 3rd
Urban Street Symposium. June 2007. 34
13. National Cooperative Highway Research Program (NCHRP) Web-Only Document 151, 35
Geometric Design of Driveways. Transportation Research Board, July 2009. 36
14. National Cooperative Highway Research Program (NCHRP) Report 659, Guide for the 37
Geometric Design of Driveways. Transportation Research Board, 2010. 38
Velez, Homola, Chan.
15. ITE. Guidelines for Driveway Location and Design, Institute of Transportation 1
Engineers, Washington, DC (1987). 2
16. A Policy on Geometric Design of Highways and Streets American Association of State 3
Highway and Transportation Officials. 2011. 4
17. Honourable Stanley B. Hagen. Recommendations for recreation vehicle park 5
development in British Columbia. February 2008. 6
18. AutoTURN 9, Transoft Solutions Inc. 7
19. NEXUS Intersections 2.0, Transoft Solutions Inc. 8
20. AutoTURN PRO 3D 9.0, Transoft Solutions Inc. 9
21. Autodesk, AutoCAD 2013. 10
Related Documents